Ventricular Depolarization in Ischemic Heart Disease.Value ...
Libby: Braunwald's Heart Disease: A Textbook of Cardiovascular Medicine, 8th ed.Copyright © 2007 Saunders, An Imprint of Elsevier
THE ABNORMAL ELECTROCARDIOGRAM
Atrial Abnormalities
Various pathological and pathophysiological events alter the normal sequence of atrial activation and produce abnormal P wave patterns in the ECG. Three general categories of P wave changes are described here, reflecting abnormal sites or patterns of activation, left atrial abnormalities, and right atrial abnormalities.
Abnormal Atrial Activation and Conduction
Shifts in the site of initial activation within or away from the SA node to other ectopic sites can lead to major changes in the pattern of atrial activation and, hence, in the morphology of P waves. These shifts can occur either as escape rhythms if the normal SA nodal pacemaker fails or as accelerated ectopic rhythms if the automaticity of an ectopic site is enhanced Chap. 35 . The resulting electrocardiographic abnormalities most commonly include negative P waves in the leads in which P waves are normally upright (leads I, II, aVF, and V4 through V6), with or without shortening of the PR interval.
P wave patterns can suggest the site of impulse formation based on simple vectorial principles. For example, a negative P wave in lead I suggests that the origin of activation is in the left atrium. Inverted P waves in the inferior leads normally correspond to a posterior atrial site. However, these correlations with location of origin are highly variable. Because of this, these patterns can, as a group, be referred to as ectopic atrial rhythms.
Conduction delays within the atria alter both the duration and pattern of P waves.[31] When conduction from the right to the left atrium within the Bachmann bundle is delayed, P wave duration is prolonged beyond 120 milliseconds and P waves appear to have two humps in lead II (P mitrale). With more advanced block, the sinus impulses reach the left atrium only after passing inferiorly near the AV junction and then superiorly through the left atrium. In this case, P waves are wide and biphasic in the inferior leads, with an initial positive wave reflecting inferior movement in the right atrium followed by a negative wave produced by superior movement within the left atrium. These conditions have been associated with atrial arrhythmias, including atrial fibrillation.
Left Atrial Abnormality
Anatomical or functional abnormalities of the left atrium alter the morphology, duration, and amplitude of the P waves in the clinical ECG. Specific abnormalities include increases in the amplitude and duration of the P wave in the limb leads, as well as an increase in the amplitude of the terminal negative portion of the P wave in lead V1.
DIAGNOSTIC CRITERIA.
Commonly used criteria for diagnosing left atrial abnormality are listed in Table 12-3 . These features are illustrated in Figure 12-17 .
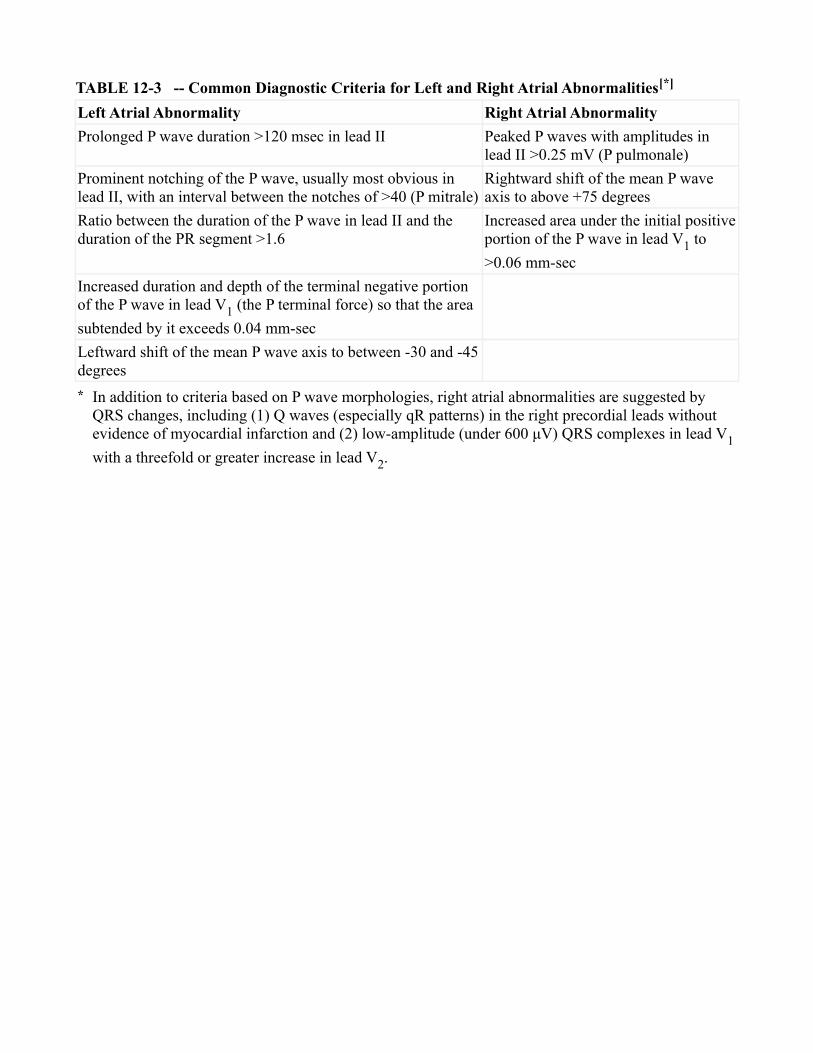
TABLE 12-3 -- Common Diagnostic Criteria for Left and Right Atrial Abnormalities[*]
Left Atrial Abnormality Right Atrial Abnormality
Prolonged P wave duration >120 msec in lead II Peaked P waves with amplitudes in lead II >0.25 mV (P pulmonale)
Prominent notching of the P wave, usually most obvious in lead II, with an interval between the notches of >40 (P mitrale)
Rightward shift of the mean P wave axis to above +75 degrees
Ratio between the duration of the P wave in lead II and the duration of the PR segment >1.6
Increased area under the initial positive portion of the P wave in lead V1 to
>0.06 mm-sec
Increased duration and depth of the terminal negative portion of the P wave in lead V1 (the P terminal force) so that the area
subtended by it exceeds 0.04 mm-sec
Leftward shift of the mean P wave axis to between -30 and -45 degrees
* In addition to criteria based on P wave morphologies, right atrial abnormalities are suggested by QRS changes, including (1) Q waves (especially qR patterns) in the right precordial leads without evidence of myocardial infarction and (2) low-amplitude (under 600 μV) QRS complexes in lead V1
with a threefold or greater increase in lead V2.
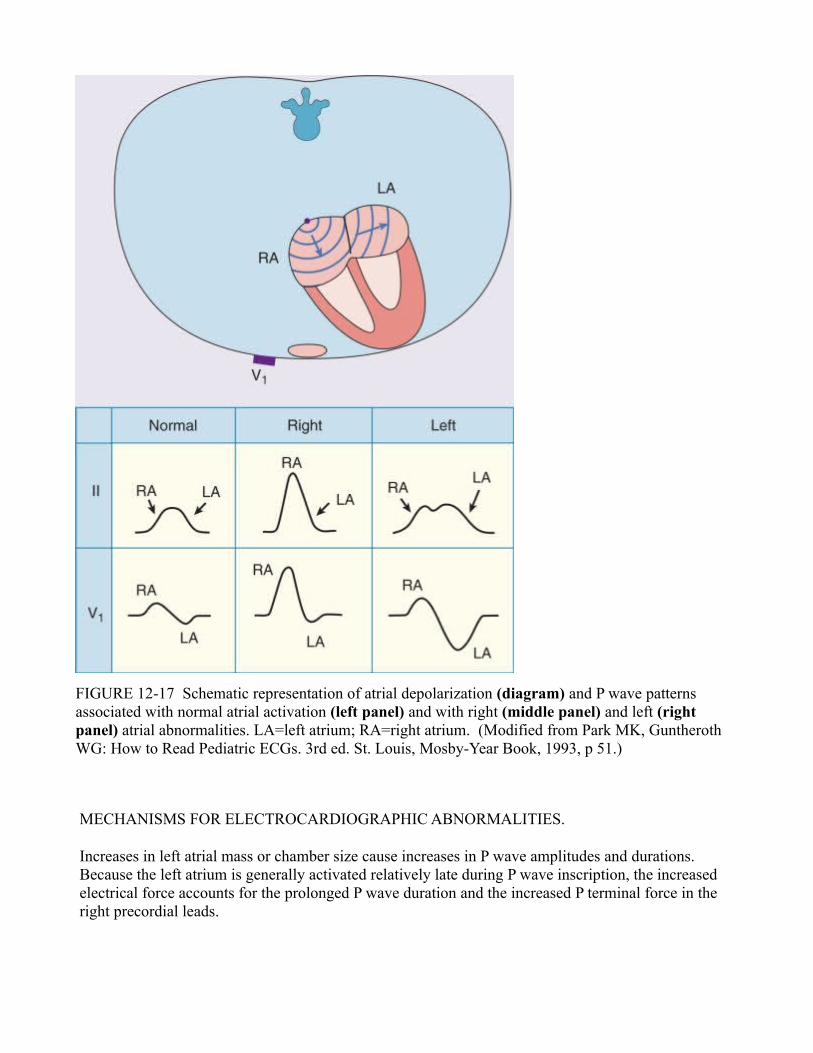
FIGURE 12-17 Schematic representation of atrial depolarization (diagram) and P wave patterns associated with normal atrial activation (left panel) and with right (middle panel) and left (right panel) atrial abnormalities. LA=left atrium; RA=right atrium. (Modified from Park MK, Guntheroth WG: How to Read Pediatric ECGs. 3rd ed. St. Louis, Mosby-Year Book, 1993, p 51.)
MECHANISMS FOR ELECTROCARDIOGRAPHIC ABNORMALITIES.
Increases in left atrial mass or chamber size cause increases in P wave amplitudes and durations. Because the left atrium is generally activated relatively late during P wave inscription, the increased electrical force accounts for the prolonged P wave duration and the increased P terminal force in the right precordial leads.
DIAGNOSTIC ACCURACY.
Comparison of the various electrocardiographic abnormalities with echocardiographic criteria for left atrial enlargement demonstrates the limited sensitivity but high specificity for standard electrocardiographic criteria. For example, the presence of classic wide and notched P waves patterns has a sensitivity of only 20 percent but a specificity of over 90 percent for detecting echocardiographically enlarged left atria. Other studies have reported better correlations of these abnormalities with ventricular dysfunction (e.g., with reduced ventricular compliance) than with atrial pathology. Because of the correlation of these electrocardiographic features with high atrial pressure, intraatrial conduction defects, and ventricular dysfunction, as well as increased atrial size, these abnormalities are preferably referred to as criteria for left atrial abnormality rather than left atrial enlargement.
CLINICAL SIGNIFICANCE.
The electrocardiographic findings of left atrial abnormality are associated with more severe left ventricular dysfunction in patients with ischemic heart disease and with more severe valve damage in patients with mitral or aortic valve disease. Patients with left atrial changes also have a higher than normal incidence of paroxysmal atrial tachyarrhythmias, including atrial fibrillation.
Right Atrial Abnormality
The electrocardiographic features of right atrial abnormality are illustrated in Figures 12-17 and 12-18 [17] [18]. They include abnormally high P wave amplitudes in the limb and right precordial leads. As in the case of left atrial abnormality, the term right atrial abnormality is preferred over other terms, such as right atrial enlargement.
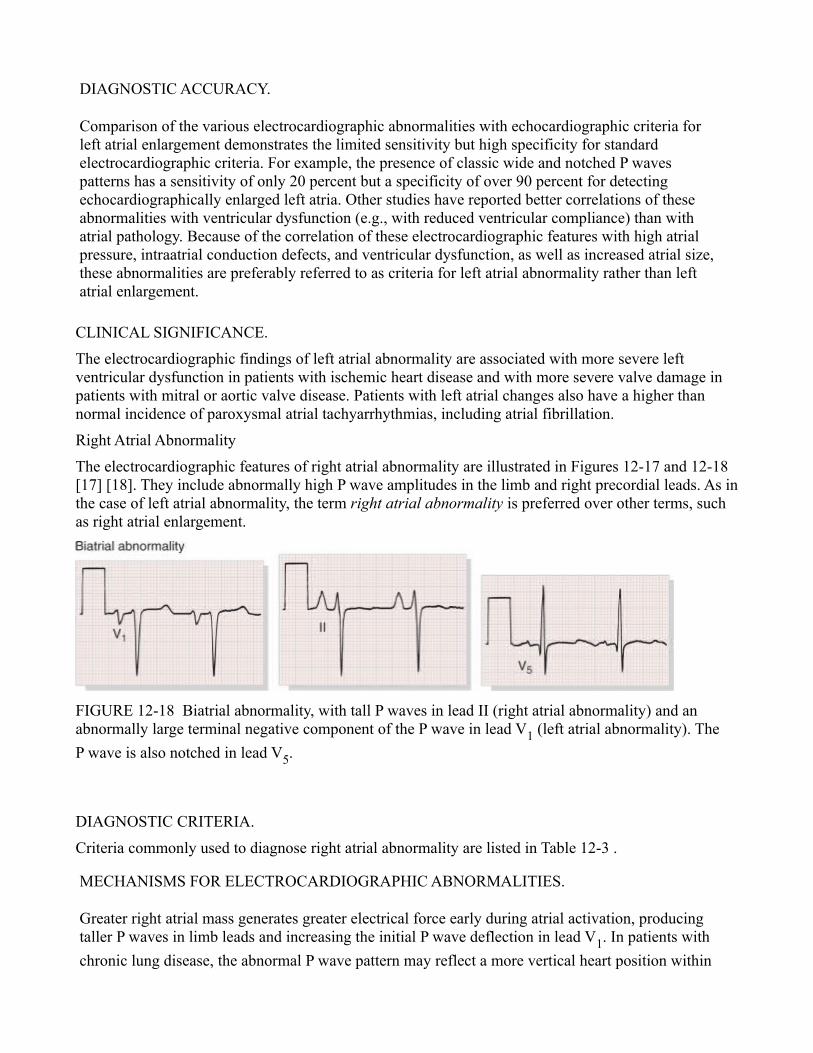
FIGURE 12-18 Biatrial abnormality, with tall P waves in lead II (right atrial abnormality) and an abnormally large terminal negative component of the P wave in lead V1 (left atrial abnormality). The
P wave is also notched in lead V5.
DIAGNOSTIC CRITERIA.
Criteria commonly used to diagnose right atrial abnormality are listed in Table 12-3 .
MECHANISMS FOR ELECTROCARDIOGRAPHIC ABNORMALITIES.
Greater right atrial mass generates greater electrical force early during atrial activation, producing taller P waves in limb leads and increasing the initial P wave deflection in lead V1. In patients with
chronic lung disease, the abnormal P wave pattern may reflect a more vertical heart position within
the chest caused by pulmonary hyperinflation rather than true cardiac damage. The QRS changes commonly associated with right atrial abnormalities correspond to the underlying pathological condition that is producing the right atrial hemodynamic changes (i.e., right ventricular hypertrophy [RVH]), which produces tall R waves in the right precordial leads, and a shift of the position of the heart within the chest by obstructive lung disease, which produces initial Q waves.
DIAGNOSTIC ACCURACY.
Echocardiographic correlations have shown that the electrocardiographic findings of right atrial abnormality have limited sensitivity but high specificity for detecting right atrial enlargement.
CLINICAL SIGNIFICANCE.
Patients with chronic obstructive pulmonary disease and this electrocardiographic pattern have more severe pulmonary dysfunction, as well as significantly reduced survival. However, comparison of electrocardiographic and hemodynamic parameters has not demonstrated a close correlation of P wave patterns and right atrial hypertension.
Other Atrial Abnormalities
Patients with abnormalities in both atria—that is, biatrial abnormality—can have electrocardiographic patterns reflecting each defect. Suggestive findings include large biphasic P waves in lead V1 and tall
and broad P waves in leads II, III, and aVF (see Fig. 12-18 ). P wave and PR segment changes can also be seen in patients with atrial infarction or pericarditis. The changes caused by these conditions are described later in this chapter.
Ventricular Hypertrophy and Enlargement
Left Ventricular Hypertrophy and Enlargement
Left ventricular hypertrophy (LVH) or enlargement produces changes in the QRS complex, the ST segment, and the T wave. The most characteristic finding is increased amplitude of the QRS complex. R waves in leads facing the left ventricle (i.e., leads I, aVL, V5, and V6) are taller than normal, whereas
S waves in leads overlying the right ventricle (i.e., V1 and V2) are deeper than normal. These changes
are illustrated in Figure 12-19 .
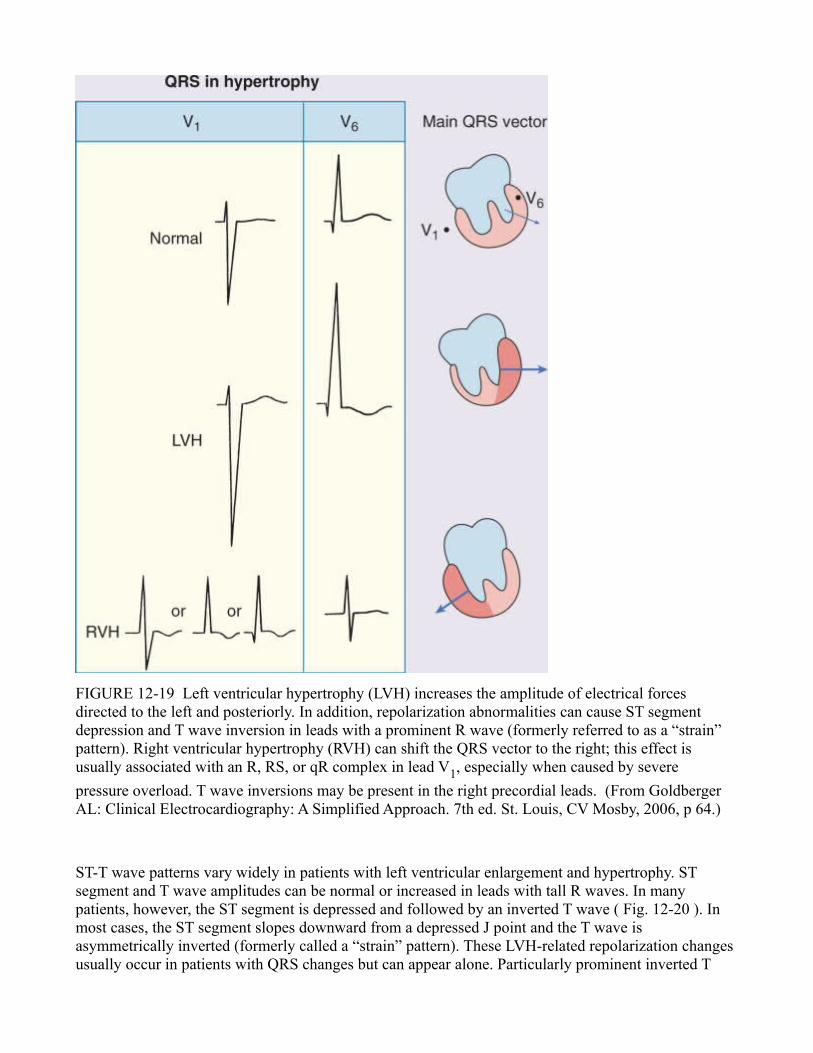
FIGURE 12-19 Left ventricular hypertrophy (LVH) increases the amplitude of electrical forces directed to the left and posteriorly. In addition, repolarization abnormalities can cause ST segment depression and T wave inversion in leads with a prominent R wave (formerly referred to as a “strain” pattern). Right ventricular hypertrophy (RVH) can shift the QRS vector to the right; this effect is usually associated with an R, RS, or qR complex in lead V1, especially when caused by severe
pressure overload. T wave inversions may be present in the right precordial leads. (From Goldberger AL: Clinical Electrocardiography: A Simplified Approach. 7th ed. St. Louis, CV Mosby, 2006, p 64.)
ST-T wave patterns vary widely in patients with left ventricular enlargement and hypertrophy. ST segment and T wave amplitudes can be normal or increased in leads with tall R waves. In many patients, however, the ST segment is depressed and followed by an inverted T wave ( Fig. 12-20 ). In most cases, the ST segment slopes downward from a depressed J point and the T wave is asymmetrically inverted (formerly called a “strain” pattern). These LVH-related repolarization changes usually occur in patients with QRS changes but can appear alone. Particularly prominent inverted T
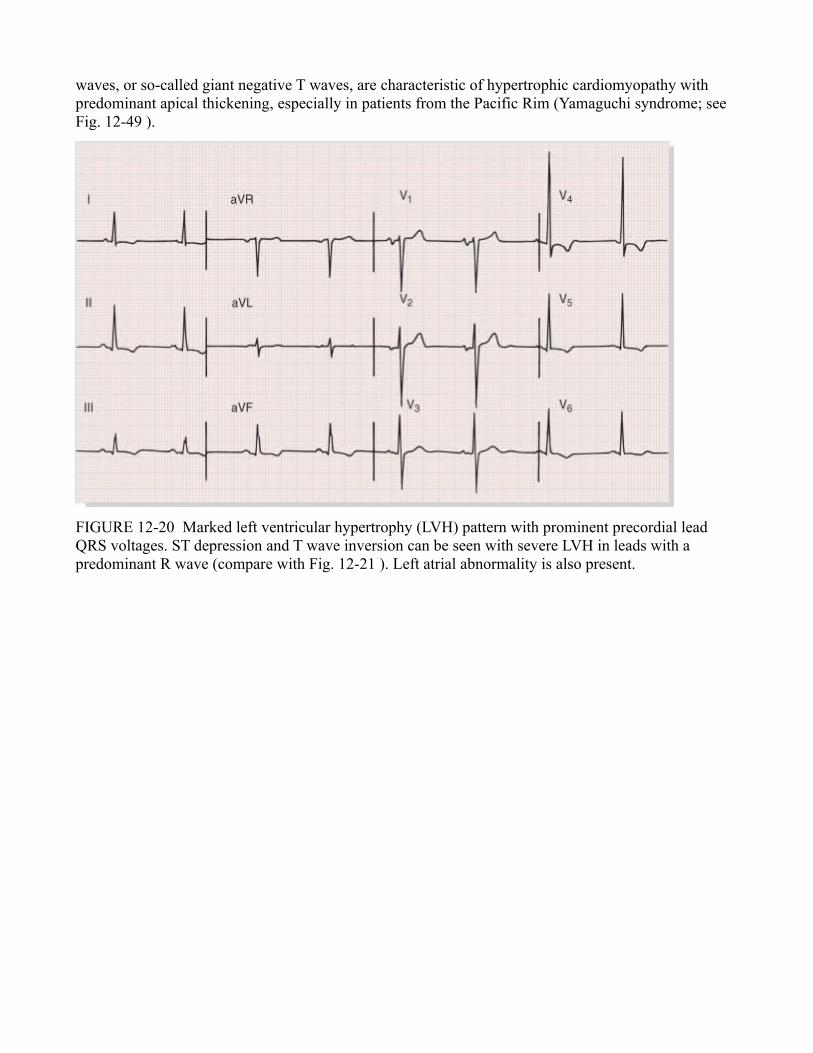
waves, or so-called giant negative T waves, are characteristic of hypertrophic cardiomyopathy with predominant apical thickening, especially in patients from the Pacific Rim (Yamaguchi syndrome; see Fig. 12-49 ).
FIGURE 12-20 Marked left ventricular hypertrophy (LVH) pattern with prominent precordial lead QRS voltages. ST depression and T wave inversion can be seen with severe LVH in leads with a predominant R wave (compare with Fig. 12-21 ). Left atrial abnormality is also present.

FIGURE 12-49 Deep T wave inversion can have various causes (see Table 12-11 ). Note the marked QT prolongation in conjunction with the cerebrovascular accident (CVA) T wave pattern caused here by subarachnoid hemorrhage. Apical hypertrophic cardiomyopathy (HCM) is another cause of deep T wave inversion that can be mistaken for coronary disease. (From Goldberger AL: Deep T wave inversions. ACC Curr J Rev 5:28, 1996.)
Other QRS changes seen in cases of LVH include widening of the QRS complex beyond 110 milliseconds, a delay in the intrinsicoid deflection, and notching of the QRS complex. Other abnormalities may include prolongation of the QT interval and evidence of left atrial abnormality.
These electrocardiographic features are most typical of LVH induced by pressure overload of the left ventricle. Volume overload can produce a somewhat different pattern, including tall upright T waves and sometimes narrow (less than 30 milliseconds) but deep (0.2 mV or greater) Q waves in leads facing the left side of the septum (see Fig. 12-20 ). The diagnostic value of these changes in predicting the underlying hemodynamics is, however, very limited.
MECHANISMS FOR ELECTROCARDIOGRAPHIC ABNORMALITIES.
Cardiac hypertrophy results in changes at the cellular, tissue, and volume conductor levels, all of which contribute to the electrocardiographic changes characteristic of left ventricular hypertrophy. These abnormalities may be compounded by changes caused by clinical conditions associated with hypertension, such as coronary artery disease and myocardial ischemia.
At the cellular level, hypertrophy is associated with a heterogeneous prolongation of action potential duration as well as an increase in action potential amplitude. These changes reflect a form of electrical remodeling cased by a downregulation of the transient outward potassium current Ito and
the inward rectifier current IK1, and reduced responsiveness to beta-adrenergic stimulation.[32]
These effects are augmented by an increase in the size of activation fronts moving across the thickened wall; these larger wave fronts subtend larger solid angles and result in higher body surface voltage. Prolonged transmural activation time required to activate the thickened wall, as well as delayed endocardial activation, contribute to the high voltage as well as QRS prolongation. Notching of the QRS complex can be produced by the fractionation of activation wave fronts by intramural scarring associated with wall thickening and damage.
In addition, changes in transmission factors can have an effect, although to a lesser degree. Left ventricular enlargement can shift the position of the heart so that the lateral free wall lies closer than normal to the chest wall, which increases body surface potentials in accordance with the inverse square law. Also, ventricular dilation increases the size of the highly conductive intraventricular blood pool that increases the potentials produced by transmural activation fronts, a phenomenon referred to as the Brody effect.
ST-T segment abnormalities may reflect a primary disorder of repolarization that accompanies the cellular processes of hypertrophy or they may reflect subendocardial ischemia. Patients with coronary artery disease have a higher prevalence of ST-T abnormalities with LVH than do those without coronary artery disease. Ischemia can be induced in the absence of coronary artery disease by the combination of high oxygen demand caused by high wall tension and limited blood flow to the subendocardium of the thickened wall.
DIAGNOSTIC CRITERIA.
Many sets of diagnostic criteria for LVH have been developed on the basis of these abnormalities ( Fig. 12-21 ). The more commonly used criteria are presented in Table 12-4 . Most methods assess the presence or absence of LVH as a binary function indicating that LVH does or does not exist based on an empirically determined set of criteria. For example, the Sokolow-Lyon and Cornell voltage criteria require that voltages in specific leads exceed certain values. The Romhilt-Estes point score system assigns point values to amplitude and other criteria; definite LVH is diagnosed if 5 points are computed and probable LVH is diagnosed if 4 points are computed. The Cornell voltage-duration method includes measurement of QRS duration as well as amplitudes.
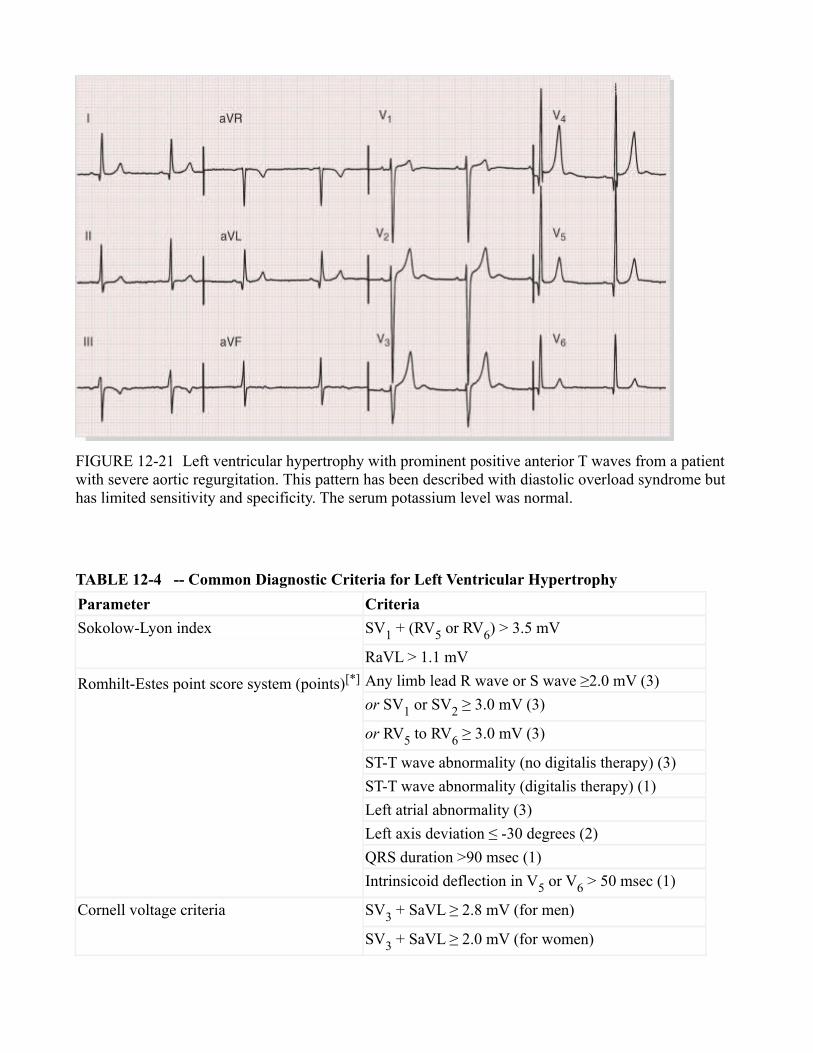
FIGURE 12-21 Left ventricular hypertrophy with prominent positive anterior T waves from a patient with severe aortic regurgitation. This pattern has been described with diastolic overload syndrome but has limited sensitivity and specificity. The serum potassium level was normal.
TABLE 12-4 -- Common Diagnostic Criteria for Left Ventricular Hypertrophy
Parameter Criteria
Sokolow-Lyon index SV1 + (RV5 or RV6) > 3.5 mV
RaVL > 1.1 mV
Romhilt-Estes point score system (points)[*] Any limb lead R wave or S wave ≥2.0 mV (3)
or SV1 or SV2 ≥ 3.0 mV (3)
or RV5 to RV6 ≥ 3.0 mV (3)
ST-T wave abnormality (no digitalis therapy) (3)
ST-T wave abnormality (digitalis therapy) (1)
Left atrial abnormality (3)
Left axis deviation ≤ -30 degrees (2)
QRS duration >90 msec (1)
Intrinsicoid deflection in V5 or V6 > 50 msec (1)
Cornell voltage criteria SV3 + SaVL ≥ 2.8 mV (for men)
SV3 + SaVL ≥ 2.0 mV (for women)
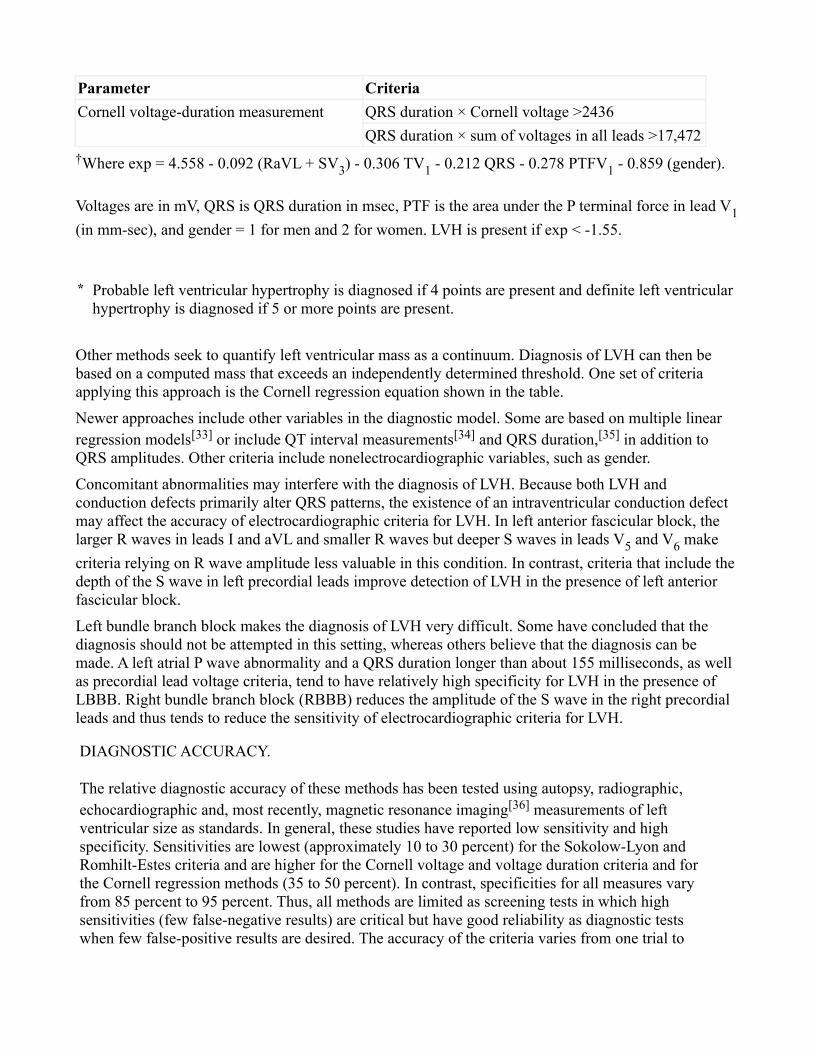
Parameter Criteria
Cornell voltage-duration measurement QRS duration × Cornell voltage >2436
QRS duration × sum of voltages in all leads >17,472†Where exp = 4.558 - 0.092 (RaVL + SV3) - 0.306 TV1 - 0.212 QRS - 0.278 PTFV1 - 0.859 (gender).
Voltages are in mV, QRS is QRS duration in msec, PTF is the area under the P terminal force in lead V1
(in mm-sec), and gender = 1 for men and 2 for women. LVH is present if exp < -1.55.
* Probable left ventricular hypertrophy is diagnosed if 4 points are present and definite left ventricular hypertrophy is diagnosed if 5 or more points are present.
Other methods seek to quantify left ventricular mass as a continuum. Diagnosis of LVH can then be based on a computed mass that exceeds an independently determined threshold. One set of criteria applying this approach is the Cornell regression equation shown in the table.
Newer approaches include other variables in the diagnostic model. Some are based on multiple linear regression models[33] or include QT interval measurements[34] and QRS duration,[35] in addition to QRS amplitudes. Other criteria include nonelectrocardiographic variables, such as gender.
Concomitant abnormalities may interfere with the diagnosis of LVH. Because both LVH and conduction defects primarily alter QRS patterns, the existence of an intraventricular conduction defect may affect the accuracy of electrocardiographic criteria for LVH. In left anterior fascicular block, the larger R waves in leads I and aVL and smaller R waves but deeper S waves in leads V5 and V6 make
criteria relying on R wave amplitude less valuable in this condition. In contrast, criteria that include the depth of the S wave in left precordial leads improve detection of LVH in the presence of left anterior fascicular block.
Left bundle branch block makes the diagnosis of LVH very difficult. Some have concluded that the diagnosis should not be attempted in this setting, whereas others believe that the diagnosis can be made. A left atrial P wave abnormality and a QRS duration longer than about 155 milliseconds, as well as precordial lead voltage criteria, tend to have relatively high specificity for LVH in the presence of LBBB. Right bundle branch block (RBBB) reduces the amplitude of the S wave in the right precordial leads and thus tends to reduce the sensitivity of electrocardiographic criteria for LVH.
DIAGNOSTIC ACCURACY.
The relative diagnostic accuracy of these methods has been tested using autopsy, radiographic, echocardiographic and, most recently, magnetic resonance imaging[36] measurements of left ventricular size as standards. In general, these studies have reported low sensitivity and high specificity. Sensitivities are lowest (approximately 10 to 30 percent) for the Sokolow-Lyon and Romhilt-Estes criteria and are higher for the Cornell voltage and voltage duration criteria and for the Cornell regression methods (35 to 50 percent). In contrast, specificities for all measures vary from 85 percent to 95 percent. Thus, all methods are limited as screening tests in which high sensitivities (few false-negative results) are critical but have good reliability as diagnostic tests when few false-positive results are desired. The accuracy of the criteria varies from one trial to
another so that no one criterion can be established as the preferred method.
Repolarization abnormalities associated with electrocardiographic findings increase the correlation with anatomical LVH. ST and T wave abnormalities are associated with a threefold greater prevalence of anatomical LVH in patients without coronary artery disease and a fivefold greater risk among patients with coronary disease.
The accuracy of the criteria also vary with the type of patient being evaluated. For example, precordial voltages are often higher in African Americans than in whites, which leads to a higher prevalence of false-positive electrocardiographic diagnoses of left ventricular hypertrophy in African Americans with hypertension. Body habitus, gender, and age also influence the accuracies of electrocardiographic criteria in complex ways that depend on the criterion being evaluated.
CLINICAL SIGNIFICANCE.
An accurate electrocardiographic diagnosis of LVH is important to detect hypertrophy in association with overt cardiovascular disease (e.g., hypertension) or as an initial manifestation of various diseases, to assess prognosis, and to monitor progression or regression of hypertrophy during treatment.
The presence of electrocardiographic criteria for LVH identifies a subset of the general population with a significantly increased risk for cardiovascular morbidity and mortality. Among patients with hypertension, the Losartan Intervention for Endpoint Reduction in Hypertension (LIFE) study has reported that declines in measures such as the Cornell and Sokolow-Lyon voltages during antihypertensive therapy correlate with a fall in left ventricular mass and with lower likelihoods of cardiovascular mortality and morbidity independent of the extent of blood pressure lowering.[37]
Patients with repolarization abnormalities have, on average, more severe degrees of LVH and more commonly have symptoms of left ventricular dysfunction, in addition to a greater risk of cardiovascular events. [38] [39] In the LIFE study referred to earlier, hypertensive patients with LVH-related ST-T wave abnormalities were 1.8 times as likely to develop congestive heart failure and 2.8 times as likely to experience heart failure-related death than were patients without such ST-T wave changes.[39]
Right Ventricular Hypertrophy and Enlargement
The right ventricle is considerably smaller than the left ventricle and produces electrical forces that are largely concealed by those generated by the larger left ventricle. Thus, for RVH to be manifested on the ECG, it must be severe enough to overcome the concealing effects of the larger left ventricular forces. In addition, increasing dominance of the right ventricle changes the ECG in fundamental ways, whereas an enlarged left ventricle produces predominantly quantitative changes in underlying normal waveforms.
The electrocardiographic changes associated with moderate to severe concentric hypertrophy of the right ventricle include abnormally tall R waves in anteriorly and rightward-directed leads (leads aVR, V1, and V2), and deep S waves and abnormally small r waves in leftward-directed leads (I, aVL, and
lateral precordial leads; Fig. 12-22 ). These changes result in a reversal of normal R wave progression in the precordial leads, a shift in the frontal plane QRS axis to the right, and the presence of S waves in leads I, II, and III (so-called S1S2S3 pattern).

FIGURE 12-22 Right ventricular hypertrophy pattern most consistent with severe pressure overload. Note the combination of findings, including (1) a tall R wave in V1 (as part of the qR complex), (2)
right axis deviation, (3) T wave inversion in V1 through V3, (4) delayed precordial transition zone (rS
in V6), and (5) right atrial abnormality. An S1Q3 pattern is also present and can occur with acute or
chronic right ventricular overload syndromes.
Less severe hypertrophy, especially when limited to the outflow tract of the right ventricle that is activated late during the QRS complex, produces less marked changes. Electrocardiographic abnormalities may be limited to an rSr′ pattern in V1 and persistence of s (or S) waves in the left
precordial leads. This pattern is typical of right ventricular volume overload as produced by an atrial septal defect.
DIAGNOSTIC CRITERIA.
These abnormalities form the basis for the diagnostic criteria for RVH. The most commonly relied on criteria for the electrocardiographic diagnosis of RVH are listed in Table 12-5 .
TABLE 12-5 -- Common Diagnostic Criteria for Right Ventricular Hypertrophy
Criterion Sensitivity (%) Specificity (%)
R in V1 ≥ 0.7 mV <10 —
QR in V1 <10 —
R/S in V1 > 1 with R > 0.5 mV <25 89
R/S in V5 or V6 < 1 <10 —
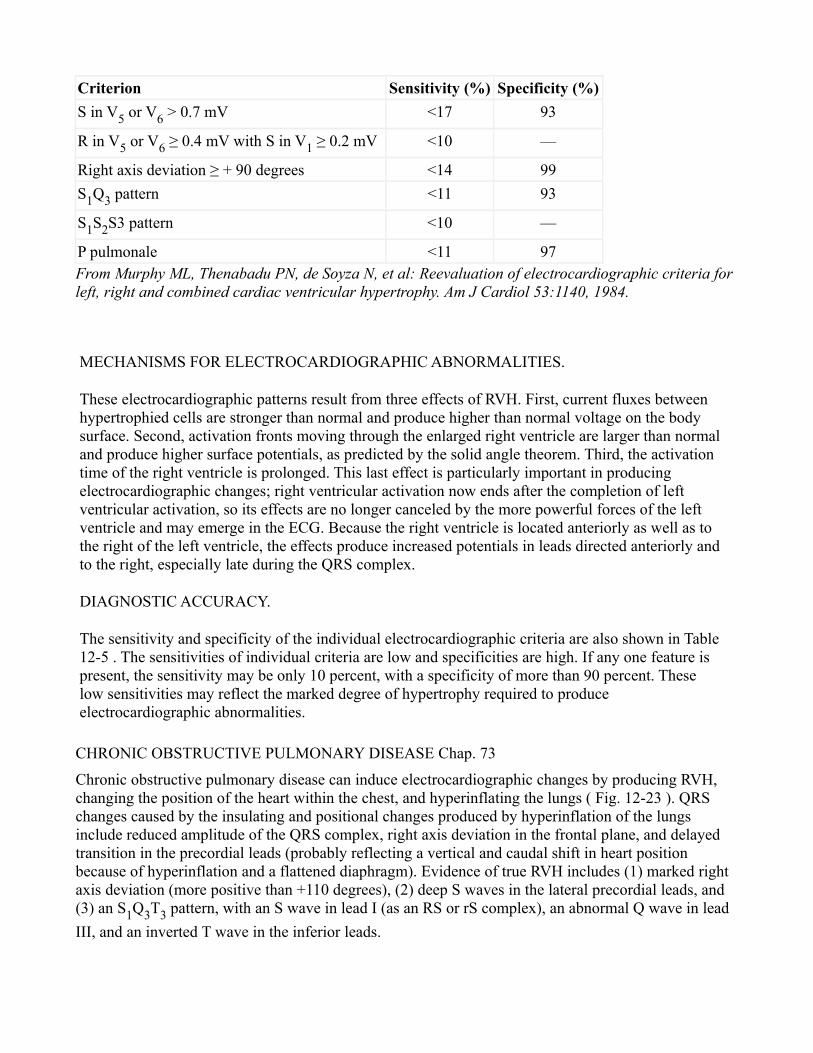
Criterion Sensitivity (%) Specificity (%)
S in V5 or V6 > 0.7 mV <17 93
R in V5 or V6 ≥ 0.4 mV with S in V1 ≥ 0.2 mV <10 —
Right axis deviation ≥ + 90 degrees <14 99
S1Q3 pattern <11 93
S1S2S3 pattern <10 —
P pulmonale <11 97From Murphy ML, Thenabadu PN, de Soyza N, et al: Reevaluation of electrocardiographic criteria for left, right and combined cardiac ventricular hypertrophy. Am J Cardiol 53:1140, 1984.
MECHANISMS FOR ELECTROCARDIOGRAPHIC ABNORMALITIES.
These electrocardiographic patterns result from three effects of RVH. First, current fluxes between hypertrophied cells are stronger than normal and produce higher than normal voltage on the body surface. Second, activation fronts moving through the enlarged right ventricle are larger than normal and produce higher surface potentials, as predicted by the solid angle theorem. Third, the activation time of the right ventricle is prolonged. This last effect is particularly important in producing electrocardiographic changes; right ventricular activation now ends after the completion of left ventricular activation, so its effects are no longer canceled by the more powerful forces of the left ventricle and may emerge in the ECG. Because the right ventricle is located anteriorly as well as to the right of the left ventricle, the effects produce increased potentials in leads directed anteriorly and to the right, especially late during the QRS complex.
DIAGNOSTIC ACCURACY.
The sensitivity and specificity of the individual electrocardiographic criteria are also shown in Table 12-5 . The sensitivities of individual criteria are low and specificities are high. If any one feature is present, the sensitivity may be only 10 percent, with a specificity of more than 90 percent. These low sensitivities may reflect the marked degree of hypertrophy required to produce electrocardiographic abnormalities.
CHRONIC OBSTRUCTIVE PULMONARY DISEASE Chap. 73
Chronic obstructive pulmonary disease can induce electrocardiographic changes by producing RVH, changing the position of the heart within the chest, and hyperinflating the lungs ( Fig. 12-23 ). QRS changes caused by the insulating and positional changes produced by hyperinflation of the lungs include reduced amplitude of the QRS complex, right axis deviation in the frontal plane, and delayed transition in the precordial leads (probably reflecting a vertical and caudal shift in heart position because of hyperinflation and a flattened diaphragm). Evidence of true RVH includes (1) marked right axis deviation (more positive than +110 degrees), (2) deep S waves in the lateral precordial leads, and (3) an S1Q3T3 pattern, with an S wave in lead I (as an RS or rS complex), an abnormal Q wave in lead
III, and an inverted T wave in the inferior leads.
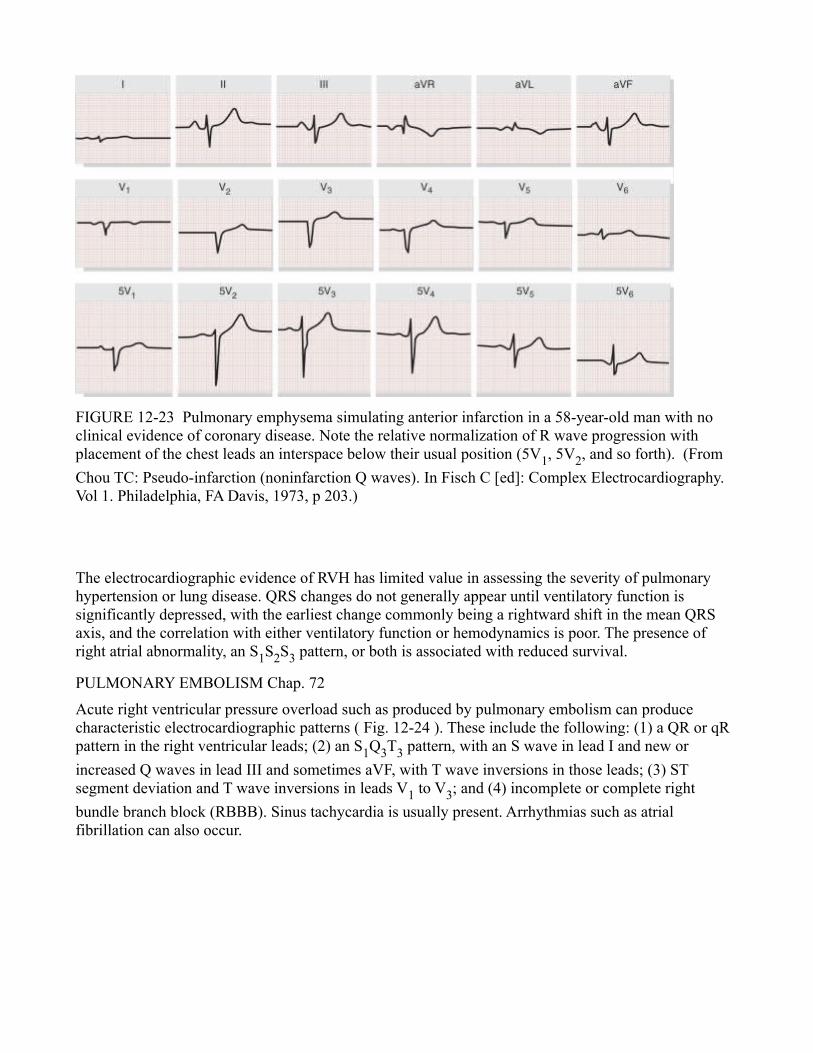
FIGURE 12-23 Pulmonary emphysema simulating anterior infarction in a 58-year-old man with no clinical evidence of coronary disease. Note the relative normalization of R wave progression with placement of the chest leads an interspace below their usual position (5V1, 5V2, and so forth). (From
Chou TC: Pseudo-infarction (noninfarction Q waves). In Fisch C [ed]: Complex Electrocardiography. Vol 1. Philadelphia, FA Davis, 1973, p 203.)
The electrocardiographic evidence of RVH has limited value in assessing the severity of pulmonary hypertension or lung disease. QRS changes do not generally appear until ventilatory function is significantly depressed, with the earliest change commonly being a rightward shift in the mean QRS axis, and the correlation with either ventilatory function or hemodynamics is poor. The presence of right atrial abnormality, an S1S2S3 pattern, or both is associated with reduced survival.
PULMONARY EMBOLISM Chap. 72
Acute right ventricular pressure overload such as produced by pulmonary embolism can produce characteristic electrocardiographic patterns ( Fig. 12-24 ). These include the following: (1) a QR or qR pattern in the right ventricular leads; (2) an S1Q3T3 pattern, with an S wave in lead I and new or
increased Q waves in lead III and sometimes aVF, with T wave inversions in those leads; (3) ST segment deviation and T wave inversions in leads V1 to V3; and (4) incomplete or complete right
bundle branch block (RBBB). Sinus tachycardia is usually present. Arrhythmias such as atrial fibrillation can also occur.
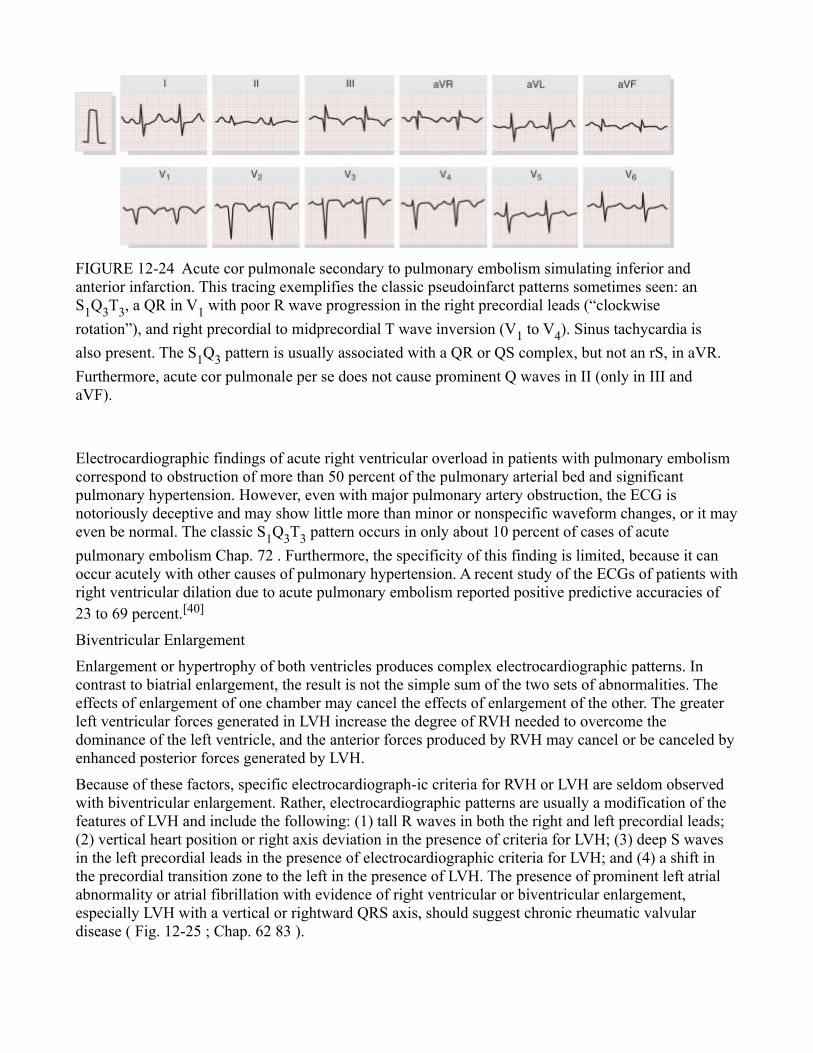
FIGURE 12-24 Acute cor pulmonale secondary to pulmonary embolism simulating inferior and anterior infarction. This tracing exemplifies the classic pseudoinfarct patterns sometimes seen: an S1Q3T3, a QR in V1 with poor R wave progression in the right precordial leads (“clockwise
rotation”), and right precordial to midprecordial T wave inversion (V1 to V4). Sinus tachycardia is
also present. The S1Q3 pattern is usually associated with a QR or QS complex, but not an rS, in aVR.
Furthermore, acute cor pulmonale per se does not cause prominent Q waves in II (only in III and aVF).
Electrocardiographic findings of acute right ventricular overload in patients with pulmonary embolism correspond to obstruction of more than 50 percent of the pulmonary arterial bed and significant pulmonary hypertension. However, even with major pulmonary artery obstruction, the ECG is notoriously deceptive and may show little more than minor or nonspecific waveform changes, or it may even be normal. The classic S1Q3T3 pattern occurs in only about 10 percent of cases of acute
pulmonary embolism Chap. 72 . Furthermore, the specificity of this finding is limited, because it can occur acutely with other causes of pulmonary hypertension. A recent study of the ECGs of patients with right ventricular dilation due to acute pulmonary embolism reported positive predictive accuracies of 23 to 69 percent.[40]
Biventricular Enlargement
Enlargement or hypertrophy of both ventricles produces complex electrocardiographic patterns. In contrast to biatrial enlargement, the result is not the simple sum of the two sets of abnormalities. The effects of enlargement of one chamber may cancel the effects of enlargement of the other. The greater left ventricular forces generated in LVH increase the degree of RVH needed to overcome the dominance of the left ventricle, and the anterior forces produced by RVH may cancel or be canceled by enhanced posterior forces generated by LVH.
Because of these factors, specific electrocardiograph-ic criteria for RVH or LVH are seldom observed with biventricular enlargement. Rather, electrocardiographic patterns are usually a modification of the features of LVH and include the following: (1) tall R waves in both the right and left precordial leads; (2) vertical heart position or right axis deviation in the presence of criteria for LVH; (3) deep S waves in the left precordial leads in the presence of electrocardiographic criteria for LVH; and (4) a shift in the precordial transition zone to the left in the presence of LVH. The presence of prominent left atrial abnormality or atrial fibrillation with evidence of right ventricular or biventricular enlargement, especially LVH with a vertical or rightward QRS axis, should suggest chronic rheumatic valvular disease ( Fig. 12-25 ; Chap. 62 83 ).
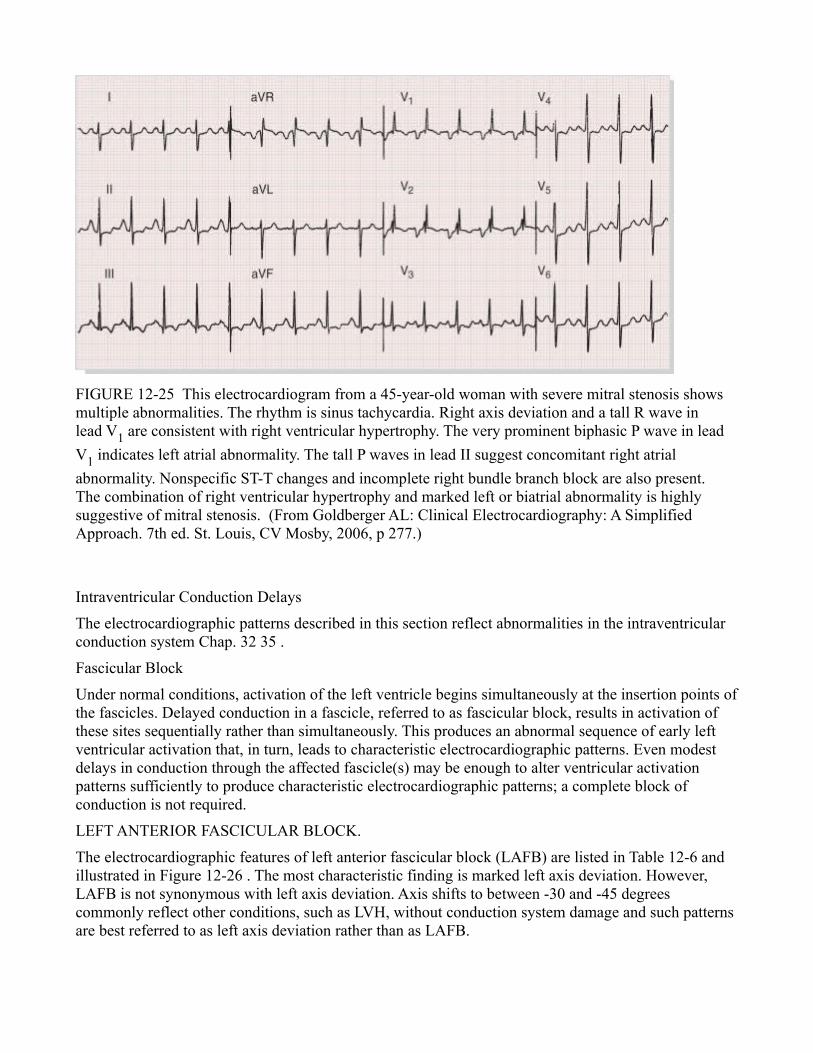
FIGURE 12-25 This electrocardiogram from a 45-year-old woman with severe mitral stenosis shows multiple abnormalities. The rhythm is sinus tachycardia. Right axis deviation and a tall R wave in lead V1 are consistent with right ventricular hypertrophy. The very prominent biphasic P wave in lead
V1 indicates left atrial abnormality. The tall P waves in lead II suggest concomitant right atrial
abnormality. Nonspecific ST-T changes and incomplete right bundle branch block are also present. The combination of right ventricular hypertrophy and marked left or biatrial abnormality is highly suggestive of mitral stenosis. (From Goldberger AL: Clinical Electrocardiography: A Simplified Approach. 7th ed. St. Louis, CV Mosby, 2006, p 277.)
Intraventricular Conduction Delays
The electrocardiographic patterns described in this section reflect abnormalities in the intraventricular conduction system Chap. 32 35 .
Fascicular Block
Under normal conditions, activation of the left ventricle begins simultaneously at the insertion points of the fascicles. Delayed conduction in a fascicle, referred to as fascicular block, results in activation of these sites sequentially rather than simultaneously. This produces an abnormal sequence of early left ventricular activation that, in turn, leads to characteristic electrocardiographic patterns. Even modest delays in conduction through the affected fascicle(s) may be enough to alter ventricular activation patterns sufficiently to produce characteristic electrocardiographic patterns; a complete block of conduction is not required.
LEFT ANTERIOR FASCICULAR BLOCK.
The electrocardiographic features of left anterior fascicular block (LAFB) are listed in Table 12-6 and illustrated in Figure 12-26 . The most characteristic finding is marked left axis deviation. However, LAFB is not synonymous with left axis deviation. Axis shifts to between -30 and -45 degrees commonly reflect other conditions, such as LVH, without conduction system damage and such patterns are best referred to as left axis deviation rather than as LAFB.
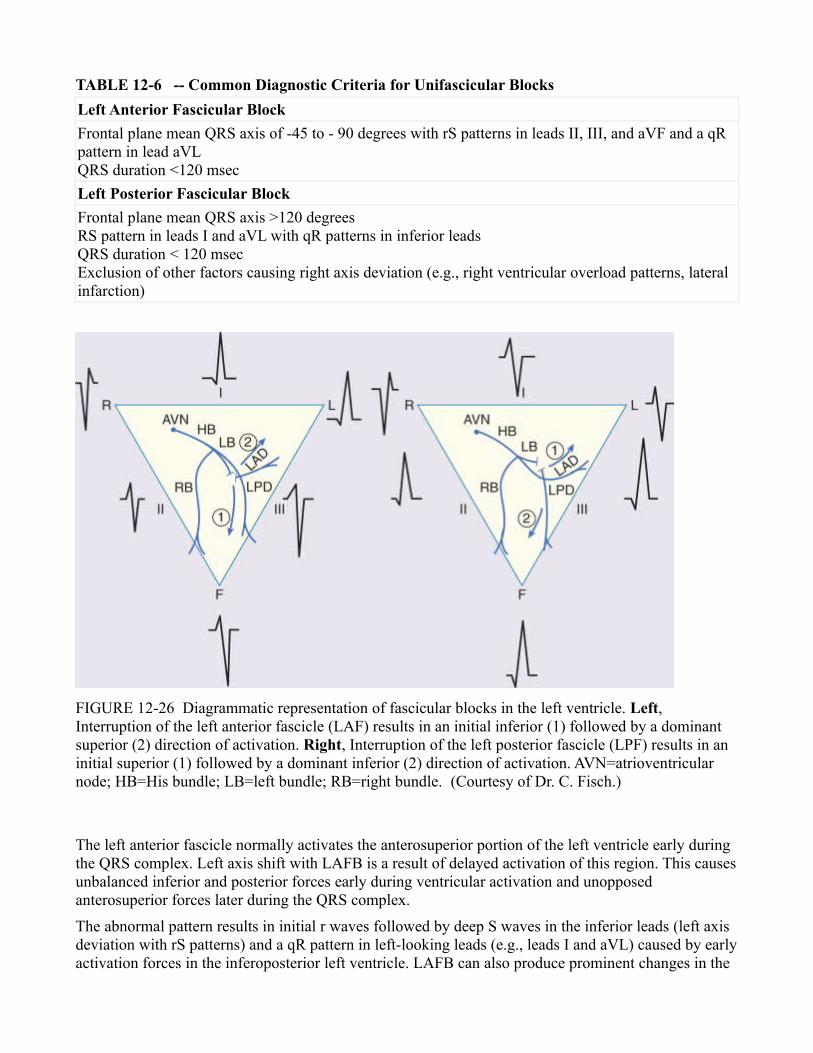
TABLE 12-6 -- Common Diagnostic Criteria for Unifascicular Blocks
Left Anterior Fascicular Block
Frontal plane mean QRS axis of -45 to - 90 degrees with rS patterns in leads II, III, and aVF and a qR pattern in lead aVLQRS duration <120 msec
Left Posterior Fascicular Block
Frontal plane mean QRS axis >120 degreesRS pattern in leads I and aVL with qR patterns in inferior leadsQRS duration < 120 msecExclusion of other factors causing right axis deviation (e.g., right ventricular overload patterns, lateral infarction)
FIGURE 12-26 Diagrammatic representation of fascicular blocks in the left ventricle. Left, Interruption of the left anterior fascicle (LAF) results in an initial inferior (1) followed by a dominant superior (2) direction of activation. Right, Interruption of the left posterior fascicle (LPF) results in an initial superior (1) followed by a dominant inferior (2) direction of activation. AVN=atrioventricular node; HB=His bundle; LB=left bundle; RB=right bundle. (Courtesy of Dr. C. Fisch.)
The left anterior fascicle normally activates the anterosuperior portion of the left ventricle early during the QRS complex. Left axis shift with LAFB is a result of delayed activation of this region. This causes unbalanced inferior and posterior forces early during ventricular activation and unopposed anterosuperior forces later during the QRS complex.
The abnormal pattern results in initial r waves followed by deep S waves in the inferior leads (left axis deviation with rS patterns) and a qR pattern in left-looking leads (e.g., leads I and aVL) caused by early activation forces in the inferoposterior left ventricle. LAFB can also produce prominent changes in the
precordial leads; V4 through V6 commonly show deep S waves (a delayed transition) produced by the
superiorly directed late QRS forces generated by late activation of the anterosuperior left ventricle. The overall QRS duration is not prolonged; fascicular block alters the sequence but not the overall duration of left ventricular activation.
Damage to the left anterior fascicle is a very common occurrence because of the delicate nature of the structure. Left anterior fascicular block is common in persons without overt cardiac disease, as well as in those with a wide range of diseases. In patients with coronary artery disease, the presence of LAFB may be associated with an increased risk of cardiac death.[41] Commonly associated conditions in-clude myocardial infarction, especially occlusion of the left anterior descending coronary artery, LVH, hypertrophic and dilated cardiomyopathy, and various cardiac degenerative diseases. The development of LAFB with rS complexes in II, III, and aVF can mask the Q waves of an inferior myocardial infarction.
LEFT POSTERIOR FASCICULAR BLOCK.
Conduction delay in the left posterior fascicle is considerably less common than delay in the anterior fascicle because of its thicker structure and more protected location near the left ventricular inflow tract. Conduction delay results in sequential activation of the anterosuperior left ventricular free wall, followed by activation of the inferoposterior aspect of the left ventricle—that is, the reverse of the pattern observed with LAFB.
The electrocardiographic features of left posterior fascicular block (LPFB; see Table 12-6 and Fig. 12-26 ), reflect this altered activation pattern. Right axis deviation with rS patterns in leads I and aVL, as well as qR complexes in the inferior leads, is the result of early unopposed activation forces from the anterosuperior aspect of the left ventricle (producing the initial q and r waves) and late unopposed forces from the inferoposterior free wall (generating the late S and R waves). As in the case of LAFB, the overall activation time of the ventricles is not prolonged and the QRS duration remains normal.
LPFB can occur in patients with almost any cardiac disease but is unusual in otherwise healthy persons in whom right axis deviation sometimes occurs as a normal variant. Other conditions that augment or appear to augment the rightward electrical forces in the frontal plane, such as right ventricular overload syndromes and extensive lateral infarction, can produce similar electrocardiographic patterns and must be excluded before a diagnosis of LPFB is made.
OTHER FORMS OF FASCICULAR BLOCK.
Electrocardiographic patterns that suggest left septal fascicular block have also been described. The most common finding attributed to this form of block is the absence of septal q waves.[16]
Left Bundle Branch Block
LBBB results from conduction delay or block in any of several sites in the intraventricular conduction system, including the main left bundle branch, each of the two fascicles, the distal conduction system of the left ventricle or, less commonly, the fibers of the bundle of His that become the main left bundle branch. The result is extensive reorganization of the activation and recovery patterns of the left ventricle that produces exten-sive changes in the QRS complex and the ST-T wave.
ELECTROCARDIOGRAPHIC ABNORMALITIES.
LBBB produces a prolonged QRS duration, abnormal QRS patterns, and ST-T wave abnormalities ( Fig. 12-27 ). Commonly accepted diagnostic criteria for LBBB are listed in Table 12-7 . Basic requirements include a prolonged QRS duration to 120 milliseconds or beyond; broad and commonly notched R waves in leads I, aVL, and the left precordial leads; narrow r waves followed by deep S
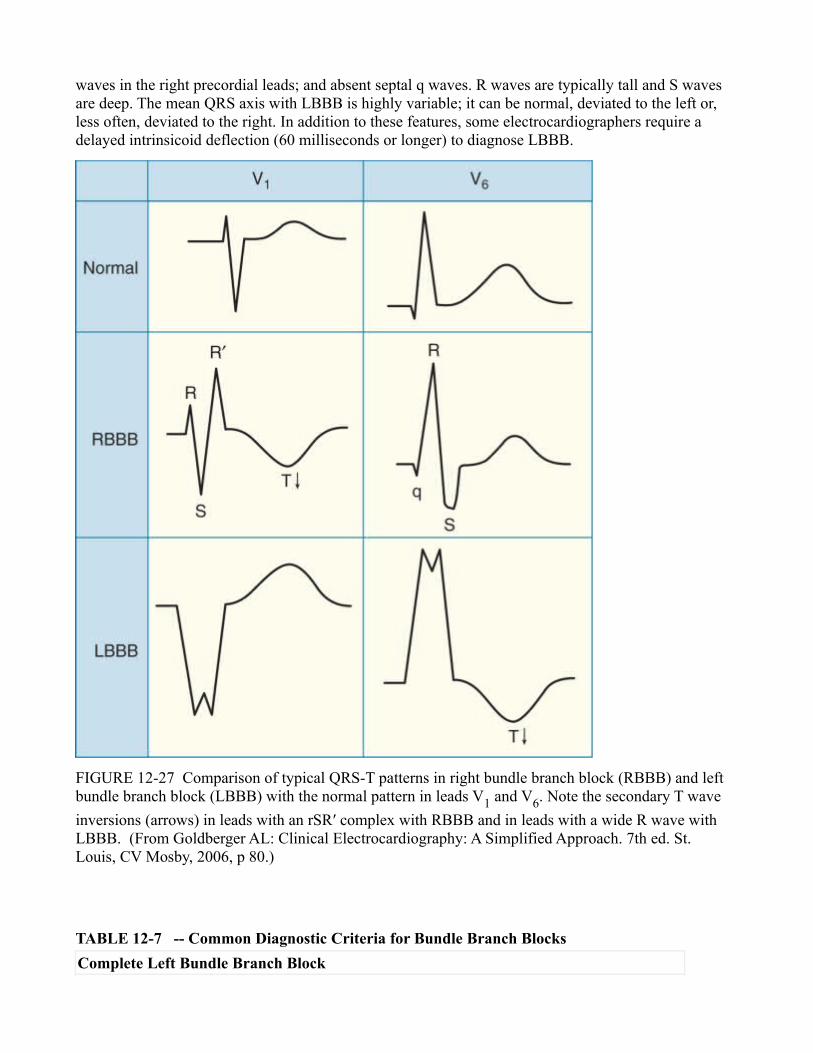
waves in the right precordial leads; and absent septal q waves. R waves are typically tall and S waves are deep. The mean QRS axis with LBBB is highly variable; it can be normal, deviated to the left or, less often, deviated to the right. In addition to these features, some electrocardiographers require a delayed intrinsicoid deflection (60 milliseconds or longer) to diagnose LBBB.
FIGURE 12-27 Comparison of typical QRS-T patterns in right bundle branch block (RBBB) and left bundle branch block (LBBB) with the normal pattern in leads V1 and V6. Note the secondary T wave
inversions (arrows) in leads with an rSR′ complex with RBBB and in leads with a wide R wave with LBBB. (From Goldberger AL: Clinical Electrocardiography: A Simplified Approach. 7th ed. St. Louis, CV Mosby, 2006, p 80.)
TABLE 12-7 -- Common Diagnostic Criteria for Bundle Branch Blocks
Complete Left Bundle Branch Block
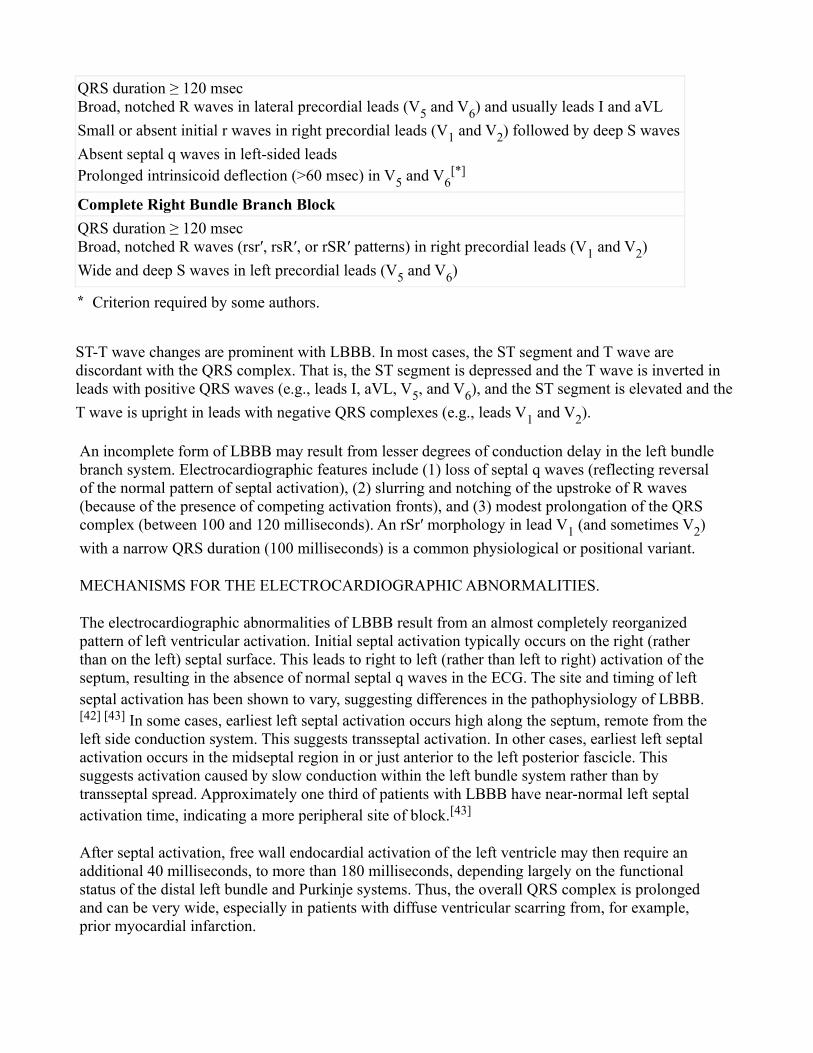
QRS duration ≥ 120 msecBroad, notched R waves in lateral precordial leads (V5 and V6) and usually leads I and aVL
Small or absent initial r waves in right precordial leads (V1 and V2) followed by deep S waves
Absent septal q waves in left-sided leadsProlonged intrinsicoid deflection (>60 msec) in V5 and V6
[*]
Complete Right Bundle Branch Block
QRS duration ≥ 120 msecBroad, notched R waves (rsr′, rsR′, or rSR′ patterns) in right precordial leads (V1 and V2)
Wide and deep S waves in left precordial leads (V5 and V6)
* Criterion required by some authors.
ST-T wave changes are prominent with LBBB. In most cases, the ST segment and T wave are discordant with the QRS complex. That is, the ST segment is depressed and the T wave is inverted in leads with positive QRS waves (e.g., leads I, aVL, V5, and V6), and the ST segment is elevated and the
T wave is upright in leads with negative QRS complexes (e.g., leads V1 and V2).
An incomplete form of LBBB may result from lesser degrees of conduction delay in the left bundle branch system. Electrocardiographic features include (1) loss of septal q waves (reflecting reversal of the normal pattern of septal activation), (2) slurring and notching of the upstroke of R waves (because of the presence of competing activation fronts), and (3) modest prolongation of the QRS complex (between 100 and 120 milliseconds). An rSr′ morphology in lead V1 (and sometimes V2)
with a narrow QRS duration (100 milliseconds) is a common physiological or positional variant.
MECHANISMS FOR THE ELECTROCARDIOGRAPHIC ABNORMALITIES.
The electrocardiographic abnormalities of LBBB result from an almost completely reorganized pattern of left ventricular activation. Initial septal activation typically occurs on the right (rather than on the left) septal surface. This leads to right to left (rather than left to right) activation of the septum, resulting in the absence of normal septal q waves in the ECG. The site and timing of left septal activation has been shown to vary, suggesting differences in the pathophysiology of LBBB. [42] [43] In some cases, earliest left septal activation occurs high along the septum, remote from the left side conduction system. This suggests transseptal activation. In other cases, earliest left septal activation occurs in the midseptal region in or just anterior to the left posterior fascicle. This suggests activation caused by slow conduction within the left bundle system rather than by transseptal spread. Approximately one third of patients with LBBB have near-normal left septal activation time, indicating a more peripheral site of block.[43]
After septal activation, free wall endocardial activation of the left ventricle may then require an additional 40 milliseconds, to more than 180 milliseconds, depending largely on the functional status of the distal left bundle and Purkinje systems. Thus, the overall QRS complex is prolonged and can be very wide, especially in patients with diffuse ventricular scarring from, for example, prior myocardial infarction.
Left ventricular free wall activation finally occurs near the end of the QRS complex.[44] Once left ventricular activation begins, it proceeds in a relatively simple and direct manner around the inferior free wall to the lateral wall and, finally, to the base of the heart.[43] This is in contrast to the multicentric overlapping patterns of activation seen under normal conditions. Spread predominantly through working muscle fibers rather than the specialized conduction system results in notching and slurring as a consequence of discontinuous anisotropy, as described earlier.
The discordant ST-T wave pattern is a result of the transventricular recovery gradients referred to earlier. With LBBB, the right ventricle is activated and recovers earlier than the left, so recovery vectors or dipoles are directed toward the right and away from the left. Hence, positive ST-T waves will be registered over the right ventricle and negatives ones over the left ventricle. These transventricular gradients play only a minor role during normal conduction because the simultaneous activation of multiple regions cancels the forces that they produce; with bundle branch block, activation is sequential and cancellation is reduced. Because the ST-T wave changes with LBBB are generated by abnormalities in conduction, they are called secondary ST-T wave abnormalities; as will be discussed later, ST-T wave changes produced by direct abnormalities of the recovery process are referred to as primary ST-T wave abnormalities.
CLINICAL SIGNIFICANCE.
LBBB usually appears in patients with underlying heart disease, although as many as 12 percent of patients with LBBB have no demonstrable heart disease.[45] Even among persons without overt heart disease, LBBB is associated with a higher than normal risk of cardiovascular and all-cause mortality.[46] It is associated with substantially higher than expected risks of high-grade atrioventricular block and cardiac death, mostly as a result of sudden death outside the hospital setting.[47] Among patients with coronary artery disease, the presence of LBBB correlates with more extensive disease, more severe left ventricular dysfunction, and reduced survival rates.
Patients with associated left or right axis deviation have more severe clinical manifestations. Left axis deviation is associated with more severe conduction system disease that includes the fascicles as well as the main left bundle, whereas right axis deviation suggests dilated cardio-myopathy with biventricular enlargement.
In addition to the hemodynamic abnormalities produced by the underlying cardiovascular conditions, the abnormal ventricular activation pattern of LBBB itself induces hemodynamic changes. These include abnormal systolic function with dysfunctional contraction patterns, reduced ejection fraction and lower stroke volumes, and abnormal diastolic function, [44] [48] which may represent a form of cardiomyopathy Chap. 34 .[49] In addition, functional abnormalities in phasic coronary blood flow[50]
often result in septal or anteroseptal defects on exercise perfusion scintigraphy in the absence of coronary artery disease.
A major impact of LBBB lies in obscuring or simulating other electrocardiographic patterns. The diagnosis of LVH is complicated by the increased QRS amplitude and axis shifts intrinsic to LBBB; in addition, the very high prevalence of anatomical LVH in combination with LBBB makes defining criteria with high specificity difficult. The diagnosis of myocardial infarction may be obscured; as will be described, the emergence of abnormal Q waves with infarction is dependent on a normal initial sequence of ventricular activation, which is absent with LBBB. In addition, electrocardiographic patterns of LBBB, including low R wave amplitude in the midprecordial leads and ST-T wave changes, can simulate anterior infarct patterns.

Right Bundle Branch Block
Right bundle branch block is a result of conduction delay in any portion of the right-sided intraventricular conduction system. The delay can occur in the main right bundle branch itself, in the bundle of His, or in the distal right ventricular conduction system. The latter is the common cause of RBBB after a right ventriculotomy is performed—for example, to correct the tetralogy of Fallot.[51]
ELECTROCARDIOGRAPHIC ABNORMALITIES.
Major features of RBBB are illustrated in Figure 12-27 and commonly used diagnostic criteria are listed in Table 12-7 . As with LBBB, the QRS complex duration exceeds 120 milliseconds. The right precordial leads show prominent and notched R waves with rsr′, rsR′, or rSR′ patterns, whereas leads I, aVL, and the left precordial leads demonstrate wide S waves that are longer in duration than the preceding R wave. The ST-T waves are, as in LBBB, discordant with the QRS complex, so that T waves are inverted in the right precordial leads (and other leads with a terminal R′ wave) and upright in the left precordial leads and in leads I and aVL.
The mean QRS axis is not altered by RBBB. Axis shifts can occur, however, as a result of the simultaneous occurrence of fascicular block along with RBBB, as described later. This combination of RBBB with either LAFB (producing left axis deviation) or LPFB (producing right axis deviation) is termed bifascicular block.
Features indicative of incomplete RBBB, produced by lesser delays in conduction in the right bundle branch system, are commonly seen. This finding is most frequently characterized by an rSr′ pattern in lead V1, with a QRS duration between 100 and 120 milliseconds. Although these electrocardiographic
changes of incomplete RBBB are commonly attributed to conduction defects, they can reflect RVH (especially with a rightward QRS axis) without intrinsic dysfunction of the conduction system.
MECHANISM FOR ELECTROCARDIOGRAPHIC ABNORMALITIES.
With delay or block in the proximal right bundle branch system, activation of the right side of the septum is initiated only after slow transseptal spread of activation from the left septal surface.[50]
The right ventricular anterior free wall is then excited slowly, followed by activation of the lateral right ventricular wall and, finally, the right ventricular outflow tract.
The result is delayed and slow activation of the right ventricle. Much or all of the right ventricle undergoes activation after depolarization of the left ventricle has been completed. This reduces the cancellation of RV activation forces by the more powerful left ventricular activation forces. The late and unopposed emergence of right ventricular forces produces the increased anterior and rightward voltage in the latter half of the ECG as well as a prolonged QRS complex. Discordant ST-T wave patterns are generated by the same mechanisms as for LBBB; with RBBB, recovery forces are directed toward the earlier activated left ventricle and away from the right.
A substantial proportion of patients with RBBB have abnormalities of left ventricular activation that are similar to those in patients with LBBB.[52] This suggests that many patients with RBBB have a diffuse, biventricular conduction system disease.
CLINICAL SIGNIFICANCE.
RBBB is a common finding in the general population, and many persons with RBBB have no clinical evidence of structural heart disease. The high prevalence of RBBB corresponds to the relative fragility
of the right bundle branch, as suggested by the development of RBBB after the minor trauma produced by right ventricular catheterization.
In the group without overt heart disease, RBBB is not an independent predictor of cardiovascular mortality. [44] [47] However, the new onset of RBBB does predict a higher rate of coronary artery disease, congestive heart failure, and cardiovascular mortality. When cardiac disease is present, the coexistence of RBBB suggests advanced disease with, for example, more extensive multivessel disease and reduced long-term survival in patients with ischemic heart disease. An entity known as the Brugada syndrome[53] has been described, in which a RBBB-like pattern with persistent ST segment elevation in the right precordial leads is associated with susceptibility to ventricular tachyarrhythmias and sudden cardiac death Chap. 9 35 .
Right bundle branch block interferes with other electrocardiographic diagnoses, although to a lesser extent than LBBB. The diagnosis of RVH is more difficult to make with RBBB because of the accentuated positive potentials in lead V1. RVH is suggested, although with limited accuracy, by the
presence of an R wave in lead V1 that exceeds 1.5 mV and a rightward shift of the mean QRS axis. The
usual criteria for LVH can be applied but they have lower sensitivities than with normal conduction. The combination of left atrial abnormality or left axis deviation with RBBB also suggests underlying LVH.
Multifascicular Blocks
The term multifascicular block refers to conduction delay in more than one of the structural components of the specialized conduction system—that is, the left bundle branch, the left anterior and posterior fascicles of the left bundle branch, and the right bundle branch. Conduction delay in any two fascicles is called bifascicular block, and delay in all three fascicles is called trifascicular block. The term bilateral bundle branch block has been used to refer to concomitant conduction abnormalities in the left and right bundle branch systems.
Bifascicular block can have several forms. These include the following: (1) RBBB with LAFB, characterized by the electrocardiographic pattern of RBBB plus left axis deviation beyond -45 degrees ( Fig. 12-28 ); (2) RBBB with LPFB, with an electrocardiographic pattern of RBBB and a mean QRS axis deviation to the right of +120 degrees ( Fig. 12-29 ); and (3) LBBB alone that may be caused by delay in both the anterior and posterior fascicles. This form of LBBB represents one of the inadequacies of current electrocardiographic terminology and the simplification inherent in the trifascicular schema of the conduction system. The electrophysiological consequences of these abnormalities are discussed in Chap. 32 35 .
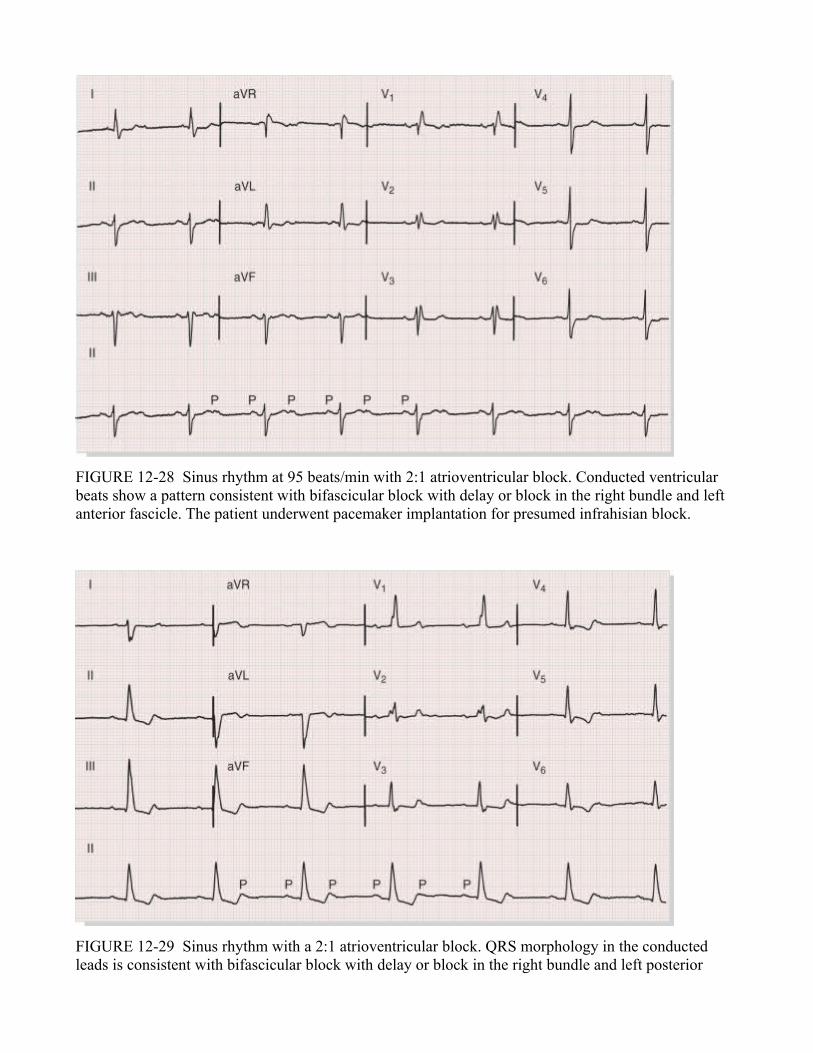
FIGURE 12-28 Sinus rhythm at 95 beats/min with 2:1 atrioventricular block. Conducted ventricular beats show a pattern consistent with bifascicular block with delay or block in the right bundle and left anterior fascicle. The patient underwent pacemaker implantation for presumed infrahisian block.
FIGURE 12-29 Sinus rhythm with a 2:1 atrioventricular block. QRS morphology in the conducted leads is consistent with bifascicular block with delay or block in the right bundle and left posterior
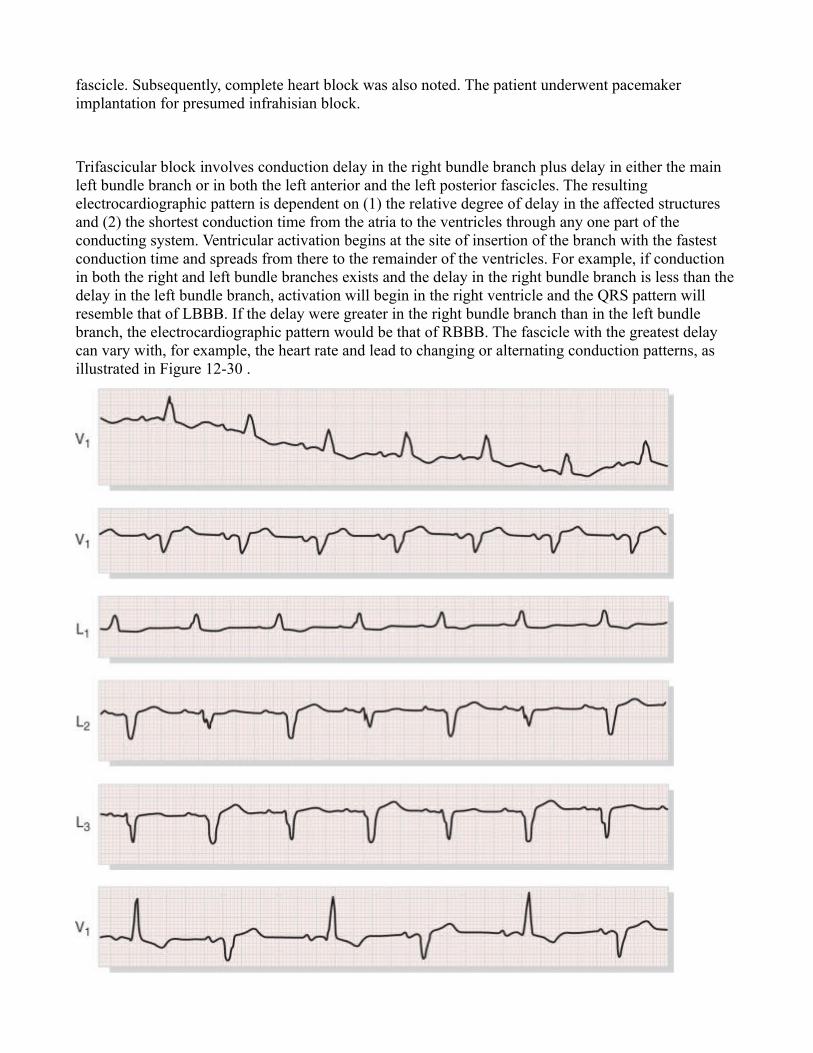
fascicle. Subsequently, complete heart block was also noted. The patient underwent pacemaker implantation for presumed infrahisian block.
Trifascicular block involves conduction delay in the right bundle branch plus delay in either the main left bundle branch or in both the left anterior and the left posterior fascicles. The resulting electrocardiographic pattern is dependent on (1) the relative degree of delay in the affected structures and (2) the shortest conduction time from the atria to the ventricles through any one part of the conducting system. Ventricular activation begins at the site of insertion of the branch with the fastest conduction time and spreads from there to the remainder of the ventricles. For example, if conduction in both the right and left bundle branches exists and the delay in the right bundle branch is less than the delay in the left bundle branch, activation will begin in the right ventricle and the QRS pattern will resemble that of LBBB. If the delay were greater in the right bundle branch than in the left bundle branch, the electrocardiographic pattern would be that of RBBB. The fascicle with the greatest delay can vary with, for example, the heart rate and lead to changing or alternating conduction patterns, as illustrated in Figure 12-30 .
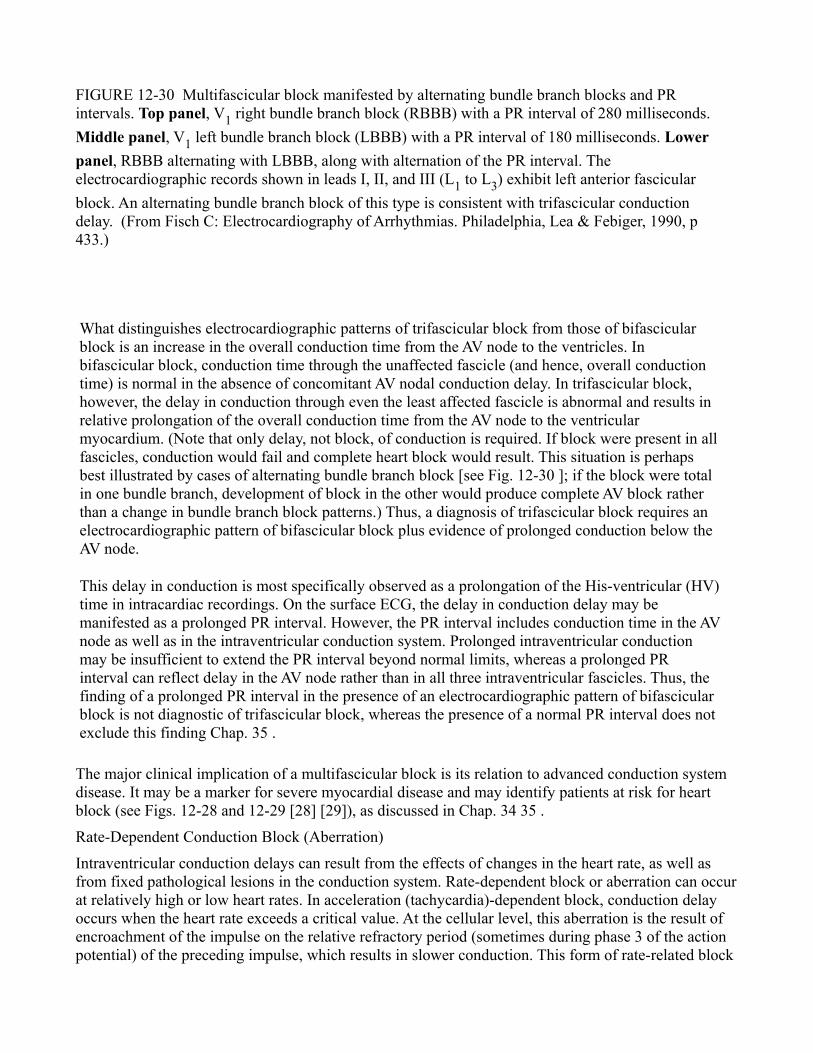
FIGURE 12-30 Multifascicular block manifested by alternating bundle branch blocks and PR intervals. Top panel, V1 right bundle branch block (RBBB) with a PR interval of 280 milliseconds.
Middle panel, V1 left bundle branch block (LBBB) with a PR interval of 180 milliseconds. Lower
panel, RBBB alternating with LBBB, along with alternation of the PR interval. The electrocardiographic records shown in leads I, II, and III (L1 to L3) exhibit left anterior fascicular
block. An alternating bundle branch block of this type is consistent with trifascicular conduction delay. (From Fisch C: Electrocardiography of Arrhythmias. Philadelphia, Lea & Febiger, 1990, p 433.)
What distinguishes electrocardiographic patterns of trifascicular block from those of bifascicular block is an increase in the overall conduction time from the AV node to the ventricles. In bifascicular block, conduction time through the unaffected fascicle (and hence, overall conduction time) is normal in the absence of concomitant AV nodal conduction delay. In trifascicular block, however, the delay in conduction through even the least affected fascicle is abnormal and results in relative prolongation of the overall conduction time from the AV node to the ventricular myocardium. (Note that only delay, not block, of conduction is required. If block were present in all fascicles, conduction would fail and complete heart block would result. This situation is perhaps best illustrated by cases of alternating bundle branch block [see Fig. 12-30 ]; if the block were total in one bundle branch, development of block in the other would produce complete AV block rather than a change in bundle branch block patterns.) Thus, a diagnosis of trifascicular block requires an electrocardiographic pattern of bifascicular block plus evidence of prolonged conduction below the AV node.
This delay in conduction is most specifically observed as a prolongation of the His-ventricular (HV) time in intracardiac recordings. On the surface ECG, the delay in conduction delay may be manifested as a prolonged PR interval. However, the PR interval includes conduction time in the AV node as well as in the intraventricular conduction system. Prolonged intraventricular conduction may be insufficient to extend the PR interval beyond normal limits, whereas a prolonged PR interval can reflect delay in the AV node rather than in all three intraventricular fascicles. Thus, the finding of a prolonged PR interval in the presence of an electrocardiographic pattern of bifascicular block is not diagnostic of trifascicular block, whereas the presence of a normal PR interval does not exclude this finding Chap. 35 .
The major clinical implication of a multifascicular block is its relation to advanced conduction system disease. It may be a marker for severe myocardial disease and may identify patients at risk for heart block (see Figs. 12-28 and 12-29 [28] [29]), as discussed in Chap. 34 35 .
Rate-Dependent Conduction Block (Aberration)
Intraventricular conduction delays can result from the effects of changes in the heart rate, as well as from fixed pathological lesions in the conduction system. Rate-dependent block or aberration can occur at relatively high or low heart rates. In acceleration (tachycardia)-dependent block, conduction delay occurs when the heart rate exceeds a critical value. At the cellular level, this aberration is the result of encroachment of the impulse on the relative refractory period (sometimes during phase 3 of the action potential) of the preceding impulse, which results in slower conduction. This form of rate-related block

is relatively common and can have the electrocardiographic pattern of RBBB or LBBB (Figs. 12-31 and 12-32 [31] [32]).
FIGURE 12-31 Atrial tachycardia with a Wenckebach (type I) second-degree atrioventricular (AV) block, ventricular aberration resulting from the Ashman phenomenon and probably concealed transseptal conduction. The long pause of the atrial tachycardia is followed by five QRS complexes with right bundle branch block (RBBB) morphology. The RBBB of the first QRS reflects the Ashman phenomenon. The aberration is perpetuated by concealed transseptal activation from the left bundle (LB) into the right bundle (RB), with block of anterograde conduction of the subsequent sinus impulse in the RB. Foreshortening of the R-R cycle, a manifestation of the Wenckebach structure, disturbs the relationship between transseptal and anterograde sinus conduction, and RB conduction is normalized. In the ladder diagram below the tracing, the solid lines represent the His bundle, the dashes represent the RB, the dots represent the LB, and the solid horizontal bars denote the refractory period. P waves and the AV node are not identified in the diagram. (Courtesy of Dr. C. Fisch.)
FIGURE 12-32 Acceleration-dependent QRS aberration with the paradox of persistence at a longer cycle and normalization at a shorter cycle than that which initiated the aberration. The duration of the basic cycle (C) is 760 milliseconds. Left bundle branch block (LBBB) appears at a cycle length of 700 milliseconds (dot) and is perpetuated at cycle lengths of 800 (arrowhead) and 840 (arrowhead) milliseconds; conduction normalizes after a cycle length of 600 milliseconds. Perpetuation of LBBB
at a cycle length of 800 and 840 milliseconds is probably caused by transseptal concealment, similar to that described in Figure 12-31 . Unexpected normalization of the QRS (S) following the atrial premature contraction is probably caused by equalization of conduction in the two bundles; however, supernormal conduction in the left bundle cannot be excluded. (From Fisch C, Zipes DP, McHenry PL: Rate-dependent aberrancy. Circulation 48:714, 1973.)
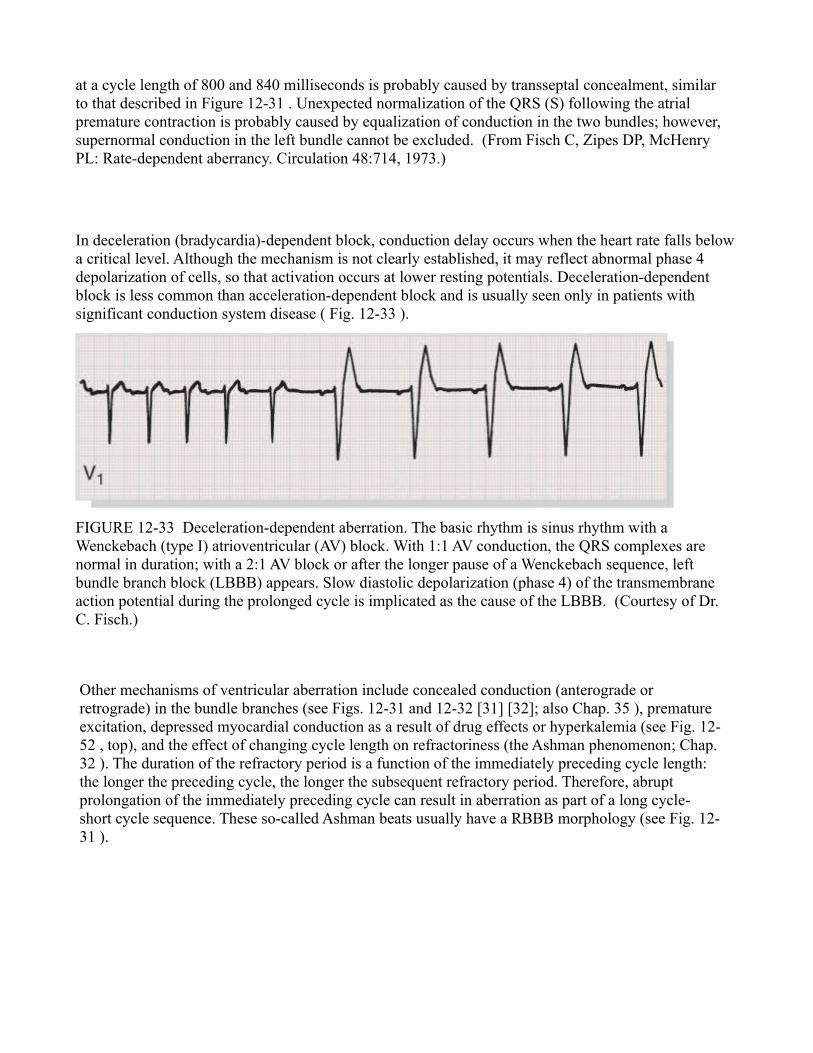
In deceleration (bradycardia)-dependent block, conduction delay occurs when the heart rate falls below a critical level. Although the mechanism is not clearly established, it may reflect abnormal phase 4 depolarization of cells, so that activation occurs at lower resting potentials. Deceleration-dependent block is less common than acceleration-dependent block and is usually seen only in patients with significant conduction system disease ( Fig. 12-33 ).
FIGURE 12-33 Deceleration-dependent aberration. The basic rhythm is sinus rhythm with a Wenckebach (type I) atrioventricular (AV) block. With 1:1 AV conduction, the QRS complexes are normal in duration; with a 2:1 AV block or after the longer pause of a Wenckebach sequence, left bundle branch block (LBBB) appears. Slow diastolic depolarization (phase 4) of the transmembrane action potential during the prolonged cycle is implicated as the cause of the LBBB. (Courtesy of Dr. C. Fisch.)
Other mechanisms of ventricular aberration include concealed conduction (anterograde or retrograde) in the bundle branches (see Figs. 12-31 and 12-32 [31] [32]; also Chap. 35 ), premature excitation, depressed myocardial conduction as a result of drug effects or hyperkalemia (see Fig. 12-52 , top), and the effect of changing cycle length on refractoriness (the Ashman phenomenon; Chap. 32 ). The duration of the refractory period is a function of the immediately preceding cycle length: the longer the preceding cycle, the longer the subsequent refractory period. Therefore, abrupt prolongation of the immediately preceding cycle can result in aberration as part of a long cycle-short cycle sequence. These so-called Ashman beats usually have a RBBB morphology (see Fig. 12-31 ).
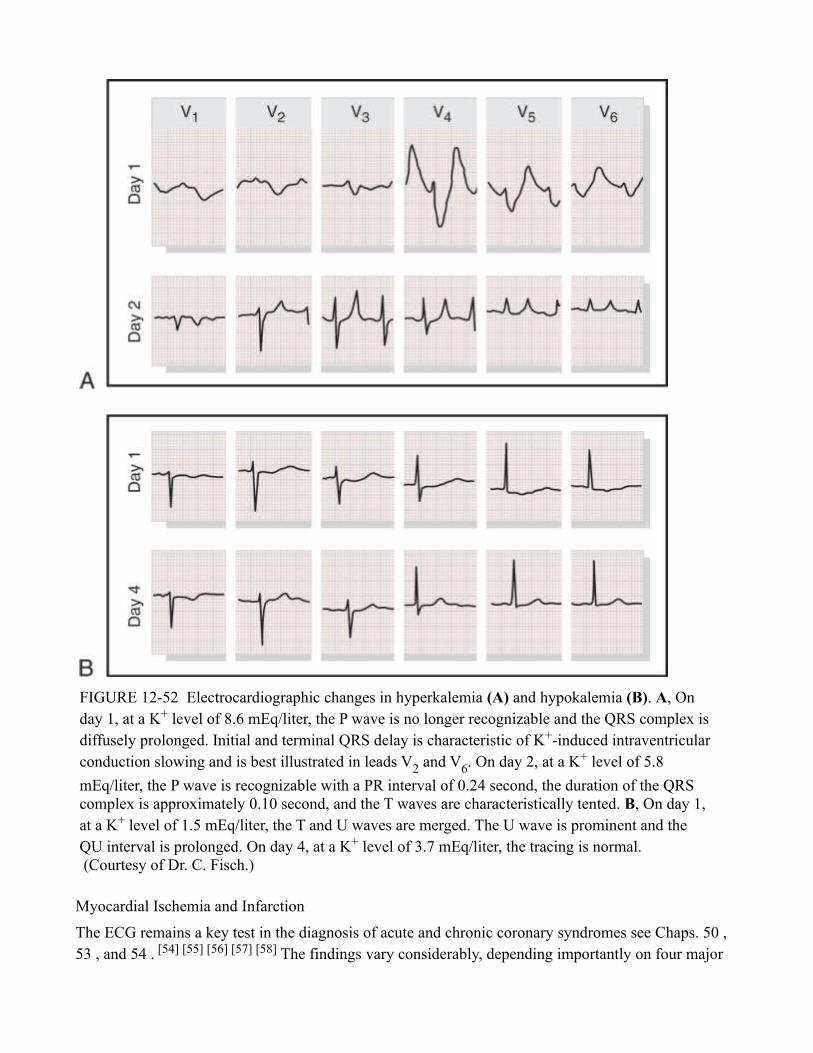
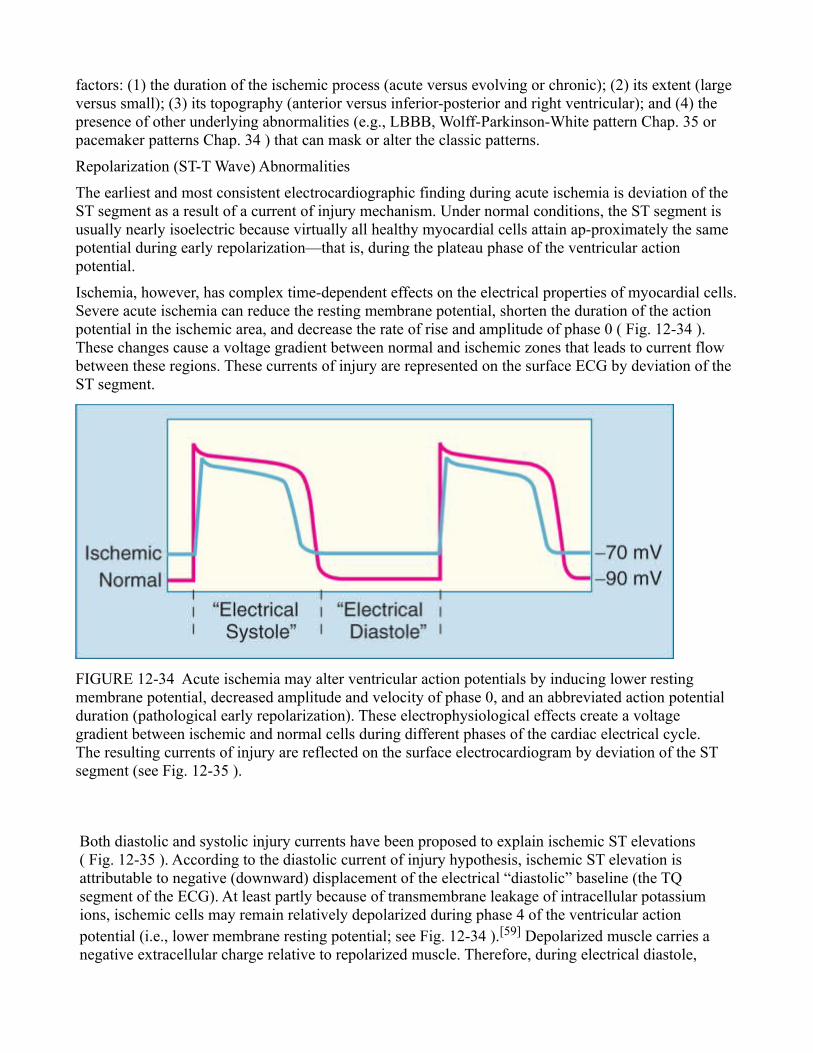
FIGURE 12-52 Electrocardiographic changes in hyperkalemia (A) and hypokalemia (B). A, On day 1, at a K+ level of 8.6 mEq/liter, the P wave is no longer recognizable and the QRS complex is diffusely prolonged. Initial and terminal QRS delay is characteristic of K+-induced intraventricular conduction slowing and is best illustrated in leads V2 and V6. On day 2, at a K+ level of 5.8
mEq/liter, the P wave is recognizable with a PR interval of 0.24 second, the duration of the QRS complex is approximately 0.10 second, and the T waves are characteristically tented. B, On day 1, at a K+ level of 1.5 mEq/liter, the T and U waves are merged. The U wave is prominent and the QU interval is prolonged. On day 4, at a K+ level of 3.7 mEq/liter, the tracing is normal. (Courtesy of Dr. C. Fisch.)
Myocardial Ischemia and Infarction
The ECG remains a key test in the diagnosis of acute and chronic coronary syndromes see Chaps. 50 , 53 , and 54 . [54] [55] [56] [57] [58] The findings vary considerably, depending importantly on four major
factors: (1) the duration of the ischemic process (acute versus evolving or chronic); (2) its extent (large versus small); (3) its topography (anterior versus inferior-posterior and right ventricular); and (4) the presence of other underlying abnormalities (e.g., LBBB, Wolff-Parkinson-White pattern Chap. 35 or pacemaker patterns Chap. 34 ) that can mask or alter the classic patterns.
Repolarization (ST-T Wave) Abnormalities
The earliest and most consistent electrocardiographic finding during acute ischemia is deviation of the ST segment as a result of a current of injury mechanism. Under normal conditions, the ST segment is usually nearly isoelectric because virtually all healthy myocardial cells attain ap-proximately the same potential during early repolarization—that is, during the plateau phase of the ventricular action potential.
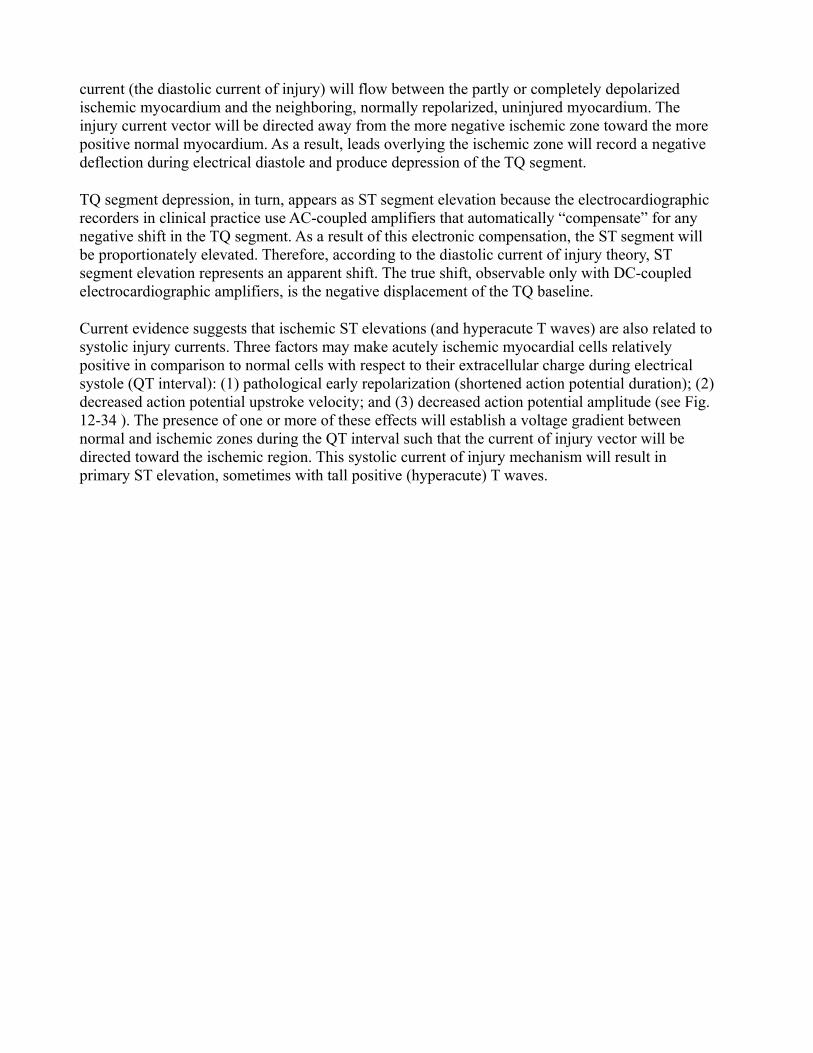
Ischemia, however, has complex time-dependent effects on the electrical properties of myocardial cells. Severe acute ischemia can reduce the resting membrane potential, shorten the duration of the action potential in the ischemic area, and decrease the rate of rise and amplitude of phase 0 ( Fig. 12-34 ). These changes cause a voltage gradient between normal and ischemic zones that leads to current flow between these regions. These currents of injury are represented on the surface ECG by deviation of the ST segment.
FIGURE 12-34 Acute ischemia may alter ventricular action potentials by inducing lower resting membrane potential, decreased amplitude and velocity of phase 0, and an abbreviated action potential duration (pathological early repolarization). These electrophysiological effects create a voltage gradient between ischemic and normal cells during different phases of the cardiac electrical cycle. The resulting currents of injury are reflected on the surface electrocardiogram by deviation of the ST segment (see Fig. 12-35 ).
Both diastolic and systolic injury currents have been proposed to explain ischemic ST elevations ( Fig. 12-35 ). According to the diastolic current of injury hypothesis, ischemic ST elevation is attributable to negative (downward) displacement of the electrical “diastolic” baseline (the TQ segment of the ECG). At least partly because of transmembrane leakage of intracellular potassium ions, ischemic cells may remain relatively depolarized during phase 4 of the ventricular action potential (i.e., lower membrane resting potential; see Fig. 12-34 ).[59] Depolarized muscle carries a negative extracellular charge relative to repolarized muscle. Therefore, during electrical diastole,
current (the diastolic current of injury) will flow between the partly or completely depolarized ischemic myocardium and the neighboring, normally repolarized, uninjured myocardium. The injury current vector will be directed away from the more negative ischemic zone toward the more positive normal myocardium. As a result, leads overlying the ischemic zone will record a negative deflection during electrical diastole and produce depression of the TQ segment.
TQ segment depression, in turn, appears as ST segment elevation because the electrocardiographic recorders in clinical practice use AC-coupled amplifiers that automatically “compensate” for any negative shift in the TQ segment. As a result of this electronic compensation, the ST segment will be proportionately elevated. Therefore, according to the diastolic current of injury theory, ST segment elevation represents an apparent shift. The true shift, observable only with DC-coupled electrocardiographic amplifiers, is the negative displacement of the TQ baseline.
Current evidence suggests that ischemic ST elevations (and hyperacute T waves) are also related to systolic injury currents. Three factors may make acutely ischemic myocardial cells relatively positive in comparison to normal cells with respect to their extracellular charge during electrical systole (QT interval): (1) pathological early repolarization (shortened action potential duration); (2) decreased action potential upstroke velocity; and (3) decreased action potential amplitude (see Fig. 12-34 ). The presence of one or more of these effects will establish a voltage gradient between normal and ischemic zones during the QT interval such that the current of injury vector will be directed toward the ischemic region. This systolic current of injury mechanism will result in primary ST elevation, sometimes with tall positive (hyperacute) T waves.
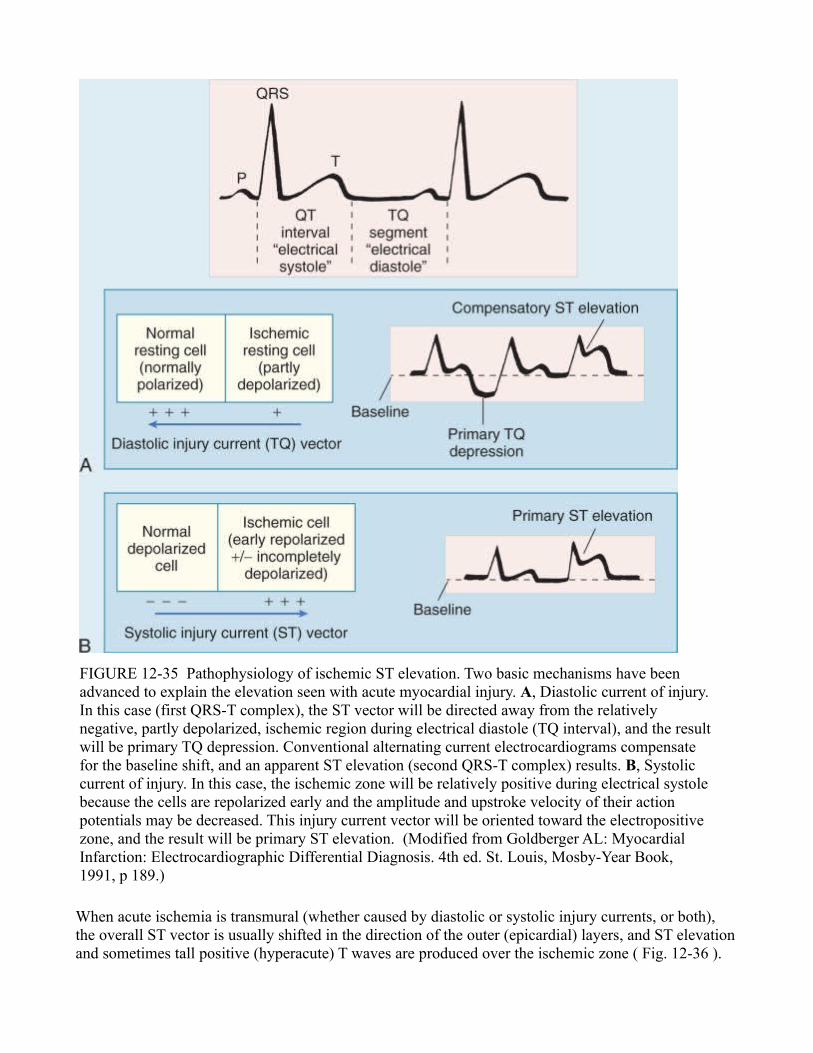
FIGURE 12-35 Pathophysiology of ischemic ST elevation. Two basic mechanisms have been advanced to explain the elevation seen with acute myocardial injury. A, Diastolic current of injury. In this case (first QRS-T complex), the ST vector will be directed away from the relatively negative, partly depolarized, ischemic region during electrical diastole (TQ interval), and the result will be primary TQ depression. Conventional alternating current electrocardiograms compensate for the baseline shift, and an apparent ST elevation (second QRS-T complex) results. B, Systolic current of injury. In this case, the ischemic zone will be relatively positive during electrical systole because the cells are repolarized early and the amplitude and upstroke velocity of their action potentials may be decreased. This injury current vector will be oriented toward the electropositive zone, and the result will be primary ST elevation. (Modified from Goldberger AL: Myocardial Infarction: Electrocardiographic Differential Diagnosis. 4th ed. St. Louis, Mosby-Year Book, 1991, p 189.)
When acute ischemia is transmural (whether caused by diastolic or systolic injury currents, or both), the overall ST vector is usually shifted in the direction of the outer (epicardial) layers, and ST elevation and sometimes tall positive (hyperacute) T waves are produced over the ischemic zone ( Fig. 12-36 ).
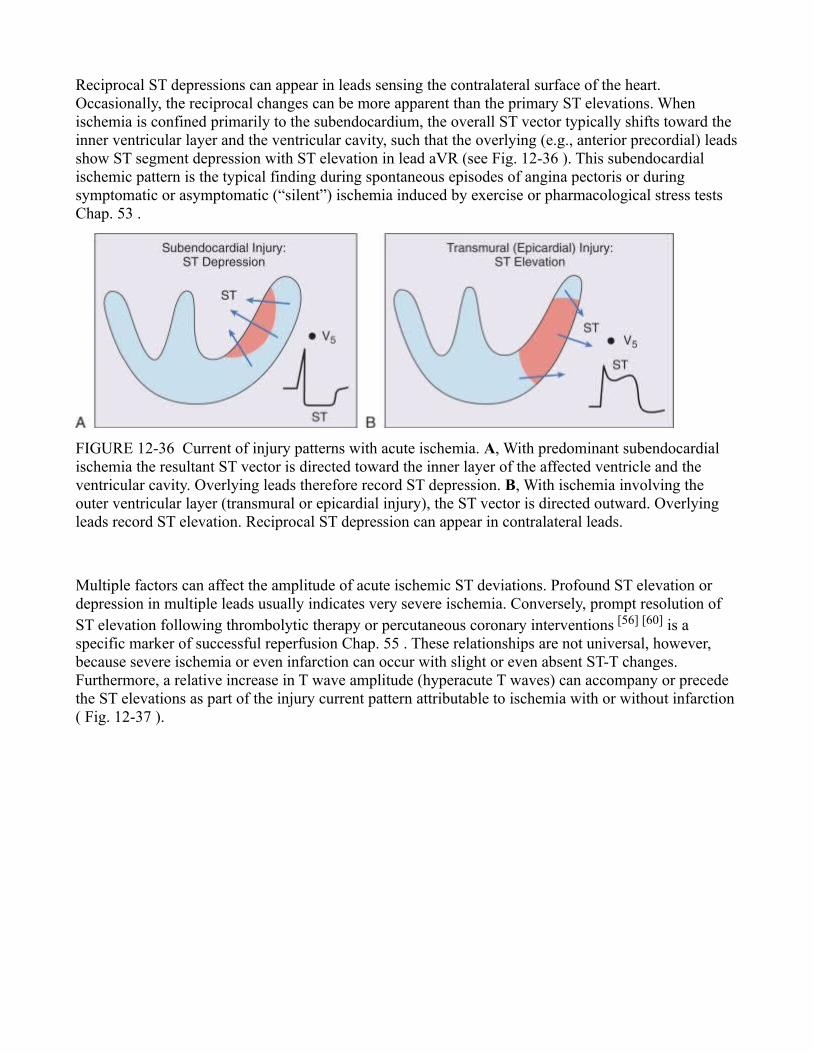
Reciprocal ST depressions can appear in leads sensing the contralateral surface of the heart. Occasionally, the reciprocal changes can be more apparent than the primary ST elevations. When ischemia is confined primarily to the subendocardium, the overall ST vector typically shifts toward the inner ventricular layer and the ventricular cavity, such that the overlying (e.g., anterior precordial) leads show ST segment depression with ST elevation in lead aVR (see Fig. 12-36 ). This subendocardial ischemic pattern is the typical finding during spontaneous episodes of angina pectoris or during symptomatic or asymptomatic (“silent”) ischemia induced by exercise or pharmacological stress tests Chap. 53 .
FIGURE 12-36 Current of injury patterns with acute ischemia. A, With predominant subendocardial ischemia the resultant ST vector is directed toward the inner layer of the affected ventricle and the ventricular cavity. Overlying leads therefore record ST depression. B, With ischemia involving the outer ventricular layer (transmural or epicardial injury), the ST vector is directed outward. Overlying leads record ST elevation. Reciprocal ST depression can appear in contralateral leads.
Multiple factors can affect the amplitude of acute ischemic ST deviations. Profound ST elevation or depression in multiple leads usually indicates very severe ischemia. Conversely, prompt resolution of ST elevation following thrombolytic therapy or percutaneous coronary interventions [56] [60] is a specific marker of successful reperfusion Chap. 55 . These relationships are not universal, however, because severe ischemia or even infarction can occur with slight or even absent ST-T changes. Furthermore, a relative increase in T wave amplitude (hyperacute T waves) can accompany or precede the ST elevations as part of the injury current pattern attributable to ischemia with or without infarction ( Fig. 12-37 ).
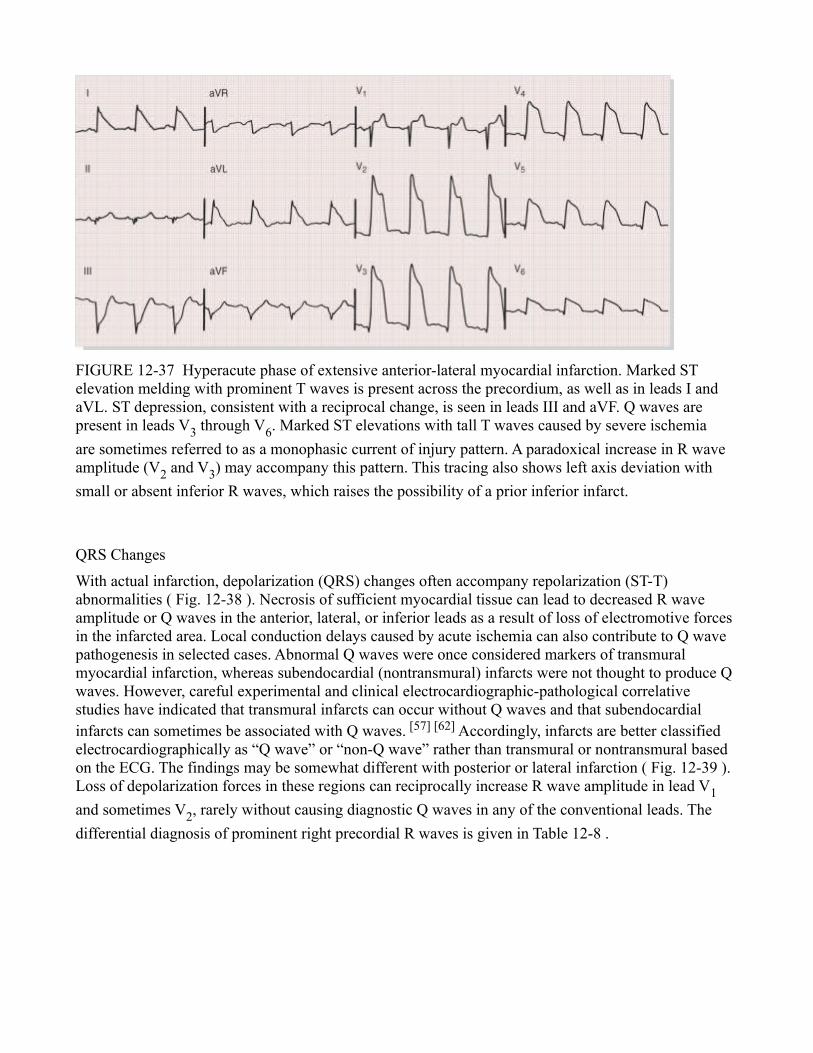
FIGURE 12-37 Hyperacute phase of extensive anterior-lateral myocardial infarction. Marked ST elevation melding with prominent T waves is present across the precordium, as well as in leads I and aVL. ST depression, consistent with a reciprocal change, is seen in leads III and aVF. Q waves are present in leads V3 through V6. Marked ST elevations with tall T waves caused by severe ischemia
are sometimes referred to as a monophasic current of injury pattern. A paradoxical increase in R wave amplitude (V2 and V3) may accompany this pattern. This tracing also shows left axis deviation with
small or absent inferior R waves, which raises the possibility of a prior inferior infarct.
QRS Changes
With actual infarction, depolarization (QRS) changes often accompany repolarization (ST-T) abnormalities ( Fig. 12-38 ). Necrosis of sufficient myocardial tissue can lead to decreased R wave amplitude or Q waves in the anterior, lateral, or inferior leads as a result of loss of electromotive forces in the infarcted area. Local conduction delays caused by acute ischemia can also contribute to Q wave pathogenesis in selected cases. Abnormal Q waves were once considered markers of transmural myocardial infarction, whereas subendocardial (nontransmural) infarcts were not thought to produce Q waves. However, careful experimental and clinical electrocardiographic-pathological correlative studies have indicated that transmural infarcts can occur without Q waves and that subendocardial infarcts can sometimes be associated with Q waves. [57] [62] Accordingly, infarcts are better classified electrocardiographically as “Q wave” or “non-Q wave” rather than transmural or nontransmural based on the ECG. The findings may be somewhat different with posterior or lateral infarction ( Fig. 12-39 ). Loss of depolarization forces in these regions can reciprocally increase R wave amplitude in lead V1
and sometimes V2, rarely without causing diagnostic Q waves in any of the conventional leads. The
differential diagnosis of prominent right precordial R waves is given in Table 12-8 .

FIGURE 12-38 Sequence of depolarization and repolarization changes with (A) acute anterior-lateral and (B) acute inferior wall Q wave infarctions. With anterior-lateral infarcts, ST elevation in leads I, aVl, and the precordial leads can be accompanied by reciprocal ST depression in leads II, III, and aVf.
Conversely, acute inferior (or posterior) infarcts can be associated with reciprocal ST depression in leads V1 to V3. (Modified from Goldberger AL: Clinical Electrocardiography: A Simplified
Approach. 7th ed. St. Louis, CV Mosby, 2006, p 90.)
FIGURE 12-39 Evolving inferoposterolateral infarction. Note the prominent Q waves in II, III, and aVF, along with ST elevation and T wave inversion in these leads, as well as V3 through V6. ST
depression in I, aVL, V1, and V2 is consistent with a reciprocal change. Relatively tall R waves are
also present in V1 and V2.

TABLE 12-8 -- Differential Diagnosis of Tall R Waves in V1/V2
Physiological and Positional Factors
Misplacement of chest leadsNormal variantsDisplacement of heart toward right side of chest (dextroversion), congenital or acquired
Myocardial Injury
Posterior (and/or lateral) myocardial infarction (see Fig. 12-39 )Duchenne muscular dystrophy
Ventricular Enlargement
Right ventricular hypertrophy (usually with right axis deviation)Hypertrophic cardiomyopathy
Altered Ventricular Depolarization
Right ventricular conduction abnormalitiesWolff-Parkinson-White patterns (caused by posterior or lateral wall preexcitation)Modified from Goldberger AL: Clinical Electrocardiography: A Simplified Approach. 7th ed. St. Louis, CV Mosby, 2006, p 285.
Evolution of Electrocardiographic Changes
Ischemic ST elevation and hyperacute T wave changes occur as the earliest sign of acute infarction; these are typically followed within a period ranging from hours to days by evolving T wave inversion and sometimes Q waves in the same lead distribution (see Fig. 12-38 ). T wave inversion from evolving or chronic ischemia correlates with increased ventricular action potential duration, and these ischemic changes are often associated with QT prolongation. The T wave inversion can resolve after days or weeks or persist indefinitely. The extent of the infarct may be an important determinant of T wave evolution. In one series,[62] T waves that were persistently negative for more than 1 year in leads with Q waves were associated with a transmural infarction with fibrosis of the entire wall; in contrast, T waves that were positive in leads with Q waves correlated with nontransmural infarction with viable myocardium within the wall.
In the days to weeks or longer following infarction, the QRS changes can persist or begin to resolve.[63]
Complete normalization of the ECG following Q wave infarction is uncommon but can occur, particularly with smaller infarcts and when the left ventricular ejection fraction and regional wall motion improve. This is usually associated with spontaneous recanalization or good collateral circulation and is a good prognostic sign. In contrast, persistent Q waves and ST elevation several weeks or more after an infarct correlate strongly with a severe underlying wall motion disorder (akinetic or dyskinetic zone), although not necessarily a frank ventricular aneurysm. The presence of an rSR′ or similar complex in the midleft chest leads or lead I is another reported marker of ventricular aneurysm.
Other Ischemic ST-T Patterns
Reversible transmural ischemia caused, for example, by coronary vasospasm may cause transient ST segment elevation ( Fig. 12-40 ).[57] This pattern is the electrocardiographic marker of Prinzmetal variant angina Chap. 53 . Depending on the severity and duration of such noninfarction ischemia, the

ST elevation can either resolve completely within minutes or be followed by T wave inversion that can persist for hours or even days. Some patients with ischemic chest pain have deep coronary T wave inversion in multiple precordial leads (e.g., V1 through V4), with or without cardiac enzyme level
elevations. This finding is typically caused by severe ischemia associated with a high-grade stenosis in the proximal left anterior descending (LAD) coronary artery system (LAD-T wave pattern). The T wave inversion can actually be preceded by a transient ST elevation that resolves by the time the patient arrives at the hospital. These T wave inversions, in the setting of unstable angina, can correlate with segmental hypokinesis of the anterior wall and suggest a “myocardial stunning” syndrome. The natural history of this syndrome is unfavorable, with a high incidence of recurrent angina and myocardial infarction. On the other hand, patients whose baseline ECG already shows abnormal T wave inversion can experience paradoxical T wave normalization (pseudonormalization) during episodes of acute transmural ischemia ( Fig. 12-41 ). The four major classes of acute electrocardiographic-coronary artery syndromes in which myocardial ischemia leads to different electrocardiographic findings are summarized in Figure 12-42 .
FIGURE 12-40 A, Prinzmetal angina with ST segment and T wave alternans. B, ST segment and T wave alternans associated with nonsustained ventricular tachycardia. (Courtesy of Dr. C. Fisch.)
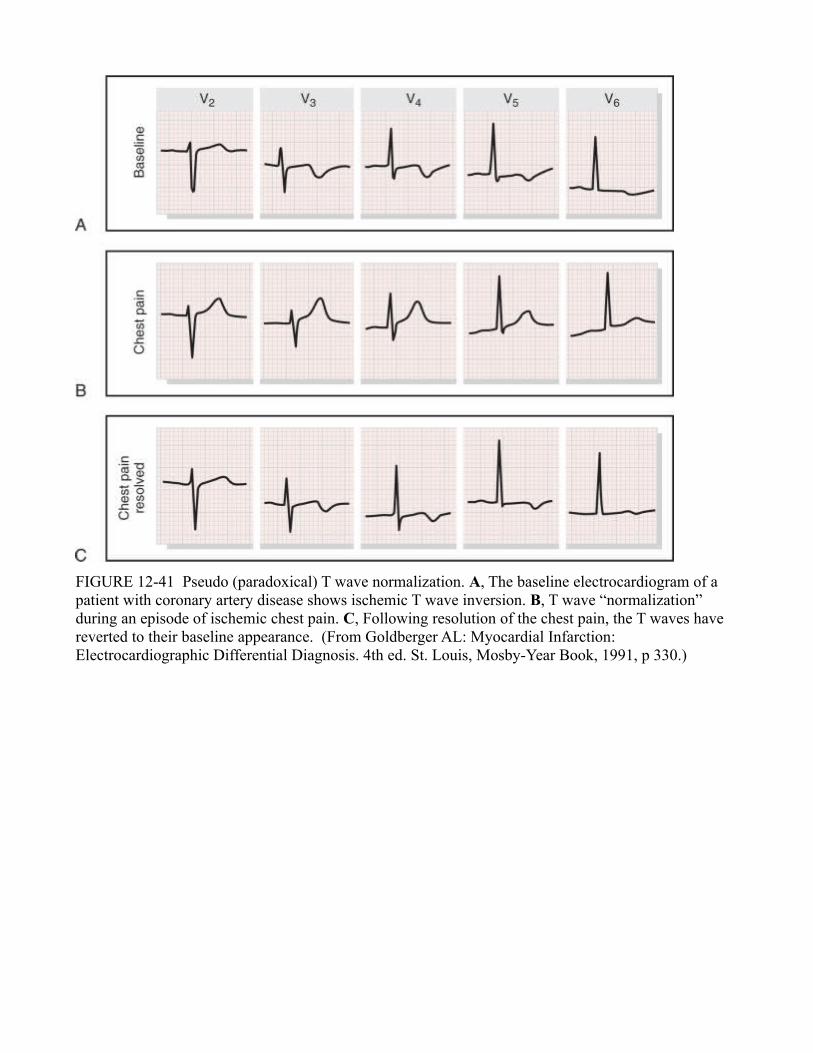
FIGURE 12-41 Pseudo (paradoxical) T wave normalization. A, The baseline electrocardiogram of a patient with coronary artery disease shows ischemic T wave inversion. B, T wave “normalization” during an episode of ischemic chest pain. C, Following resolution of the chest pain, the T waves have reverted to their baseline appearance. (From Goldberger AL: Myocardial Infarction: Electrocardiographic Differential Diagnosis. 4th ed. St. Louis, Mosby-Year Book, 1991, p 330.)
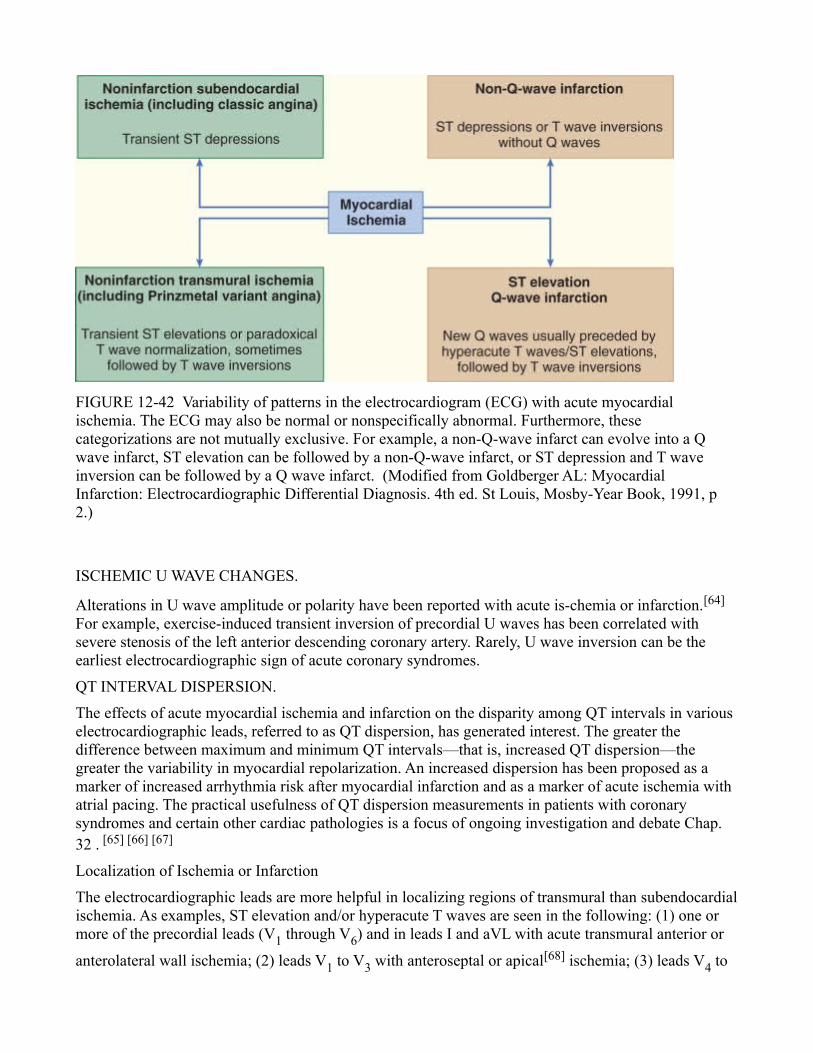
FIGURE 12-42 Variability of patterns in the electrocardiogram (ECG) with acute myocardial ischemia. The ECG may also be normal or nonspecifically abnormal. Furthermore, these categorizations are not mutually exclusive. For example, a non-Q-wave infarct can evolve into a Q wave infarct, ST elevation can be followed by a non-Q-wave infarct, or ST depression and T wave inversion can be followed by a Q wave infarct. (Modified from Goldberger AL: Myocardial Infarction: Electrocardiographic Differential Diagnosis. 4th ed. St Louis, Mosby-Year Book, 1991, p 2.)
ISCHEMIC U WAVE CHANGES.
Alterations in U wave amplitude or polarity have been reported with acute is-chemia or infarction.[64]
For example, exercise-induced transient inversion of precordial U waves has been correlated with severe stenosis of the left anterior descending coronary artery. Rarely, U wave inversion can be the earliest electrocardiographic sign of acute coronary syndromes.
QT INTERVAL DISPERSION.
The effects of acute myocardial ischemia and infarction on the disparity among QT intervals in various electrocardiographic leads, referred to as QT dispersion, has generated interest. The greater the difference between maximum and minimum QT intervals—that is, increased QT dispersion—the greater the variability in myocardial repolarization. An increased dispersion has been proposed as a marker of increased arrhythmia risk after myocardial infarction and as a marker of acute ischemia with atrial pacing. The practical usefulness of QT dispersion measurements in patients with coronary syndromes and certain other cardiac pathologies is a focus of ongoing investigation and debate Chap. 32 . [65] [66] [67]
Localization of Ischemia or Infarction
The electrocardiographic leads are more helpful in localizing regions of transmural than subendocardial ischemia. As examples, ST elevation and/or hyperacute T waves are seen in the following: (1) one or more of the precordial leads (V1 through V6) and in leads I and aVL with acute transmural anterior or
anterolateral wall ischemia; (2) leads V1 to V3 with anteroseptal or apical[68] ischemia; (3) leads V4 to
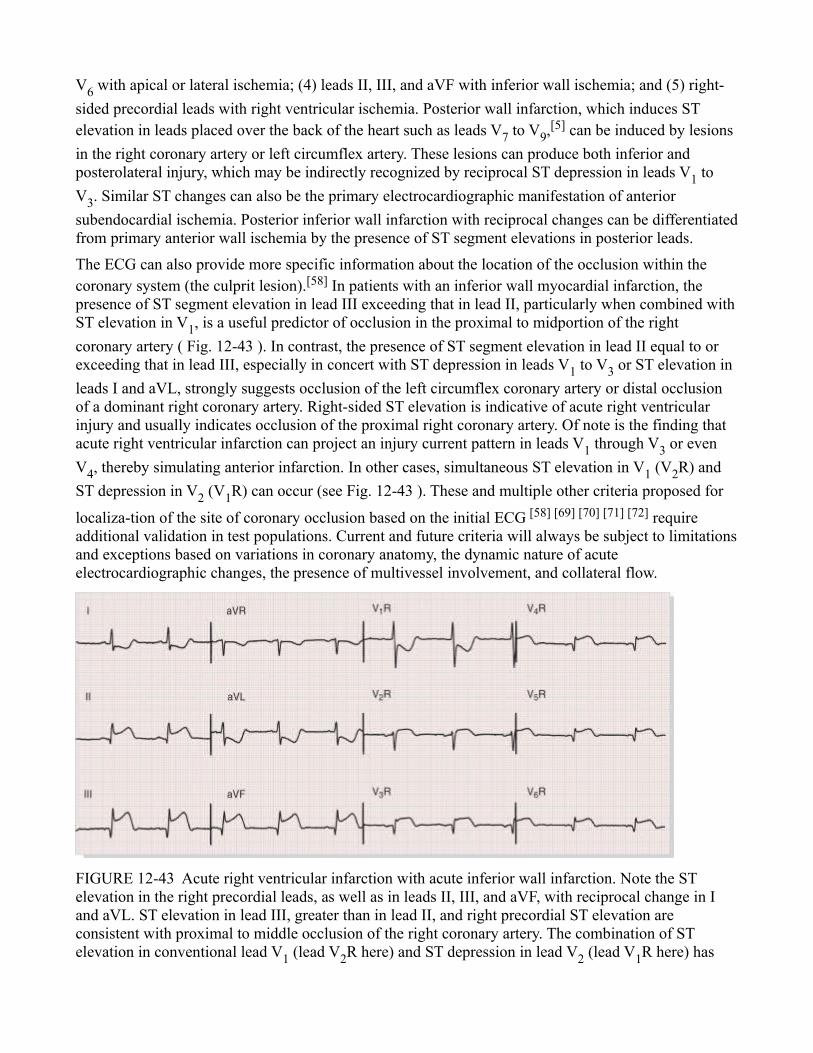
V6 with apical or lateral ischemia; (4) leads II, III, and aVF with inferior wall ischemia; and (5) right-
sided precordial leads with right ventricular ischemia. Posterior wall infarction, which induces ST elevation in leads placed over the back of the heart such as leads V7 to V9,[5] can be induced by lesions
in the right coronary artery or left circumflex artery. These lesions can produce both inferior and posterolateral injury, which may be indirectly recognized by reciprocal ST depression in leads V1 to
V3. Similar ST changes can also be the primary electrocardiographic manifestation of anterior
subendocardial ischemia. Posterior inferior wall infarction with reciprocal changes can be differentiated from primary anterior wall ischemia by the presence of ST segment elevations in posterior leads.
The ECG can also provide more specific information about the location of the occlusion within the coronary system (the culprit lesion).[58] In patients with an inferior wall myocardial infarction, the presence of ST segment elevation in lead III exceeding that in lead II, particularly when combined with ST elevation in V1, is a useful predictor of occlusion in the proximal to midportion of the right
coronary artery ( Fig. 12-43 ). In contrast, the presence of ST segment elevation in lead II equal to or exceeding that in lead III, especially in concert with ST depression in leads V1 to V3 or ST elevation in
leads I and aVL, strongly suggests occlusion of the left circumflex coronary artery or distal occlusion of a dominant right coronary artery. Right-sided ST elevation is indicative of acute right ventricular injury and usually indicates occlusion of the proximal right coronary artery. Of note is the finding that acute right ventricular infarction can project an injury current pattern in leads V1 through V3 or even
V4, thereby simulating anterior infarction. In other cases, simultaneous ST elevation in V1 (V2R) and
ST depression in V2 (V1R) can occur (see Fig. 12-43 ). These and multiple other criteria proposed for
localiza-tion of the site of coronary occlusion based on the initial ECG [58] [69] [70] [71] [72] require additional validation in test populations. Current and future criteria will always be subject to limitations and exceptions based on variations in coronary anatomy, the dynamic nature of acute electrocardiographic changes, the presence of multivessel involvement, and collateral flow.
FIGURE 12-43 Acute right ventricular infarction with acute inferior wall infarction. Note the ST elevation in the right precordial leads, as well as in leads II, III, and aVF, with reciprocal change in I and aVL. ST elevation in lead III, greater than in lead II, and right precordial ST elevation are consistent with proximal to middle occlusion of the right coronary artery. The combination of ST elevation in conventional lead V1 (lead V2R here) and ST depression in lead V2 (lead V1R here) has
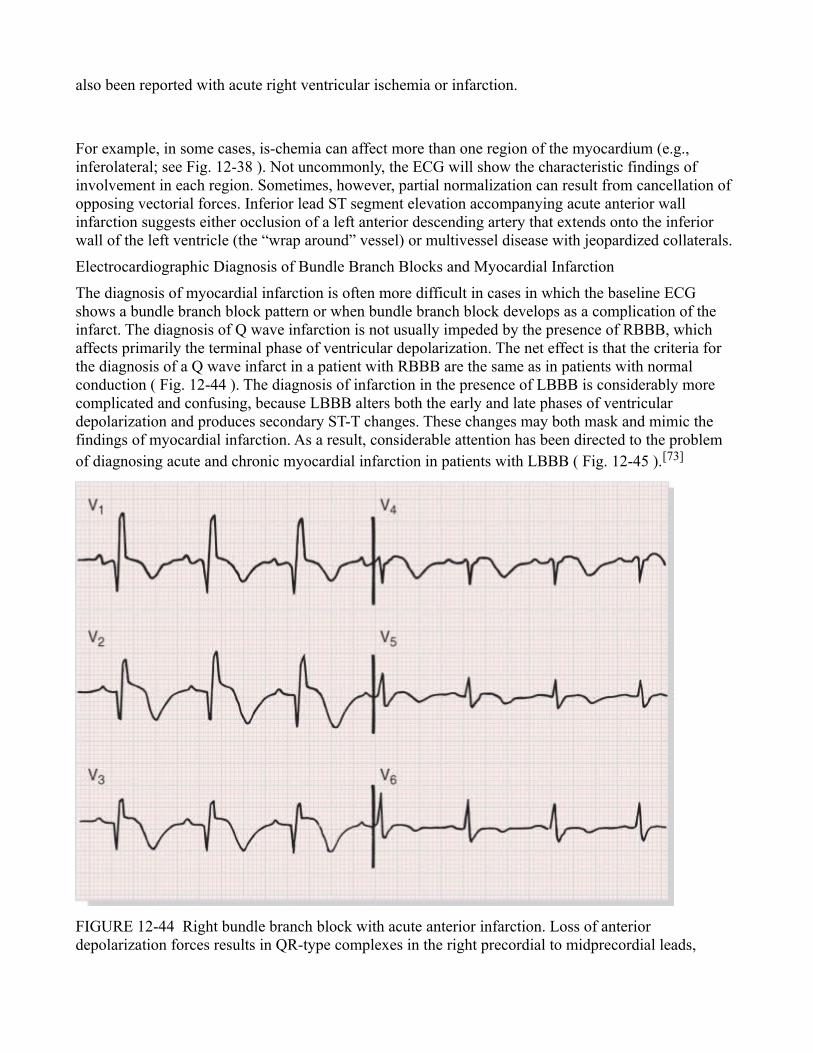
also been reported with acute right ventricular ischemia or infarction.
For example, in some cases, is-chemia can affect more than one region of the myocardium (e.g., inferolateral; see Fig. 12-38 ). Not uncommonly, the ECG will show the characteristic findings of involvement in each region. Sometimes, however, partial normalization can result from cancellation of opposing vectorial forces. Inferior lead ST segment elevation accompanying acute anterior wall infarction suggests either occlusion of a left anterior descending artery that extends onto the inferior wall of the left ventricle (the “wrap around” vessel) or multivessel disease with jeopardized collaterals.
Electrocardiographic Diagnosis of Bundle Branch Blocks and Myocardial Infarction
The diagnosis of myocardial infarction is often more difficult in cases in which the baseline ECG shows a bundle branch block pattern or when bundle branch block develops as a complication of the infarct. The diagnosis of Q wave infarction is not usually impeded by the presence of RBBB, which affects primarily the terminal phase of ventricular depolarization. The net effect is that the criteria for the diagnosis of a Q wave infarct in a patient with RBBB are the same as in patients with normal conduction ( Fig. 12-44 ). The diagnosis of infarction in the presence of LBBB is considerably more complicated and confusing, because LBBB alters both the early and late phases of ventricular depolarization and produces secondary ST-T changes. These changes may both mask and mimic the findings of myocardial infarction. As a result, considerable attention has been directed to the problem of diagnosing acute and chronic myocardial infarction in patients with LBBB ( Fig. 12-45 ).[73]
FIGURE 12-44 Right bundle branch block with acute anterior infarction. Loss of anterior depolarization forces results in QR-type complexes in the right precordial to midprecordial leads,
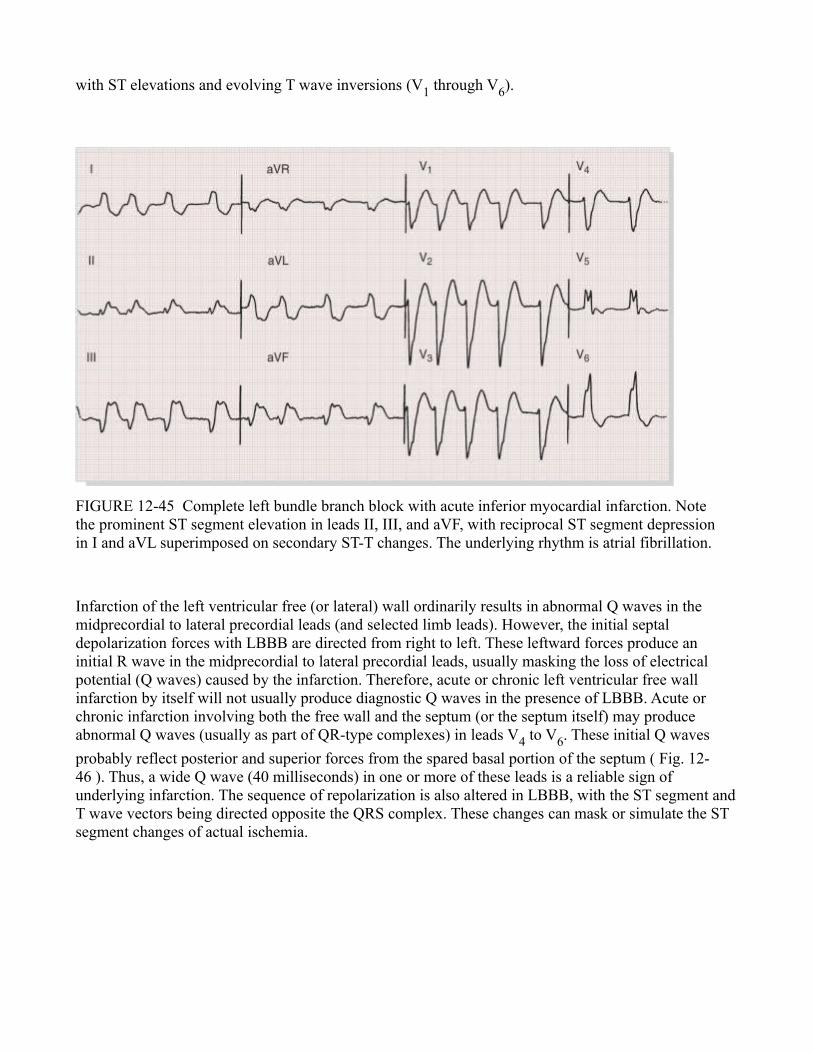
with ST elevations and evolving T wave inversions (V1 through V6).
FIGURE 12-45 Complete left bundle branch block with acute inferior myocardial infarction. Note the prominent ST segment elevation in leads II, III, and aVF, with reciprocal ST segment depression in I and aVL superimposed on secondary ST-T changes. The underlying rhythm is atrial fibrillation.
Infarction of the left ventricular free (or lateral) wall ordinarily results in abnormal Q waves in the midprecordial to lateral precordial leads (and selected limb leads). However, the initial septal depolarization forces with LBBB are directed from right to left. These leftward forces produce an initial R wave in the midprecordial to lateral precordial leads, usually masking the loss of electrical potential (Q waves) caused by the infarction. Therefore, acute or chronic left ventricular free wall infarction by itself will not usually produce diagnostic Q waves in the presence of LBBB. Acute or chronic infarction involving both the free wall and the septum (or the septum itself) may produce abnormal Q waves (usually as part of QR-type complexes) in leads V4 to V6. These initial Q waves
probably reflect posterior and superior forces from the spared basal portion of the septum ( Fig. 12-46 ). Thus, a wide Q wave (40 milliseconds) in one or more of these leads is a reliable sign of underlying infarction. The sequence of repolarization is also altered in LBBB, with the ST segment and T wave vectors being directed opposite the QRS complex. These changes can mask or simulate the ST segment changes of actual ischemia.
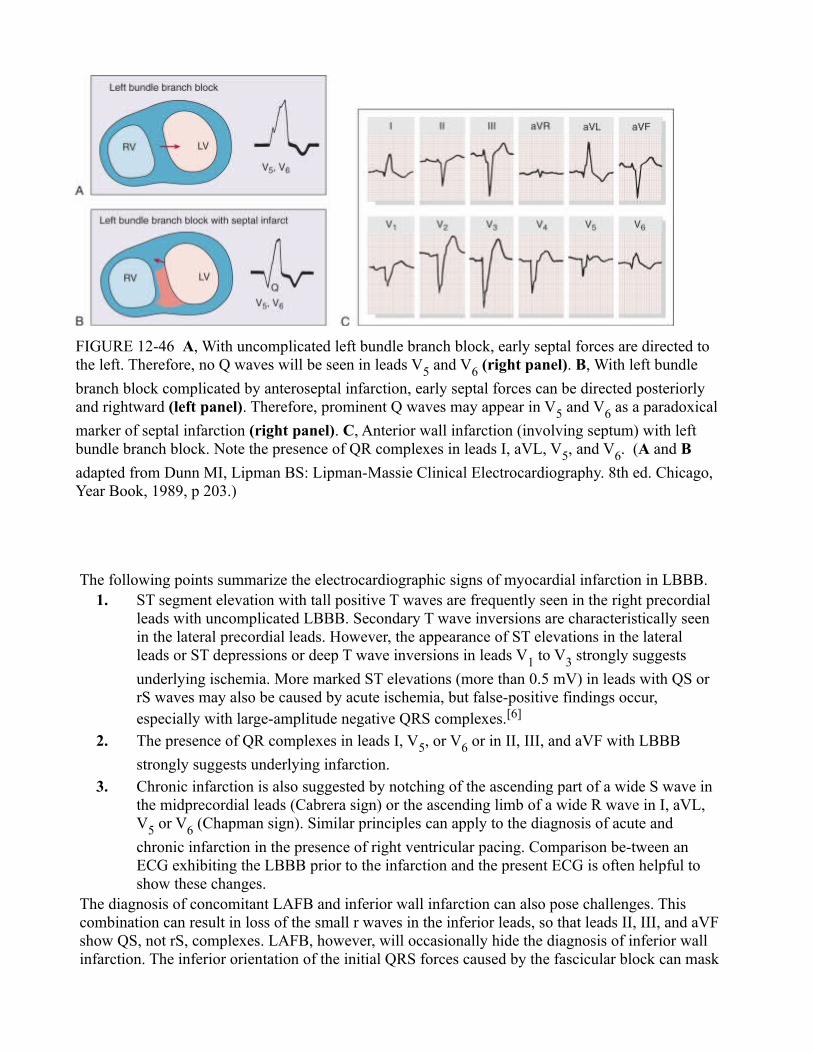
FIGURE 12-46 A, With uncomplicated left bundle branch block, early septal forces are directed to the left. Therefore, no Q waves will be seen in leads V5 and V6 (right panel). B, With left bundle
branch block complicated by anteroseptal infarction, early septal forces can be directed posteriorly and rightward (left panel). Therefore, prominent Q waves may appear in V5 and V6 as a paradoxical
marker of septal infarction (right panel). C, Anterior wall infarction (involving septum) with left bundle branch block. Note the presence of QR complexes in leads I, aVL, V5, and V6. (A and B
adapted from Dunn MI, Lipman BS: Lipman-Massie Clinical Electrocardiography. 8th ed. Chicago, Year Book, 1989, p 203.)
The following points summarize the electrocardiographic signs of myocardial infarction in LBBB.
1. ST segment elevation with tall positive T waves are frequently seen in the right precordial leads with uncomplicated LBBB. Secondary T wave inversions are characteristically seen in the lateral precordial leads. However, the appearance of ST elevations in the lateral leads or ST depressions or deep T wave inversions in leads V1 to V3 strongly suggests
underlying ischemia. More marked ST elevations (more than 0.5 mV) in leads with QS or rS waves may also be caused by acute ischemia, but false-positive findings occur, especially with large-amplitude negative QRS complexes.[6]
2. The presence of QR complexes in leads I, V5, or V6 or in II, III, and aVF with LBBB
strongly suggests underlying infarction.
3. Chronic infarction is also suggested by notching of the ascending part of a wide S wave in the midprecordial leads (Cabrera sign) or the ascending limb of a wide R wave in I, aVL, V5 or V6 (Chapman sign). Similar principles can apply to the diagnosis of acute and
chronic infarction in the presence of right ventricular pacing. Comparison be-tween an ECG exhibiting the LBBB prior to the infarction and the present ECG is often helpful to show these changes.
The diagnosis of concomitant LAFB and inferior wall infarction can also pose challenges. This combination can result in loss of the small r waves in the inferior leads, so that leads II, III, and aVF show QS, not rS, complexes. LAFB, however, will occasionally hide the diagnosis of inferior wall infarction. The inferior orientation of the initial QRS forces caused by the fascicular block can mask
inferior Q waves, with resultant rS complexes in leads II, III, and aVF. In other cases, the combination of LAFB and inferior wall infarction will produce qrS complexes in the inferior limb leads, with the initial q wave the result of the infarct and the minuscule r wave the result of the fascicular block.
Atrial Infarction
A number of electrocardiographic clues to the diagnosis of atrial infarction have been suggested, including localized deviations of the PR segment (e.g., PR elevation in V5 or V6 or the inferior leads [74] [75]) changes in P wave morphology, and atrial arrhythmias. The sensitivity and specificity of these signs are limited, however. Diffuse PR segment changes, PR elevation in lead aVR with depression in the inferolateral leads with acute ventricular infarction usually indicate concomitant pericarditis (see later).
Electrocardiographic Differential Diagnosis of Ischemia and Infarction
The ECG has important limitations in both sensitivity and specificity in the diagnosis of coronary syndromes.[57] An initially normal ECG does not exclude ischemia or even acute infarction.[76] If the initial ECG is not diagnostic, but the patient remains symptomatic and there is high clinical suspicion for acute ischemia, it is recommended that the ECG be repeated at 5- to 10-minute intervals.[56]
However, a normal ECG throughout the course of an alleged acute infarct is distinctly uncommon. As a result, prolonged chest pain without diagnostic electrocardiographic changes on repeat ECGs should always prompt a careful search for noncoronary causes of chest pain Chap. 49 . Pathological Q waves can be absent even in patients with depressed left ventricular function caused by severe coronary disease and a previous infarct. As noted, the diagnosis of acute or chronic infarction can be completely masked by ventricular conduction disturbances, especially those resulting from LBBB, as well as ventricular pacing and Wolff-Parkinson-White preexcitation. On the other hand, diagnostic confusion can arise because Q waves, ST elevation, ST depression, tall positive T waves, and deep T wave inversion can be seen in a wide variety of noncoronary settings.
Noninfarction Q Waves
Q waves simulating coronary artery disease can be related to one (or a combination) of the following four factors ( Table 12-9 )[57]: (1) physiological or positional variants; (2) altered ventricular conduction; (3) ventricular enlargement; and (4) myocardial damage or replacement. Depending on the electrical axis, prominent Q waves (as part of QS- or QR-type complexes) can also appear in the limb leads (aVL with a vertical axis and III and aVF with a horizontal axis). A QS complex can appear in lead V1 as a normal variant and rarely in leads V1 and V2. Prominent Q waves can be associated with
various other positional factors that alter the orientation of the heart vis-à-vis a given lead axis. Poor R wave progression, sometimes with actual QS waves, can be the result solely of improper placement of chest electrodes above their usual position. In cases of dextrocardia, provided that no underlying structural abnormalities are present, normal R wave progression can be restored by recording leads V2
to V6 on the right side of the chest (with lead V1 placed in the V2 position; Chap. 61 ). A rightward
mediastinal shift in left pneumothorax can contribute to the apparent loss of left precordial R waves. Other positional factors associated with slow R wave progression include pectus excavatum, congenitally corrected transposition of the great vessels, and congenital absence of the left pericardium.
TABLE 12-9 -- Differential Diagnosis of Noninfarction Q Waves (with Selected Examples)
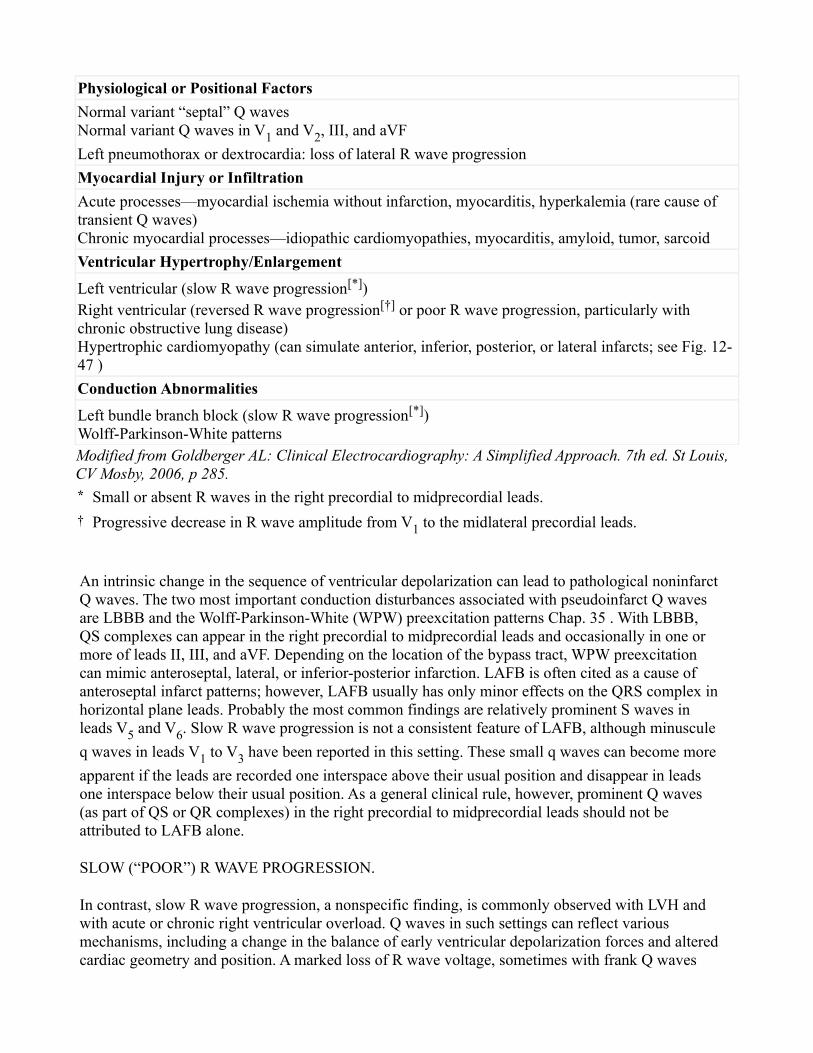
Physiological or Positional Factors
Normal variant “septal” Q wavesNormal variant Q waves in V1 and V2, III, and aVF
Left pneumothorax or dextrocardia: loss of lateral R wave progression
Myocardial Injury or Infiltration
Acute processes—myocardial ischemia without infarction, myocarditis, hyperkalemia (rare cause of transient Q waves)Chronic myocardial processes—idiopathic cardiomyopathies, myocarditis, amyloid, tumor, sarcoid
Ventricular Hypertrophy/Enlargement
Left ventricular (slow R wave progression[*])Right ventricular (reversed R wave progression[†] or poor R wave progression, particularly with chronic obstructive lung disease)Hypertrophic cardiomyopathy (can simulate anterior, inferior, posterior, or lateral infarcts; see Fig. 12-47 )
Conduction Abnormalities
Left bundle branch block (slow R wave progression[*])Wolff-Parkinson-White patternsModified from Goldberger AL: Clinical Electrocardiography: A Simplified Approach. 7th ed. St Louis, CV Mosby, 2006, p 285.* Small or absent R waves in the right precordial to midprecordial leads.† Progressive decrease in R wave amplitude from V1 to the midlateral precordial leads.
An intrinsic change in the sequence of ventricular depolarization can lead to pathological noninfarct Q waves. The two most important conduction disturbances associated with pseudoinfarct Q waves are LBBB and the Wolff-Parkinson-White (WPW) preexcitation patterns Chap. 35 . With LBBB, QS complexes can appear in the right precordial to midprecordial leads and occasionally in one or more of leads II, III, and aVF. Depending on the location of the bypass tract, WPW preexcitation can mimic anteroseptal, lateral, or inferior-posterior infarction. LAFB is often cited as a cause of anteroseptal infarct patterns; however, LAFB usually has only minor effects on the QRS complex in horizontal plane leads. Probably the most common findings are relatively prominent S waves in leads V5 and V6. Slow R wave progression is not a consistent feature of LAFB, although minuscule
q waves in leads V1 to V3 have been reported in this setting. These small q waves can become more
apparent if the leads are recorded one interspace above their usual position and disappear in leads one interspace below their usual position. As a general clinical rule, however, prominent Q waves (as part of QS or QR complexes) in the right precordial to midprecordial leads should not be attributed to LAFB alone.
SLOW (“POOR”) R WAVE PROGRESSION.
In contrast, slow R wave progression, a nonspecific finding, is commonly observed with LVH and with acute or chronic right ventricular overload. Q waves in such settings can reflect various mechanisms, including a change in the balance of early ventricular depolarization forces and altered cardiac geometry and position. A marked loss of R wave voltage, sometimes with frank Q waves
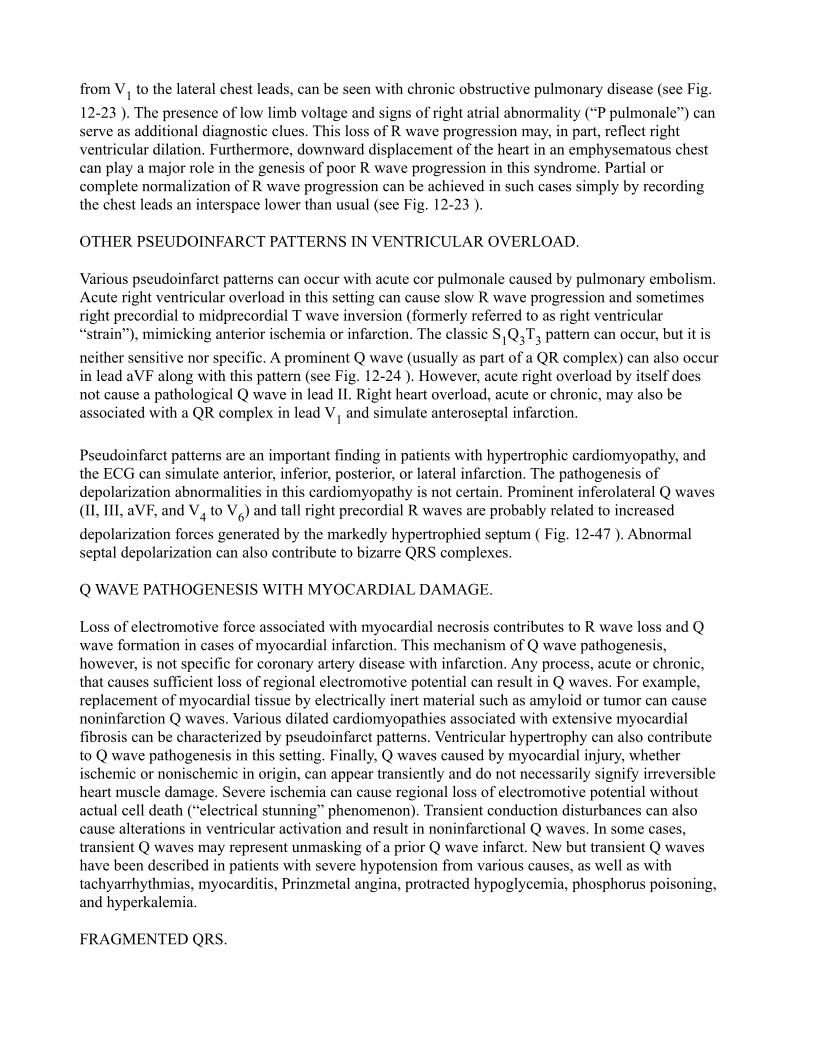
from V1 to the lateral chest leads, can be seen with chronic obstructive pulmonary disease (see Fig.
12-23 ). The presence of low limb voltage and signs of right atrial abnormality (“P pulmonale”) can serve as additional diagnostic clues. This loss of R wave progression may, in part, reflect right ventricular dilation. Furthermore, downward displacement of the heart in an emphysematous chest can play a major role in the genesis of poor R wave progression in this syndrome. Partial or complete normalization of R wave progression can be achieved in such cases simply by recording the chest leads an interspace lower than usual (see Fig. 12-23 ).
OTHER PSEUDOINFARCT PATTERNS IN VENTRICULAR OVERLOAD.
Various pseudoinfarct patterns can occur with acute cor pulmonale caused by pulmonary embolism. Acute right ventricular overload in this setting can cause slow R wave progression and sometimes right precordial to midprecordial T wave inversion (formerly referred to as right ventricular “strain”), mimicking anterior ischemia or infarction. The classic S1Q3T3 pattern can occur, but it is
neither sensitive nor specific. A prominent Q wave (usually as part of a QR complex) can also occur in lead aVF along with this pattern (see Fig. 12-24 ). However, acute right overload by itself does not cause a pathological Q wave in lead II. Right heart overload, acute or chronic, may also be associated with a QR complex in lead V1 and simulate anteroseptal infarction.
Pseudoinfarct patterns are an important finding in patients with hypertrophic cardiomyopathy, and the ECG can simulate anterior, inferior, posterior, or lateral infarction. The pathogenesis of depolarization abnormalities in this cardiomyopathy is not certain. Prominent inferolateral Q waves (II, III, aVF, and V4 to V6) and tall right precordial R waves are probably related to increased
depolarization forces generated by the markedly hypertrophied septum ( Fig. 12-47 ). Abnormal septal depolarization can also contribute to bizarre QRS complexes.
Q WAVE PATHOGENESIS WITH MYOCARDIAL DAMAGE.
Loss of electromotive force associated with myocardial necrosis contributes to R wave loss and Q wave formation in cases of myocardial infarction. This mechanism of Q wave pathogenesis, however, is not specific for coronary artery disease with infarction. Any process, acute or chronic, that causes sufficient loss of regional electromotive potential can result in Q waves. For example, replacement of myocardial tissue by electrically inert material such as amyloid or tumor can cause noninfarction Q waves. Various dilated cardiomyopathies associated with extensive myocardial fibrosis can be characterized by pseudoinfarct patterns. Ventricular hypertrophy can also contribute to Q wave pathogenesis in this setting. Finally, Q waves caused by myocardial injury, whether ischemic or nonischemic in origin, can appear transiently and do not necessarily signify irreversible heart muscle damage. Severe ischemia can cause regional loss of electromotive potential without actual cell death (“electrical stunning” phenomenon). Transient conduction disturbances can also cause alterations in ventricular activation and result in noninfarctional Q waves. In some cases, transient Q waves may represent unmasking of a prior Q wave infarct. New but transient Q waves have been described in patients with severe hypotension from various causes, as well as with tachyarrhythmias, myocarditis, Prinzmetal angina, protracted hypoglycemia, phosphorus poisoning, and hyperkalemia.
FRAGMENTED QRS.
Because Q waves are not always present and may regress or even disappear over time, alternative electrocardiographic markers of prior infarction are being evaluated, including a fragmented QRS complex (fQRS).[77] Regions of myocardial scar produce slow and disrupted activation; thus, the QRS morphology in leads overlying the scar may be altered, including the presence of RSR′-type waves or notching of the nadir of an S wave in two or more anatomically contiguous leads with QRS duration less than 120 milliseconds. Preliminary assessment in patients referred for evaluation of possible coronary artery disease has suggested that the visual detection of QRS fragmentation may enhance the sensitivity of conventional electrocardiographic criteria for prior myocardial infarction (MI) in selected groups, although the finding is not as specific as a pathological Q wave.[77] Further investigations in a wide range of populations are required both to confirm initially promising results of these findings and also to develop consistent, replicable definitions of QRS fragmentation.
FIGURE 12-47 Hypertrophic cardiomyopathy simulating inferolateral infarction. This 11-year-old girl had a family history of hypertrophic cardiomyopathy. Note the W-shaped QS waves and the qrS complexes in the inferior and lateral precordial leads. (From Goldberger AL: Myocardial Infarction: Electrocardiographic Differential Diagnosis. 4th ed. St. Louis, Mosby-Year Book, 1991, p 90.)
ST-T Changes Simulating Ischemia
The differential diagnosis of ST segment elevation [54] [57] [78] includes acute pericarditis ( Chap. 70 Fig. 12-48 ), acute myocarditis Chap. 66 , normal variant “early repolarization” (see Fig. 12-16 ), “Takotsubo” cardiomyopathy,[79] Brugada patterns[53] Chap. 9 , and a number of other conditions listed in Table 12-10 . Acute pericarditis, in contrast to acute myocardial infarction, typically induces diffuse ST segment elevation, usually in most of the chest leads and also in leads I, aVL, II, and aVF. Reciprocal ST depression is seen in lead aVR. An important clue to acute pericarditis, in addition to the diffuse nature of the ST elevation, is the frequent presence of PR segment elevation in lead aVR, with reciprocal PR segment depression in other leads, caused by a concomitant atrial current of injury (see Fig. 12-48 ). Abnormal Q waves do not occur with acute pericarditis, and the ST elevation may be
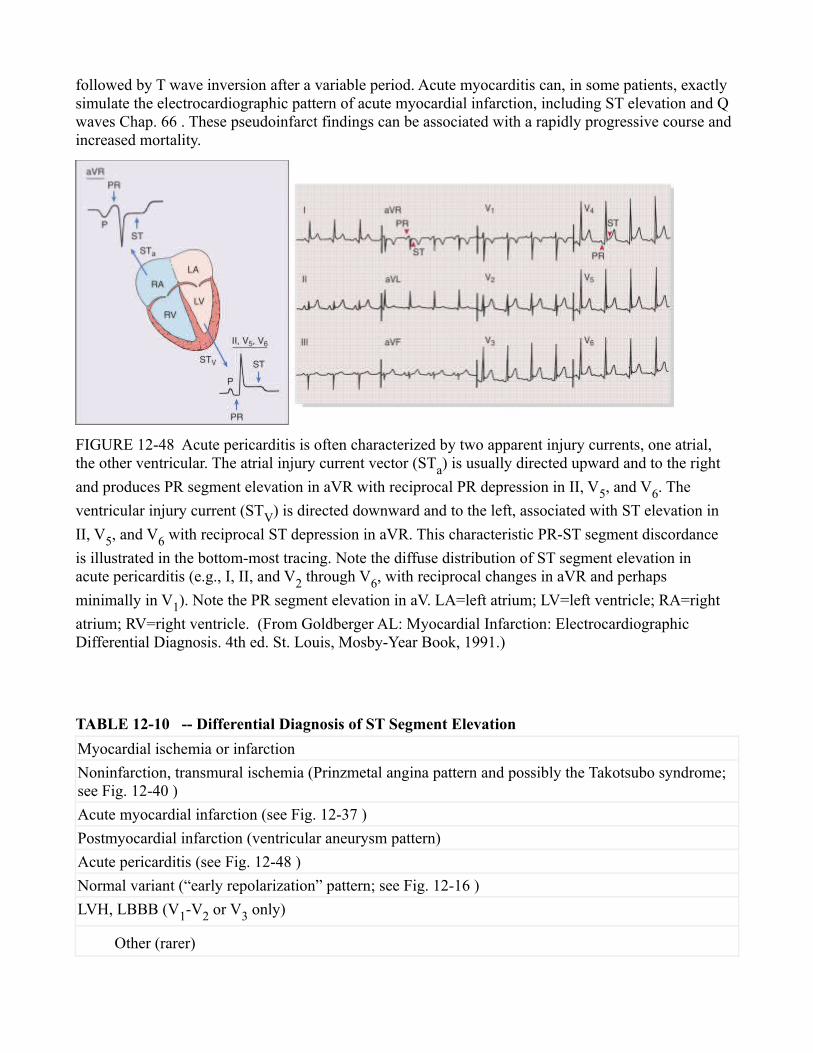
followed by T wave inversion after a variable period. Acute myocarditis can, in some patients, exactly simulate the electrocardiographic pattern of acute myocardial infarction, including ST elevation and Q waves Chap. 66 . These pseudoinfarct findings can be associated with a rapidly progressive course and increased mortality.
FIGURE 12-48 Acute pericarditis is often characterized by two apparent injury currents, one atrial, the other ventricular. The atrial injury current vector (STa) is usually directed upward and to the right
and produces PR segment elevation in aVR with reciprocal PR depression in II, V5, and V6. The
ventricular injury current (STV) is directed downward and to the left, associated with ST elevation in
II, V5, and V6 with reciprocal ST depression in aVR. This characteristic PR-ST segment discordance
is illustrated in the bottom-most tracing. Note the diffuse distribution of ST segment elevation in acute pericarditis (e.g., I, II, and V2 through V6, with reciprocal changes in aVR and perhaps
minimally in V1). Note the PR segment elevation in aV. LA=left atrium; LV=left ventricle; RA=right
atrium; RV=right ventricle. (From Goldberger AL: Myocardial Infarction: Electrocardiographic Differential Diagnosis. 4th ed. St. Louis, Mosby-Year Book, 1991.)
TABLE 12-10 -- Differential Diagnosis of ST Segment Elevation
Myocardial ischemia or infarction
Noninfarction, transmural ischemia (Prinzmetal angina pattern and possibly the Takotsubo syndrome; see Fig. 12-40 )
Acute myocardial infarction (see Fig. 12-37 )
Postmyocardial infarction (ventricular aneurysm pattern)
Acute pericarditis (see Fig. 12-48 )
Normal variant (“early repolarization” pattern; see Fig. 12-16 )
LVH, LBBB (V1-V2 or V3 only)
Other (rarer)
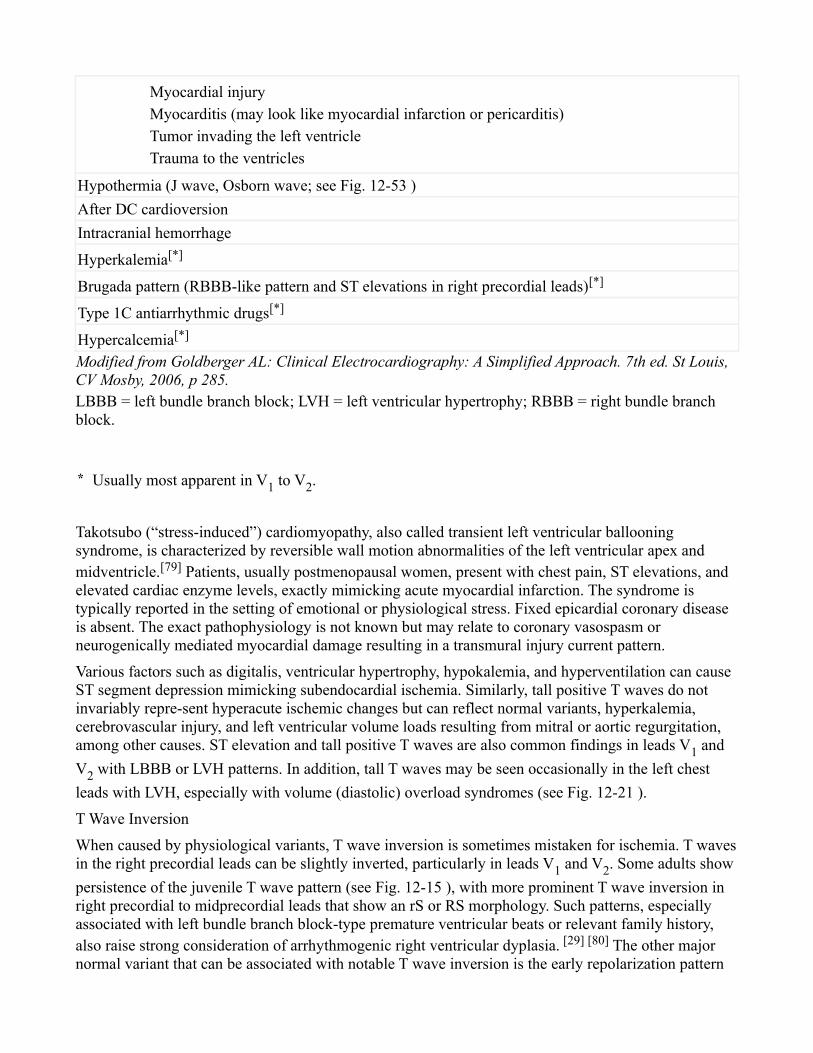
Myocardial injury Myocarditis (may look like myocardial infarction or pericarditis) Tumor invading the left ventricle Trauma to the ventricles
Hypothermia (J wave, Osborn wave; see Fig. 12-53 )
After DC cardioversion
Intracranial hemorrhage
Hyperkalemia[*]
Brugada pattern (RBBB-like pattern and ST elevations in right precordial leads)[*]
Type 1C antiarrhythmic drugs[*]
Hypercalcemia[*]
Modified from Goldberger AL: Clinical Electrocardiography: A Simplified Approach. 7th ed. St Louis, CV Mosby, 2006, p 285.LBBB = left bundle branch block; LVH = left ventricular hypertrophy; RBBB = right bundle branch block.
* Usually most apparent in V1 to V2.
Takotsubo (“stress-induced”) cardiomyopathy, also called transient left ventricular ballooning syndrome, is characterized by reversible wall motion abnormalities of the left ventricular apex and midventricle.[79] Patients, usually postmenopausal women, present with chest pain, ST elevations, and elevated cardiac enzyme levels, exactly mimicking acute myocardial infarction. The syndrome is typically reported in the setting of emotional or physiological stress. Fixed epicardial coronary disease is absent. The exact pathophysiology is not known but may relate to coronary vasospasm or neurogenically mediated myocardial damage resulting in a transmural injury current pattern.
Various factors such as digitalis, ventricular hypertrophy, hypokalemia, and hyperventilation can cause ST segment depression mimicking subendocardial ischemia. Similarly, tall positive T waves do not invariably repre-sent hyperacute ischemic changes but can reflect normal variants, hyperkalemia, cerebrovascular injury, and left ventricular volume loads resulting from mitral or aortic regurgitation, among other causes. ST elevation and tall positive T waves are also common findings in leads V1 and
V2 with LBBB or LVH patterns. In addition, tall T waves may be seen occasionally in the left chest
leads with LVH, especially with volume (diastolic) overload syndromes (see Fig. 12-21 ).
T Wave Inversion
When caused by physiological variants, T wave inversion is sometimes mistaken for ischemia. T waves in the right precordial leads can be slightly inverted, particularly in leads V1 and V2. Some adults show
persistence of the juvenile T wave pattern (see Fig. 12-15 ), with more prominent T wave inversion in right precordial to midprecordial leads that show an rS or RS morphology. Such patterns, especially associated with left bundle branch block-type premature ventricular beats or relevant family history, also raise strong consideration of arrhythmogenic right ventricular dyplasia. [29] [80] The other major normal variant that can be associated with notable T wave inversion is the early repolarization pattern
(see Fig. 12-16 ). Some subjects with this variant have prominent, biphasic T wave inversion in association with the ST elevation. This pattern, which may simulate the initial stages of an evolving infarct, is most prevalent in young African American men and in athletes. These functional ST-T changes are probably caused by regional disparities in repolarization and can be normalized by exercise.
PRIMARY AND SECONDARY T WAVE INVERSIONS.
Various pathological factors can alter repolarization and cause prominent T wave inversion ( Fig. 12-49 ). As noted earlier, T wave alterations are usefully classified as primary or secondary. Primary T wave changes are caused by alterations in the duration or morphology of ventricular action potentials in the absence of changes in the activation sequence. Examples include is-chemia, drug effects, and metabolic factors. Prominent primary T wave inversion (or, in some cases, tall positive T waves) is also a well-described feature of the ECG in cerebrovascular accidents, particularly with subarachnoid hemorrhage Chap. 58 . The so-called cerebrovascular accident T wave pattern is characteristically diffuse, with a widely splayed appearance usually associated with marked QT prolongation (see Fig. 12-49 ). Some studies have implicated structural damage (myocytolysis) in the hearts of patients with such T wave changes, probably induced by excessive sympathetic stimulation mediated via the hypothalamus. A role for concomitant vagal activation in the pathogenesis of such T wave changes, which are usually associated with bradycardia, has also been postulated. Similar T wave changes have been reported after truncal vagotomy, radical neck dissection, and bilateral carotid endarterectomy. In addition, the massive diffuse T wave inversion seen in some patients after Stokes-Adams syncope may be related to a similar neurogenic mechanism. Patients with subarachnoid hemorrhage can also show transient ST elevation, as well as arrhythmias, including torsades de pointes. Ventricular dysfunction can even occur.
In contrast to these primary T wave abnormalities, secondary T wave changes are caused by altered ventricular activation, without changes in action potential characteristics. Examples include bundle branch block, Wolff-Parkinson-White preexcitation, and ventricular ectopic or paced beats. In addition, altered ventricular activation (associated with QRS interval prolongation) can induce persistent T wave changes that appear after normal ventricular depolarization has resumed. The term cardiac memory T wave changes has been used in this context to describe repolarization changes subsequent to depolarization changes caused by ventricular pacing, intermittent LBBB, intermittent Wolff-Parkinson-White preexcitation, and other alterations of ventricular activation Chap. 31 .[81] Finally, the term idiopathic global T wave inversion has been used for cases in which no identifiable cause for often marked, diffuse repolarization abnormalities can be found. An unexplained female preponderance has been reported. Major causes of prominent T wave inversion are summarized in Table 12-11 , with selected examples in Figure 12-49 .
TABLE 12-11 -- Differential Diagnosis of Prominent T Wave Inversion
Normal variants Juvenile T wave pattern (see Fig. 12-15 ) Early repolarization variants (with ST elevation)
Myocardial ischemia or infarction (see Fig. 12-49 )
Cardiomyopathies, including arrhythmogenic right ventricular dysplasia
Cerebrovascular accident (especially intracranial bleeding) and related neurogenic patterns (e.g., radical neck dissection, Stokes-Adams syndrome; see Fig. 12-49 )
Left or right ventricular overload
Classic left or right ventricular hypertrophy, enlargement repolarization abnormalities (formerly called “strain” patterns)
Apical hypertrophic cardiomyopathy (Yamaguchi syndrome; see Fig. 12-49 )
Post-tachycardia T wave pattern
Idiopathic global T wave inversion syndrome
Secondary T wave alterations—bundle branch blocks, Wolff-Parkinson-White patterns
Intermittent left bundle branch block, ventricular preexcitation, or ventricular pacing (“memory T waves”)Modified from Goldberger AL: Clinical Electrocardiography: A Simplified Approach. 7th ed. St Louis, CV Mosby, 2006, p 286.
Drug Effects
Numerous drugs can affect the ECG, often in association with nonspecific ST-T alterations. [54] [55] [81]
More marked changes, as well as AV and intraventricular conduction disturbances, can occur with selected agents Chap. 33 .
The digitalis effect[82] refers to the relatively distinctive “scooped” appearance of the ST-T complex and shortening of the QT interval, which correlates with abbreviation of the ventricular action potential duration ( Fig. 12-50 ). Digitalis-related ST-T changes can be accentuated by an increased heart rate during exercise and result in false-positive stress test results Chap. 13 . The digitalis effect can occur with therapeutic or toxic doses of the drug. The term digitalis toxicity refers specifically to systemic effects (e.g., nausea, anorexia) or conduction disturbances and arrhythmias caused by drug excess or increased sensitivity.
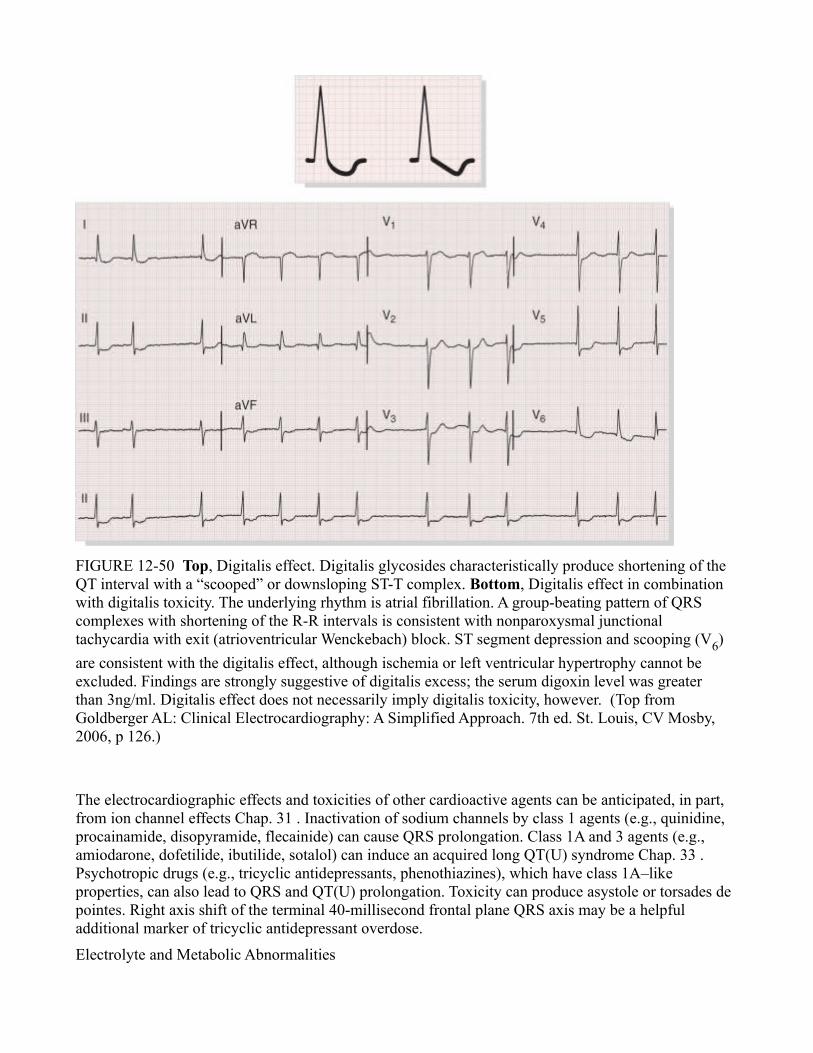
FIGURE 12-50 Top, Digitalis effect. Digitalis glycosides characteristically produce shortening of the QT interval with a “scooped” or downsloping ST-T complex. Bottom, Digitalis effect in combination with digitalis toxicity. The underlying rhythm is atrial fibrillation. A group-beating pattern of QRS complexes with shortening of the R-R intervals is consistent with nonparoxysmal junctional tachycardia with exit (atrioventricular Wenckebach) block. ST segment depression and scooping (V6)
are consistent with the digitalis effect, although ischemia or left ventricular hypertrophy cannot be excluded. Findings are strongly suggestive of digitalis excess; the serum digoxin level was greater than 3ng/ml. Digitalis effect does not necessarily imply digitalis toxicity, however. (Top from Goldberger AL: Clinical Electrocardiography: A Simplified Approach. 7th ed. St. Louis, CV Mosby, 2006, p 126.)
The electrocardiographic effects and toxicities of other cardioactive agents can be anticipated, in part, from ion channel effects Chap. 31 . Inactivation of sodium channels by class 1 agents (e.g., quinidine, procainamide, disopyramide, flecainide) can cause QRS prolongation. Class 1A and 3 agents (e.g., amiodarone, dofetilide, ibutilide, sotalol) can induce an acquired long QT(U) syndrome Chap. 33 . Psychotropic drugs (e.g., tricyclic antidepressants, phenothiazines), which have class 1A–like properties, can also lead to QRS and QT(U) prolongation. Toxicity can produce asystole or torsades de pointes. Right axis shift of the terminal 40-millisecond frontal plane QRS axis may be a helpful additional marker of tricyclic antidepressant overdose.
Electrolyte and Metabolic Abnormalities
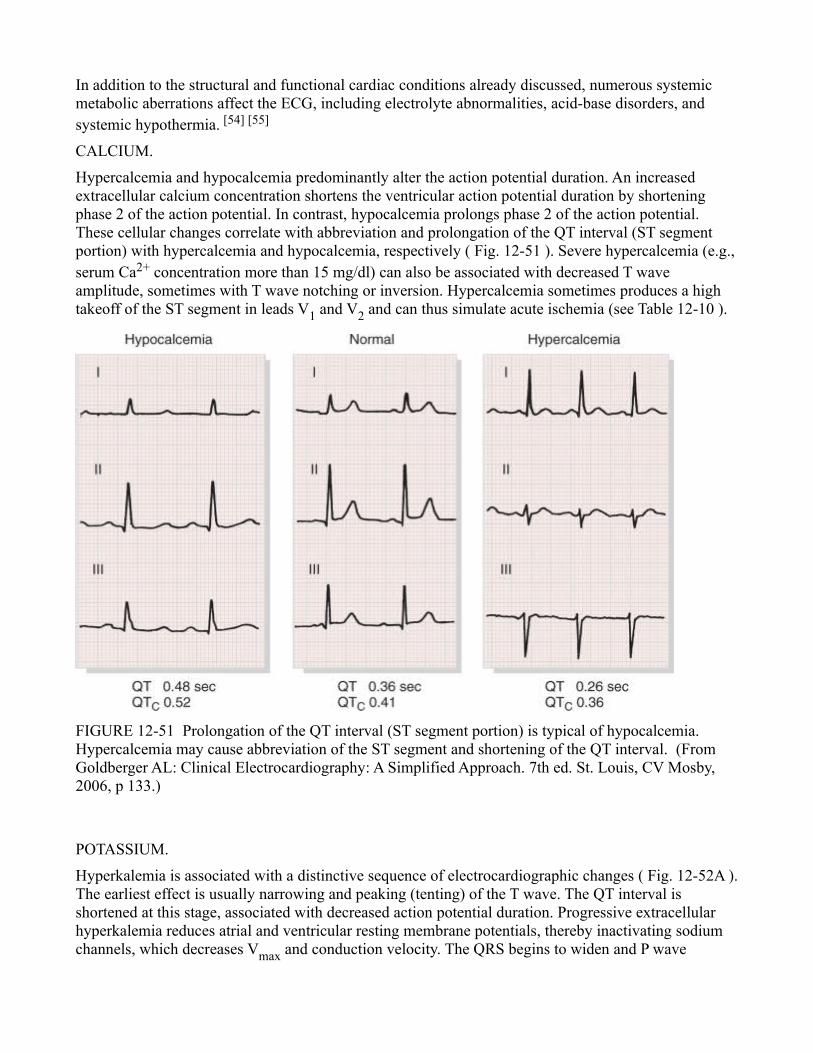
In addition to the structural and functional cardiac conditions already discussed, numerous systemic metabolic aberrations affect the ECG, including electrolyte abnormalities, acid-base disorders, and systemic hypothermia. [54] [55]
CALCIUM.
Hypercalcemia and hypocalcemia predominantly alter the action potential duration. An increased extracellular calcium concentration shortens the ventricular action potential duration by shortening phase 2 of the action potential. In contrast, hypocalcemia prolongs phase 2 of the action potential. These cellular changes correlate with abbreviation and prolongation of the QT interval (ST segment portion) with hypercalcemia and hypocalcemia, respectively ( Fig. 12-51 ). Severe hypercalcemia (e.g., serum Ca2+ concentration more than 15 mg/dl) can also be associated with decreased T wave amplitude, sometimes with T wave notching or inversion. Hypercalcemia sometimes produces a high takeoff of the ST segment in leads V1 and V2 and can thus simulate acute ischemia (see Table 12-10 ).
FIGURE 12-51 Prolongation of the QT interval (ST segment portion) is typical of hypocalcemia. Hypercalcemia may cause abbreviation of the ST segment and shortening of the QT interval. (From Goldberger AL: Clinical Electrocardiography: A Simplified Approach. 7th ed. St. Louis, CV Mosby, 2006, p 133.)
POTASSIUM.
Hyperkalemia is associated with a distinctive sequence of electrocardiographic changes ( Fig. 12-52A ). The earliest effect is usually narrowing and peaking (tenting) of the T wave. The QT interval is shortened at this stage, associated with decreased action potential duration. Progressive extracellular hyperkalemia reduces atrial and ventricular resting membrane potentials, thereby inactivating sodium channels, which decreases Vmax and conduction velocity. The QRS begins to widen and P wave
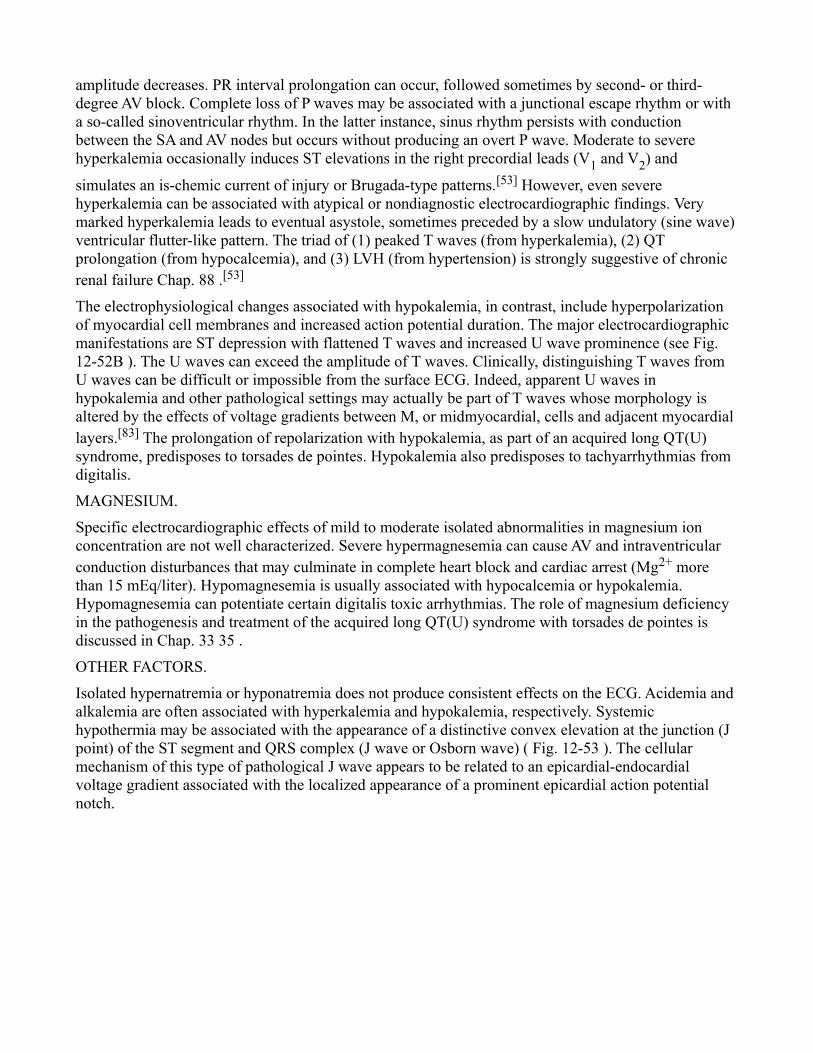
amplitude decreases. PR interval prolongation can occur, followed sometimes by second- or third-degree AV block. Complete loss of P waves may be associated with a junctional escape rhythm or with a so-called sinoventricular rhythm. In the latter instance, sinus rhythm persists with conduction between the SA and AV nodes but occurs without producing an overt P wave. Moderate to severe hyperkalemia occasionally induces ST elevations in the right precordial leads (V1 and V2) and
simulates an is-chemic current of injury or Brugada-type patterns.[53] However, even severe hyperkalemia can be associated with atypical or nondiagnostic electrocardiographic findings. Very marked hyperkalemia leads to eventual asystole, sometimes preceded by a slow undulatory (sine wave) ventricular flutter-like pattern. The triad of (1) peaked T waves (from hyperkalemia), (2) QT prolongation (from hypocalcemia), and (3) LVH (from hypertension) is strongly suggestive of chronic renal failure Chap. 88 .[53]
The electrophysiological changes associated with hypokalemia, in contrast, include hyperpolarization of myocardial cell membranes and increased action potential duration. The major electrocardiographic manifestations are ST depression with flattened T waves and increased U wave prominence (see Fig. 12-52B ). The U waves can exceed the amplitude of T waves. Clinically, distinguishing T waves from U waves can be difficult or impossible from the surface ECG. Indeed, apparent U waves in hypokalemia and other pathological settings may actually be part of T waves whose morphology is altered by the effects of voltage gradients between M, or midmyocardial, cells and adjacent myocardial layers.[83] The prolongation of repolarization with hypokalemia, as part of an acquired long QT(U) syndrome, predisposes to torsades de pointes. Hypokalemia also predisposes to tachyarrhythmias from digitalis.
MAGNESIUM.
Specific electrocardiographic effects of mild to moderate isolated abnormalities in magnesium ion concentration are not well characterized. Severe hypermagnesemia can cause AV and intraventricular conduction disturbances that may culminate in complete heart block and cardiac arrest (Mg2+ more than 15 mEq/liter). Hypomagnesemia is usually associated with hypocalcemia or hypokalemia. Hypomagnesemia can potentiate certain digitalis toxic arrhythmias. The role of magnesium deficiency in the pathogenesis and treatment of the acquired long QT(U) syndrome with torsades de pointes is discussed in Chap. 33 35 .
OTHER FACTORS.
Isolated hypernatremia or hyponatremia does not produce consistent effects on the ECG. Acidemia and alkalemia are often associated with hyperkalemia and hypokalemia, respectively. Systemic hypothermia may be associated with the appearance of a distinctive convex elevation at the junction (J point) of the ST segment and QRS complex (J wave or Osborn wave) ( Fig. 12-53 ). The cellular mechanism of this type of pathological J wave appears to be related to an epicardial-endocardial voltage gradient associated with the localized appearance of a prominent epicardial action potential notch.
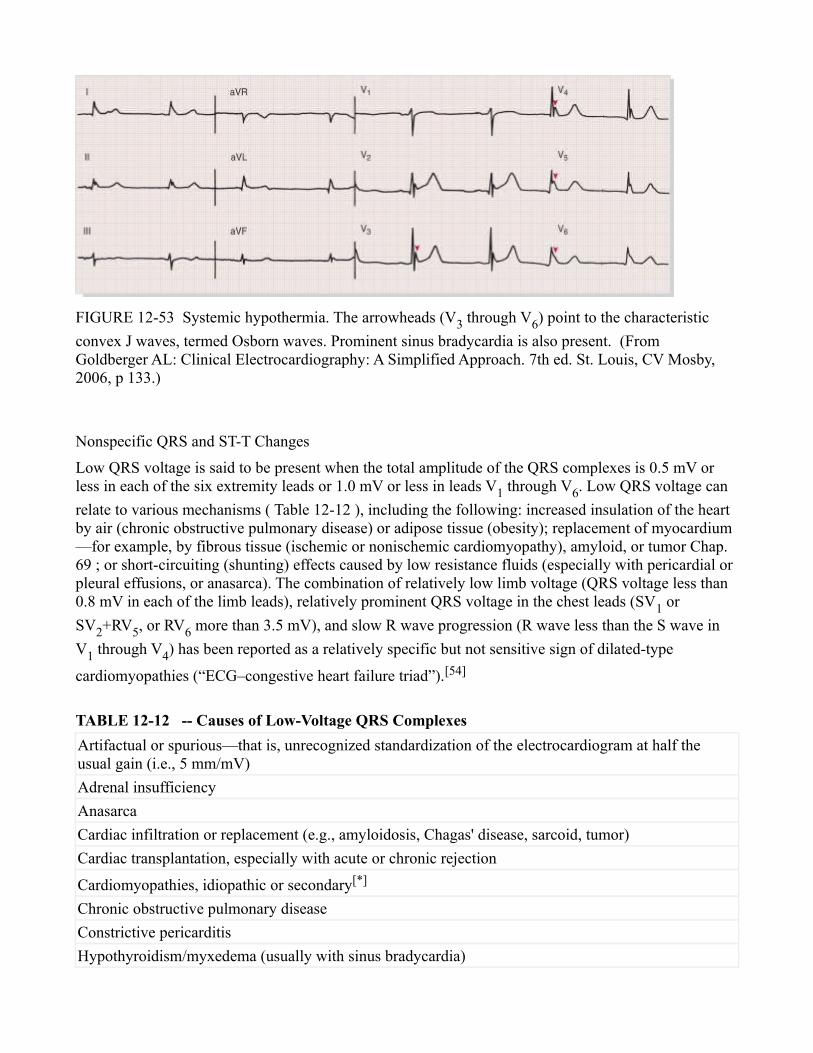
FIGURE 12-53 Systemic hypothermia. The arrowheads (V3 through V6) point to the characteristic
convex J waves, termed Osborn waves. Prominent sinus bradycardia is also present. (From Goldberger AL: Clinical Electrocardiography: A Simplified Approach. 7th ed. St. Louis, CV Mosby, 2006, p 133.)
Nonspecific QRS and ST-T Changes
Low QRS voltage is said to be present when the total amplitude of the QRS complexes is 0.5 mV or less in each of the six extremity leads or 1.0 mV or less in leads V1 through V6. Low QRS voltage can
relate to various mechanisms ( Table 12-12 ), including the following: increased insulation of the heart by air (chronic obstructive pulmonary disease) or adipose tissue (obesity); replacement of myocardium—for example, by fibrous tissue (ischemic or nonischemic cardiomyopathy), amyloid, or tumor Chap. 69 ; or short-circuiting (shunting) effects caused by low resistance fluids (especially with pericardial or pleural effusions, or anasarca). The combination of relatively low limb voltage (QRS voltage less than 0.8 mV in each of the limb leads), relatively prominent QRS voltage in the chest leads (SV1 or
SV2+RV5, or RV6 more than 3.5 mV), and slow R wave progression (R wave less than the S wave in
V1 through V4) has been reported as a relatively specific but not sensitive sign of dilated-type
cardiomyopathies (“ECG–congestive heart failure triad”).[54]
TABLE 12-12 -- Causes of Low-Voltage QRS Complexes
Artifactual or spurious—that is, unrecognized standardization of the electrocardiogram at half the usual gain (i.e., 5 mm/mV)
Adrenal insufficiency
Anasarca
Cardiac infiltration or replacement (e.g., amyloidosis, Chagas' disease, sarcoid, tumor)
Cardiac transplantation, especially with acute or chronic rejection
Cardiomyopathies, idiopathic or secondary[*]
Chronic obstructive pulmonary disease
Constrictive pericarditis
Hypothyroidism/myxedema (usually with sinus bradycardia)
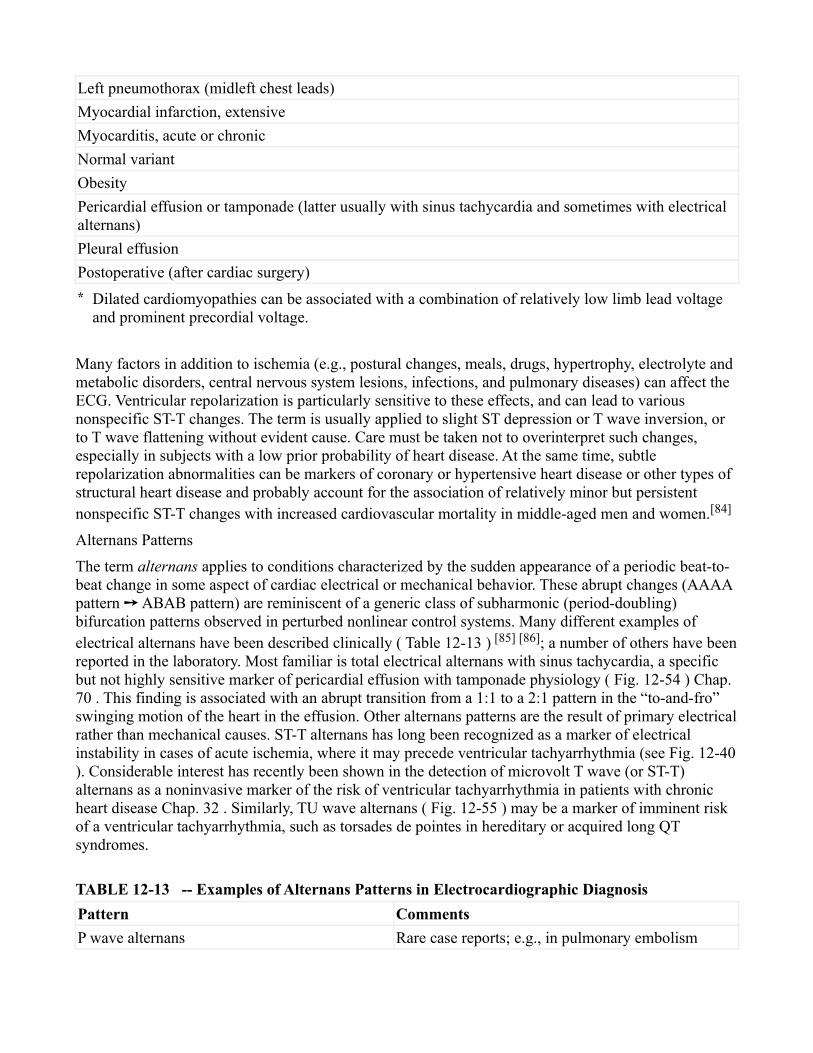
Left pneumothorax (midleft chest leads)
Myocardial infarction, extensive
Myocarditis, acute or chronic
Normal variant
Obesity
Pericardial effusion or tamponade (latter usually with sinus tachycardia and sometimes with electrical alternans)
Pleural effusion
Postoperative (after cardiac surgery)
* Dilated cardiomyopathies can be associated with a combination of relatively low limb lead voltage and prominent precordial voltage.
Many factors in addition to ischemia (e.g., postural changes, meals, drugs, hypertrophy, electrolyte and metabolic disorders, central nervous system lesions, infections, and pulmonary diseases) can affect the ECG. Ventricular repolarization is particularly sensitive to these effects, and can lead to various nonspecific ST-T changes. The term is usually applied to slight ST depression or T wave inversion, or to T wave flattening without evident cause. Care must be taken not to overinterpret such changes, especially in subjects with a low prior probability of heart disease. At the same time, subtle repolarization abnormalities can be markers of coronary or hypertensive heart disease or other types of structural heart disease and probably account for the association of relatively minor but persistent nonspecific ST-T changes with increased cardiovascular mortality in middle-aged men and women.[84]
Alternans Patterns
The term alternans applies to conditions characterized by the sudden appearance of a periodic beat-to-beat change in some aspect of cardiac electrical or mechanical behavior. These abrupt changes (AAAA pattern ABAB pattern) are reminiscent of a generic class of subharmonic (period-doubling)➙ bifurcation patterns observed in perturbed nonlinear control systems. Many different examples of electrical alternans have been described clinically ( Table 12-13 ) [85] [86]; a number of others have been reported in the laboratory. Most familiar is total electrical alternans with sinus tachycardia, a specific but not highly sensitive marker of pericardial effusion with tamponade physiology ( Fig. 12-54 ) Chap. 70 . This finding is associated with an abrupt transition from a 1:1 to a 2:1 pattern in the “to-and-fro” swinging motion of the heart in the effusion. Other alternans patterns are the result of primary electrical rather than mechanical causes. ST-T alternans has long been recognized as a marker of electrical instability in cases of acute ischemia, where it may precede ventricular tachyarrhythmia (see Fig. 12-40 ). Considerable interest has recently been shown in the detection of microvolt T wave (or ST-T) alternans as a noninvasive marker of the risk of ventricular tachyarrhythmia in patients with chronic heart disease Chap. 32 . Similarly, TU wave alternans ( Fig. 12-55 ) may be a marker of imminent risk of a ventricular tachyarrhythmia, such as torsades de pointes in hereditary or acquired long QT syndromes.
TABLE 12-13 -- Examples of Alternans Patterns in Electrocardiographic Diagnosis
Pattern Comments
P wave alternans Rare case reports; e.g., in pulmonary embolism
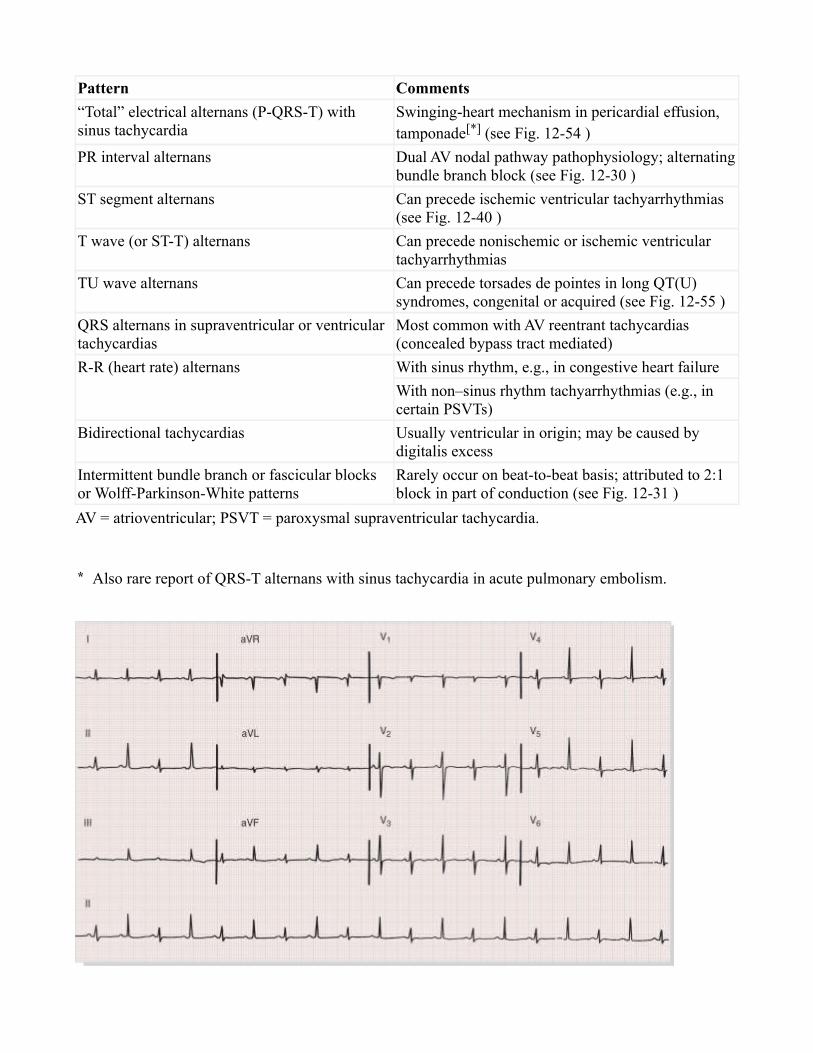
Pattern Comments
“Total” electrical alternans (P-QRS-T) with sinus tachycardia
Swinging-heart mechanism in pericardial effusion, tamponade[*] (see Fig. 12-54 )
PR interval alternans Dual AV nodal pathway pathophysiology; alternating bundle branch block (see Fig. 12-30 )
ST segment alternans Can precede ischemic ventricular tachyarrhythmias (see Fig. 12-40 )
T wave (or ST-T) alternans Can precede nonischemic or ischemic ventricular tachyarrhythmias
TU wave alternans Can precede torsades de pointes in long QT(U) syndromes, congenital or acquired (see Fig. 12-55 )
QRS alternans in supraventricular or ventricular tachycardias
Most common with AV reentrant tachycardias (concealed bypass tract mediated)
R-R (heart rate) alternans With sinus rhythm, e.g., in congestive heart failure
With non–sinus rhythm tachyarrhythmias (e.g., in certain PSVTs)
Bidirectional tachycardias Usually ventricular in origin; may be caused by digitalis excess
Intermittent bundle branch or fascicular blocks or Wolff-Parkinson-White patterns
Rarely occur on beat-to-beat basis; attributed to 2:1 block in part of conduction (see Fig. 12-31 )
AV = atrioventricular; PSVT = paroxysmal supraventricular tachycardia.
* Also rare report of QRS-T alternans with sinus tachycardia in acute pulmonary embolism.
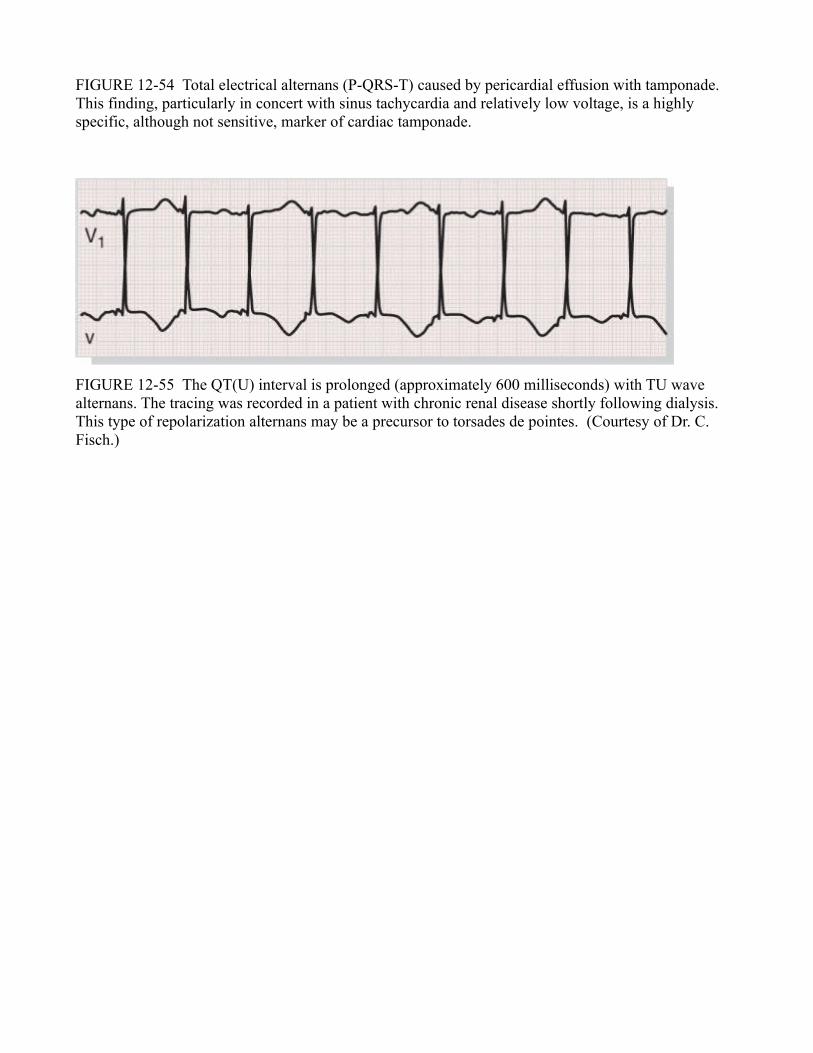
FIGURE 12-54 Total electrical alternans (P-QRS-T) caused by pericardial effusion with tamponade. This finding, particularly in concert with sinus tachycardia and relatively low voltage, is a highly specific, although not sensitive, marker of cardiac tamponade.
FIGURE 12-55 The QT(U) interval is prolonged (approximately 600 milliseconds) with TU wave alternans. The tracing was recorded in a patient with chronic renal disease shortly following dialysis. This type of repolarization alternans may be a precursor to torsades de pointes. (Courtesy of Dr. C. Fisch.)
![Dysrhythmias (002) [Read-Only] - Aventri · Atrial AV node Ventricular Classification of Rhythm Abnormalities Supraventricular Atrial origin Atrial fibrillation Atrial flutter Atrial](https://static.fdocuments.us/doc/165x107/5f024baa7e708231d4038f22/dysrhythmias-002-read-only-aventri-atrial-av-node-ventricular-classification.jpg)