Liar Liar: Experimental evidence of the e ect of...
51
Liar Liar: Experimental evidence of the effect of confirmation-reports on dishonesty. Denvil Duncan * Danyang Li † September 30, 2016 Abstract We identify the effect of confirmation-reports on dishonesty using data from an experiment where subjects are asked to roll a die and report its outcome using either a self-report or confirmation-report mechanism. We find that relative to self- reports, confirmation-reports have a positive effect on the share of subjects who report honestly. The effect on the magnitude of lies told depends greatly on the accuracy of the pre-filled information on the confirmation-report. We argue that these results are driven by changes in the intrinsic costs of lying induced by the confirmation report. JEL Classification: C93; D82; H26 Keywords: Self-report, confirmation-reports, dishonesty, field-experiment * Corresponding author: Denvil Duncan, School of Public and Environmental Affairs, Indiana Univer- sity, SPEA 239, 1315 East 10th Street, Bloomington, Indiana 47403, U.S.A. (email: duncande@indiana. edu, phone: 812-855-7493). † Danyang Li, Department of Economics, Hofstra University, Barnard Hall 200E, Hempstead, NY 11549 USA. (email: [email protected], phone: 516-463-5599)
Transcript of Liar Liar: Experimental evidence of the e ect of...
Liar Liar: Experimental evidence of theeffect of confirmation-reports on dishonesty.
Denvil Duncan∗ Danyang Li†
September 30, 2016
Abstract
We identify the effect of confirmation-reports on dishonesty using data from anexperiment where subjects are asked to roll a die and report its outcome usingeither a self-report or confirmation-report mechanism. We find that relative to self-reports, confirmation-reports have a positive effect on the share of subjects whoreport honestly. The effect on the magnitude of lies told depends greatly on theaccuracy of the pre-filled information on the confirmation-report. We argue thatthese results are driven by changes in the intrinsic costs of lying induced by theconfirmation report.
JEL Classification: C93; D82; H26Keywords: Self-report, confirmation-reports, dishonesty, field-experiment
∗Corresponding author: Denvil Duncan, School of Public and Environmental Affairs, Indiana Univer-sity, SPEA 239, 1315 East 10th Street, Bloomington, Indiana 47403, U.S.A. (email: [email protected], phone: 812-855-7493).†Danyang Li, Department of Economics, Hofstra University, Barnard Hall 200E, Hempstead, NY
11549 USA. (email: [email protected], phone: 516-463-5599)
1 Introduction
People often choose to misreport their private information in order to improve their own
monetary payoffs. Common examples include used-car markets, auto-insurance, and tax
returns. This behavior often occurs in response to one of two types of request for infor-
mation. An individual may be asked to provide a self-report (e.g., what is your taxable
income?) or a confirmation-report (e.g., is your taxable income $50,000?). Because
both requests ask for the same information - the person’s taxable income -, we would
expect a person’s response to be independent of the form of the request. However, to
the extent that intrinsic lying costs are affected by the form of information request, we
speculate that dishonesty will be different between self-reports and confirmation-reports.1
Confirmation-reports may affect several sources of intrinsic lying costs including moral-
lying costs (how I see my self), social-lying costs related to changes in perception of the
requester’s information set (how others see me), and lying costs related to the mental
burden of devising a lie.
Despite a very extensive literature on lying, there is very little empirical evidence on
the relative effect of these two types of reports on dishonesty (see discussion below). We
contribute to the literature by identifying the effect of confirmation-reports on dishonesty.
We answer the following specific research questions; are people more likely to respond
honestly to confirmation-reports than self-reports? Also, do confirmation-reports affect
the magnitude of lies told? Because it is difficult to observe lying in historical data, we
answer our research questions with data collected from a field-experiment. We follow
the traditional dishonesty literature in that we ask subjects to report the outcome of a
six-sided die roll (Fischbacher and Follmi-Heusi 2013; Ruffle and Tobol 2014; Hao and
Houser 2013). Both the roll and reporting are done in private with no opportunity for
either action to be observed by the experimenter. Subjects are paid according to their
reported outcome, and their pay-offs are increasing in the reported die roll; with the
exception of six, which receives a pay-off of zero. Therefore, subjects have an incentive to
lie. Over 1, 400 subjects are recruited from Amazon’s mechanical turk, and are randomly
assigned to one of seven groups. Subjects in group one are asked to make a self-report,
while subjects in the remaining groups are asked to respond to a confirmation-report.
The confirmation-reports are pre-filled with a number between one and six, depending
on the group, and subjects can either accept the report or reject it. Those who reject the
1Recent empirical evidence shows that intrinsic lying costs matter (Fischbacher and Follmi-Heusi2013; Ruffle and Tobol 2014; Abeler et al. 2014; Gneezy 2005), and that these lying costs can bemanipulated in order to affect dishonesty (Shu et al. 2012; Erat 2013; Conrads et al. 2013). The formof information request will most certainly affect dishonesty via changes in extrinsic costs. For example,the pre-filled information on a confirmation-report might affect the respondent’s subjective assessmentof the probability of being caught and thus the resulting expected penalty (an extrinsic cost of lying).We emphasize intrinsic-lying costs here because our analysis takes place in a context that is devoid ofany extrinsic costs.
1
report are given the opportunity to report any other number between 1 and 6.
We find evidence that confirmation-reports increase honesty when we pool the data
from the confirmation treatments. The share of honest subjects is 44 percent in the
self-report treatment compared to 63 percent in the pooled-confirmation treatment. This
suggests that approximately 19 percentage points of the subjects in our sample are con-
ditionally honest. There does not appear to be any effect on the share of maximal
liars in the pooled data; 15 percent and 18 percent in self and confirmation reports, re-
spectively. Looking at each confirmation treatment separately reveals some important
findings. First, the share of honest subjects in the confirmation-report treatments is al-
ways greater than in the self-report treatment; the effect ranges from 5 percentage points
to 18 percentage points. This suggests, if anything, that confirmation-reports have a
positive extrinsic-margin effect. Second, we find that the effect on the magnitude of lies
told (intrinsic-margin) depends on the accuracy of the pre-filled number. At one extreme,
asking subjects to confirm rolling a six, which has a pay-off of zero, increases the share
of zeroes by approximately eight percentage points and reduces the share of threes and
fours by three percentage points each; there is no effect on the share of fives. At the other
extreme, asking subjects to confirm rolling a five, which has the highest pay-off, increases
the share of subjects who lie maximally by approximately seven percentage points, while
reducing the shares of ones and fours by four percentage points, respectively. Lastly,
we find that females are more honest than males, and that females are less likely to lie
maximally under the confirmation report while there is no effect on maximal lying among
males.
Given the design of our experiment, we argue that these results are driven by
intrinsic costs broadly defined to include moral lying-costs and lying costs related to the
mental burden of whether or not and how much to lie. First, we argue that an accurately
pre-filled confirmation-report increases moral lying-costs and thus reduces dishonesty
since subjects who face an accurate confirmation-report must reject the true report and
then file a false report. Concurrently, a favorably inaccurate pre-filled confirmation-
report reduces moral lying-costs and thus increases dishonesty since subjects can ‘shift’
the burden of lying onto the person who prepared the form. Second, the decision to
lie is mentally burdensome since it generally involves two steps; the person must decide
1) whether or not to lie and 2) the magnitude of the lie she wants to tell. The mental
burden associated with these decisions is likely to be especially high given that liars
generally want to maintain the perception of honesty (Greenberg et al. 2015; Hao and
Houser 2013). In cases like these, people often turn to rules-of-thumb, which makes them
susceptible to decision-making biases. Therefore, a subject might more readily accept an
accurate or favorably inaccurate confirmation-report because it is easier than having to
make the lying decision herself.
2
The presence of pre-filled information on confirmation-reports might also change
respondents’ beliefs about the requester’s information set.2 Therefore, it is also possible
that our results are partly driven by another type of intrinsic cost related to the shame
of being identified as a liar. However, the experiment is conducted in the field, and while
subjects know they are participating in an academic study, they do not know that the
die-rolling exercise is part of an experiment. Furthermore, we emphasize the fact that
we have no way of observing their die roll. This suggests that our results are not being
driven by such social costs related to changes in perception about the experimenters’
information set.
Our paper makes several contributions to the academic literature and policy dis-
cussions. First, to our knowledge, we are the first to identify the effect of confirmation-
reports on dishonesty in an environment where extrinsic costs do not matter. Fonseca
and Grimshaw (2015) and Kotakorpi and Laamanen (2015) estimate the compliance ef-
fect of administering an income tax with pre-populated tax forms rather than blank tax
forms using data from a field experiment and a natural experiment, respectively.3 Both
studies find that a favorably inaccurate pre-filled tax form increases noncompliance on
the non-pre-filled items. This finding is similar to our result where overstating the out-
come of the die roll increases the share of subjects who confirm that die roll. Because
these studies focus on tax evasion, the observed responses are driven by both extrin-
sic (audit and fine) and intrinsic costs. Unlike these two papers, we are able to show
that confirmation-reports affect dishonesty even in the absence of extrinsic costs. This is
particularly important in the context of tax evasion where existing evidence shows that
compliance is generally much higher than can be explained by extrinsic costs alone (Alm
2012). Our results suggest that pre-populated tax forms are likely to influence compliance
by changing the intrinsic motivations for paying taxes.
We also add to the extensive literature on lying. Existing studies have explored
several important aspects of dishonesty including the role of shame (Greenberg et al.
2015), guilt (Battigalli et al. 2013; Charness and Dufwenberg 2006), gender (Dreber and
Johannesson 2008; Muehlheusser et al. 2015), magnitude of pay-off (Fischbacher and
Follmi-Heusi 2013; Suri et al. 2011), time preference (Ruffle and Tobol 2014), education
(Ruffle and Tobol 2016), morality (Shu et al. 2012), and lying costs more broadly (Abeler
et al. 2014; Gneezy 2005; Kajackaite and Gneezy 2015). A common feature of all of these
2On the one hand, a correctly pre-filled report might cause people to believe that their privateinformation is known to the requester. In this case, the social cost of lying increases because the personbelieves her decision to be dishonest will be observed by the requester; i.e., she will be a known liar. Onthe other hand, an inaccurate confirmation-report might confirm the respondents belief that the requesterdoes not know the respondents’ true information. In this case, the social cost of lying decreases becausethe decision to lie remains unknown to the requester.
3Pre-populated tax forms require taxpayers to complete their annual tax reconciliation by filing aform that is pre-filled with information available to the tax administrator, and is therefore comparableto a confirmation-report.
3
studies is that they depend on subjects making self-reports using blank forms. We add to
this literature by showing that the form of the request matters. Requesting information
via confirmation-reports influences lying costs and thus increases or decreases dishonesty
depending on the accuracy of the pre-filled information on the reports. This finding is
similar to studies that show that dishonesty can be influenced by changing lying costs
either by having people commit to telling the truth (Shu et al. 2012), delegating the
reporting responsibility (Erat 2013) or team incentives (Conrads et al. 2013).
Understanding the effect of self and confirmation reports on dishonesty is important
for everyday life. It is particularly relevant in instances where people are hoping to
obtain correct information but the provider faces little or no extrinsic costs. For example,
used-car markets and students giving excuses for missing exams or assignments. Other
applications include state-provided services for which there are no penalties for lying.4
There is also an obvious application to tax administration.5 However, we are careful in
extrapolating our results to this context because cheating on taxes is a risky decision
that includes extrinsic costs. Still, our results suggest that the type of form used in the
reconciliation process matters for compliance, and that the effect of the form will depend
crucially on the accuracy of the information available to the administrator. Therefore,
our findings support the strategy of limiting pre-populated tax-forms to taxpayers whose
income sources are easily verifiable.6
The remainder of the paper is organized as follows. First we describe the experi-
mental design. This is followed by a description of our results, discussion and conclusion.
2 Design and Implementation
Our primary objective is to determine if, relative to self-reports, confirmation-reports
lead to more liars and larger lies in a context where extrinsic costs do not matter. This
section describes the experimental design used to answer our research question.
4One example would be parks for which entry fees are conditional on location of residence. Example,the Eagle Creek Park in Indianapolis, Indiana charges a lower fee for residence of Marion county. However,there is no process in place to verify patrons’ county of residence.
5While most tax administrators implement tax reconciliations with blank-tax forms, others use pre-populated forms. Pre-populated tax forms are used in Finland, Denmark, Sweden, Norway. The UKis currently considering the adoption of pre-populated tax forms. Although there has been discussionsabout the merits of a pre-populated tax form in the US, the State of California is the only US governmentto have implemented them under their ready-return initiative. ReadyReturn has since been cancelled,but its primary feature – prepopulating tax forms with pre-existing information – is still available withCalFile.
6Of course, this strategy does not preclude the possibility of increased non-compliance among taxpay-ers who have only verifiable income in the current period, but earn income from non-verifiable sourcesin the future. Confirmation-reports could also increase noncompliance by inducing taxpayers to reducetheir verifiable income and increase their non-verifiable income.
4
2.1 Experimental Design
The experiment is completed in two steps. First, we instruct subjects to roll a six-sided
die and make a note of the number thrown on their first attempt. Subjects are told that
they can throw the die as many times as they want, but only the first throw counts.
Second, subjects are asked to report the outcome of their die roll. The subjects are told
that we have no way of knowing the outcome of the die roll, and that their payment
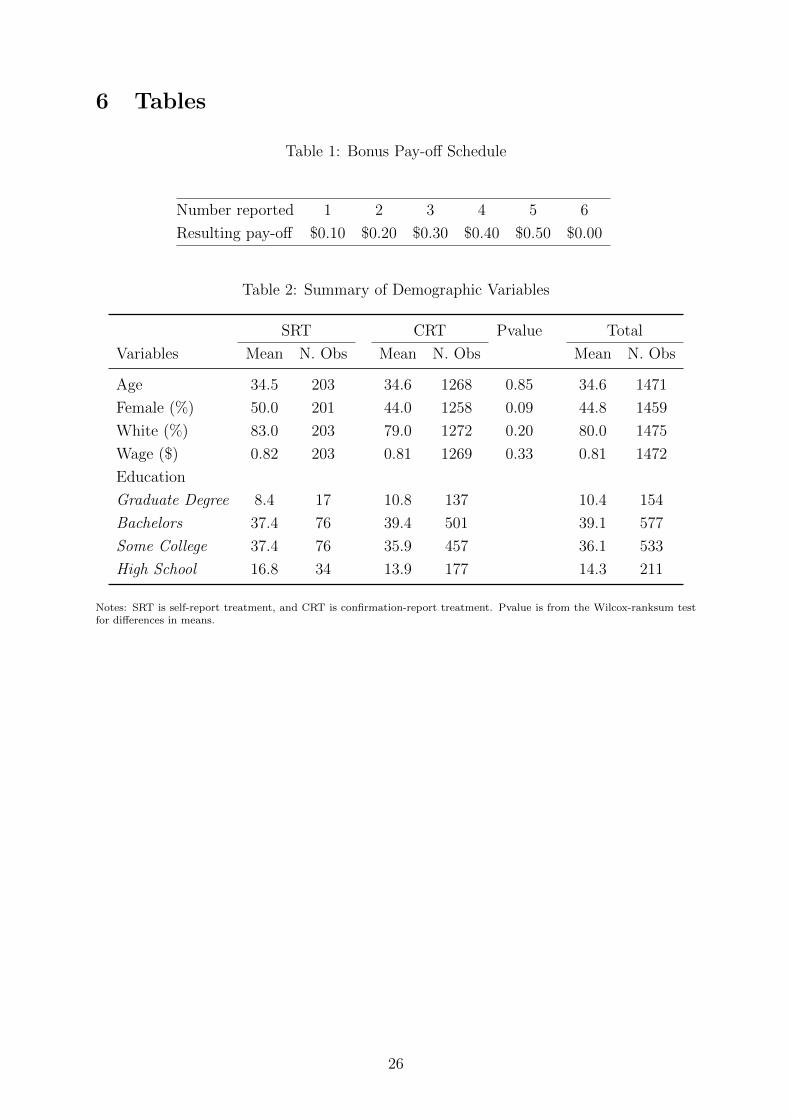
will be based solely on the number they report following the schedule in Table 1.7 The
information in Table 1 is shown to the subjects twice; when they read the instructions
for the experiment and again when they make their reporting decisions.
This design conforms with the previous literature; e.g., Fischbacher and Follmi-
Heusi (2013), Ruffle and Tobol (2014). The main difference between our design and that
of the existing literature is in the way subjects are asked to report the outcome of the
die roll. The previous literature simply asked subjects to self-report the outcome of the
die roll. We add to this by also asking some subjects to provide confirmation-reports.
Subjects are randomly assigned to one of seven groups; one self-report treatment and six
confirmation-report treatments. The only difference between the self-report treatment
and the confirmation-report treatment is in step two where subjects are asked to report
the die roll outcome.
Self-Report Treatment. Subjects in the Self Report Treatment (SRT) are shown an
empty text box and are asked to report the outcome of their first die roll (see Figure 2).
We again show subjects Table 1 so that the relationship between the reported number
and the bonus payment remains salient. We also remind them that we have no way of
knowing the number that they actually rolled on the die. The session ends when a subject
submits the reported die roll.
Confirmation-Report Treatment. Subjects in the Confirmation Report Treatments
(CRT) are randomly assigned to one of six sub-groups. Subjects in each group are shown
a text box that is pre-filled with a fixed number; either 1, 2, 3, 4, 5 or 6 depending on
their assigned group (see Figure 3). In other words, every subject assigned to CRT0 is
shown a text box that is pre-filled with the number 6. Similarly, every subject assigned
to CRT5 is shown a text box that is pre-filled with the number 5, and so on. Subjects
are asked to confirm whether the pre-filled number is the number on the face of their
first die roll. The pre-filled number is reported and the session ends if they respond ‘yes’.
Subjects who respond ‘no’ are given an opportunity to self-report a different number.
7Notice that the payment for rolling a six is zero as in Fischbacher and Follmi-Heusi (2013). Becausethe pay-off for rolling a six is zero, we recode the outcome six to be zero. This adjustment is made tothe data for all tables and figures reported in the paper.
5
We use a between-subject design, where each subject only participates in one of the
seven treatments. Each session of the experiment is a one-shot game.
2.2 Implementation
Because the design is simple and can be completed in only a few minutes, we implement
the experiment online with the aid of Amazon’s Mechanical Turk (Mturk).8 Mturk is
an online labor market where job offers are posted and workers choose jobs for payment.
It has numerous benefits for running experiments, including access to a large stable
subject pool, diverse subject background, and low costs (Mason and Suri 2012; Horton
and Chilton 2010; Paolacci et al. 2010). Furthermore, the behavior of online workers
has been shown to be comparable to those of subjects in laboratory studies (Buhrmester
et al. 2011; Paolacci et al. 2010; Horton et al. 2011; Suri et al. 2011).
We create a survey-based human intelligence task (HIT) on Mturk (see Figure 1)
and provide a link to our own website where subjects are able to complete the survey
and a bonus task.9 Following the survey, subjects are asked to complete a bonus task,
which involves rolling a six-sided die and reporting the outcome. They are told that the
amount of the bonus payment is determined by the reported die roll according to Table
1. A link to the website random.org, which allows people to roll virtual die, is embedded
into our website. Subjects are instructed to click on the link in order to roll the die, and
to return to our website to report the outcome of the die roll. We make it explicitly clear
that our website is not affiliated with random.org, so the actual outcome of the die roll
is not known to us. Subjects are told that we can only observe the number that they
report on our website. Subjects are shown an ID code after submitting their reported
die roll, and are told to report this code on the Mturk website in order for us to process
their bonus payment.
Mturk is especially advantageous for our study because subjects can be assured
that we have no way of telling whether they are lying or not. Subjects complete the
tasks in their own environment immune to the influence from other participants or the
experimenters. Therefore, the design does not involve any social interactions. Addition-
ally, the experiment does not include a compliance mechanism; i.e., no audit, no penalty,
and no opportunity for the experimenter to observe a subject’s actions. This implies
that the actual and expected extrinsic costs of lying are zero. We argue that these two
characteristics of the experimental design implies that the decision to be dishonest in our
8Subjects took an average of 9 minutes to complete both stages of the experiment, and 50% of subjectscompleted the experiment in less than 5 minutes and 20 seconds.
9We created the external website for the sole purpose of hosting the survey and bonus task. Thesurvey includes questions about road mileage user-fees, number of miles driven, age, gender, race, andeducation. Subjects are paid a flat participation fee for completing the survey. The experiment was donein December 2015 and January of 2016.
6
experiment depends only on a tradeoff between the external monetary benefits and the
internal costs of the dishonest act.
3 Results
This section begins with a description of our data. We then describe dishonesty in the
self-report treatment, which serves as our baseline. Next we describe dishonesty in the
confirmation-report treatments. We then describe additional analyses that account for
gender effects as well as dishonesty among subjects whom we know rolled the virtual die
versus those who probably did not roll the die.
3.1 Data
Summary Statistics A total of 1475 subjects participated in the experiment; 203 in
the Self-Report Treatment and 1272 in the Confirmation-Report Treatment. Subjects
took an average of 9 minutes to complete the survey and bonus task, and were paid an
average of $0.81; this is equivalent to an hourly wage of approximately $5.40. Our hourly
wage is comparable to that of other surveys conducted on Mturk (e.g., Kuziemko et al.
(2015) paid $6.00 per hour), and much higher than the estimated reservation wage of
Mturk workers; $1.38 (Horton and Chilton 2010). Further, the average effective hourly
wage on Mturk is estimated to be $4.80 according to Amazon.
Table 2 shows that the two treatments are balanced with respect to age, race,
and education. The self-report treatment has slightly more females compared to the
confirmation-report treatment, but the difference is only marginally different from zero
at the 10% level (Wilcox ranksum test pvalue =0.092).
Uniformity of Random.org Since subjects rolled a virtual die through random.org,
it is important to establish that the virtual die on this website is fair. Because each group
has 203 to 225 observations, we provide evidence that the virtual die is fair by collecting
the outcome of approximately 210 die rolls from random.org and present the resulting
distribution in Figure 4. The evidence presented in Figure 4 shows that the virtual
die is fair. We cannot reject the null that the distribution obtained from random.org
is uniform: pvalue from Kolmogorov-Smirnov two-sample test is 0.97 and pvalues from
two-sided binomial tests that the share of each reported number is equal to 16.67% are
all greater than 0.2. We take this as evidence that each of the observed distributions
from our experiment should be uniform if subjects report honestly.
7
3.2 Self-report Treatment Results (SRT)
Result 1. We find strong evidence for an overall pattern of dishonesty among subjects.
However, there is a non-trivial share of unconditionally-honest subjects.
The distribution of reported die rolls in Panel A of Figure 5 indicates the presence
of lying in SRT. Subjects report low-paying numbers at frequencies below 16.67% and
report high-paying numbers at frequencies above 16.67%, which is indicative of dishon-
esty. A Kolmogorov-Smirnov two-sample test confirms that the observed distribution is
statistically different from a uniform distribution (pvalue < 1%). This is further sup-
ported by a two-sided binomial test that the share of subjects reporting each number is
equal to 16.67%; we can reject the null that the share of reported 0, 2 and 5 is 16.67%
at the 1% level. However, we cannot reject that the share of 1, 3 and 4 is 16.67%. This
finding implies that some subjects lied about their die roll and reported higher numbers
than what they actually rolled.
Since there is no incentive for people to lie for lower payoffs, it is reasonable to
assume that subjects who report a zero payoff are honest. In our experiment, 7.4% of
subjects in SRT report a die roll of 6, which results in a zero payoff. Following Fischbacher
and Follmi-Heusi (2013), we use this information to estimate the percentage of uncon-
ditionally honest subjects to be approximately 44% (= 7.4% ∗ 6).10 In other words, we
find that 44% of subjects are honest despite the fact that lying is both unobservable and
profitable. The SRT results also provide evidence of maximal lying. We find that 32% of
the subjects in SRT report a payoff of 5, which is statistically greater than the expected
probability of 1/6. This implies that some subjects lied to maximize their payoffs. Since
there is no incentive for subjects who rolled 5 to report a lower payoff, we estimate the
percentage of maximal liars to be 18% (= (32− 16.7) ∗ (6/5)).
3.3 Confirmation-report Treatment (CRT)
Recall that the confirmation treatment is divided into six sub-groups where every subject
in a given sub-group is asked to confirm the same pre-filled number. Therefore, we are
able to pool the data and analyze the confirmation treatments as a single group, and
we can analyze each sub-group separately. The analysis below exploits this flexibility
in our data. We first present the pooled results where we compare the aggregate CRT
distribution to that of SRT. We then disaggregate the CRT results into its component
groups and compare each sub-group to SRT.
10This is based on the assumption that unconditionally honest subjects in fact rolled a uniform dis-tribution of numbers. To the extent that some subjects reported a six despite rolling another number,then this estimate represents an upper bound on the share of unconditionally honest subjects.
8
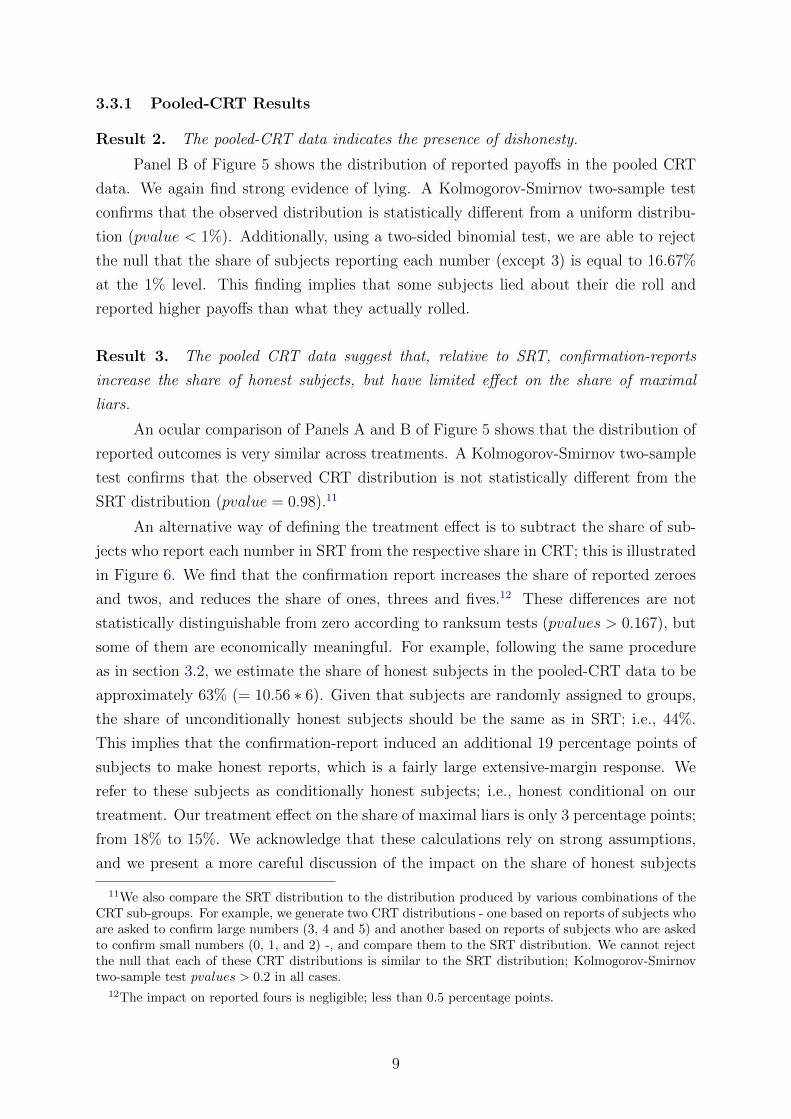
3.3.1 Pooled-CRT Results
Result 2. The pooled-CRT data indicates the presence of dishonesty.
Panel B of Figure 5 shows the distribution of reported payoffs in the pooled CRT
data. We again find strong evidence of lying. A Kolmogorov-Smirnov two-sample test
confirms that the observed distribution is statistically different from a uniform distribu-
tion (pvalue < 1%). Additionally, using a two-sided binomial test, we are able to reject
the null that the share of subjects reporting each number (except 3) is equal to 16.67%
at the 1% level. This finding implies that some subjects lied about their die roll and
reported higher payoffs than what they actually rolled.
Result 3. The pooled CRT data suggest that, relative to SRT, confirmation-reports
increase the share of honest subjects, but have limited effect on the share of maximal
liars.
An ocular comparison of Panels A and B of Figure 5 shows that the distribution of
reported outcomes is very similar across treatments. A Kolmogorov-Smirnov two-sample
test confirms that the observed CRT distribution is not statistically different from the
SRT distribution (pvalue = 0.98).11
An alternative way of defining the treatment effect is to subtract the share of sub-
jects who report each number in SRT from the respective share in CRT; this is illustrated
in Figure 6. We find that the confirmation report increases the share of reported zeroes
and twos, and reduces the share of ones, threes and fives.12 These differences are not
statistically distinguishable from zero according to ranksum tests (pvalues > 0.167), but
some of them are economically meaningful. For example, following the same procedure
as in section 3.2, we estimate the share of honest subjects in the pooled-CRT data to be
approximately 63% (= 10.56 ∗ 6). Given that subjects are randomly assigned to groups,
the share of unconditionally honest subjects should be the same as in SRT; i.e., 44%.
This implies that the confirmation-report induced an additional 19 percentage points of
subjects to make honest reports, which is a fairly large extensive-margin response. We
refer to these subjects as conditionally honest subjects; i.e., honest conditional on our
treatment. Our treatment effect on the share of maximal liars is only 3 percentage points;
from 18% to 15%. We acknowledge that these calculations rely on strong assumptions,
and we present a more careful discussion of the impact on the share of honest subjects
11We also compare the SRT distribution to the distribution produced by various combinations of theCRT sub-groups. For example, we generate two CRT distributions - one based on reports of subjects whoare asked to confirm large numbers (3, 4 and 5) and another based on reports of subjects who are askedto confirm small numbers (0, 1, and 2) -, and compare them to the SRT distribution. We cannot rejectthe null that each of these CRT distributions is similar to the SRT distribution; Kolmogorov-Smirnovtwo-sample test pvalues > 0.2 in all cases.
12The impact on reported fours is negligible; less than 0.5 percentage points.
9
in section 3.3.2.
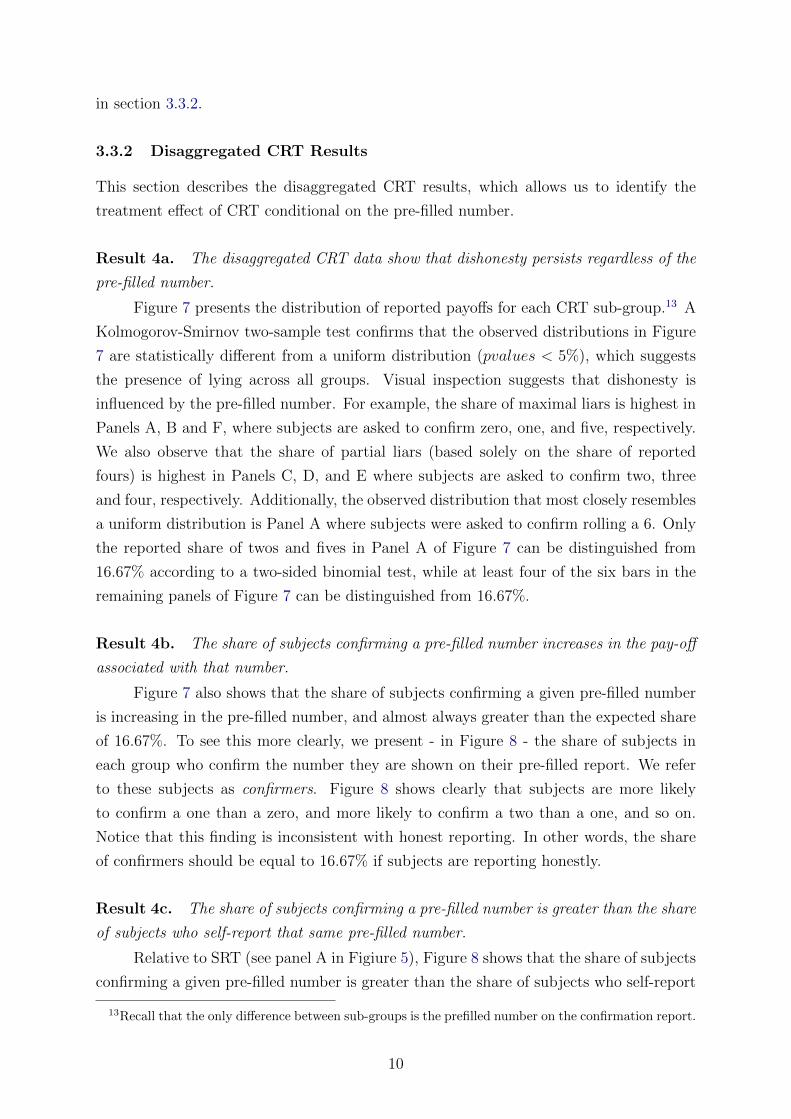
3.3.2 Disaggregated CRT Results
This section describes the disaggregated CRT results, which allows us to identify the
treatment effect of CRT conditional on the pre-filled number.
Result 4a. The disaggregated CRT data show that dishonesty persists regardless of the
pre-filled number.
Figure 7 presents the distribution of reported payoffs for each CRT sub-group.13 A
Kolmogorov-Smirnov two-sample test confirms that the observed distributions in Figure
7 are statistically different from a uniform distribution (pvalues < 5%), which suggests
the presence of lying across all groups. Visual inspection suggests that dishonesty is
influenced by the pre-filled number. For example, the share of maximal liars is highest in
Panels A, B and F, where subjects are asked to confirm zero, one, and five, respectively.
We also observe that the share of partial liars (based solely on the share of reported
fours) is highest in Panels C, D, and E where subjects are asked to confirm two, three
and four, respectively. Additionally, the observed distribution that most closely resembles
a uniform distribution is Panel A where subjects were asked to confirm rolling a 6. Only
the reported share of twos and fives in Panel A of Figure 7 can be distinguished from
16.67% according to a two-sided binomial test, while at least four of the six bars in the
remaining panels of Figure 7 can be distinguished from 16.67%.
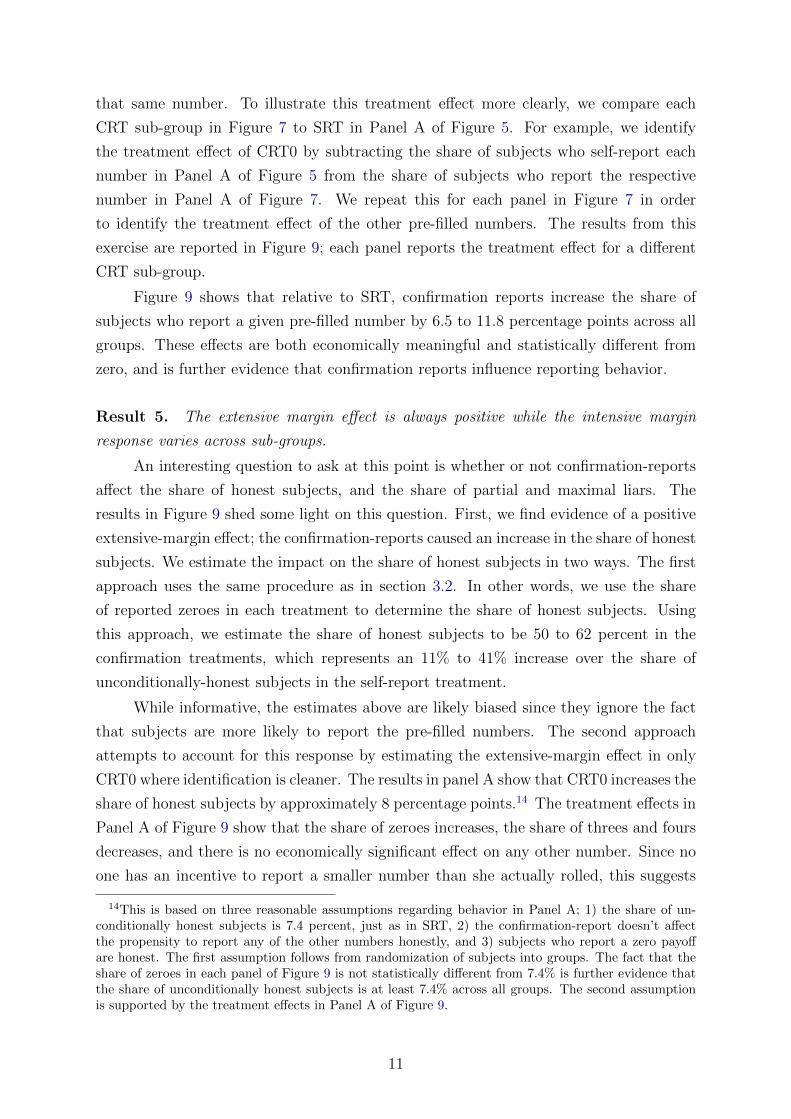
Result 4b. The share of subjects confirming a pre-filled number increases in the pay-off
associated with that number.
Figure 7 also shows that the share of subjects confirming a given pre-filled number
is increasing in the pre-filled number, and almost always greater than the expected share
of 16.67%. To see this more clearly, we present - in Figure 8 - the share of subjects in
each group who confirm the number they are shown on their pre-filled report. We refer
to these subjects as confirmers. Figure 8 shows clearly that subjects are more likely
to confirm a one than a zero, and more likely to confirm a two than a one, and so on.
Notice that this finding is inconsistent with honest reporting. In other words, the share
of confirmers should be equal to 16.67% if subjects are reporting honestly.
Result 4c. The share of subjects confirming a pre-filled number is greater than the share
of subjects who self-report that same pre-filled number.
Relative to SRT (see panel A in Figiure 5), Figure 8 shows that the share of subjects
confirming a given pre-filled number is greater than the share of subjects who self-report
13Recall that the only difference between sub-groups is the prefilled number on the confirmation report.
10
that same number. To illustrate this treatment effect more clearly, we compare each
CRT sub-group in Figure 7 to SRT in Panel A of Figure 5. For example, we identify
the treatment effect of CRT0 by subtracting the share of subjects who self-report each
number in Panel A of Figure 5 from the share of subjects who report the respective
number in Panel A of Figure 7. We repeat this for each panel in Figure 7 in order
to identify the treatment effect of the other pre-filled numbers. The results from this
exercise are reported in Figure 9; each panel reports the treatment effect for a different
CRT sub-group.
Figure 9 shows that relative to SRT, confirmation reports increase the share of
subjects who report a given pre-filled number by 6.5 to 11.8 percentage points across all
groups. These effects are both economically meaningful and statistically different from
zero, and is further evidence that confirmation reports influence reporting behavior.
Result 5. The extensive margin effect is always positive while the intensive margin
response varies across sub-groups.
An interesting question to ask at this point is whether or not confirmation-reports
affect the share of honest subjects, and the share of partial and maximal liars. The
results in Figure 9 shed some light on this question. First, we find evidence of a positive
extensive-margin effect; the confirmation-reports caused an increase in the share of honest
subjects. We estimate the impact on the share of honest subjects in two ways. The first
approach uses the same procedure as in section 3.2. In other words, we use the share
of reported zeroes in each treatment to determine the share of honest subjects. Using
this approach, we estimate the share of honest subjects to be 50 to 62 percent in the
confirmation treatments, which represents an 11% to 41% increase over the share of
unconditionally-honest subjects in the self-report treatment.
While informative, the estimates above are likely biased since they ignore the fact
that subjects are more likely to report the pre-filled numbers. The second approach
attempts to account for this response by estimating the extensive-margin effect in only
CRT0 where identification is cleaner. The results in panel A show that CRT0 increases the
share of honest subjects by approximately 8 percentage points.14 The treatment effects in
Panel A of Figure 9 show that the share of zeroes increases, the share of threes and fours
decreases, and there is no economically significant effect on any other number. Since no
one has an incentive to report a smaller number than she actually rolled, this suggests
14This is based on three reasonable assumptions regarding behavior in Panel A; 1) the share of un-conditionally honest subjects is 7.4 percent, just as in SRT, 2) the confirmation-report doesn’t affectthe propensity to report any of the other numbers honestly, and 3) subjects who report a zero payoffare honest. The first assumption follows from randomization of subjects into groups. The fact that theshare of zeroes in each panel of Figure 9 is not statistically different from 7.4% is further evidence thatthe share of unconditionally honest subjects is at least 7.4% across all groups. The second assumptionis supported by the treatment effects in Panel A of Figure 9.
11
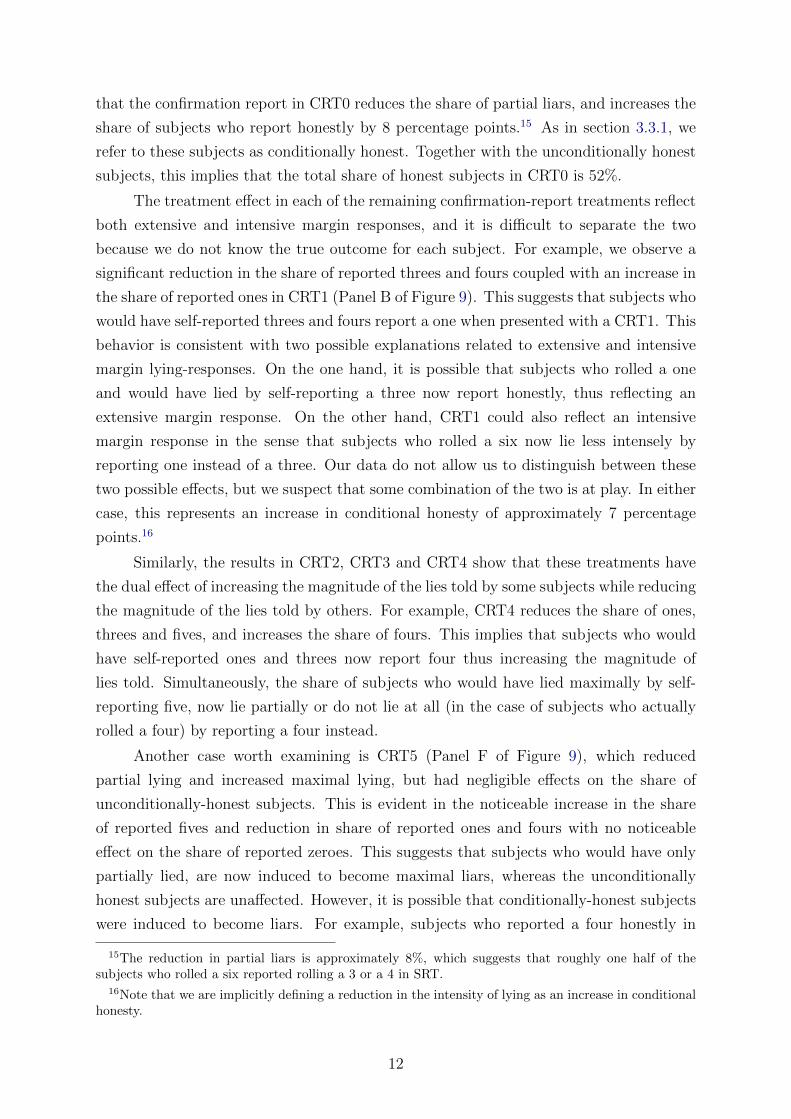
that the confirmation report in CRT0 reduces the share of partial liars, and increases the
share of subjects who report honestly by 8 percentage points.15 As in section 3.3.1, we
refer to these subjects as conditionally honest. Together with the unconditionally honest
subjects, this implies that the total share of honest subjects in CRT0 is 52%.
The treatment effect in each of the remaining confirmation-report treatments reflect
both extensive and intensive margin responses, and it is difficult to separate the two
because we do not know the true outcome for each subject. For example, we observe a
significant reduction in the share of reported threes and fours coupled with an increase in
the share of reported ones in CRT1 (Panel B of Figure 9). This suggests that subjects who
would have self-reported threes and fours report a one when presented with a CRT1. This
behavior is consistent with two possible explanations related to extensive and intensive
margin lying-responses. On the one hand, it is possible that subjects who rolled a one
and would have lied by self-reporting a three now report honestly, thus reflecting an
extensive margin response. On the other hand, CRT1 could also reflect an intensive
margin response in the sense that subjects who rolled a six now lie less intensely by
reporting one instead of a three. Our data do not allow us to distinguish between these
two possible effects, but we suspect that some combination of the two is at play. In either
case, this represents an increase in conditional honesty of approximately 7 percentage
points.16
Similarly, the results in CRT2, CRT3 and CRT4 show that these treatments have
the dual effect of increasing the magnitude of the lies told by some subjects while reducing
the magnitude of the lies told by others. For example, CRT4 reduces the share of ones,
threes and fives, and increases the share of fours. This implies that subjects who would
have self-reported ones and threes now report four thus increasing the magnitude of
lies told. Simultaneously, the share of subjects who would have lied maximally by self-
reporting five, now lie partially or do not lie at all (in the case of subjects who actually
rolled a four) by reporting a four instead.
Another case worth examining is CRT5 (Panel F of Figure 9), which reduced
partial lying and increased maximal lying, but had negligible effects on the share of
unconditionally-honest subjects. This is evident in the noticeable increase in the share
of reported fives and reduction in share of reported ones and fours with no noticeable
effect on the share of reported zeroes. This suggests that subjects who would have only
partially lied, are now induced to become maximal liars, whereas the unconditionally
honest subjects are unaffected. However, it is possible that conditionally-honest subjects
were induced to become liars. For example, subjects who reported a four honestly in
15The reduction in partial liars is approximately 8%, which suggests that roughly one half of thesubjects who rolled a six reported rolling a 3 or a 4 in SRT.
16Note that we are implicitly defining a reduction in the intensity of lying as an increase in conditionalhonesty.
12
the self-report treatment because of the relatively high pay-off, may have been induced
to report a five in the confirmation-report treatment. Therefore, while we believe the
increase in the share of reported fives reflect an intensive-margin effect, we cannot rule
out the possibility that it also captures an extensive-margin response.
3.4 Rollers
Subjects who are committed to lying might find it pointless to roll the die since their
reported outcome will be independent of the die roll. However, it is usually impossible to
tell if subjects rolled the die because they make their die roll and reporting decisions in
private. This information is important in our context since it is possible that subjects who
are committed liars respond differently to the treatment than other subjects. Therefore,
we designed the experiment such that we can identify subjects who clicked on the die-roll
link. We refer to those subjects who clicked on the link as ‘rollers’, and those who did
not click on the link as ‘non-rollers’.17 This section describes how our results are affected
when we cut the data by roller status.
Table 4 shows that approximately 36% of subjects in both SRT and CRT are non-
rollers; i.e., they did not click on the die-roll link before making their reporting decision.
With the exception of CRT1 (30%) and CRT2 (40%), this share is fairly flat across
CRT sub-groups. Additionally, there is no difference in the likelihood of being a non-
roller across gender or race. Younger subjects are more likely to be non-rollers, but the
estimated effect is not economically meaningful. The only demographic characteristic
that is strongly correlated with non-roller is education level; the likelihood of being a
non-roller decreases with education level.18 These differences are not worrisome since the
treatment groups are balanced with respect to education level. However, given that each
group has approximately 200 observations, the number of non-rollers ranges from 62 to
84. As a result, we urge caution when interpreting the results in this section.
Result 6. Subjects who clicked on the die-roll link are more honest than subjects who
did not click on the link.
Figure 10 presents the distribution of reported die rolls for SRT and pooled CRT
conditional on roller status. Although the observed distributions are all statistically differ-
ent from a uniform distribution, the results show clearly that rollers are more honest than
17We are only able to tell if the link was clicked; we cannot observe the outcome of the die roll. Also,we cannot rule out the possibility that non-rollers actually rolled a die. For example, it is possible thatthey simply bypassed our link to the virtual die, or that they rolled their own physical die. As mentionedbefore, our inability to observe the die outcome was made clear to subjects.
18The share of non-rollers among subjects with a graduate degree is 25%. Relative to graduate degreeholders, subjects with a bachelors degree, some college, and high school diploma are 11%, 10% and15%, respectively, more likely to be non-rollers. These differences are both economically and statisticallysignificant.
13
non-rollers.19 In particular, relative to non-rollers, the share of honest subjects is higher
and the share of maximal liars lower among rollers. We find that the share of honest sub-
jects in SRT is 51% and 32% among rollers and non-rollers, respectively. Corresponding
numbers for CRT are 67% and 56% among rollers and non-rollers, respectively. The share
of maximal liars is 13.4(= 23.87 − 10.46) points higher among non-rollers in SRT and
6.66(= 16.96 − 10.3) points higher among non-rollers in pooled CRT. The difference in
propensity to lie is also apparent in Figures 11 and 12, which report results for rollers and
non-rollers, respectively. Again, while the observed distributions among rollers suggests
the presence of lying, we find even stronger evidence of lying among non-rollers.
Result 7. The estimated treatment effect of CRT is much stronger among non-rollers.
The results presented in Figure 13 show that non-rollers are not only more dishonest,
they are also more responsive to the treatment. Relative to SRT rollers, CRT rollers
reduce the share of reported ones and increase the share of reported zeroes; there is no
effect on the other reported numbers. As with the main results, this finding suggest that
CRT increases honesty among rollers. We find a similar, but much larger effect among
non-rollers. In particular, there is a large reduction in the share of fives and threes, and a
correspondingly large increase in the share of zeroes and twos. Therefore, it appears that
the CRT also increased honesty among non-rollers. However, this interpretation depends
on the motivation for not clicking the die-roll link. On the one hand, if non-rollers rolled
an actual die, then the interpretation is that CRT increased honesty among non-rollers.
On the other hand, if non-rollers did not roll a die, this behavioral difference across
treatments cannot be directly interpreted as an increase in honesty since the subjects
themselves do not know the outcome of the die roll. Nonetheless, the fact that some
non-rollers report a zero in CRT suggests that they are possibly more likely to report a
zero in CRT had they rolled the die and observed a zero. In other words, we suspect
that CRT would increase honesty among non-rollers had they been forced to observe the
outcome of an actual die roll.
As in section 3.3.2, the results presented in Figures 14 and 15 show that the treat-
ment effect depends on the pre-filled number. Subjects are more likely to confirm the
pre-filled number than to self-report that same number. However, this effect is much
stronger among non-rollers.20 Figure 14 also shows that, relative to SRT, a confirmation-
report pre-filled with zero or one has very little effect on the reporting behavior of rollers;
differences are indistinguishable from zero. At the same time, a pre-filled report with
two, three or four reduces maximal lying while a report pre-filled with five increases max-
imal lying. We find somewhat similar results for non-rollers in Figure 15. Pre-filling the
19Kolmogorov-Smirnov two-sample test confirms that the observed distribution from both SRT sndCRT are statistically different from a uniform distribution (pvalue < 1%).
20The effect is only distinguishable from zero for pre-filled number zero, three, four, and five.
14
report with a number less than five reduces maximal lying, but by larger amounts com-
pared to rollers. Interestingly, pre-filling the report with a five increases maximal lying
by a smaller amount compared to rollers; approximately 5.5 points among non-rollers
compared to approximately 9 points among rollers.
Overall, the results show that while the treatment affected both groups in similar
ways, it had a much larger effect on non-rollers. We discuss the implications of this
finding for our main results in section 4.
3.5 Gender Effect
A common finding in the literature is that males tend to be more dishonest than females
(Erat 2013; Muehlheusser et al. 2015; Dreber and Johannesson 2008; Childs 2012). We
explore whether this finding holds in our setting. First we note that while each group
has more males than females, gender is fairly balanced within and between groups (see
Table 3).
Result 8. Men are more dishonest than women in both SRT and CRT.
Figure 16 shows the observed distributions by gender for SRT and CRT. Visually,
the distributions suggest the presence of lying. Except for the SRT female distribution, a
Kolmogorov-Smirnov two-sample test rejects the null that the distributions are uniform
(pvalues <= 1%); the pvalue for the SRT-female distribution is 0.16. The non-uniformity
of the distributions is confirmed by a binomial two-sided test that the share of subjects
reporting each number is 16.67%.21
These two results confirm the presence of lying among both males and females. Next
we confirm that dishonesty differs across the groups by rejecting the null that CRT-female
distribution is similar to the CRT-male distribution (Kolmogorov-Smirnov two-sample
test pvalue=0.05). Further evidence of greater dishonesty among males is presented in
Figure 17, which shows that females are more likely to report smaller numbers compared
to males.
Gender differences are also obvious in each subgroup of the CRT data. Both females
and males lie regardless of the pre-filled number on the confirmation report (see Figures 18
and 19). Additionally, Figure 20, which reports - for each CRT subgroup - the difference
between the share of females reporting a given number and the share of males reporting
that same number, confirms our earlier finding that females are more likely to report
smaller numbers compared to males.
Over all, then, our results suggest that relative to males, females are either more
21We find that females are more likely to report the theoretically expected share of each numbercompared to males in the SRT group. There is no gender difference in the propensity to report thetheoretically expected share of each number in the CRT group.
15
likely to report honestly and/or more likely to tell smaller lies.
Result 9. The treatment effect of CRT varies across gender. In particular,
• CRT has a larger treatment effect on the share of conditionally honest subjects
among males than among females.
• CRT has a larger treatment effect on share of maximal liars among females than
among males.
• CRT reduces the share of partial liars among males, but increase the share of partial
liars among females.
Relative to males, the share of unconditionally honest subjects in SRT is approxi-
mately 18 percentage points higher among females: 54% and 36% for females and males,
respectively. The share of honest subjects (conditional and unconditional) in the pooled-
CRT treatment is 68% and 59%, for females and males, respectively. Therefore, while
females are more unconditionally honest, they are less likely to be induced to become
honest by the treatment. This is evident by the fact that the treatment effect on condi-
tional honesty is 22.8 percentage points among males compared to 14 percentage points
among females.
Additionally, CRT affects partial and maximal lying differently across gender. On
the one hand, CRT increases partial lying and reduces maximal lying among females. On
the other hand, CRT reduces partial lying and has no effect on maximal lying among
males.
4 Discussion
The empirical results described in section 3 show that approximately 44% of subjects are
unconditionally honest. We also find that only 18% of subjects lied maximally, which
suggests that the majority of liars do so partially. Importantly, we estimate that the
CRT has an economically meaningful effect on the share of subjects who report each
number, but the magnitude depends greatly on the pre-filled number in the CRT. This
section places our findings to the context of the existing literature and offers possible
explanations for the observed treatment effects.
4.1 Relation to literature
Our baseline findings reported in section 3.2 are consistent with the existing literature
(Fischbacher and Follmi-Heusi 2013; Ruffle and Tobol 2014; Abeler et al. 2014; Suri et al.
2011; Hao and Houser 2013). A particularly useful point of comparison is Fischbacher
16
and Follmi-Heusi (2013) whose baseline-experimental design is similar to ours. They
estimate that their sample includes 39% unconditionally honest subjects, 22% maximal
liars, and a non-trivial amount of partial lying. Our results are largely comparable to
theirs, which is reassuring on two levels. First, though use of the mTurk subject pool
has grown significantly in recent years, there still remains some skepticism. Therefore,
the fact that Fischbacher and Follmi-Heusi (2013) baseline results are replicated in the
mTurk sample ought to increase confidence in our results. Second, mTurkers generally
complete HITs for very low wages and as such the stakes in our experiment are low
relative to the existing literature. For example, ignoring exchange rate differences, the
stakes in Fischbacher and Follmi-Heusi (2013) are ten times as high as in our experiment.
Still, our baseline results are very similar to theirs, which suggests that the size of the
stake is not that important in matters of dishonesty (at least not in the context that we
explore).22
The greater honesty that we observe in our experiment is expected since studies
conducted in the field generally find higher levels of honesty; e.g., Abeler et al. (2014)
conduct a coin-toss experiment and find no evidence of lying in the field but significant
amounts of lying in the lab. We also note that our treatment effects are consistent with
Fonseca and Grimshaw (2015) who find that correctly pre-populated tax returns have a
small positive effect on compliance relative to a blank return. Like us, they also find that
pre-populating a return with too low values (similar to overstating the die outcome in
our case) increases dishonesty.
4.2 Channels
Again, the novelty of our experiment is that we test whether confirmation-reports cause
subjects to become more or less honest in an environment where there are no extrinsic
lying costs. Our results suggest that, overall, confirmation reports increase honesty.
However, we also observe that the effect of CRT depends on the the pre-filled information
and whether or not the subject clicked our roll-die link. We argue that this heterogenous
effect is due to intrinsic costs broadly defined to include moral lying-costs and decision-
making costs related to the mental burden of whether and how much to lie.
Moral Lying-costs Dishonesty is morally costly for individuals because they must vi-
olate their moral standards in order to engage in a dishonest act (Bandura 1990; Bandura
1996; Aquino and Reed II 2002). We argue that confirmation-reports affect the moral
cost of lying by changing the salience of subjects’ own moral standards. For example,
a subject who faces an accurate confirmation-report has to engage in two distinct dis-
22Fischbacher and Follmi-Heusi (2013) came to a similar conclusion after tripling the stakes in theirexperiment and finding that the higher stakes did not affect their results.
17
honest acts if she wishes to lie; she must reject the true statement, then report a false
statement. These two decisions have a greater effect in activating her moral standards
relative to a self-report, and thus increases the moral costs of lying. On the other hand,
CRT reduces the moral-lying costs of subjects who are asked to confirm an advantageous
false statement because they can shift the blame of lying to the person who prepared
the confirmation report without necessarily activating her own moral standards. For ex-
ample, Erat (2013) finds that people are more likely to lie if the burden of lying can be
shifted to a delegate. We argue that these opposing effects on the moral cost of lying is
a possible explanation for our results.
To illustrate, let us take to the two extreme pay-off numbers of zero (lowest pay-off)
and five (highest pay-off). CRT subjects who roll a zero and are asked to confirm a zero
face higher lying costs relative to subjects who rolled a zero in SRT. We would therefore
expect an increase in the share of reported zeroes in CRT relative to SRT, and this is
exactly what we find. Importantly, because there is no incentive to report a zero unless
it is the truth, we can interpret the increase in the share of reported zeroes as an increase
in honesty. Similarly, CRT subjects who rolled a number less than five, but are asked to
confirm rolling a five, face lower lying costs relative to SRT subjects who rolled a number
less than five. Therefore, we would expect an increase in the share of reported fives
relative to SRT. Again, this is what we find. Because subjects do not have an incentive
to report a number lower than their actual roll, we argue the treatment effect for reported
fives reflects an increase in dishonesty.
We can use the same logic to explain the responses for the intermediate numbers
one to four. Consider, for example, the number three. We can classify subjects who are
asked to confirm the number three into four bins: 1) those who roll a number lower than
three, and would self-report a number lower than three, 2) those who roll a number lower
than three, but would self-report a number greater than or equal to three, 3) those who
roll the number three, and 4) those who roll a number greater than three. Pre-filling the
confirmation report with the number three reduces the lying cost for subjects in the first
two bins and increases the lying cost for those in the third bin. The impact on lying
costs for those who roll a four is unclear. This suggests that the share of reported three
should increase, which is what we observe, and that this effect is driven by the response
of subjects in the first three bins. The greater share of threes reflects an increase in lying
among subjects in the first bin since they experience lower lying costs. It also possibly
includes a reduction in the magnitude of the lie told by subjects in the second bin. In
other words, subjects who roll a one and would have self-reported a five now report a
three; they still lie, but the magnitude of the lie is smaller. Finally, the effect of pre-filling
the report with the number three includes increased honesty among subjects who actually
roll a three because these subjects experience higher lying costs.
18
All together, the combination of effects discussed above makes it less surprising that
the pooled-CRT and SRT distributions look so similar. In other words, the pooled results
reflect a combination of increased lying and increased honesty.
Decision-Making Costs Another possible explanation for our findings is that subjects
simply accept the number that is pre-populated because it is the default setting of the
confirmation report. Economists have highlighted in numerous areas, including health
care plans (Samuelson and Zeckhauser 1988), automobile insurance (Johnson et al. 1993),
retirement saving plans (Madrian and Shea 2001), and organ donor registration (Johnson
and Goldstein 2003; Li et al. 2013), that people often choose the default option they are
assigned in order to reduce decision-making costs. Because it is less mentally burdensome
to accept the default number shown on the confirmation report than to decide on a
number to report, we would expect subjects who roll a number x ≤ y to be more likely to
confirm rolling y than self-reporting y. We argue that this channel is especially relevant
among non-rollers. To the extent that non-rollers did not in fact roll a die, they need to
decide which number to self-report in order to maximize their pay-off while maintaining a
semblance of honesty.23 The default option presented in the confirmation-report simplifies
this decision-making calculus by allowing the subject to simply accept the pre-populated
number. Unlike rollers, non-rollers do not have an actual die outcome (x) with which
to compare the pre-populated number (y). Therefore, it is not surprising that, relative
to rollers, non-rollers are more likely to accept y, thus leading to much larger treatment
effects among non-rollers.
Shame Another possible explanation for our result is that it is driven by shame aversion
induced by a change in subjects’ beliefs of the researchers’ information set. The argument
goes as follows. Upon seeing a pre-filled number, subjects update their beliefs of the
accuracy of the researcher’s information set regarding the actual die outcome. Subjects
who see a pre-filled number equal to their actual die roll now believe that the researcher
knows the actual outcome, and will therefore report accurately. Subjects who see a pre-
filled number that is different from their actual die roll will confirm their prior belief that
the researchers do not know the actual outcome, and are therefore more likely to confirm
a favorable false statement. Note that in both cases the effect of the updated beliefs on
lying works through its effect on intrinsic costs only.24 In other words, subjects wish to
lie, but would like to appear honest in order to avoid the shame of being known as a liar
(Hao and Houser 2013; Greenberg et al. 2015). As a result, subjects who believe the
23Recall that we can only tell if the subject clicked ont he die-roll link. We cannot tell if they roll theirown personal die or a virtual die on some other website.
24Recall that there is no audit and no penalty for lying. Therefore, even if a subject believes that theresearchers knows her actual die roll, it is still profitable to lie since there are no extrinsic costs associatedwith lying.
19
researchers information set is correct are more likely to confirm an accurately pre-filled
confirmation report while those who believe the researchers information set is inaccurate
are more likely to confirm a favorably inaccurate confirmation report.
We argue that this mechanism is an unlikely reason for our results given the design
of the experiment. First, we make it explicitly clear to subjects that our website is not
connected to random.org in anyway, and that we cannot observe their die rolls. Second,
subjects know that we only observe their mTurk ID and therefore have no way of knowing
any of them personally. Third, the actual reported outcomes appear to be inconsistent
with this explanation. For example, if pre-filling the form with say three, fours and
fives lead subjects who roll a zero to believe we do not know their actual outcomes,
then we would expect to observe a significant drop in the share of reported zeroes in
treatments CRT3, CRT4 and CRT5 relative to SRT and relative to CRT0, CRT1 and
CRT2. However, the share of reported zeroes is basically constant across all of these
treatments.
Finally, we also rule out this alternate explanation based on the fact that subjects
who did not click on the “die roll ” link embedded in our website responded similarly to
those who did click on the link. Subjects’ belief of the researchers’ information set should
be unaffected by the pre-filled number for subjects who did not click on the “die roll”
link. This is because these subjects either rolled a physical die, rolled a virtual die on
some other website, bypassed our weblink in order to roll the die on random.org, or did
not roll a die at all. In either case, these subjects should be reassured that the researchers
do not know the actual outcome of the die roll, and so, their beliefs of the researchers’
information set should be independent of the pre-filled number. This suggests that the
treatment effect of CRT0 on the share of subjects who confirm rolling zero should be
lower among non-rollers relative to rollers. Similarly, the treatment effect of CRT5 on
the share of subjects who confirm rolling five should be higher among non-rollers relative
to rollers. However, this is not what we observe. In fact, the treatment effect of CRT0 on
confirmed zeroes is much higher among non-rollers, while the treatment effect of CRT5 on
confirmed fives is lower among non-rollers. This suggests that a change in beliefs about
the probability of being observed is not the driving factor.
Of course we cannot rule out the possibility that different subjects are influenced by
different factors. For example, it is possible that non-rollers are influenced by decision-
making costs while rollers are mostly influenced by moral costs with some residual social
(shame) costs.
4.3 Policy Implications
Our findings are important for policy areas where information requests can reasonably
take the form of either the self-report or confirmation-report; e.g., tax administration.
20
Several countries have adopted pre-populated tax forms, and others are considering adop-
tion. It is generally argued that a pre-populated tax system lowers compliance costs and
thus increases tax compliance. However, there is very little empirical evidence on the
compliance effects of pre-populated tax systems; Fonseca and Grimshaw (2015) provide
experimental evidence for the UK and Kotakorpi and Laamanen (2015) evaluate the ef-
fect of Finland’s switch to pre-populated returns. While our experiment is not framed as
a study of tax compliance, the results do provide some insights into the possible effects
of pre-population since pre-populated tax systems rely on confirmation-reports.25 For
example, we show that the effect of confirmation-reports on dishonesty (and hence tax
compliance) depends greatly on the accuracy of the pre-populated information. Correctly
pre-populated forms will increase compliance while forms that understate income will in-
crease non-compliance. Of course, the importance of accuracy is not a new finding.26
What is novel in our setting is that we show that this compliance effect exists even in the
absence of extrinsic evasion costs; i.e., costs related to being audited and fined. We argue
that this effect is driven by changes in the intrinsic costs of lying that are induced by the
confirmation-report; while accurate information increases intrinsic lying costs, inaccurate
information reduces intrinsic lying costs.
Another application closely related to our field experiment context is the reporting
of annual vehicle miles traveled (VMT) for auto-insurance policies. Auto insurers often
ask policy holders to self-report their annual VMT and use this information in pricing
insurance policies. Those who drive more tend to have a higher accident risk and are
therefore charged higher insurance premiums. Therefore, policyholders have an incentive
to underreport their VMT. 27 Insurance companies can rely on several techniques to obtain
accurate mileage information.28 One suggested technique uses two steps. First, known
information about customers is used to predict their annual mileage; e.g., gender, age,
education, employment commute times, vehicle type, and vehicle age. Second, customers
are asked to confirm that the predicted mileage is correct using confirmation reports.
The effect of this approach on underreporting depends on the accuracy of the predicted
mileage. Assuming that the predicted mileage is fairly accurate, our findings suggest that
this approach could significantly reduce the under-reporting problem.
A similar strategy might also prove useful if road mileage user-fees become widely
25Recall that our experiment does not include any extrinsic costs. Therefore, our findings/policyimplications are based solely on the direct effect of the form, and excludes any indirect effects that mightoccur through perceived (or actual) changes in extrinsic costs.
26Almost all countries with a pre-populated tax system either limit to their system to (or began with)taxpayers with only wage income that is easily monitored for accuracy.
27According to a 2008 report by Quality Planning company, the car insurance industry lost $15.9billion of which more than $3 billion is due to underreported vehicle mileage.
28These include asking the customer, asking the agent, historical odometer readings, mileage mod-els and telematics using an after-market device, smartphone OEM-based or smartphone odometer app(Cantwell 2015).
21
adopted. Ideally, a road mileage user-fee would be implemented with the aid of advanced
technology that accurately measures vehicle mileage. However, due to costs and privacy
concerns, there has been some resistance to mileage user-fees and the use of advanced
technology in particular (Duncan et al. 2014). Because of these costs and privacy con-
cerns, administration with odometer readings is generally included as an optional way of
collecting mileage information. While odometer reading largely solves the privacy and
cost problems, it raises concerns about evasion. Our results suggest that obtaining a
fairly accurate estimate of vehicle miles traveled coupled with a confirmation report is
likely to reduce non-compliance. This could serve to reduce the number of required audits
and hence the cost of administration.
5 Conclusion
We implement a field experiment to study the effect of confirmation reports on dishonesty.
Subjects are recruited from Amazon’s Mechanical Turk labor pool. Each subject is asked
to roll a virtual die and report the outcome of the die roll either by completing a self-
report or confirmation report. We find strong evidence of lying in both treatments.
Although differences across the two treatments are not statistically significant, results
from the pooled-confirmation-report data suggest that the confirmation report induced
an additional 19 percentage points of subjects to report honestly. We also find that the
effect of confirmation report is heterogenous across pre-filled number, gender, and roller
status. Overall, we find that people are more likely to confirm the truth than to self-
report the truth, and more likely to confirm a lie than to tell a lie. We attribute our
findings to intrinsic costs which are influence through the impact of confirmation reports
on moral-lying costs and decision-making costs.
22
References
Abeler, J., A. Becker, and A. Falk (2014). Representative evidence on lying costs.
Journal of Public Economics 113, 96 – 104.
Alm, J. (2012). Measuring, explaining, and controlling tax evasion: lessons from theory,
experiments, and field studies. International Tax and Public Finance 19 (1), 54–77.
Aquino, K. and A. Reed II (2002). The self-importance of moral identity. Journal of
personality and social psychology 83 (6), 1423.
Bandura, A. (1990). Selective activation and disengagement of moral control. Journal
of Social Issues 46 (1), 27–46.
Bandura, A. (1996). Mechanisms of moral disengagement in the exercise of moral
agency. Journal of Personality and Social Psychology , 364–374.
Battigalli, P., G. Charness, and M. Dufwenberg (2013). Deception: The role of guilt.
Journal of Economic Behavior & Organization 93, 227 – 232.
Buhrmester, M., T. Kwang, and S. D. Gosling (2011). Amazon’s mechanical turk: A
new source of inexpensive, yet high-quality, data? Perspectives on Psychological
Science 6 (1), 3–5.
Cantwell, J. (2015). Mileage matters: new tools to get it right. Visualize: Insights for
auto and property insurance Q.2, 7–8.
Charness, G. and M. Dufwenberg (2006). Promises and partnership. Economet-
rica 74 (6), 1579–1601.
Childs, J. (2012). Gender differences in lying. Economics Letters 114 (2), 147 – 149.
Conrads, J., B. Irlenbusch, R. M. Rilke, and G. Walkowitz (2013). Lying and team
incentives. Journal of Economic Psychology 34, 1 – 7.
Dreber, A. and M. Johannesson (2008). Gender differences in deception. Economics
Letters 99 (1), 197 – 199.
Duncan, D., V. Nadella, A. Bowers, S. Giroux, and J. Graham (2014). Bumpy de-
signs: Impact of privacy and technology costs on support for road mileage user
fees. National Tax Journal 67 (3), 505–530.
Erat, S. (2013). Avoiding lying: The case of delegated deception. Journal of Economic
Behavior & Organization 93, 273 – 278.
Fischbacher, U. and F. Follmi-Heusi (2013). Lies in disguise: An experimental study
on cheating. Journal of the European Economic Association 11 (3), 525–547.
Fonseca, M. and S. Grimshaw (2015). Does using behavioural prompts in pre-populated
tax forms affect compliance? results from an artefactual field experiment with real
taxpayers. Tax Administration Research Centre 15-15.
23
Gneezy, U. (2005). Deception: The role of consequences. American Economic Re-
view 95 (1), 384–394.
Greenberg, A., M. Smeets, and L. Zhrakhovska (2015). Lying and shame aversion.
SSRN WP 2544349 . Available at SSRN 2544349.
Hao, L. and D. Houser (2013, February). Perceptions, Intentions, and Cheating. Work-
ing Papers 1039, George Mason University, Interdisciplinary Center for Economic
Science.
Horton, J., D. Rand, and R. Zeckhauser (2011). The online laboratory: conducting
experiments inA aA realA laborA market. Experimental Economics 14 (3), 399–
425.
Horton, J. J. and L. B. Chilton (2010). The labor economics of paid crowdsourcing.
In Proceedings of the 11th ACM Conference on Electronic Commerce, EC ’10, New
York, NY, USA, pp. 209–218. ACM.
Johnson, E. J. and D. Goldstein (2003). Do defaults save lives? Science 302 (5649),
1338–1339.
Johnson, E. J., J. Hershey, J. Meszaros, and H. Kunreuther (1993). Framing, proba-
bility distortions, and insurance decisions. Journal of Risk and Uncertainty 7 (1),
35–51.
Kajackaite, A. and U. Gneezy (2015). Lying costs and incentives.
Kotakorpi, K. and J.-P. Laamanen (2015). Complexity, salience and income tax filing
behaviour: Evidence from a natural experiment. Working paper .
Kuziemko, I., M. I. Norton, E. Saez, and S. Stantcheva (2015). How elastic are prefer-
ences for redistribution? evidence from randomized survey experiments. American
Economic Review 105 (4), 1478–1508.
Li, D., Z. Hawley, and K. Schnier (2013). Increasing organ donation via changes in the
default choice or allocation rule. Journal of Health Economics 32 (6), 1117 – 1129.
Madrian, B. C. and D. F. Shea (2001). The power of suggestion: Inertia in 401(k)
participation and savings behavior. The Quarterly Journal of Economics 116 (4),
1149–1187.
Mason, W. and S. Suri (2012). Conducting behavioral research on amazon’s mechanical
turk. Behavior Research Methods 44 (1), 1–23.
Muehlheusser, G., A. Roider, and N. Wallmeier (2015). Gender differences in honesty:
Groups versus individuals. Economics Letters 128, 25 – 29.
Paolacci, G., J. Chandler, and P. G. Ipeirotis (2010). Running experiments on amazon
mechanical turk. Judgment and Decision Making 5 (5), 411 – 419.
24
Ruffle, B. J. and Y. Tobol (2014). Honest on mondays: Honesty and the temporal
separation between decisions and payoffs. European Economic Review 65, 126–135.
Ruffle, B. J. and Y. Tobol (2016). Clever enough to tell the truth. Experimental Eco-
nomics , 1–26.
Samuelson, W. and R. Zeckhauser (1988). Status quo bias in decision making. Journal
of Risk and Uncertainty 1 (1), 7–59.
Shu, L. L., N. Mazar, F. Gino, D. Ariely, and M. H. Bazerman (2012). Signing at the
beginning makes ethics salient and decreases dishonest self-reports in comparison
to signing at the end. Proceedings of the National Academy of Sciences 109 (38),
15197–15200.
Suri, S., D. G. Goldstein, and W. A. Mason (2011). Honesty in an online labor market.
Human Computation 11, 11.
25
6 Tables
Table 1: Bonus Pay-off Schedule
Number reported 1 2 3 4 5 6
Resulting pay-off $0.10 $0.20 $0.30 $0.40 $0.50 $0.00
Table 2: Summary of Demographic Variables
SRT CRT Pvalue Total
Variables Mean N. Obs Mean N. Obs Mean N. Obs
Age 34.5 203 34.6 1268 0.85 34.6 1471
Female (%) 50.0 201 44.0 1258 0.09 44.8 1459
White (%) 83.0 203 79.0 1272 0.20 80.0 1475
Wage ($) 0.82 203 0.81 1269 0.33 0.81 1472
Education
Graduate Degree 8.4 17 10.8 137 10.4 154
Bachelors 37.4 76 39.4 501 39.1 577
Some College 37.4 76 35.9 457 36.1 533
High School 16.8 34 13.9 177 14.3 211
Notes: SRT is self-report treatment, and CRT is confirmation-report treatment. Pvalue is from the Wilcox-ranksum testfor differences in means.
26
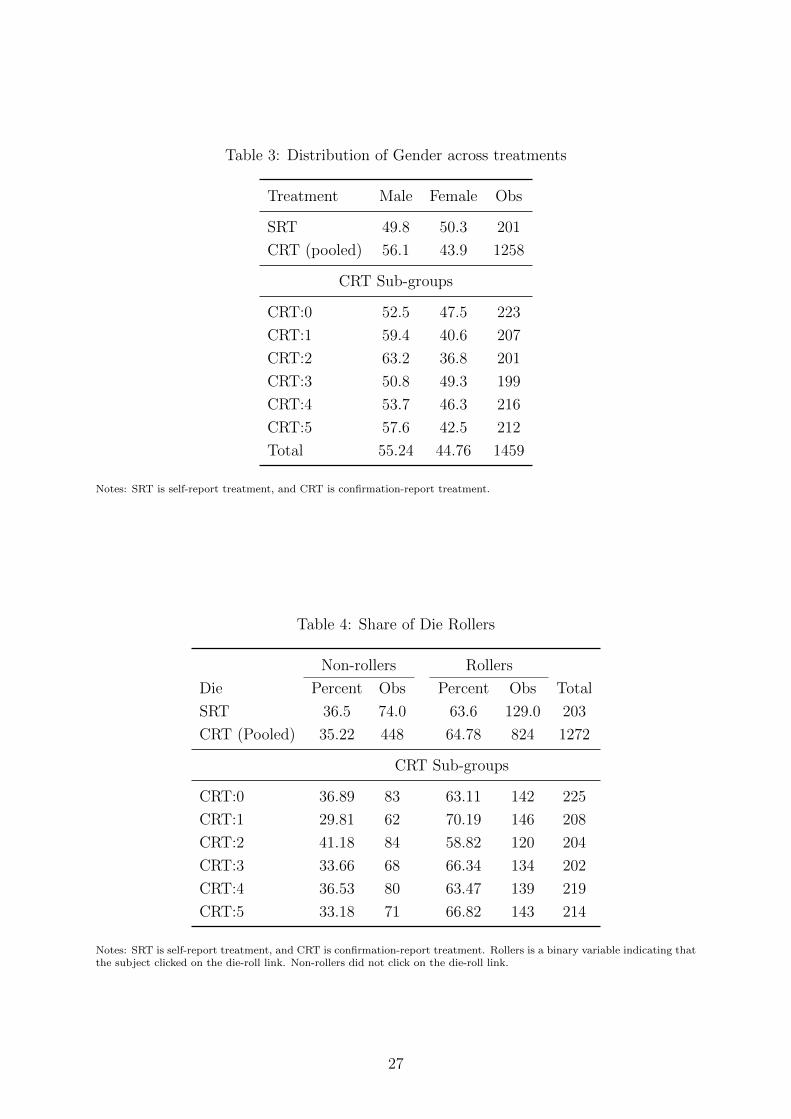
Table 3: Distribution of Gender across treatments
Treatment Male Female Obs
SRT 49.8 50.3 201
CRT (pooled) 56.1 43.9 1258
CRT Sub-groups
CRT:0 52.5 47.5 223
CRT:1 59.4 40.6 207
CRT:2 63.2 36.8 201
CRT:3 50.8 49.3 199
CRT:4 53.7 46.3 216
CRT:5 57.6 42.5 212
Total 55.24 44.76 1459
Notes: SRT is self-report treatment, and CRT is confirmation-report treatment.
Table 4: Share of Die Rollers
Non-rollers Rollers
Die Percent Obs Percent Obs Total
SRT 36.5 74.0 63.6 129.0 203
CRT (Pooled) 35.22 448 64.78 824 1272
CRT Sub-groups
CRT:0 36.89 83 63.11 142 225
CRT:1 29.81 62 70.19 146 208
CRT:2 41.18 84 58.82 120 204
CRT:3 33.66 68 66.34 134 202
CRT:4 36.53 80 63.47 139 219
CRT:5 33.18 71 66.82 143 214
Notes: SRT is self-report treatment, and CRT is confirmation-report treatment. Rollers is a binary variable indicating thatthe subject clicked on the die-roll link. Non-rollers did not click on the die-roll link.
27
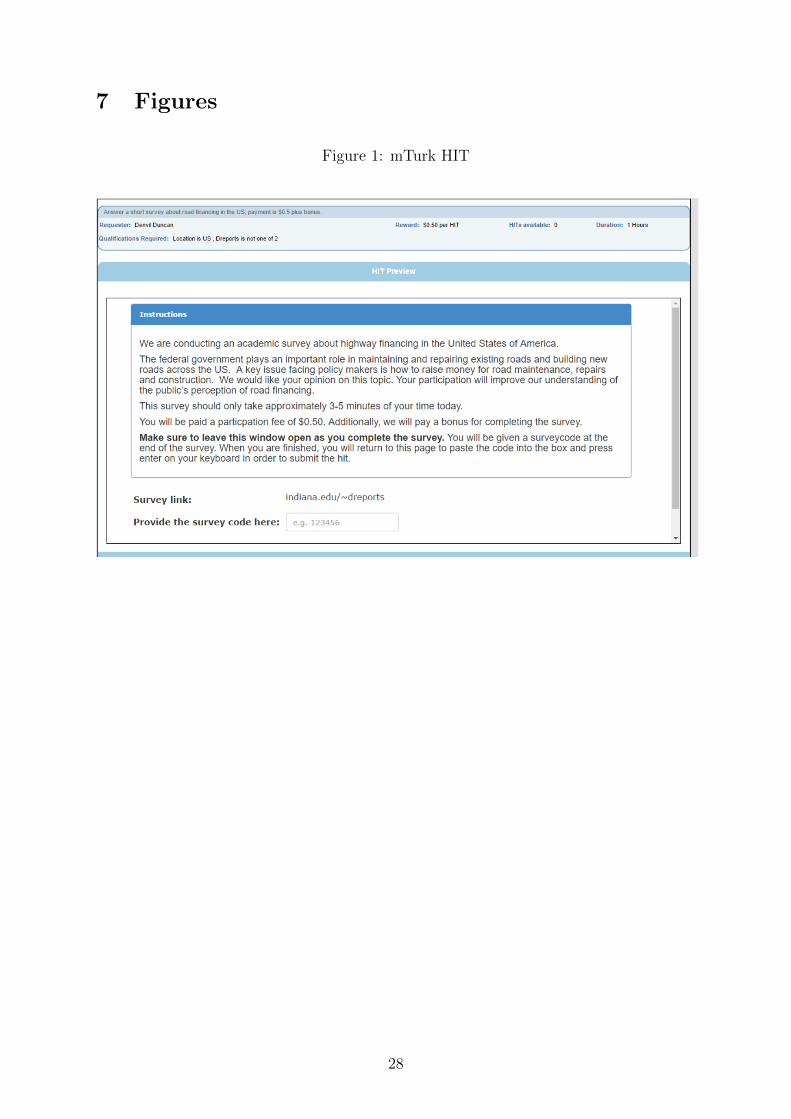
7 Figures
Figure 1: mTurk HIT
28

Figure 2: Die reporting screenshot for Self-report Treatment
29
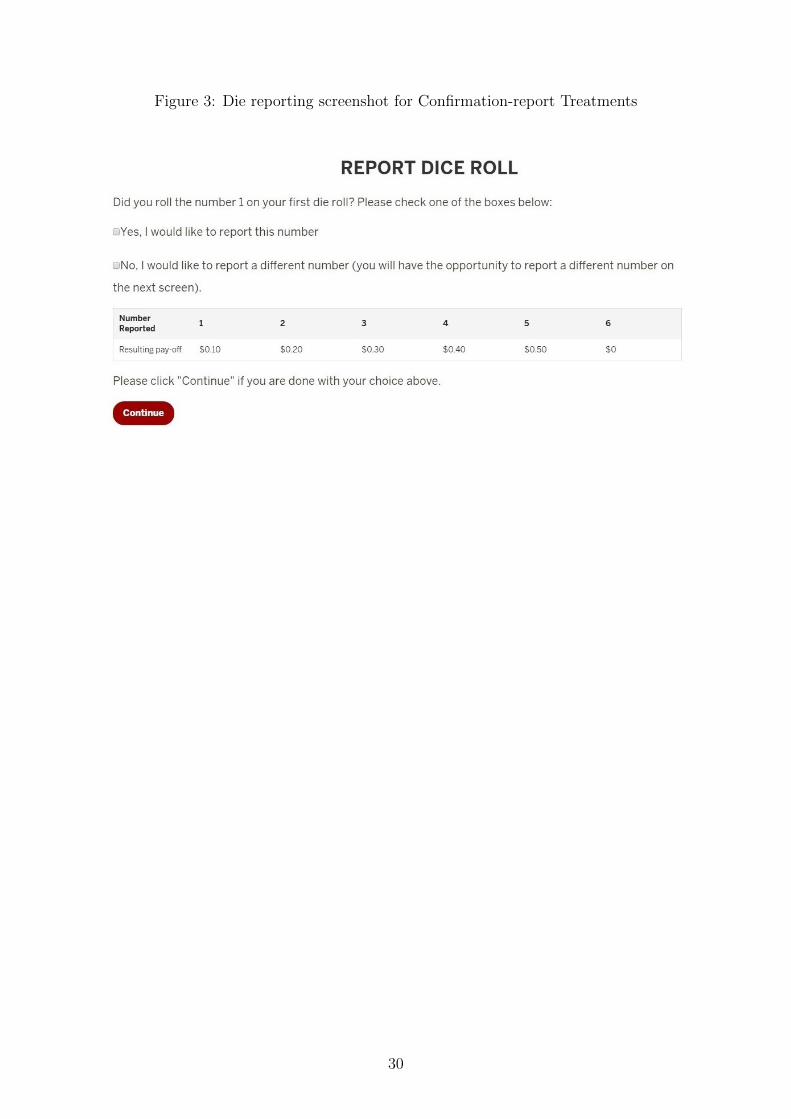
Figure 3: Die reporting screenshot for Confirmation-report Treatments
30
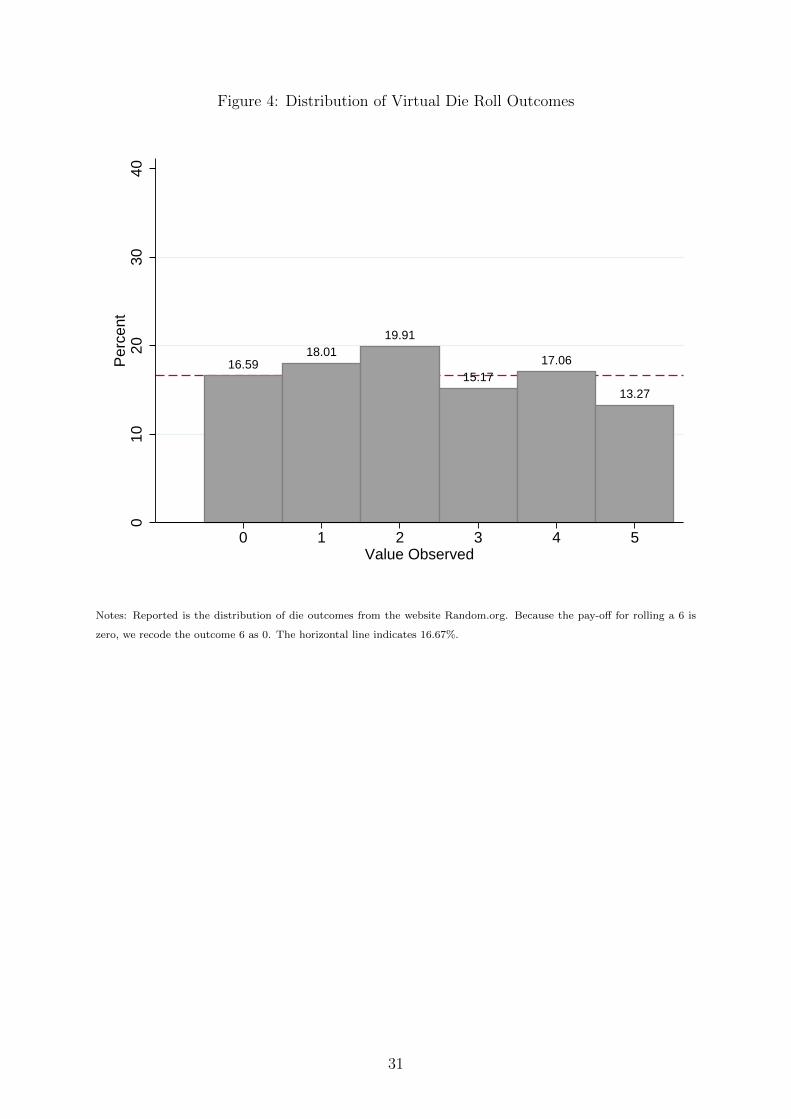
Figure 4: Distribution of Virtual Die Roll Outcomes
16.5918.01
19.91
15.1717.06
13.27
010
2030
40P
erce
nt
0 1 2 3 4 5Value Observed
Notes: Reported is the distribution of die outcomes from the website Random.org. Because the pay-off for rolling a 6 is
zero, we recode the outcome 6 as 0. The horizontal line indicates 16.67%.
31
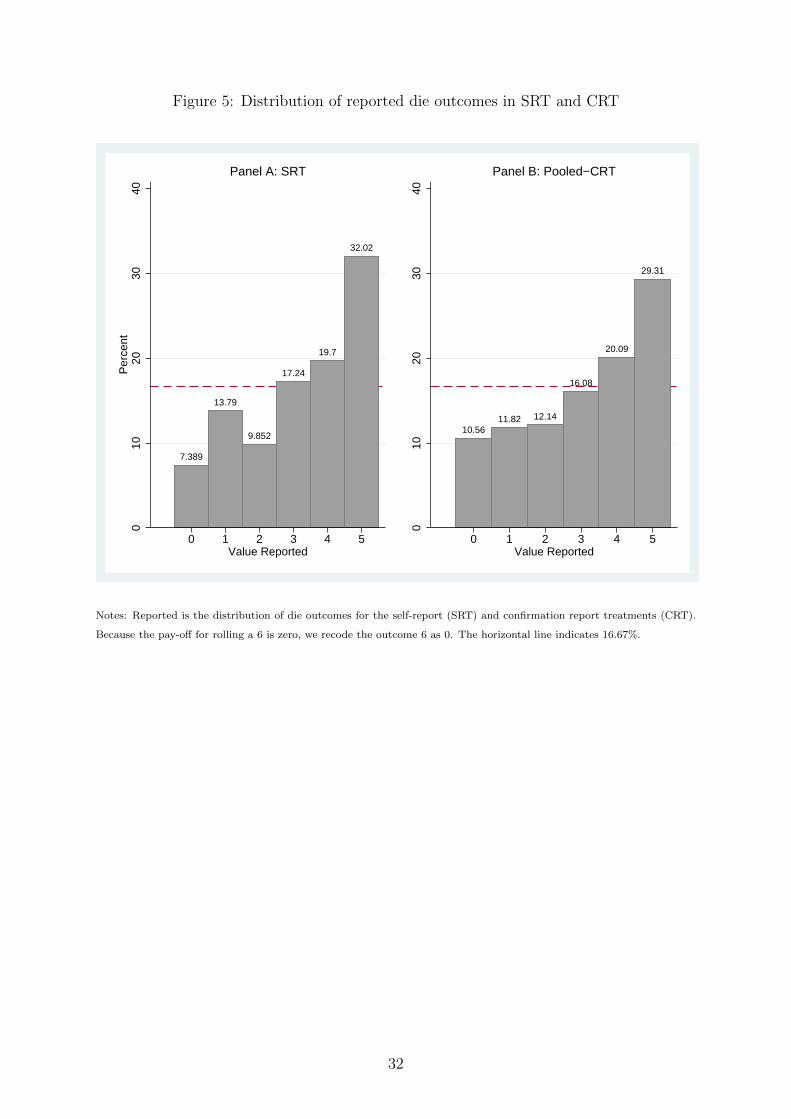
Figure 5: Distribution of reported die outcomes in SRT and CRT
7.389
13.79
9.852
17.24
19.7
32.02
010
2030
40P
erce
nt
0 1 2 3 4 5Value Reported
Panel A: SRT
10.5611.82 12.14
16.08
20.09
29.31
010
2030
40
0 1 2 3 4 5Value Reported
Panel B: Pooled−CRT
Notes: Reported is the distribution of die outcomes for the self-report (SRT) and confirmation report treatments (CRT).
Because the pay-off for rolling a 6 is zero, we recode the outcome 6 as 0. The horizontal line indicates 16.67%.
32
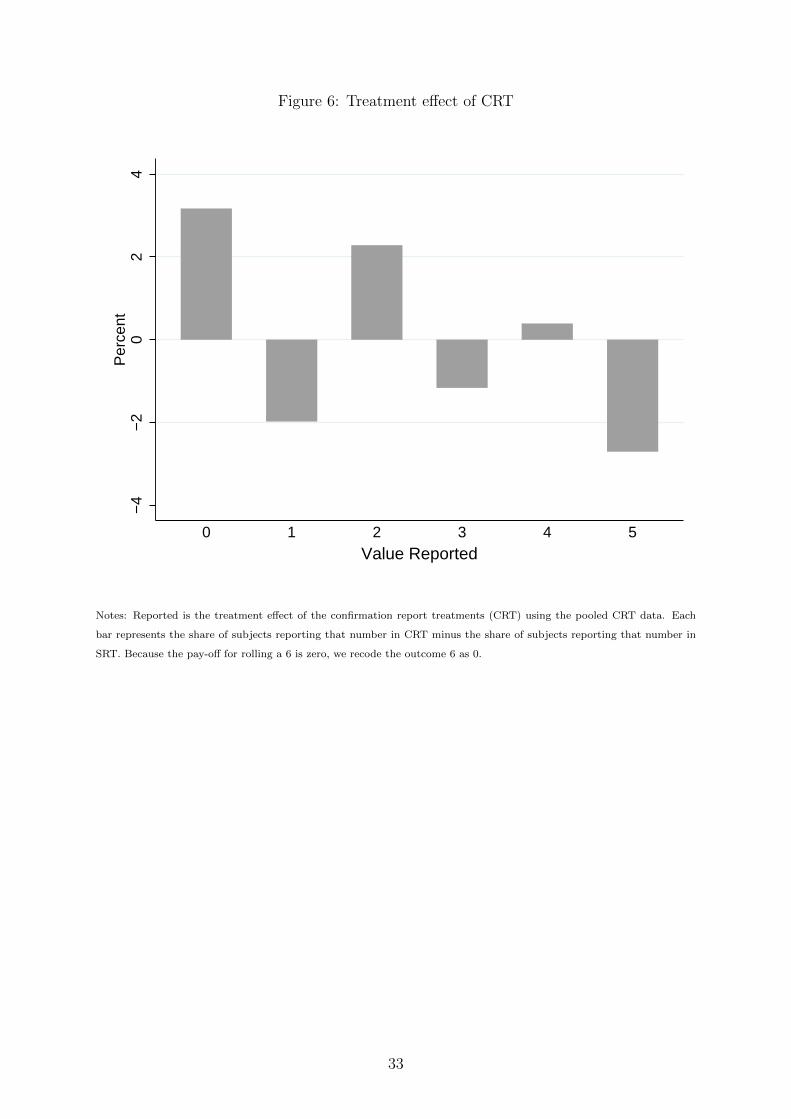
Figure 6: Treatment effect of CRT
−4
−2
02
4P
erce
nt
0 1 2 3 4 5Value Reported
Notes: Reported is the treatment effect of the confirmation report treatments (CRT) using the pooled CRT data. Each
bar represents the share of subjects reporting that number in CRT minus the share of subjects reporting that number in
SRT. Because the pay-off for rolling a 6 is zero, we recode the outcome 6 as 0.
33
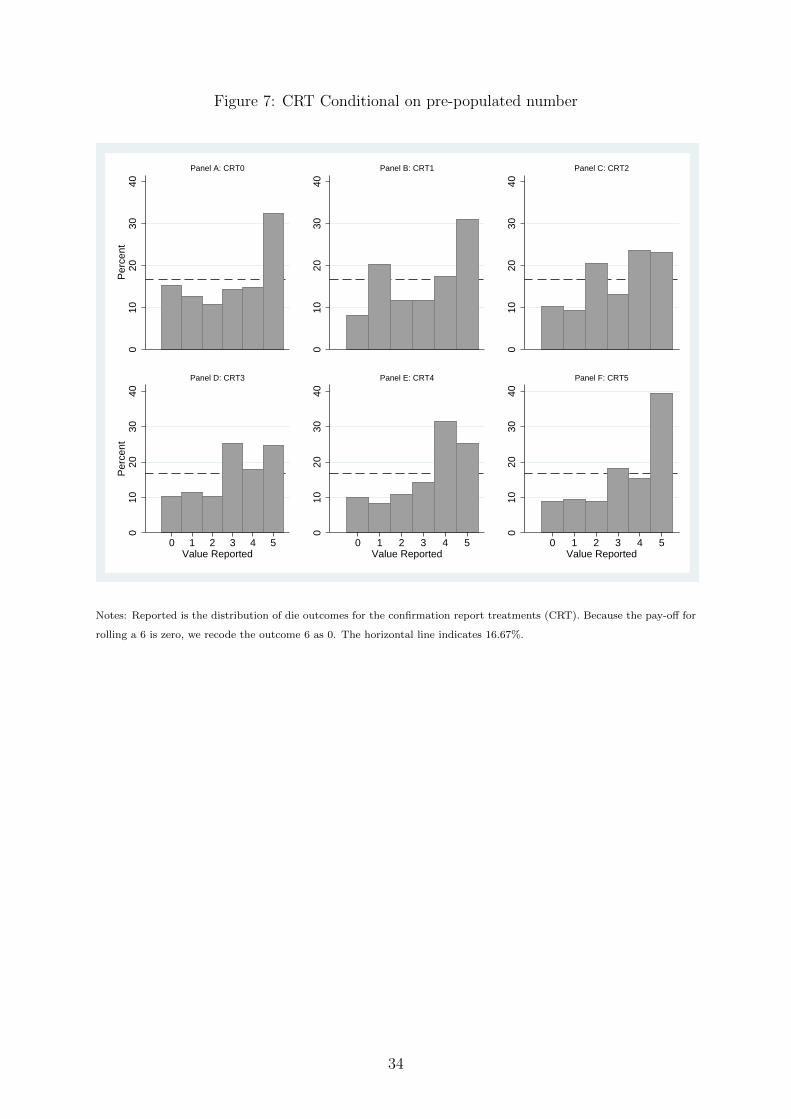
Figure 7: CRT Conditional on pre-populated number
010
2030
40P
erce
nt
Panel A: CRT0
010
2030
40
Panel B: CRT1
010
2030
40
Panel C: CRT2
010
2030
40P
erce
nt
0 1 2 3 4 5Value Reported
Panel D: CRT3
010
2030
40
0 1 2 3 4 5Value Reported
Panel E: CRT4
010
2030
40
0 1 2 3 4 5Value Reported
Panel F: CRT5
Notes: Reported is the distribution of die outcomes for the confirmation report treatments (CRT). Because the pay-off for
rolling a 6 is zero, we recode the outcome 6 as 0. The horizontal line indicates 16.67%.
34
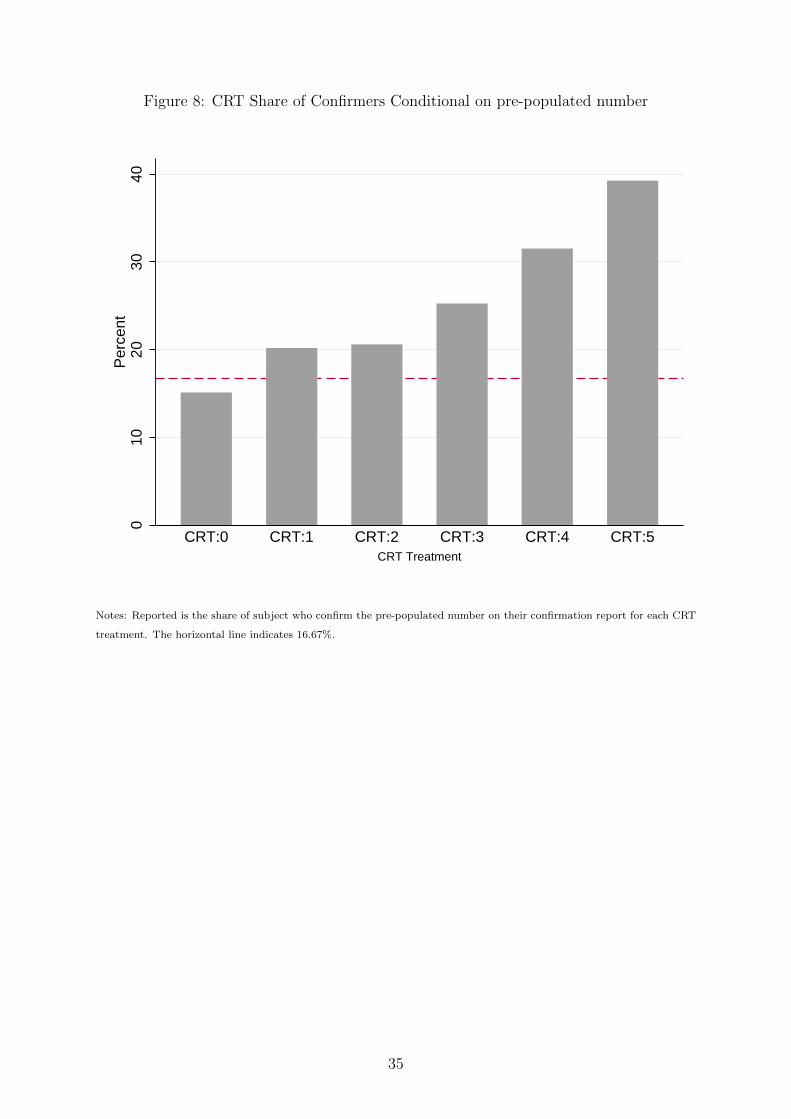
Figure 8: CRT Share of Confirmers Conditional on pre-populated number
010
2030
40P
erce
nt
CRT:0 CRT:1 CRT:2 CRT:3 CRT:4 CRT:5CRT Treatment
Notes: Reported is the share of subject who confirm the pre-populated number on their confirmation report for each CRT
treatment. The horizontal line indicates 16.67%.
35
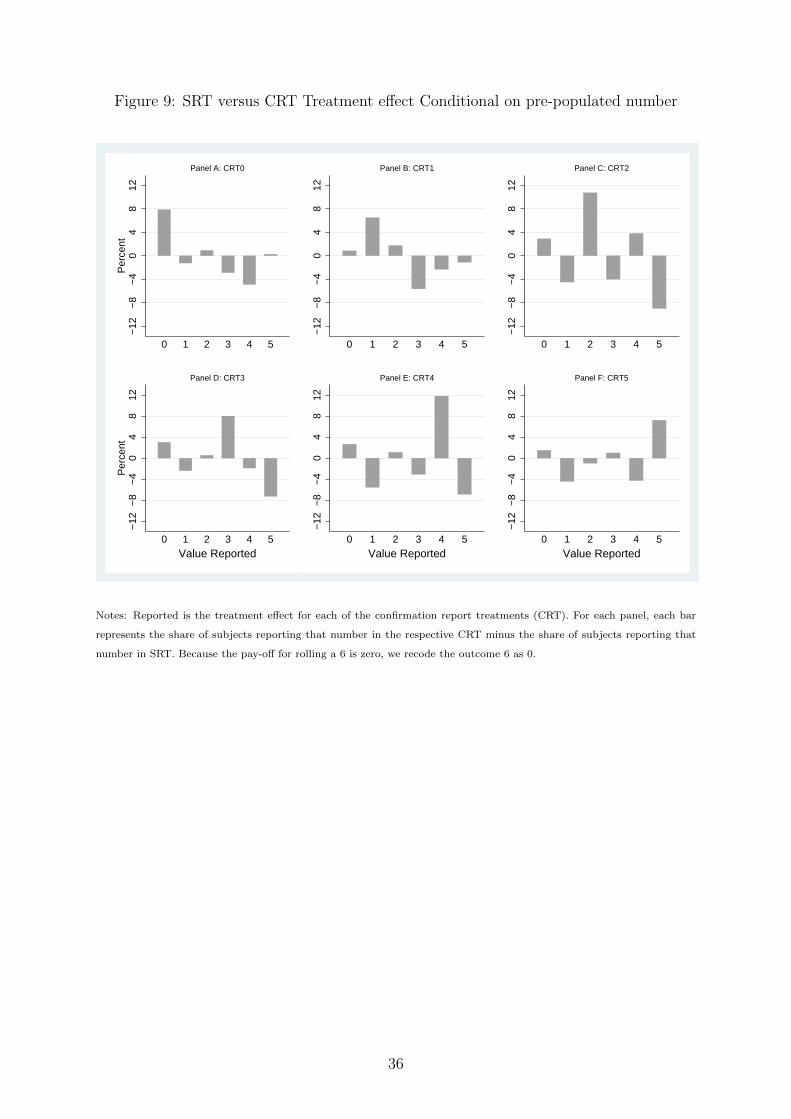
Figure 9: SRT versus CRT Treatment effect Conditional on pre-populated number
−12
−8
−4
04
812
Per
cent
0 1 2 3 4 5
Panel A: CRT0
−12
−8
−4
04
812
0 1 2 3 4 5
Panel B: CRT1
−12
−8
−4
04
812
0 1 2 3 4 5
Panel C: CRT2
−12
−8
−4
04
812
Per
cent
0 1 2 3 4 5Value Reported
Panel D: CRT3
−12
−8
−4
04
812
0 1 2 3 4 5Value Reported
Panel E: CRT4
−12
−8
−4
04
812
0 1 2 3 4 5Value Reported
Panel F: CRT5
Notes: Reported is the treatment effect for each of the confirmation report treatments (CRT). For each panel, each bar
represents the share of subjects reporting that number in the respective CRT minus the share of subjects reporting that
number in SRT. Because the pay-off for rolling a 6 is zero, we recode the outcome 6 as 0.
36
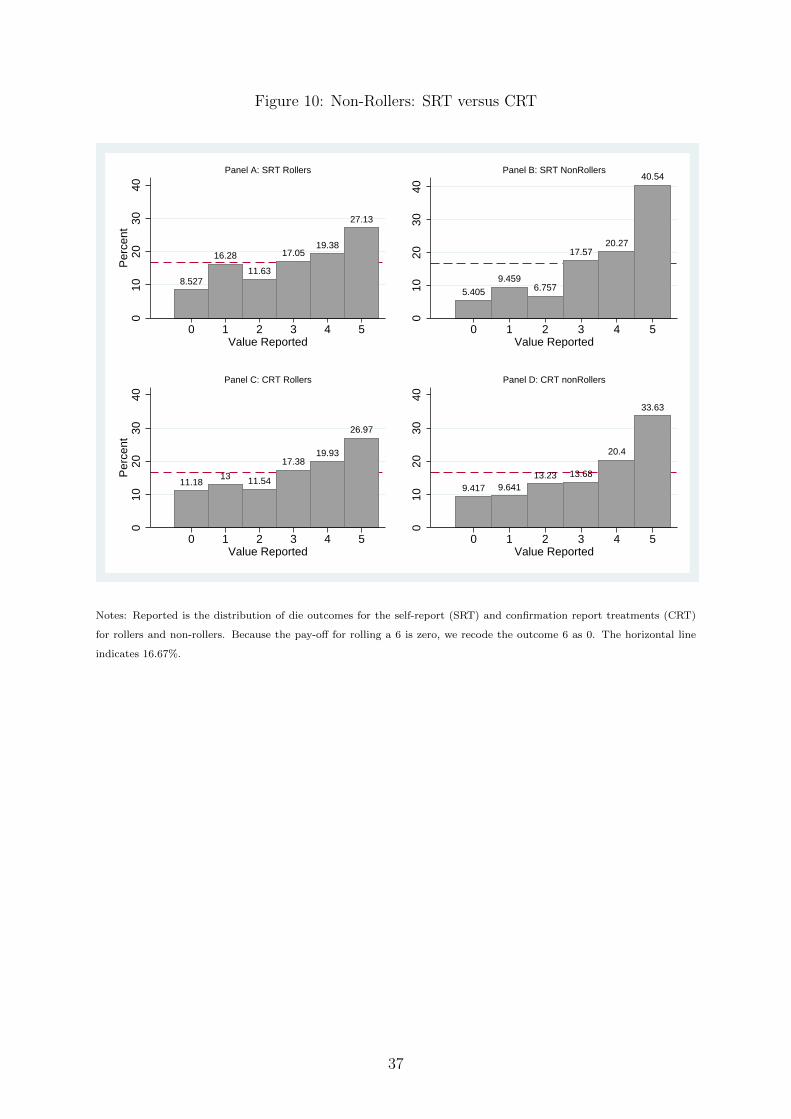
Figure 10: Non-Rollers: SRT versus CRT
8.527
16.28
11.63
17.0519.38
27.13
010
2030
40P
erce
nt
0 1 2 3 4 5Value Reported
Panel A: SRT Rollers
5.405
9.4596.757
17.5720.27
40.54
010
2030
40
0 1 2 3 4 5Value Reported
Panel B: SRT NonRollers
11.1813 11.54
17.3819.93
26.97
010
2030
40P
erce
nt
0 1 2 3 4 5Value Reported
Panel C: CRT Rollers
9.417 9.64113.23 13.68
20.4
33.630
1020
3040
0 1 2 3 4 5Value Reported
Panel D: CRT nonRollers
Notes: Reported is the distribution of die outcomes for the self-report (SRT) and confirmation report treatments (CRT)
for rollers and non-rollers. Because the pay-off for rolling a 6 is zero, we recode the outcome 6 as 0. The horizontal line
indicates 16.67%.
37
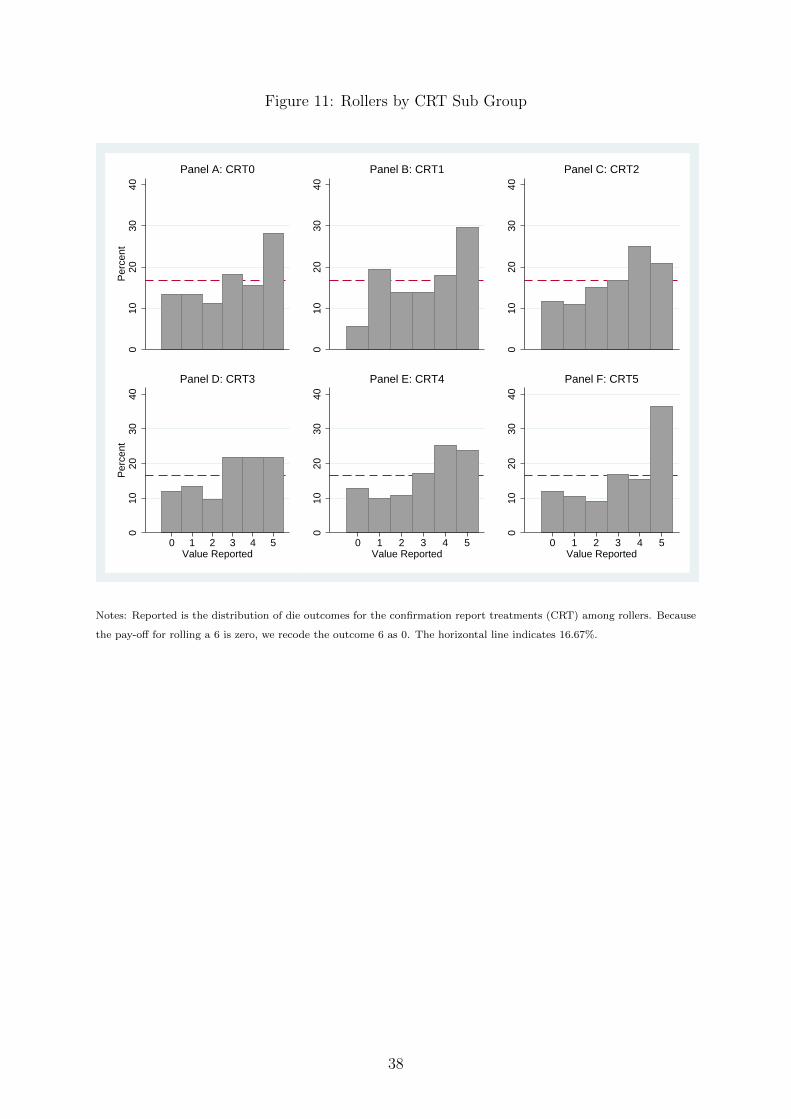
Figure 11: Rollers by CRT Sub Group
010
2030
40P
erce
nt
Panel A: CRT0
010
2030
40
Panel B: CRT1
010
2030
40
Panel C: CRT2
010
2030
40P
erce
nt
0 1 2 3 4 5Value Reported
Panel D: CRT3
010
2030
40
0 1 2 3 4 5Value Reported
Panel E: CRT4
010
2030
40
0 1 2 3 4 5Value Reported
Panel F: CRT5
Notes: Reported is the distribution of die outcomes for the confirmation report treatments (CRT) among rollers. Because
the pay-off for rolling a 6 is zero, we recode the outcome 6 as 0. The horizontal line indicates 16.67%.
38
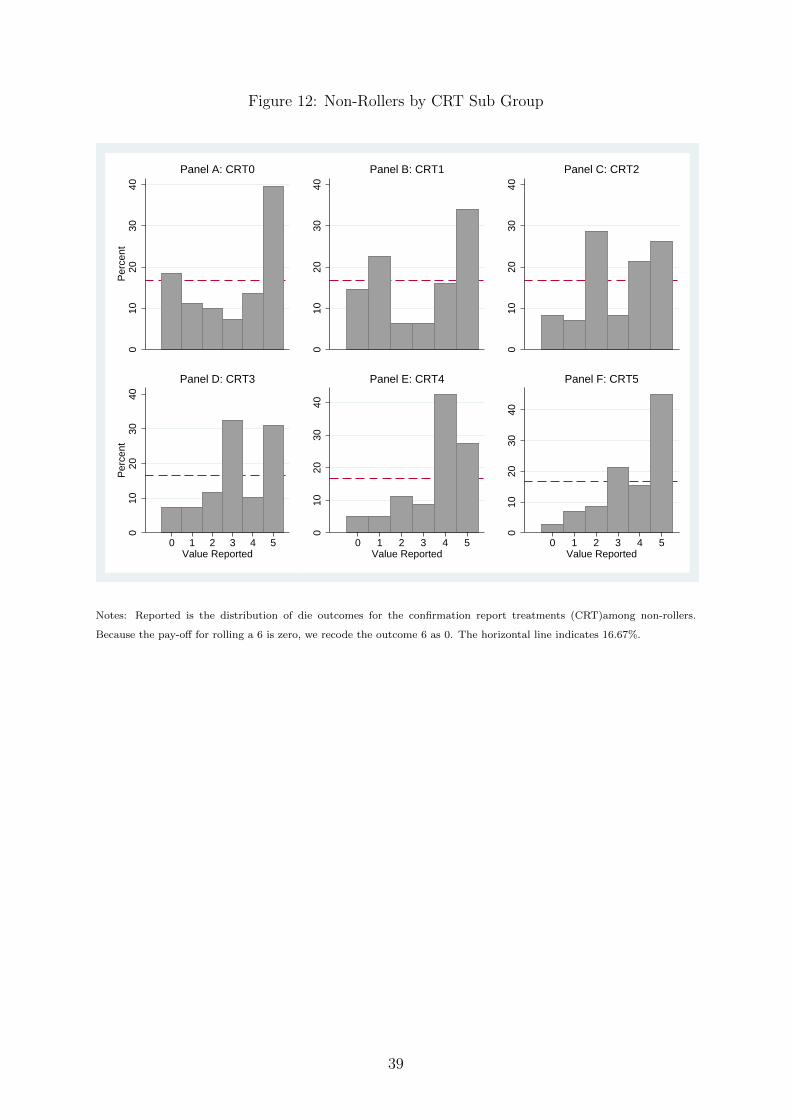
Figure 12: Non-Rollers by CRT Sub Group
010
2030
40P
erce
nt
Panel A: CRT0
010
2030
40
Panel B: CRT1
010
2030
40
Panel C: CRT2
010
2030
40P
erce
nt
0 1 2 3 4 5Value Reported
Panel D: CRT3
010
2030
40
0 1 2 3 4 5Value Reported
Panel E: CRT4
010
2030
40
0 1 2 3 4 5Value Reported
Panel F: CRT5
Notes: Reported is the distribution of die outcomes for the confirmation report treatments (CRT)among non-rollers.
Because the pay-off for rolling a 6 is zero, we recode the outcome 6 as 0. The horizontal line indicates 16.67%.
39
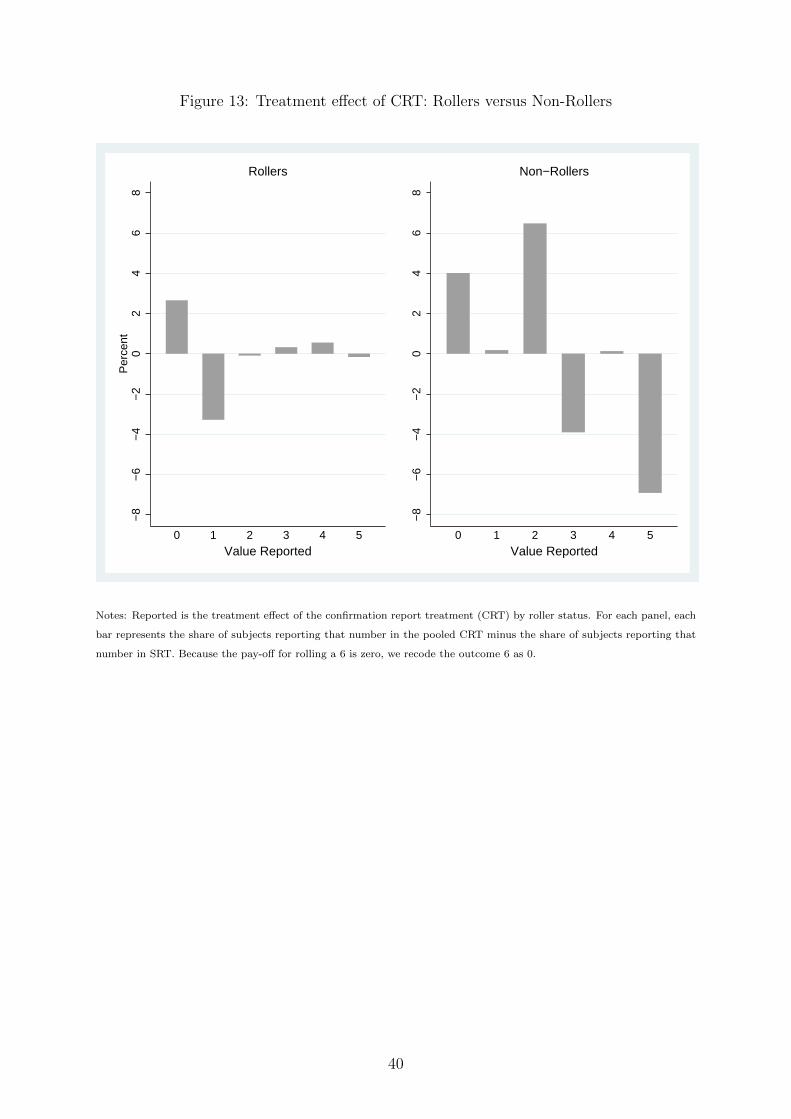
Figure 13: Treatment effect of CRT: Rollers versus Non-Rollers
−8
−6
−4
−2
02
46
8P
erce
nt
0 1 2 3 4 5Value Reported
Rollers
−8
−6
−4
−2
02
46
8
0 1 2 3 4 5Value Reported
Non−Rollers
Notes: Reported is the treatment effect of the confirmation report treatment (CRT) by roller status. For each panel, each
bar represents the share of subjects reporting that number in the pooled CRT minus the share of subjects reporting that
number in SRT. Because the pay-off for rolling a 6 is zero, we recode the outcome 6 as 0.
40
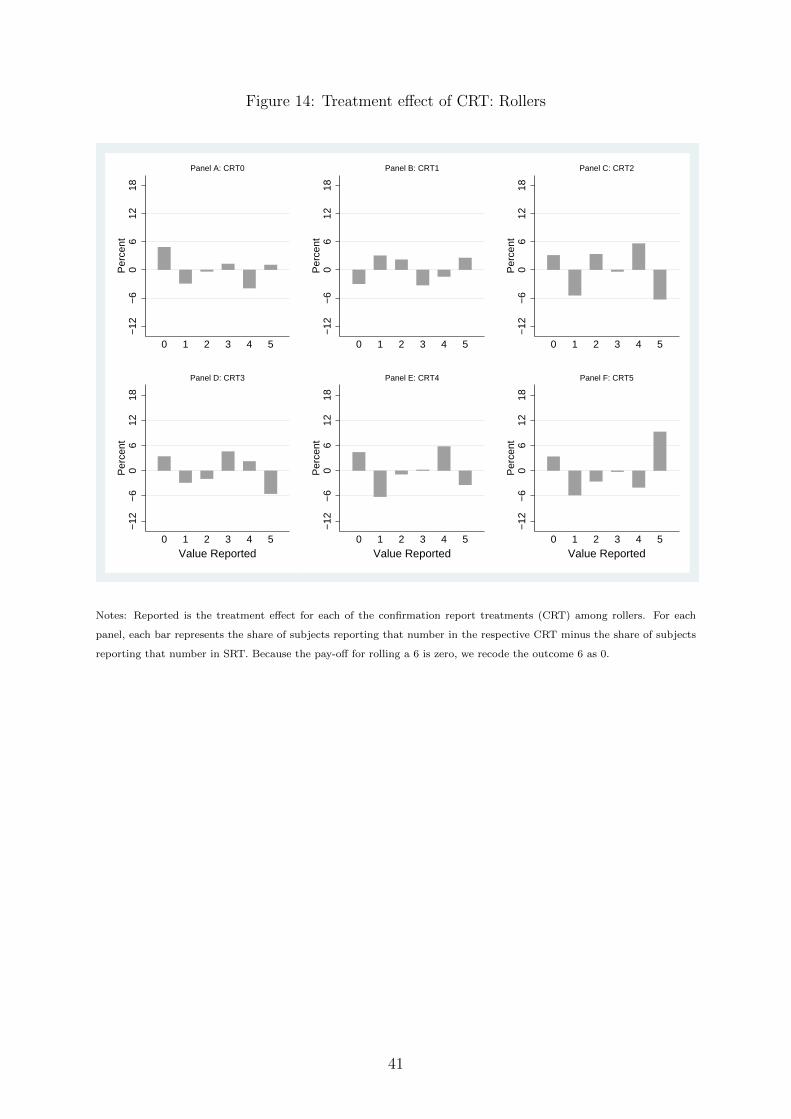
Figure 14: Treatment effect of CRT: Rollers
−12
−6
06
1218
Per
cent
0 1 2 3 4 5
Panel A: CRT0
−12
−6
06
1218
Per
cent
0 1 2 3 4 5
Panel B: CRT1
−12
−6
06
1218
Per
cent
0 1 2 3 4 5
Panel C: CRT2
−12
−6
06
1218
Per
cent
0 1 2 3 4 5Value Reported
Panel D: CRT3
−12
−6
06
1218
Per
cent
0 1 2 3 4 5Value Reported
Panel E: CRT4
−12
−6
06
1218
Per
cent
0 1 2 3 4 5Value Reported
Panel F: CRT5
Notes: Reported is the treatment effect for each of the confirmation report treatments (CRT) among rollers. For each
panel, each bar represents the share of subjects reporting that number in the respective CRT minus the share of subjects
reporting that number in SRT. Because the pay-off for rolling a 6 is zero, we recode the outcome 6 as 0.
41
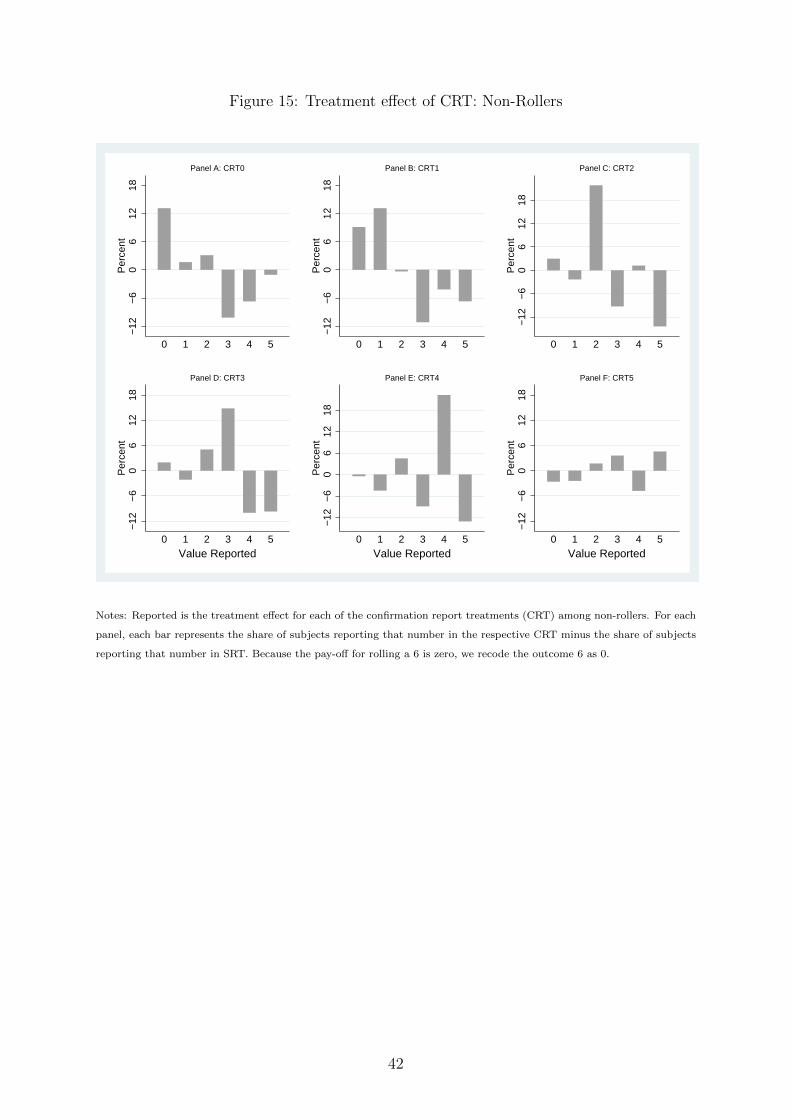
Figure 15: Treatment effect of CRT: Non-Rollers
−12
−6
06
1218
Per
cent
0 1 2 3 4 5
Panel A: CRT0
−12
−6
06
1218
Per
cent
0 1 2 3 4 5
Panel B: CRT1
−12
−6
06
1218
Per
cent
0 1 2 3 4 5
Panel C: CRT2
−12
−6
06
1218
Per
cent
0 1 2 3 4 5Value Reported
Panel D: CRT3
−12
−6
06
1218
Per
cent
0 1 2 3 4 5Value Reported
Panel E: CRT4
−12
−6
06
1218
Per
cent
0 1 2 3 4 5Value Reported
Panel F: CRT5
Notes: Reported is the treatment effect for each of the confirmation report treatments (CRT) among non-rollers. For each
panel, each bar represents the share of subjects reporting that number in the respective CRT minus the share of subjects
reporting that number in SRT. Because the pay-off for rolling a 6 is zero, we recode the outcome 6 as 0.
42
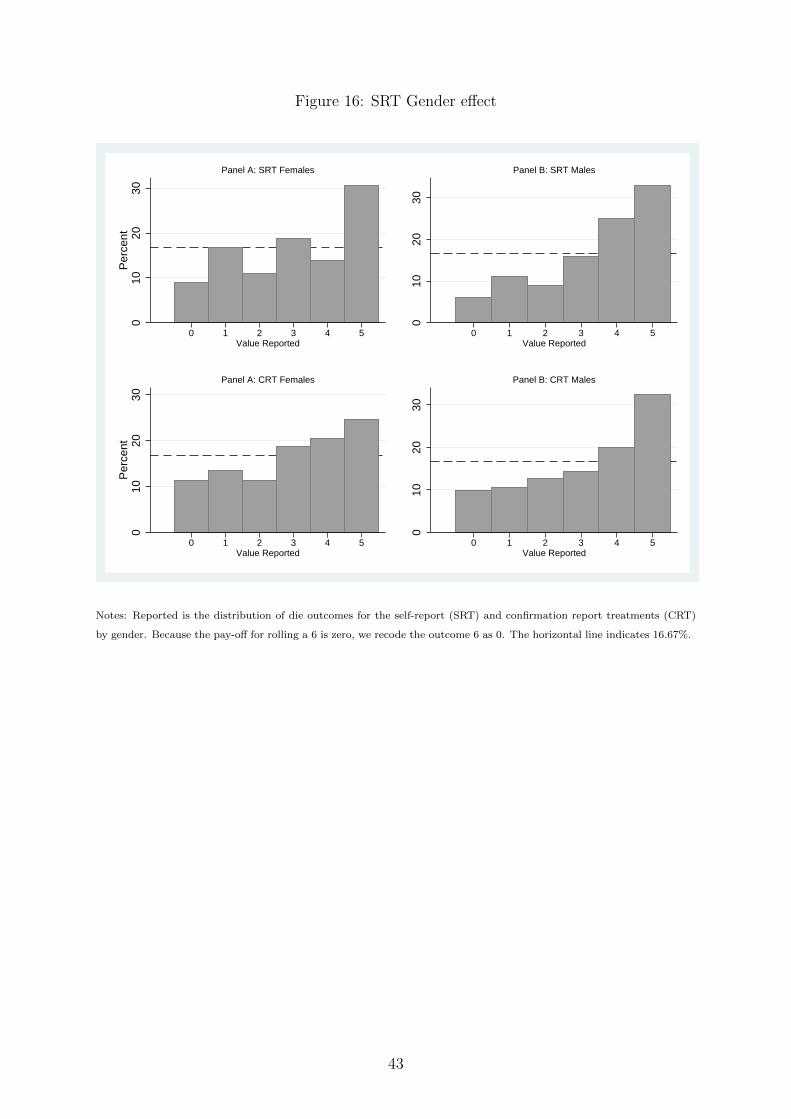
Figure 16: SRT Gender effect
010
2030
Per
cent
0 1 2 3 4 5Value Reported
Panel A: SRT Females
010
2030
0 1 2 3 4 5Value Reported
Panel B: SRT Males
010
2030
Per
cent
0 1 2 3 4 5Value Reported
Panel A: CRT Females
010
2030
0 1 2 3 4 5Value Reported
Panel B: CRT Males
Notes: Reported is the distribution of die outcomes for the self-report (SRT) and confirmation report treatments (CRT)
by gender. Because the pay-off for rolling a 6 is zero, we recode the outcome 6 as 0. The horizontal line indicates 16.67%.
43
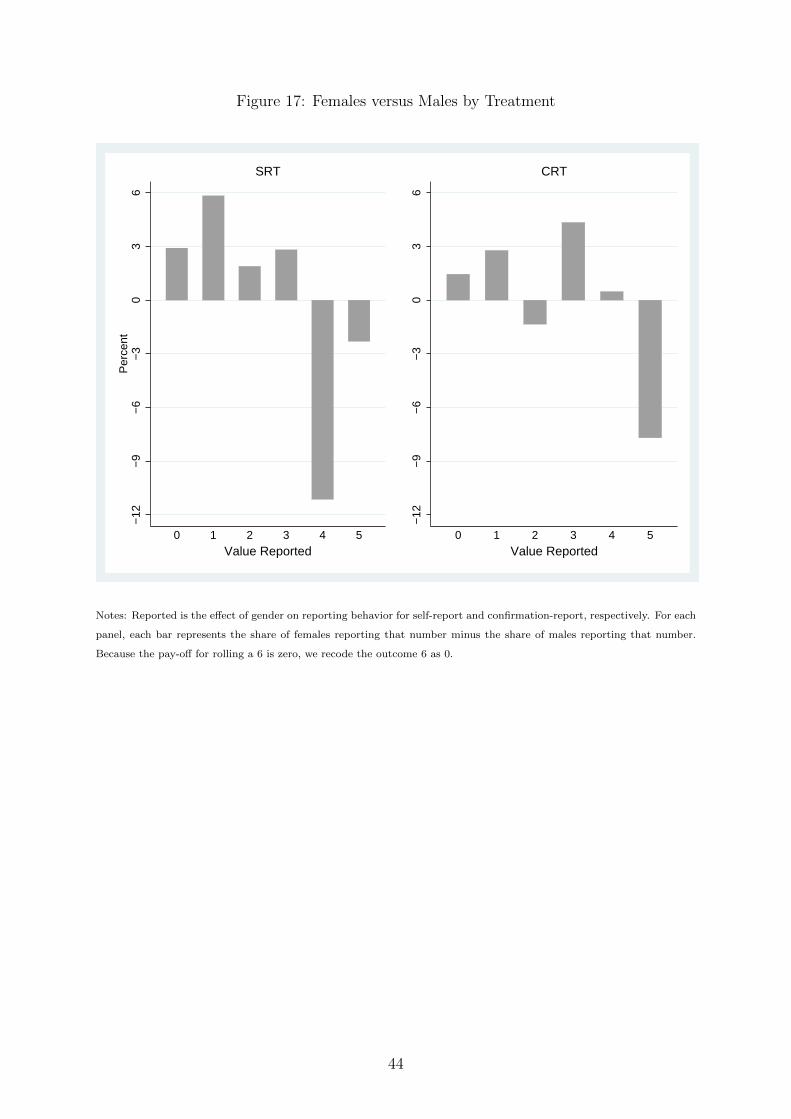
Figure 17: Females versus Males by Treatment
−12
−9
−6
−3
03
6P
erce
nt
0 1 2 3 4 5Value Reported
SRT
−12
−9
−6
−3
03
6
0 1 2 3 4 5Value Reported
CRT
Notes: Reported is the effect of gender on reporting behavior for self-report and confirmation-report, respectively. For each
panel, each bar represents the share of females reporting that number minus the share of males reporting that number.
Because the pay-off for rolling a 6 is zero, we recode the outcome 6 as 0.
44
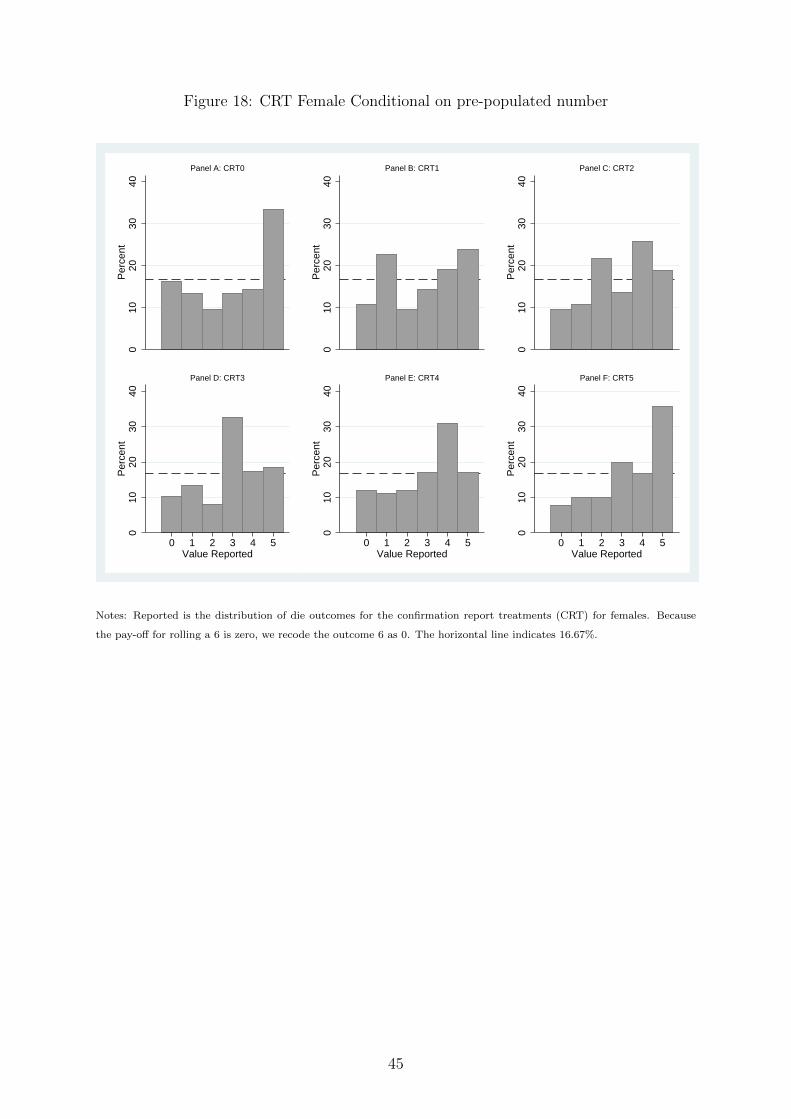
Figure 18: CRT Female Conditional on pre-populated number
010
2030
40P
erce
nt
Panel A: CRT0
010
2030
40P
erce
nt
Panel B: CRT1
010
2030
40P
erce
nt
Panel C: CRT2
010
2030
40P
erce
nt
0 1 2 3 4 5Value Reported
Panel D: CRT3
010
2030
40P
erce
nt
0 1 2 3 4 5Value Reported
Panel E: CRT4
010
2030
40P
erce
nt
0 1 2 3 4 5Value Reported
Panel F: CRT5
Notes: Reported is the distribution of die outcomes for the confirmation report treatments (CRT) for females. Because
the pay-off for rolling a 6 is zero, we recode the outcome 6 as 0. The horizontal line indicates 16.67%.
45

Figure 19: CRT Male Conditional on pre-populated number
010
2030
40P
erce
nt
Panel A: CRT0
010
2030
40P
erce
nt
Panel B: CRT1
010
2030
40P
erce
nt
Panel C: CRT2
010
2030
40P
erce
nt
0 1 2 3 4 5Value Reported
Panel D: CRT3
010
2030
40P
erce
nt
0 1 2 3 4 5Value Reported
Panel E: CRT4
010
2030
40P
erce
nt
0 1 2 3 4 5Value Reported
Panel F: CRT5
Notes: Reported is the distribution of die outcomes for the confirmation report treatments (CRT) for males. Because the
pay-off for rolling a 6 is zero, we recode the outcome 6 as 0. The horizontal line indicates 16.67%.
46
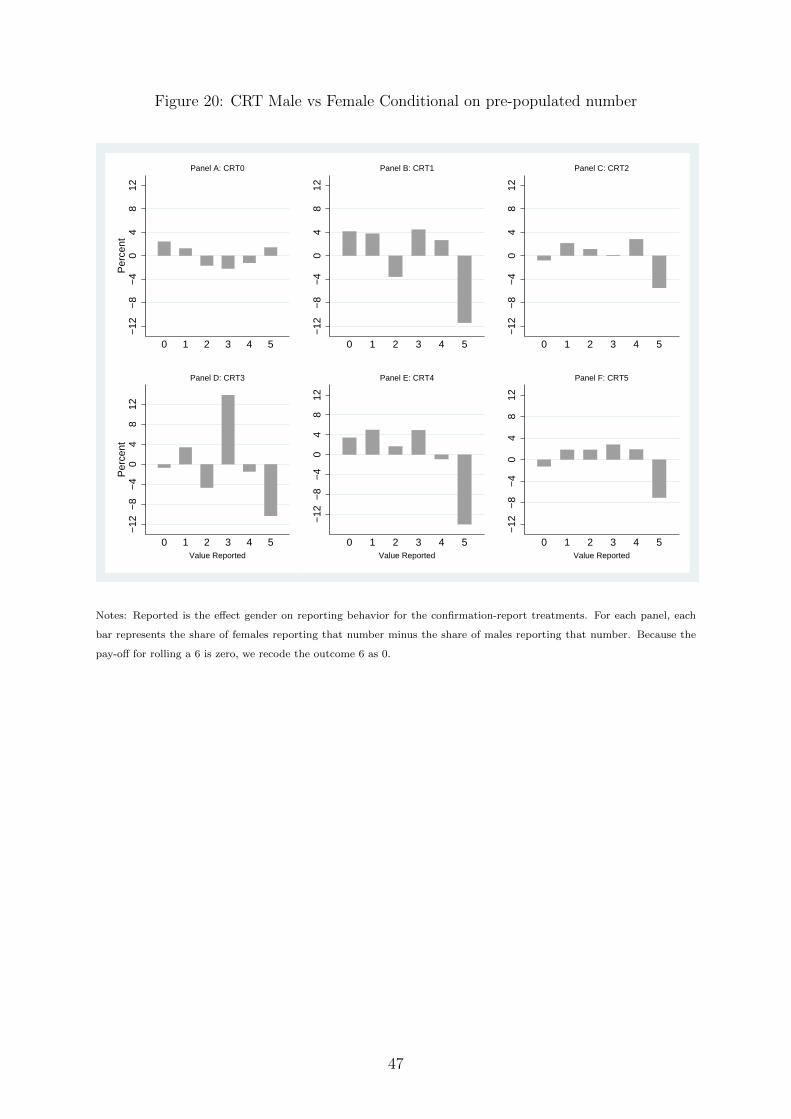
Figure 20: CRT Male vs Female Conditional on pre-populated number
−12
−8
−4
04
812
Per
cent
0 1 2 3 4 5
Panel A: CRT0
−12
−8
−4
04
812
0 1 2 3 4 5
Panel B: CRT1
−12
−8
−4
04
812
0 1 2 3 4 5
Panel C: CRT2
−12
−8
−4
04
812
Per
cent
0 1 2 3 4 5Value Reported
Panel D: CRT3
−12
−8
−4
04
812
0 1 2 3 4 5Value Reported
Panel E: CRT4
−12
−8
−4
04
812
0 1 2 3 4 5Value Reported
Panel F: CRT5
Notes: Reported is the effect gender on reporting behavior for the confirmation-report treatments. For each panel, each
bar represents the share of females reporting that number minus the share of males reporting that number. Because the
pay-off for rolling a 6 is zero, we recode the outcome 6 as 0.
47
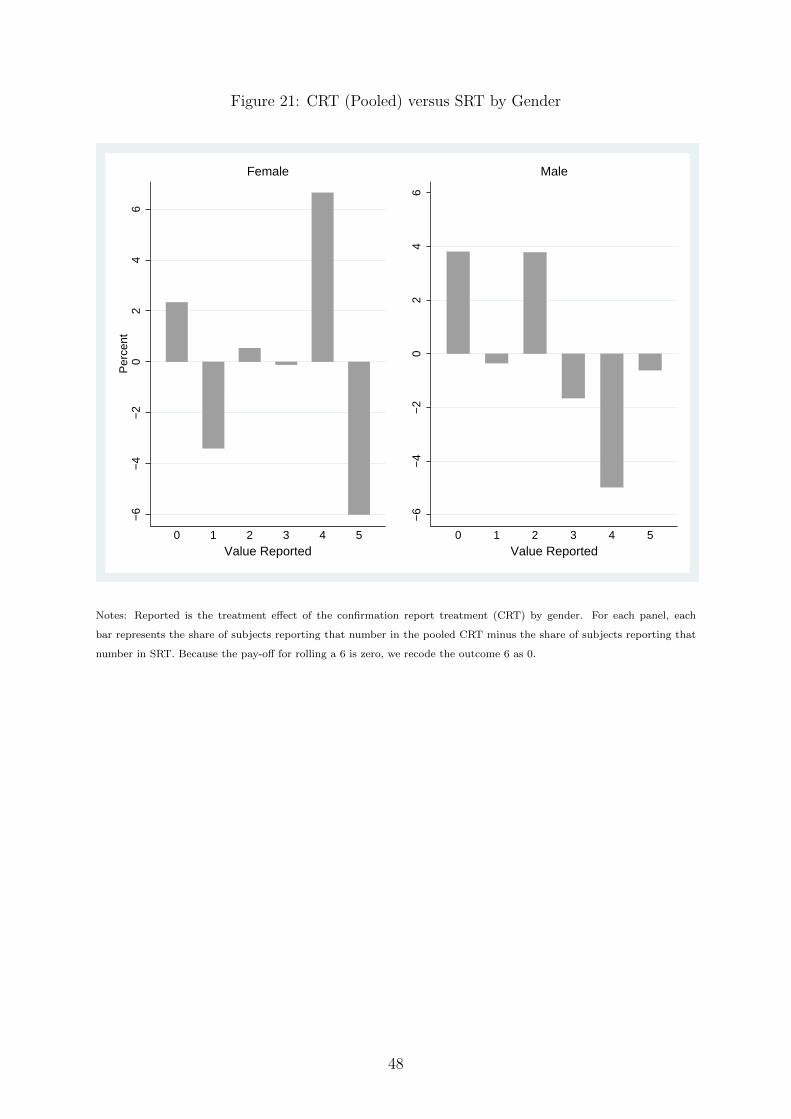
Figure 21: CRT (Pooled) versus SRT by Gender
−6
−4
−2
02
46
Per
cent
0 1 2 3 4 5Value Reported
Female
−6
−4
−2
02
46
0 1 2 3 4 5Value Reported
Male
Notes: Reported is the treatment effect of the confirmation report treatment (CRT) by gender. For each panel, each
bar represents the share of subjects reporting that number in the pooled CRT minus the share of subjects reporting that
number in SRT. Because the pay-off for rolling a 6 is zero, we recode the outcome 6 as 0.
48
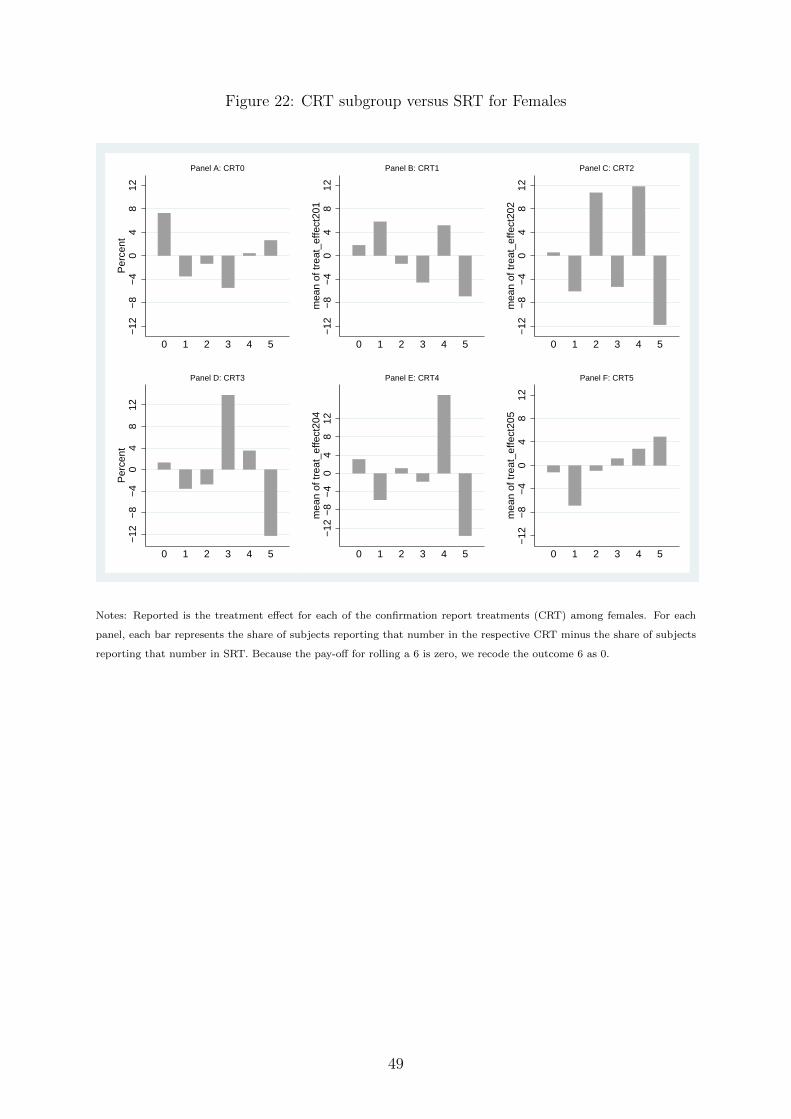
Figure 22: CRT subgroup versus SRT for Females
−12
−8
−4
04
812
Per
cent
0 1 2 3 4 5
Panel A: CRT0
−12
−8
−4
04
812
mea
n of
trea
t_ef
fect
201
0 1 2 3 4 5
Panel B: CRT1
−12
−8
−4
04
812
mea
n of
trea
t_ef
fect
202
0 1 2 3 4 5
Panel C: CRT2
−12
−8
−4
04
812
Per
cent
0 1 2 3 4 5
Panel D: CRT3
−12
−8
−4
04
812
mea
n of
trea
t_ef
fect
204
0 1 2 3 4 5
Panel E: CRT4
−12
−8
−4
04
812
mea
n of
trea
t_ef
fect
205
0 1 2 3 4 5
Panel F: CRT5
Notes: Reported is the treatment effect for each of the confirmation report treatments (CRT) among females. For each
panel, each bar represents the share of subjects reporting that number in the respective CRT minus the share of subjects
reporting that number in SRT. Because the pay-off for rolling a 6 is zero, we recode the outcome 6 as 0.
49
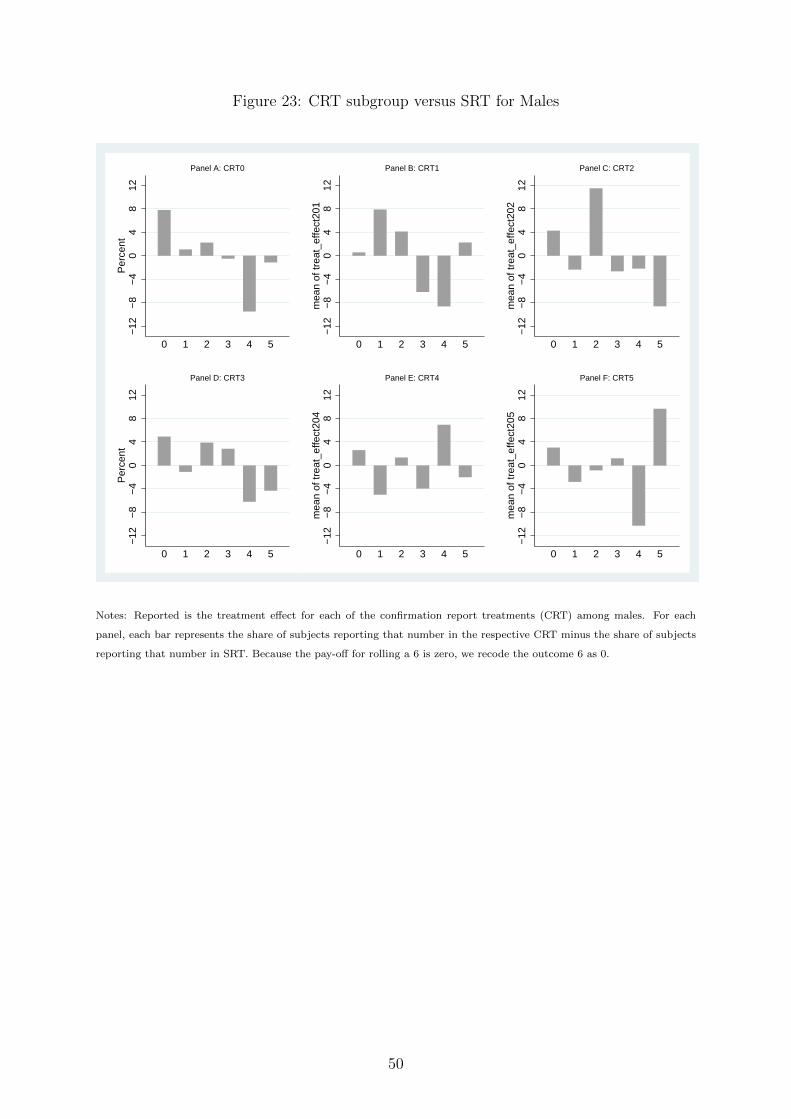
Figure 23: CRT subgroup versus SRT for Males
−12
−8
−4
04
812
Per
cent
0 1 2 3 4 5
Panel A: CRT0
−12
−8
−4
04
812
mea
n of
trea
t_ef
fect
201
0 1 2 3 4 5
Panel B: CRT1
−12
−8
−4
04
812
mea
n of
trea
t_ef
fect
202
0 1 2 3 4 5
Panel C: CRT2
−12
−8
−4
04
812
Per
cent
0 1 2 3 4 5
Panel D: CRT3
−12
−8
−4
04
812
mea
n of
trea
t_ef
fect
204
0 1 2 3 4 5
Panel E: CRT4
−12
−8
−4
04
812
mea
n of
trea
t_ef
fect
205
0 1 2 3 4 5
Panel F: CRT5
Notes: Reported is the treatment effect for each of the confirmation report treatments (CRT) among males. For each
panel, each bar represents the share of subjects reporting that number in the respective CRT minus the share of subjects
reporting that number in SRT. Because the pay-off for rolling a 6 is zero, we recode the outcome 6 as 0.
50