Liability Report - POOL / PACT to Board Packet 2013.pdf · Location Avg. Days Minden Gardnerville...
46
Liability Report
Transcript of Liability Report - POOL / PACT to Board Packet 2013.pdf · Location Avg. Days Minden Gardnerville...

Liability Report
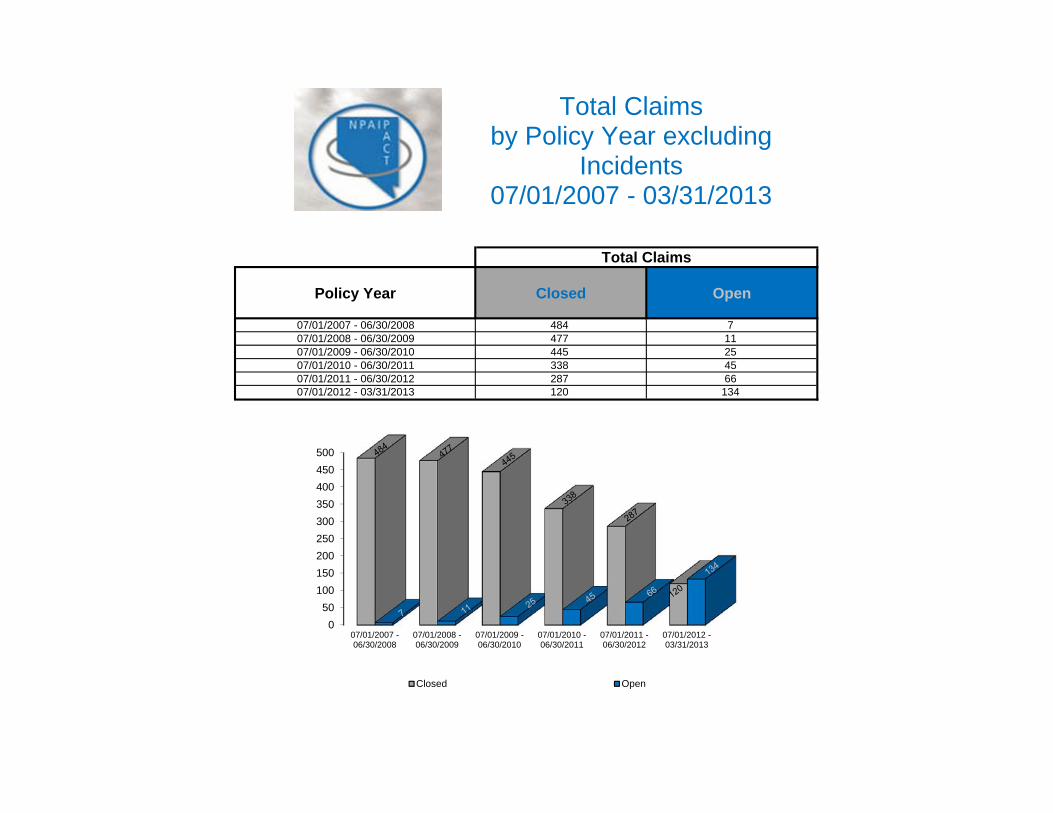
Policy Year Closed Open
07/01/2007 - 06/30/2008 484 707/01/2008 - 06/30/2009 477 1107/01/2009 - 06/30/2010 445 2507/01/2010 - 06/30/2011 338 4507/01/2011 - 06/30/2012 287 6607/01/2012 - 03/31/2013 120 134
Total Claims
Total Claimsby Policy Year excluding
Incidents07/01/2007 - 03/31/2013
050
100150200250300350400450500
07/01/2007 -06/30/2008
07/01/2008 -06/30/2009
07/01/2009 -06/30/2010
07/01/2010 -06/30/2011
07/01/2011 -06/30/2012
07/01/2012 -03/31/2013
Closed Open
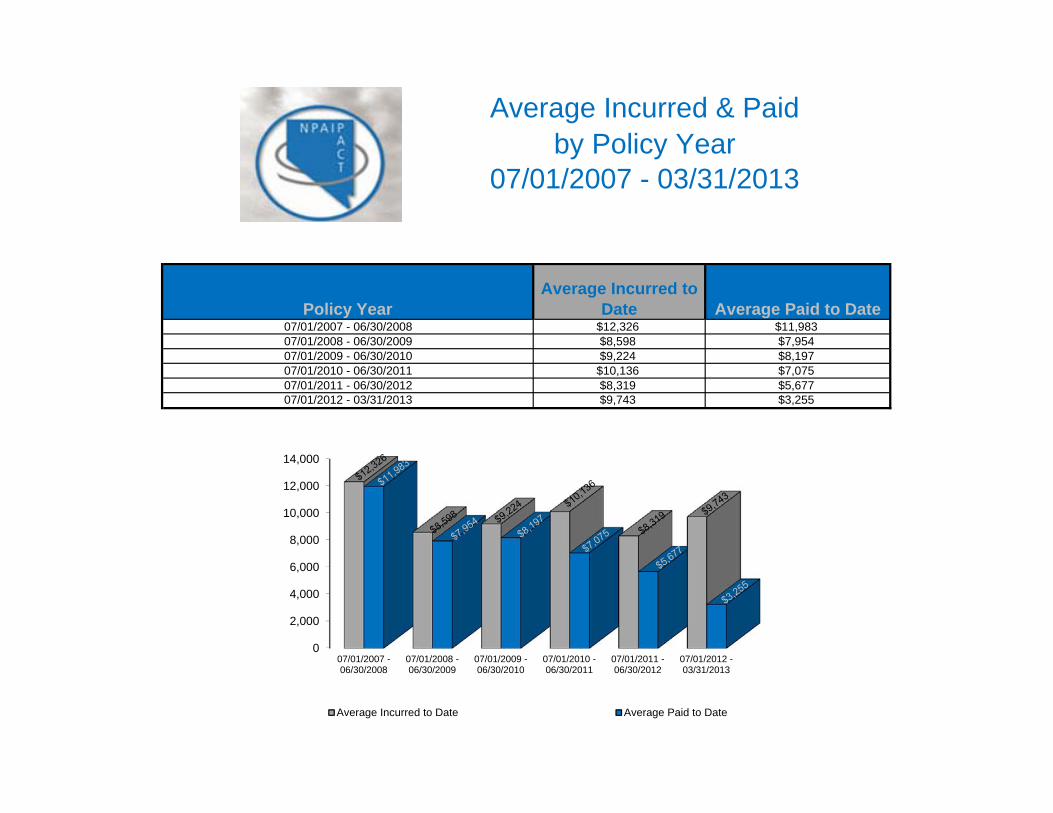
Policy YearAverage Incurred to
Date Average Paid to Date07/01/2007 - 06/30/2008 $12,326 $11,98307/01/2008 - 06/30/2009 $8,598 $7,95407/01/2009 - 06/30/2010 $9,224 $8,19707/01/2010 - 06/30/2011 $10,136 $7,07507/01/2011 - 06/30/2012 $8,319 $5,67707/01/2012 - 03/31/2013 $9,743 $3,255
Average Incurred & Paidby Policy Year
07/01/2007 - 03/31/2013
0
2,000
4,000
6,000
8,000
10,000
12,000
14,000
07/01/2007 -06/30/2008
07/01/2008 -06/30/2009
07/01/2009 -06/30/2010
07/01/2010 -06/30/2011
07/01/2011 -06/30/2012
07/01/2012 -03/31/2013
Average Incurred to Date Average Paid to Date

Policy Year Total Incurred (in 000's)
Total Paid (in 000's)
07/01/2007 - 06/30/2008 $6,052 $5,88407/01/2008 - 06/30/2009 $4,196 $3,88107/01/2009 - 06/30/2010 $4,335 $3,85307/01/2010 - 06/30/2011 $3,882 $2,71007/01/2011 - 06/30/2012 $2,937 $2,00407/01/2012 - 03/31/2013 $2,475 $827
All Claims
Incurred vs Paidby Policy Year
07/01/2007 - 03/31/2013
0
1,000
2,000
3,000
4,000
5,000
6,000
7,000
07/01/2007 -06/30/2008
07/01/2008 -06/30/2009
07/01/2009 -06/30/2010
07/01/2010 -06/30/2011
07/01/2011 -06/30/2012
07/01/2012 -03/31/2013
Total Incurred (in 000's) Total Paid (in 000's)
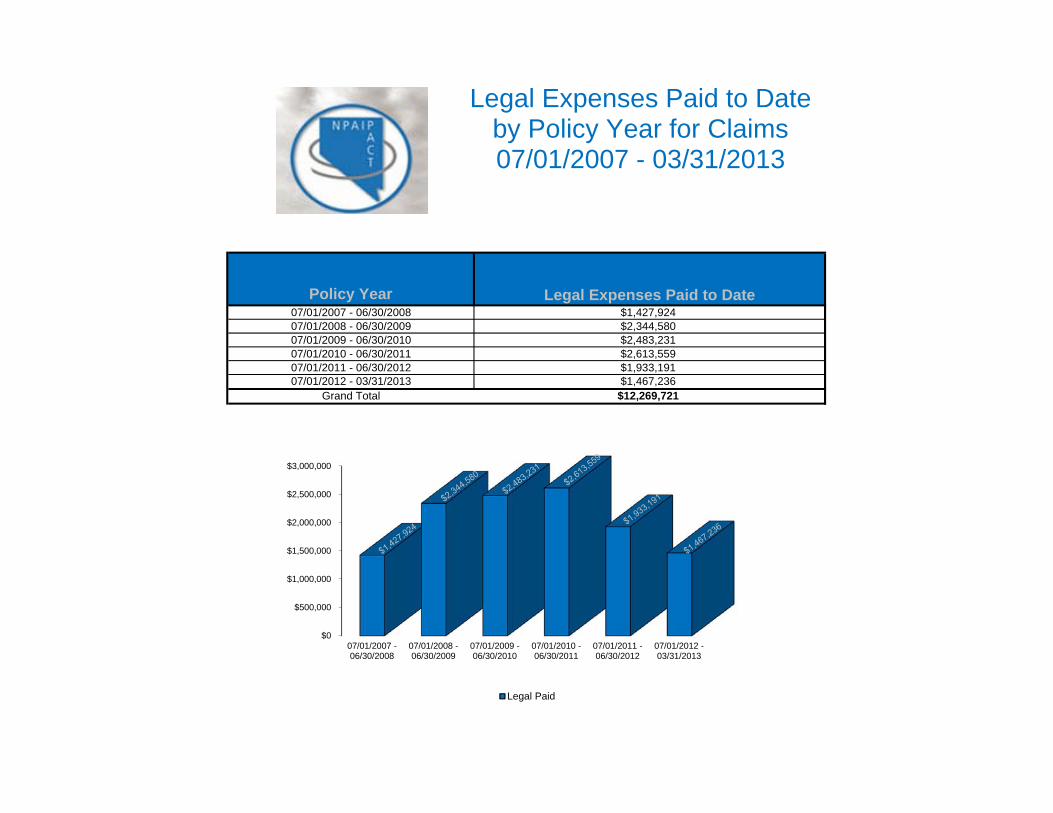
Policy Year07/01/2007 - 06/30/200807/01/2008 - 06/30/200907/01/2009 - 06/30/201007/01/2010 - 06/30/201107/01/2011 - 06/30/201207/01/2012 - 03/31/2013
Grand Total $12,269,721$1,467,236
Legal Expenses Paid to Date$1,427,924$2,344,580$2,483,231$2,613,559$1,933,191
Legal Expenses Paid to Dateby Policy Year for Claims 07/01/2007 - 03/31/2013
$0
$500,000
$1,000,000
$1,500,000
$2,000,000
$2,500,000
$3,000,000
07/01/2007 -06/30/2008
07/01/2008 -06/30/2009
07/01/2009 -06/30/2010
07/01/2010 -06/30/2011
07/01/2011 -06/30/2012
07/01/2012 -03/31/2013
Legal Paid
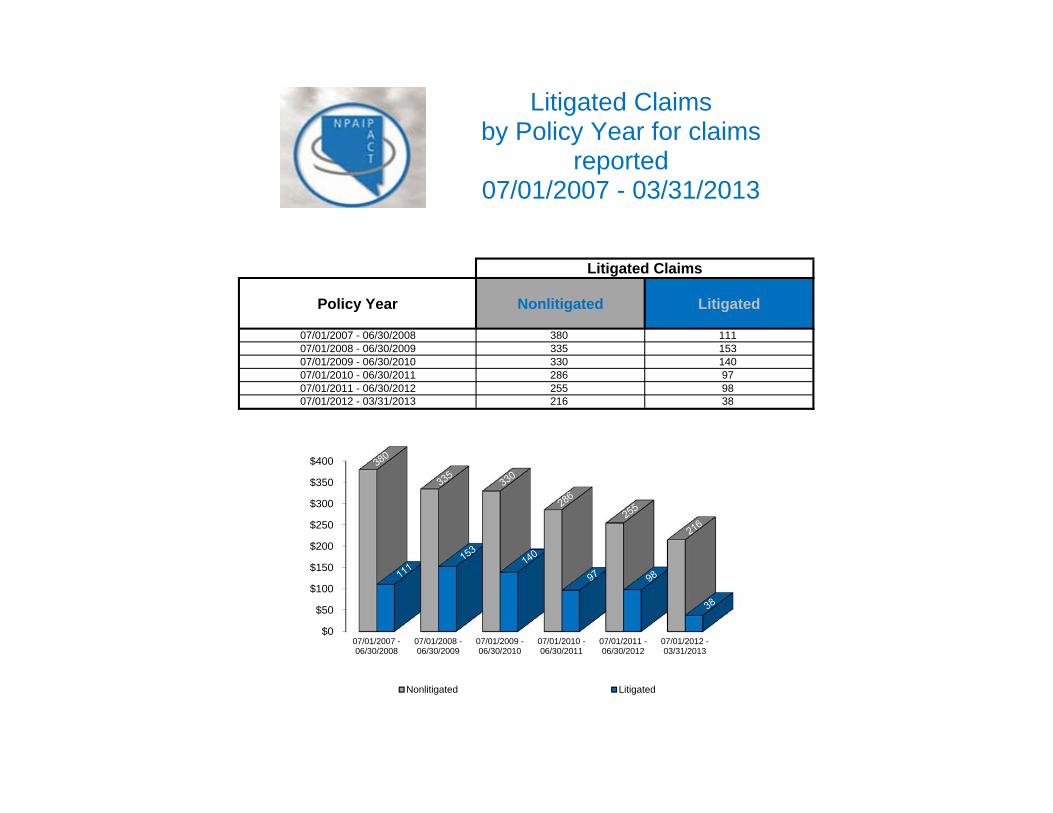
Policy Year Nonlitigated Litigated
07/01/2007 - 06/30/2008 380 11107/01/2008 - 06/30/2009 335 15307/01/2009 - 06/30/2010 330 14007/01/2010 - 06/30/2011 286 9707/01/2011 - 06/30/2012 255 9807/01/2012 - 03/31/2013 216 38
Litigated Claims
Litigated Claimsby Policy Year for claims
reported07/01/2007 - 03/31/2013
$0
$50
$100
$150
$200
$250
$300
$350
$400
07/01/2007 -06/30/2008
07/01/2008 -06/30/2009
07/01/2009 -06/30/2010
07/01/2010 -06/30/2011
07/01/2011 -06/30/2012
07/01/2012 -03/31/2013
Nonlitigated Litigated
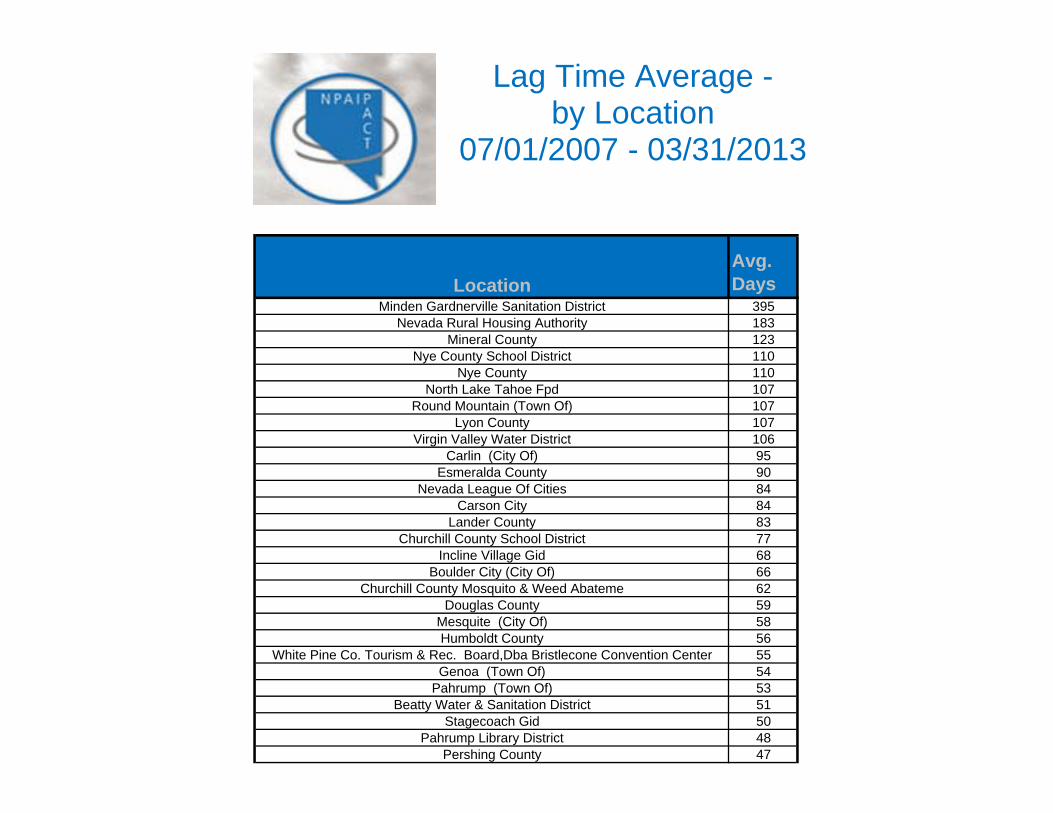
LocationAvg. Days
Minden Gardnerville Sanitation District 395Nevada Rural Housing Authority 183
Mineral County 123Nye County School District 110
Nye County 110North Lake Tahoe Fpd 107
Round Mountain (Town Of) 107Lyon County 107
Virgin Valley Water District 106Carlin (City Of) 95
Esmeralda County 90Nevada League Of Cities 84
Carson City 84Lander County 83
Churchill County School District 77Incline Village Gid 68
Boulder City (City Of) 66Churchill County Mosquito & Weed Abateme 62
Douglas County 59Mesquite (City Of) 58Humboldt County 56
White Pine Co. Tourism & Rec. Board,Dba Bristlecone Convention Center 55Genoa (Town Of) 54
Pahrump (Town Of) 53Beatty Water & Sanitation District 51
Stagecoach Gid 50Pahrump Library District 48
Pershing County 47
Lag Time Average -by Location
07/01/2007 - 03/31/2013

LocationAvg. Days
Lag Time Average -by Location
07/01/2007 - 03/31/2013
Gardnerville Ranchos Gid 44Ely (City Of) 44
Elko County School District 44Walker River Irrigation District 42
Elko Co. Agricultural Assoc., Dba Elko Co. Fair Board 38Lovelock Meadows Water District 37East Fork Swimming Pool District 35White Pine County School District 35
Indian Hills Gid 35Tahoe-Douglas Fpd 32
West Wendover (City Of) 31Storey County 30
William Bee Ririe Hospital 29Elko County 28
Fernley (City Of) 27Sierra Fpd 26
Douglas County School District 25Elko (City Of) 25
West Wendover Recreation District 25Caliente (City Of) 24Churchill County 22
Yerington (City Of) 22Lincoln County 22
White Pine County 22Humboldt County School District 21
Lyon County School District 21Lovelock (City Of) 21
Carson City School District 20
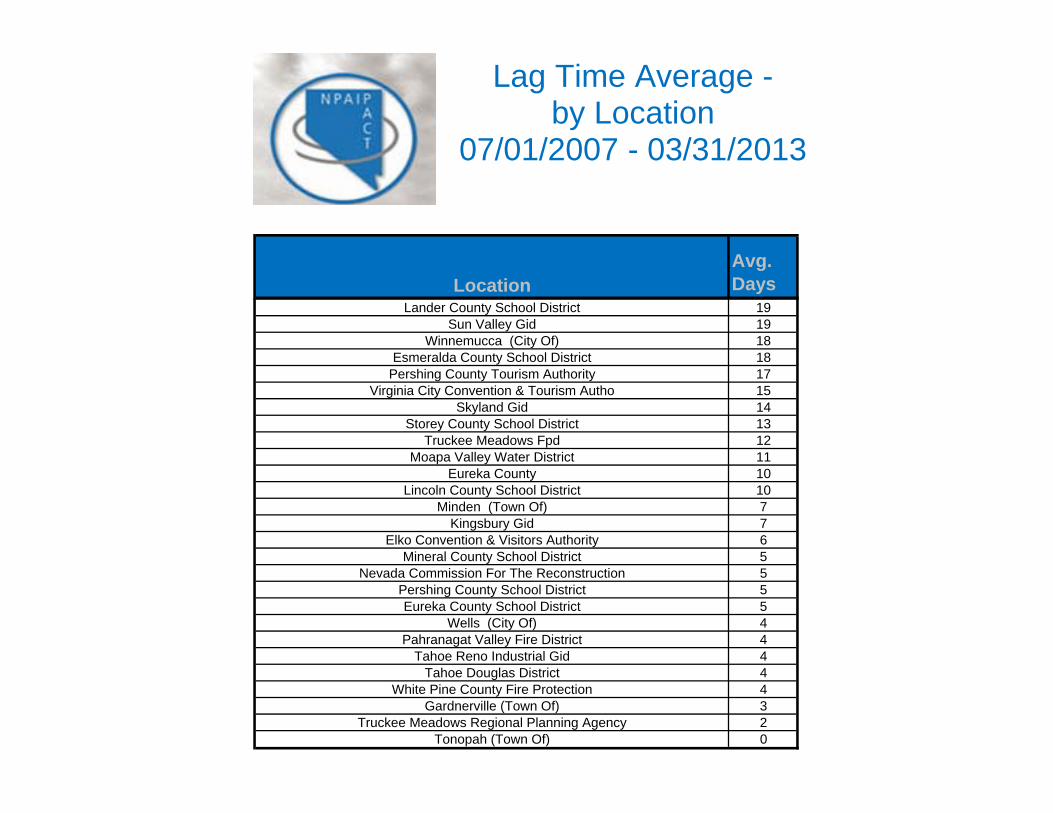
LocationAvg. Days
Lag Time Average -by Location
07/01/2007 - 03/31/2013
Lander County School District 19Sun Valley Gid 19
Winnemucca (City Of) 18Esmeralda County School District 18
Pershing County Tourism Authority 17Virginia City Convention & Tourism Autho 15
Skyland Gid 14Storey County School District 13
Truckee Meadows Fpd 12Moapa Valley Water District 11
Eureka County 10Lincoln County School District 10
Minden (Town Of) 7Kingsbury Gid 7
Elko Convention & Visitors Authority 6Mineral County School District 5
Nevada Commission For The Reconstruction 5Pershing County School District 5Eureka County School District 5
Wells (City Of) 4Pahranagat Valley Fire District 4
Tahoe Reno Industrial Gid 4Tahoe Douglas District 4
White Pine County Fire Protection 4Gardnerville (Town Of) 3
Truckee Meadows Regional Planning Agency 2Tonopah (Town Of) 0
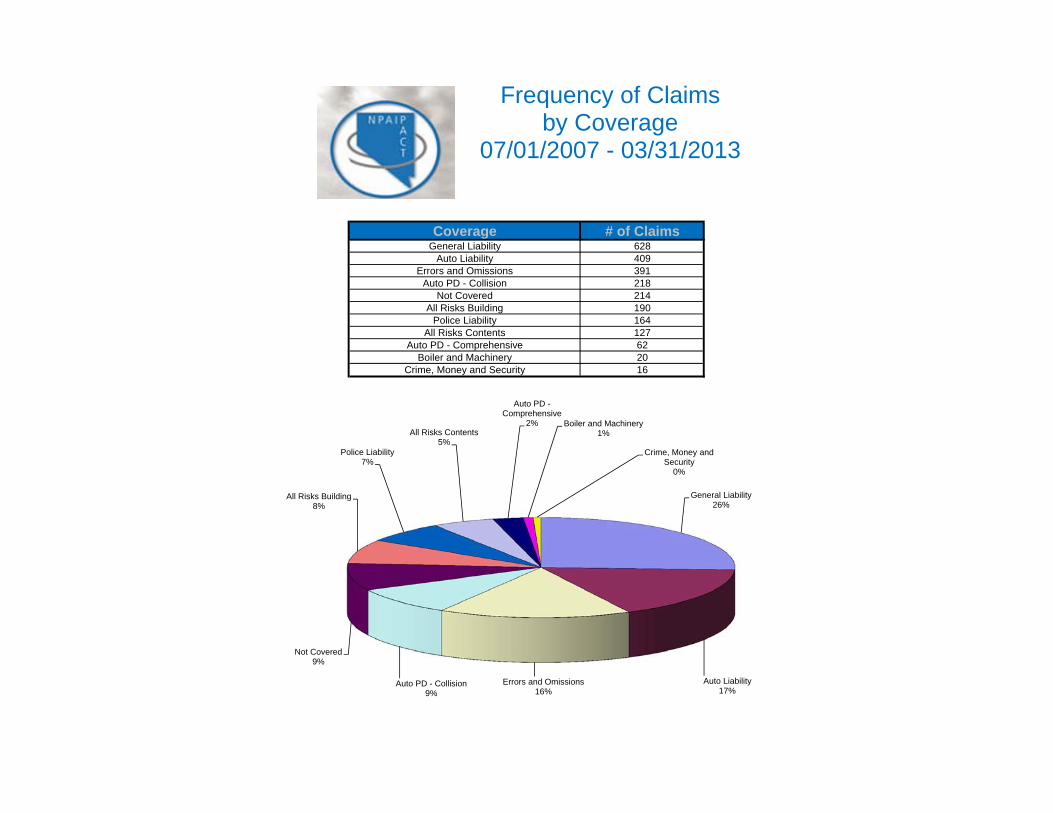
Coverage # of ClaimsGeneral Liability 628
Auto Liability 409Errors and Omissions 391
Auto PD - Collision 218Not Covered 214
All Risks Building 190Police Liability 164
All Risks Contents 127Auto PD - Comprehensive 62
Boiler and Machinery 20Crime, Money and Security 16
Frequency of Claimsby Coverage
07/01/2007 - 03/31/2013
General Liability26%
Auto Liability17%
Errors and Omissions16%
Auto PD - Collision9%
Not Covered9%
All Risks Building8%
Police Liability7%
All Risks Contents5%
Auto PD -Comprehensive
2% Boiler and Machinery1%
Crime, Money and Security
0%
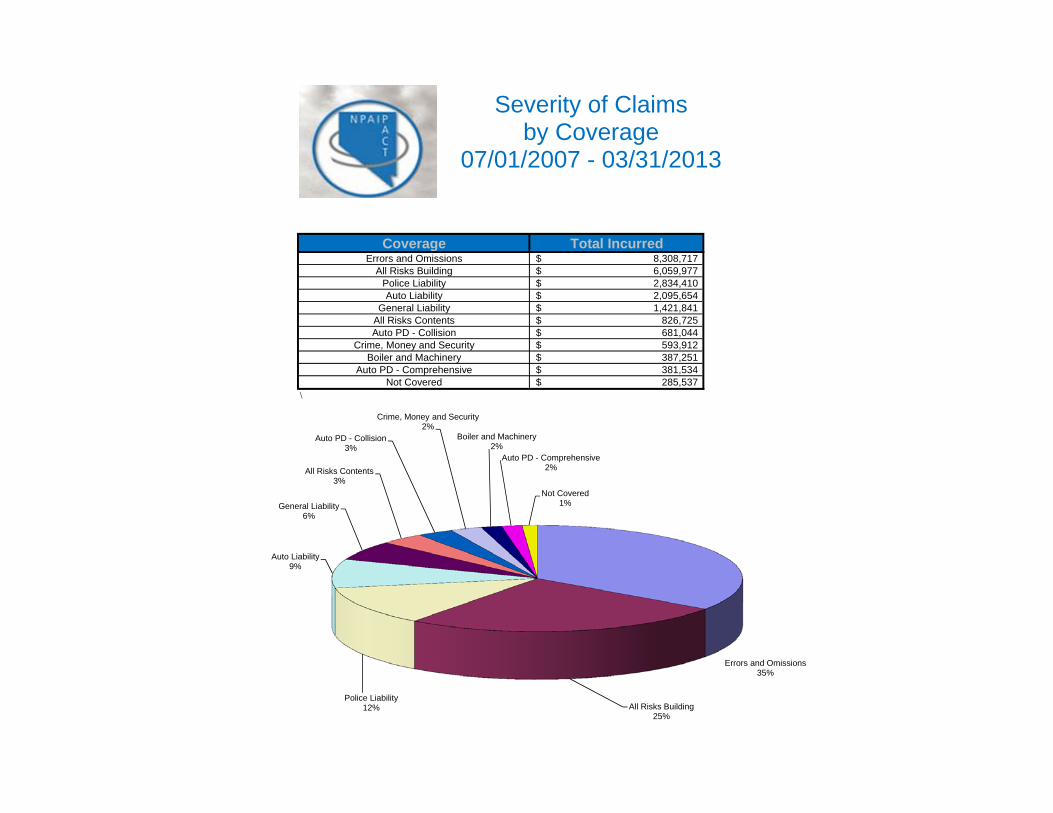
Coverage Total IncurredErrors and Omissions 8,308,717$
All Risks Building 6,059,977$ Police Liability 2,834,410$ Auto Liability 2,095,654$
General Liability 1,421,841$ All Risks Contents 826,725$ Auto PD - Collision 681,044$
Crime, Money and Security 593,912$ Boiler and Machinery 387,251$
Auto PD - Comprehensive 381,534$ Not Covered 285,537$
\
Severity of Claimsby Coverage
07/01/2007 - 03/31/2013
Errors and Omissions35%
All Risks Building25%
Police Liability12%
Auto Liability9%
General Liability6%
All Risks Contents3%
Auto PD - Collision3%
Crime, Money and Security2%
Boiler and Machinery2%
Auto PD - Comprehensive2%
Not Covered1%
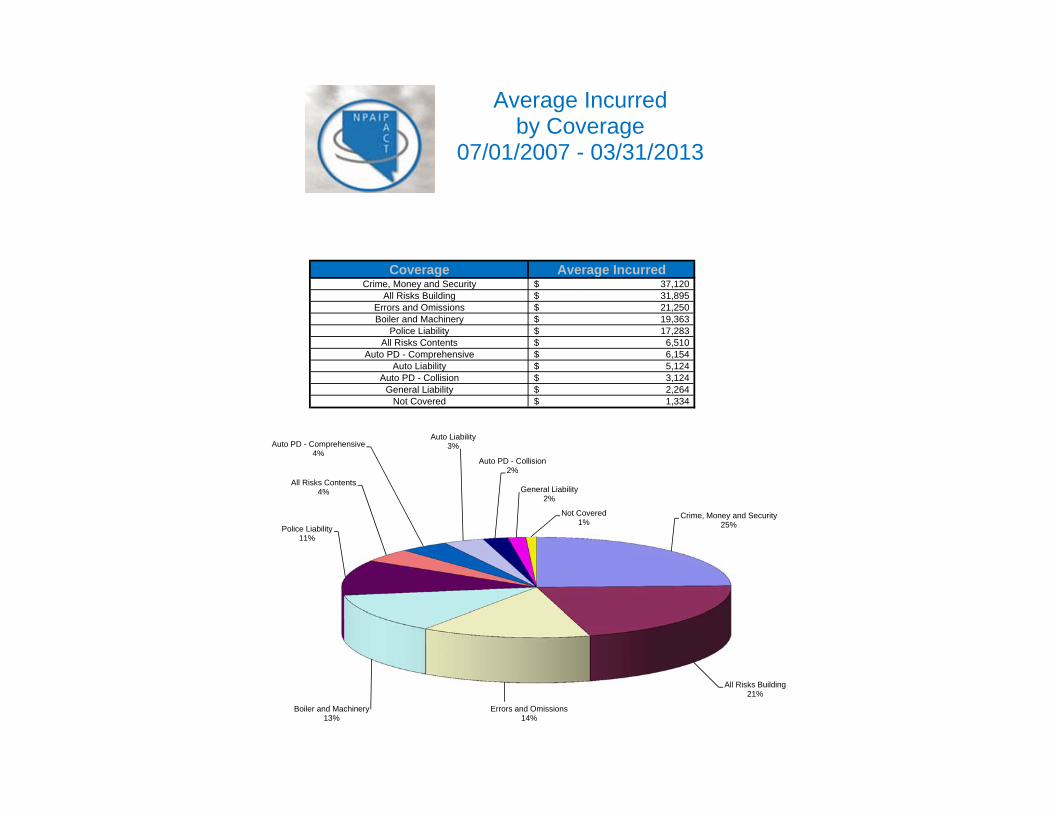
Coverage Average IncurredCrime, Money and Security 37,120$
All Risks Building 31,895$ Errors and Omissions 21,250$ Boiler and Machinery 19,363$
Police Liability 17,283$ All Risks Contents 6,510$
Auto PD - Comprehensive 6,154$ Auto Liability 5,124$
Auto PD - Collision 3,124$ General Liability 2,264$
Not Covered 1,334$
Average Incurred by Coverage
07/01/2007 - 03/31/2013
Crime, Money and Security25%
All Risks Building21%
Errors and Omissions14%
Boiler and Machinery13%
Police Liability11%
All Risks Contents4%
Auto PD - Comprehensive4%
Auto Liability3%
Auto PD - Collision2%
General Liability2%
Not Covered1%
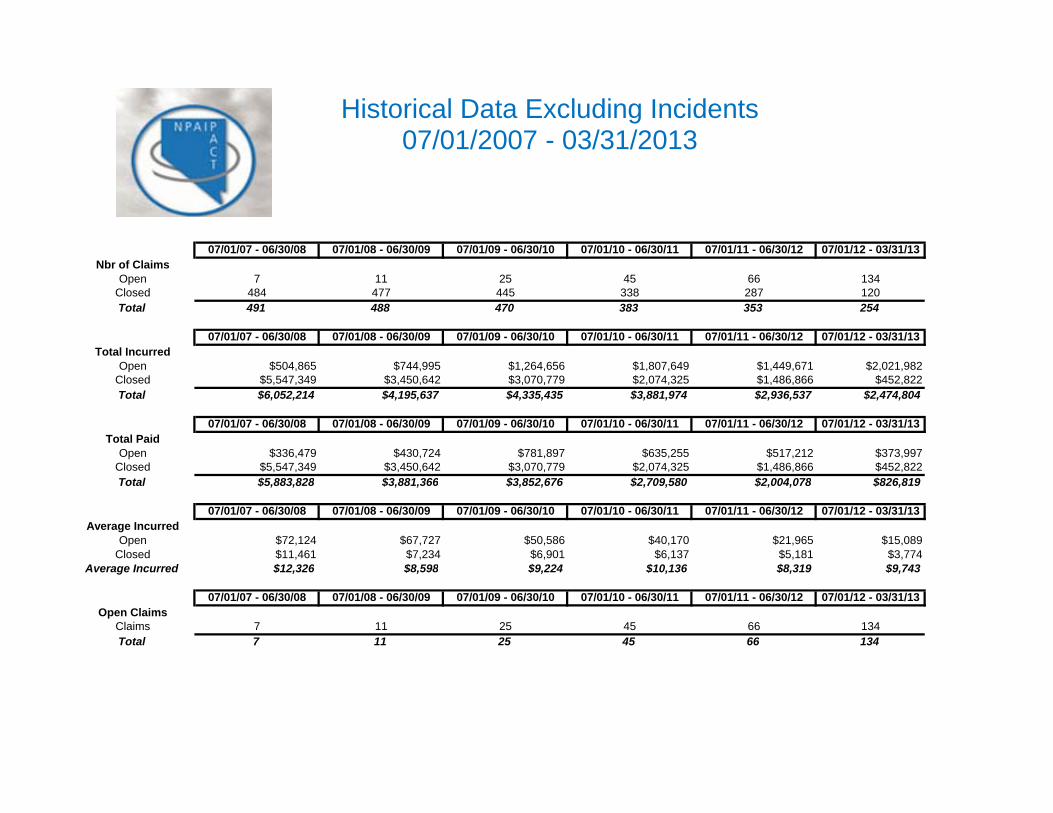
07/01/07 - 06/30/08 07/01/08 - 06/30/09 07/01/09 - 06/30/10 07/01/10 - 06/30/11 07/01/11 - 06/30/12 07/01/12 - 03/31/13Nbr of Claims
Open 7 11 25 45 66 134Closed 484 477 445 338 287 120Total 491 488 470 383 353 254
07/01/07 - 06/30/08 07/01/08 - 06/30/09 07/01/09 - 06/30/10 07/01/10 - 06/30/11 07/01/11 - 06/30/12 07/01/12 - 03/31/13Total Incurred
Open $504,865 $744,995 $1,264,656 $1,807,649 $1,449,671 $2,021,982Closed $5,547,349 $3,450,642 $3,070,779 $2,074,325 $1,486,866 $452,822Total $6,052,214 $4,195,637 $4,335,435 $3,881,974 $2,936,537 $2,474,804
07/01/07 - 06/30/08 07/01/08 - 06/30/09 07/01/09 - 06/30/10 07/01/10 - 06/30/11 07/01/11 - 06/30/12 07/01/12 - 03/31/13Total Paid
Open $336,479 $430,724 $781,897 $635,255 $517,212 $373,997Closed $5,547,349 $3,450,642 $3,070,779 $2,074,325 $1,486,866 $452,822Total $5,883,828 $3,881,366 $3,852,676 $2,709,580 $2,004,078 $826,819
07/01/07 - 06/30/08 07/01/08 - 06/30/09 07/01/09 - 06/30/10 07/01/10 - 06/30/11 07/01/11 - 06/30/12 07/01/12 - 03/31/13Average Incurred
Open $72,124 $67,727 $50,586 $40,170 $21,965 $15,089Closed $11,461 $7,234 $6,901 $6,137 $5,181 $3,774
Average Incurred $12,326 $8,598 $9,224 $10,136 $8,319 $9,743
07/01/07 - 06/30/08 07/01/08 - 06/30/09 07/01/09 - 06/30/10 07/01/10 - 06/30/11 07/01/11 - 06/30/12 07/01/12 - 03/31/13Open Claims
Claims 7 11 25 45 66 134Total 7 11 25 45 66 134
Historical Data Excluding Incidents07/01/2007 - 03/31/2013
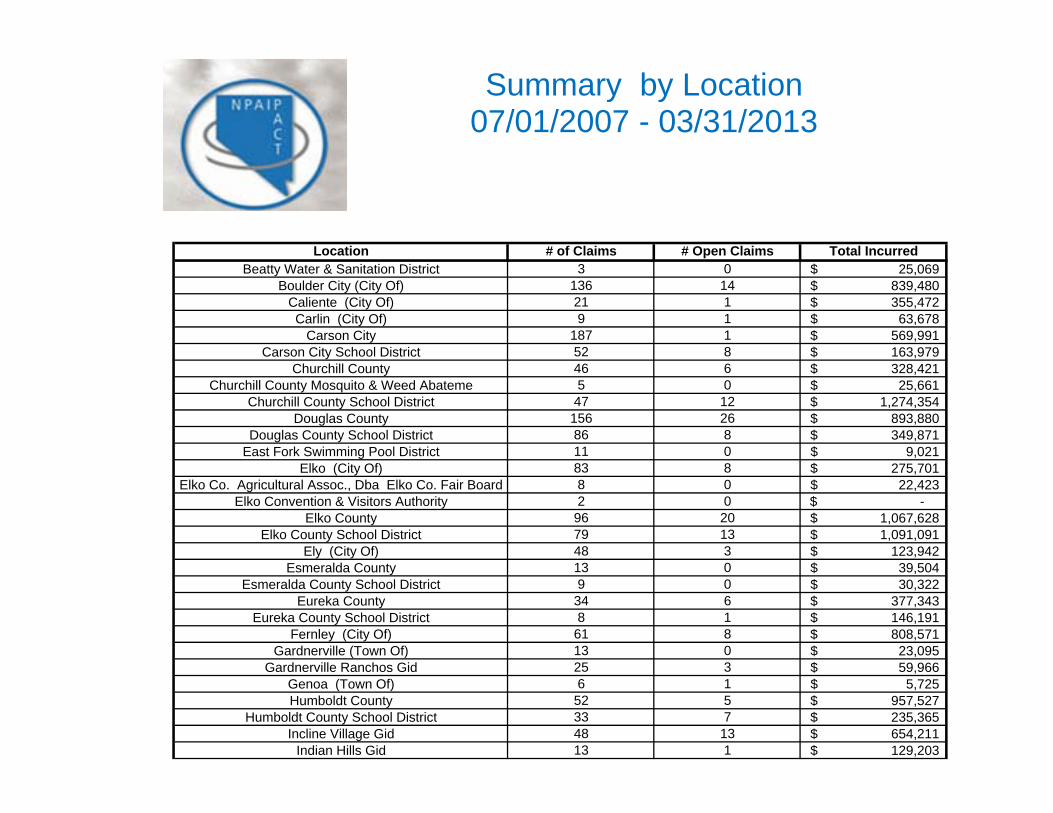
Location # of Claims # Open Claims Total IncurredBeatty Water & Sanitation District 3 0 25,069$
Boulder City (City Of) 136 14 839,480$ Caliente (City Of) 21 1 355,472$ Carlin (City Of) 9 1 63,678$
Carson City 187 1 569,991$ Carson City School District 52 8 163,979$
Churchill County 46 6 328,421$ Churchill County Mosquito & Weed Abateme 5 0 25,661$
Churchill County School District 47 12 1,274,354$ Douglas County 156 26 893,880$
Douglas County School District 86 8 349,871$ East Fork Swimming Pool District 11 0 9,021$
Elko (City Of) 83 8 275,701$ Elko Co. Agricultural Assoc., Dba Elko Co. Fair Board 8 0 22,423$
Elko Convention & Visitors Authority 2 0 -$ Elko County 96 20 1,067,628$
Elko County School District 79 13 1,091,091$ Ely (City Of) 48 3 123,942$
Esmeralda County 13 0 39,504$ Esmeralda County School District 9 0 30,322$
Eureka County 34 6 377,343$ Eureka County School District 8 1 146,191$
Fernley (City Of) 61 8 808,571$ Gardnerville (Town Of) 13 0 23,095$
Gardnerville Ranchos Gid 25 3 59,966$ Genoa (Town Of) 6 1 5,725$ Humboldt County 52 5 957,527$
Humboldt County School District 33 7 235,365$ Incline Village Gid 48 13 654,211$
Indian Hills Gid 13 1 129,203$
Summary by Location07/01/2007 - 03/31/2013
Location # of Claims # Open Claims Total Incurred
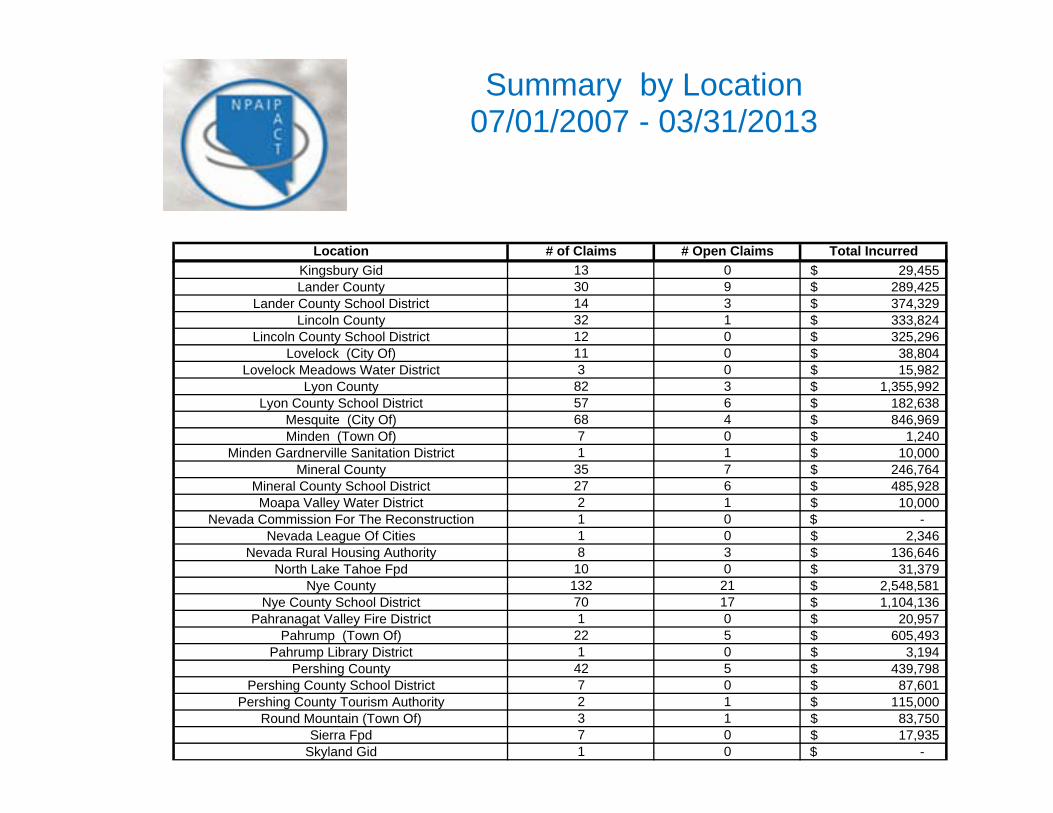
Summary by Location07/01/2007 - 03/31/2013
Kingsbury Gid 13 0 29,455$ Lander County 30 9 289,425$
Lander County School District 14 3 374,329$ Lincoln County 32 1 333,824$
Lincoln County School District 12 0 325,296$ Lovelock (City Of) 11 0 38,804$
Lovelock Meadows Water District 3 0 15,982$ Lyon County 82 3 1,355,992$
Lyon County School District 57 6 182,638$ Mesquite (City Of) 68 4 846,969$ Minden (Town Of) 7 0 1,240$
Minden Gardnerville Sanitation District 1 1 10,000$ Mineral County 35 7 246,764$
Mineral County School District 27 6 485,928$ Moapa Valley Water District 2 1 10,000$
Nevada Commission For The Reconstruction 1 0 -$ Nevada League Of Cities 1 0 2,346$
Nevada Rural Housing Authority 8 3 136,646$ North Lake Tahoe Fpd 10 0 31,379$
Nye County 132 21 2,548,581$ Nye County School District 70 17 1,104,136$
Pahranagat Valley Fire District 1 0 20,957$ Pahrump (Town Of) 22 5 605,493$
Pahrump Library District 1 0 3,194$ Pershing County 42 5 439,798$
Pershing County School District 7 0 87,601$ Pershing County Tourism Authority 2 1 115,000$
Round Mountain (Town Of) 3 1 83,750$ Sierra Fpd 7 0 17,935$
Skyland Gid 1 0 -$
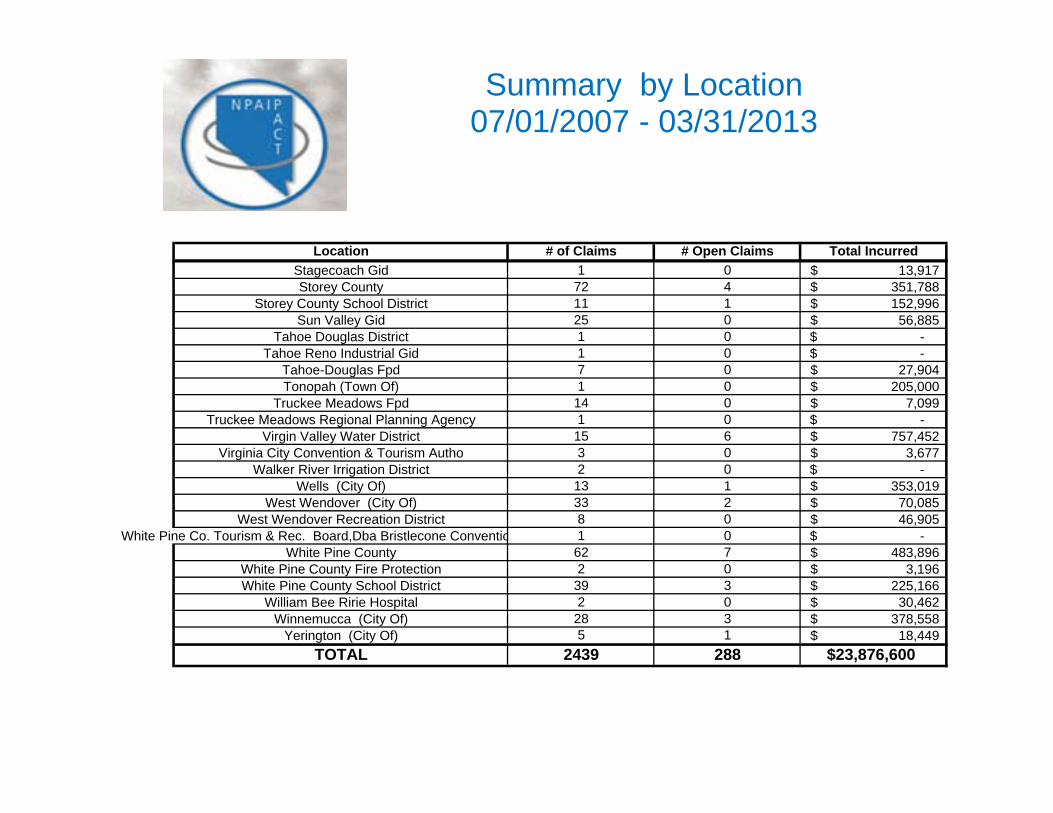
Location # of Claims # Open Claims Total Incurred
Summary by Location07/01/2007 - 03/31/2013
Stagecoach Gid 1 0 13,917$ Storey County 72 4 351,788$
Storey County School District 11 1 152,996$ Sun Valley Gid 25 0 56,885$
Tahoe Douglas District 1 0 -$ Tahoe Reno Industrial Gid 1 0 -$
Tahoe-Douglas Fpd 7 0 27,904$ Tonopah (Town Of) 1 0 205,000$
Truckee Meadows Fpd 14 0 7,099$ Truckee Meadows Regional Planning Agency 1 0 -$
Virgin Valley Water District 15 6 757,452$ Virginia City Convention & Tourism Autho 3 0 3,677$
Walker River Irrigation District 2 0 -$ Wells (City Of) 13 1 353,019$
West Wendover (City Of) 33 2 70,085$ West Wendover Recreation District 8 0 46,905$
White Pine Co. Tourism & Rec. Board,Dba Bristlecone Conventio 1 0 -$ White Pine County 62 7 483,896$
White Pine County Fire Protection 2 0 3,196$ White Pine County School District 39 3 225,166$
William Bee Ririe Hospital 2 0 30,462$ Winnemucca (City Of) 28 3 378,558$
Yerington (City Of) 5 1 18,449$ TOTAL 2439 288 $23,876,600
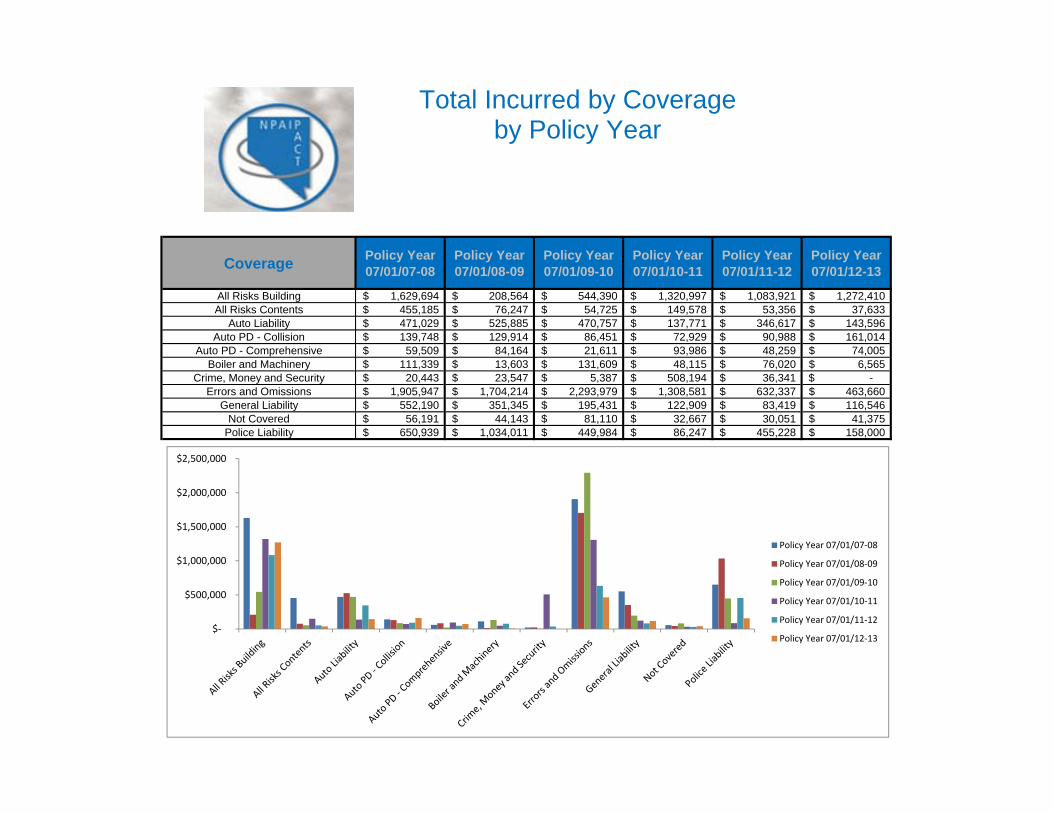
Coverage Policy Year 07/01/07-08
Policy Year 07/01/08-09
Policy Year 07/01/09-10
Policy Year 07/01/10-11
Policy Year 07/01/11-12
Policy Year 07/01/12-13
All Risks Building 1,629,694$ 208,564$ 544,390$ 1,320,997$ 1,083,921$ 1,272,410$ All Risks Contents 455,185$ 76,247$ 54,725$ 149,578$ 53,356$ 37,633$
Auto Liability 471,029$ 525,885$ 470,757$ 137,771$ 346,617$ 143,596$ Auto PD - Collision 139,748$ 129,914$ 86,451$ 72,929$ 90,988$ 161,014$
Auto PD - Comprehensive 59,509$ 84,164$ 21,611$ 93,986$ 48,259$ 74,005$ Boiler and Machinery 111,339$ 13,603$ 131,609$ 48,115$ 76,020$ 6,565$
Crime, Money and Security 20,443$ 23,547$ 5,387$ 508,194$ 36,341$ -$ Errors and Omissions 1,905,947$ 1,704,214$ 2,293,979$ 1,308,581$ 632,337$ 463,660$
General Liability 552,190$ 351,345$ 195,431$ 122,909$ 83,419$ 116,546$ Not Covered 56,191$ 44,143$ 81,110$ 32,667$ 30,051$ 41,375$
Police Liability 650,939$ 1,034,011$ 449,984$ 86,247$ 455,228$ 158,000$
Total Incurred by Coverageby Policy Year
$‐
$500,000
$1,000,000
$1,500,000
$2,000,000
$2,500,000
Policy Year 07/01/07‐08
Policy Year 07/01/08‐09
Policy Year 07/01/09‐10
Policy Year 07/01/10‐11
Policy Year 07/01/11‐12
Policy Year 07/01/12‐13
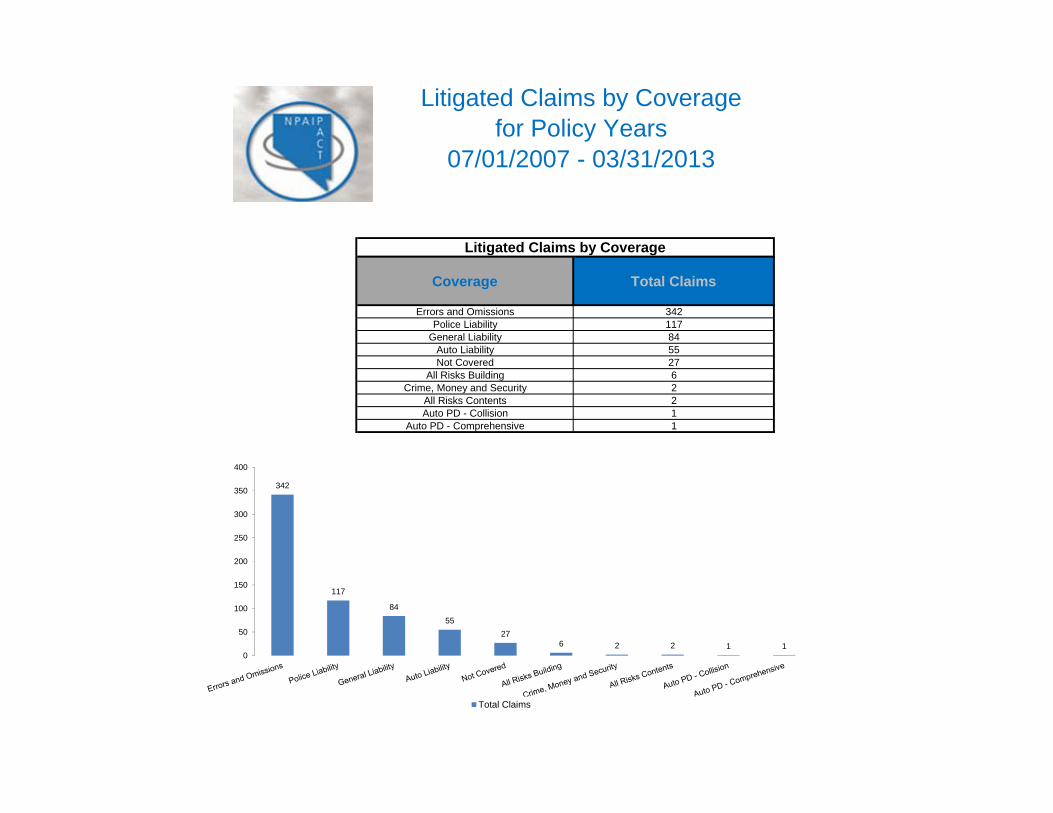
Coverage Total Claims
Errors and Omissions 342Police Liability 117
General Liability 84Auto Liability 55Not Covered 27
All Risks Building 6Crime, Money and Security 2
All Risks Contents 2Auto PD - Collision 1
Auto PD - Comprehensive 1
Litigated Claims by Coverage
Litigated Claims by Coveragefor Policy Years
07/01/2007 - 03/31/2013
342
117
8455
276 2 2 1 1
0
50
100
150
200
250
300
350
400
Total Claims
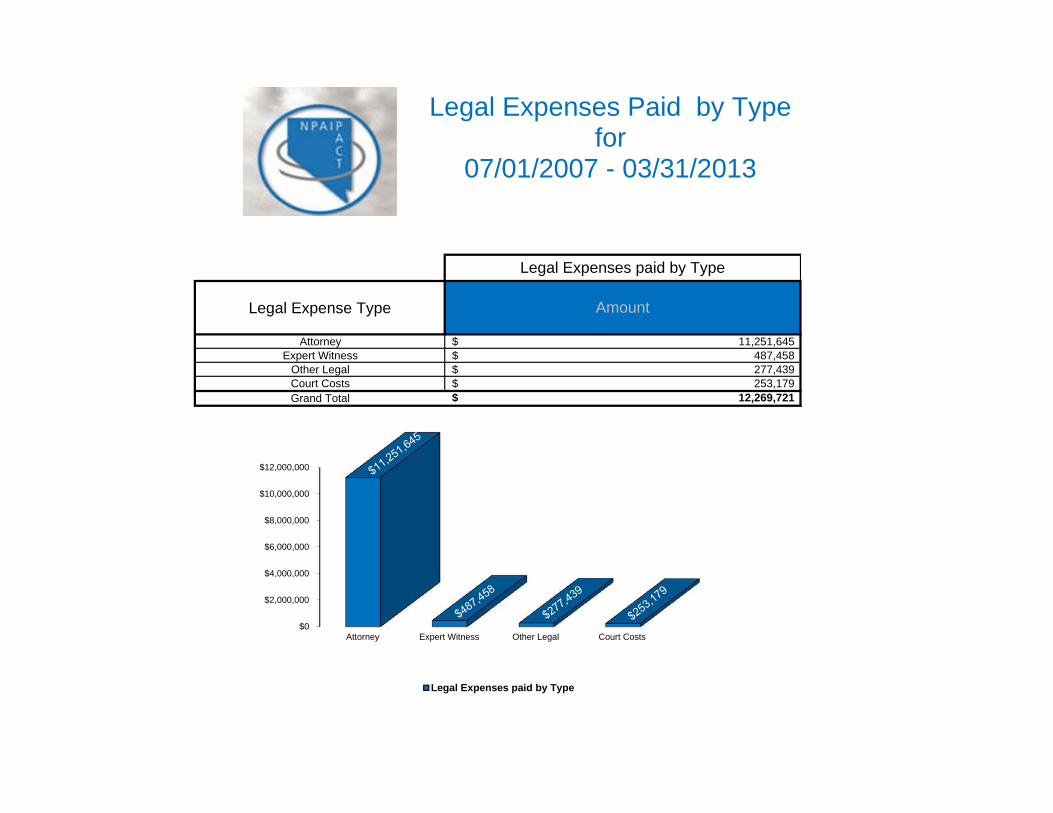
Legal Expense Type
AttorneyExpert Witness
Other LegalCourt CostsGrand Total 12,269,721$
Legal Expenses paid by Type
Amount
11,251,645$
277,439$ 253,179$
487,458$
Legal Expenses Paid by Type for
07/01/2007 - 03/31/2013
$0
$2,000,000
$4,000,000
$6,000,000
$8,000,000
$10,000,000
$12,000,000
Attorney Expert Witness Other Legal Court Costs
Legal Expenses paid by Type
Worker's Compensation Report
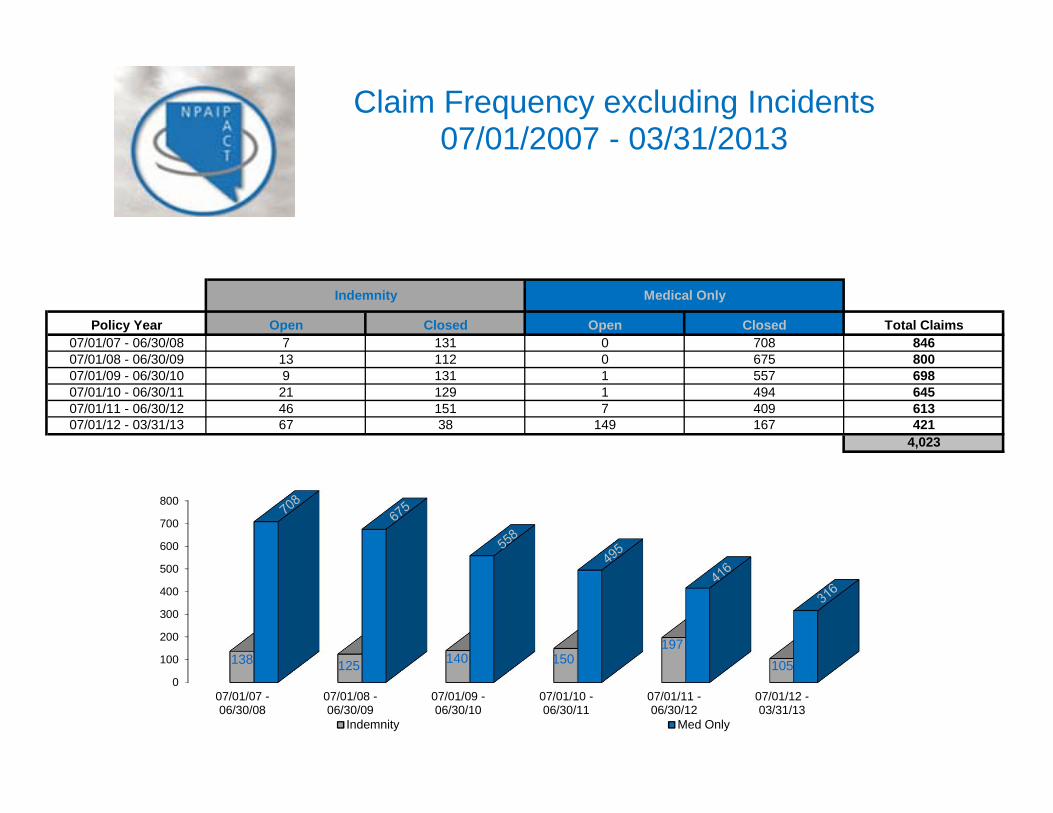
Policy Year Open Closed Open Closed Total Claims07/01/07 - 06/30/08 7 131 0 708 84607/01/08 - 06/30/09 13 112 0 675 80007/01/09 - 06/30/10 9 131 1 557 69807/01/10 - 06/30/11 21 129 1 494 64507/01/11 - 06/30/12 46 151 7 409 61307/01/12 - 03/31/13 67 38 149 167 421
4,023
Indemnity Medical Only
Claim Frequency excluding Incidents07/01/2007 - 03/31/2013
0
100
200
300
400
500
600
700
800
07/01/07 -06/30/08
07/01/08 -06/30/09
07/01/09 -06/30/10
07/01/10 -06/30/11
07/01/11 -06/30/12
07/01/12 -03/31/13
138 125 140 150197
105
Indemnity Med Only
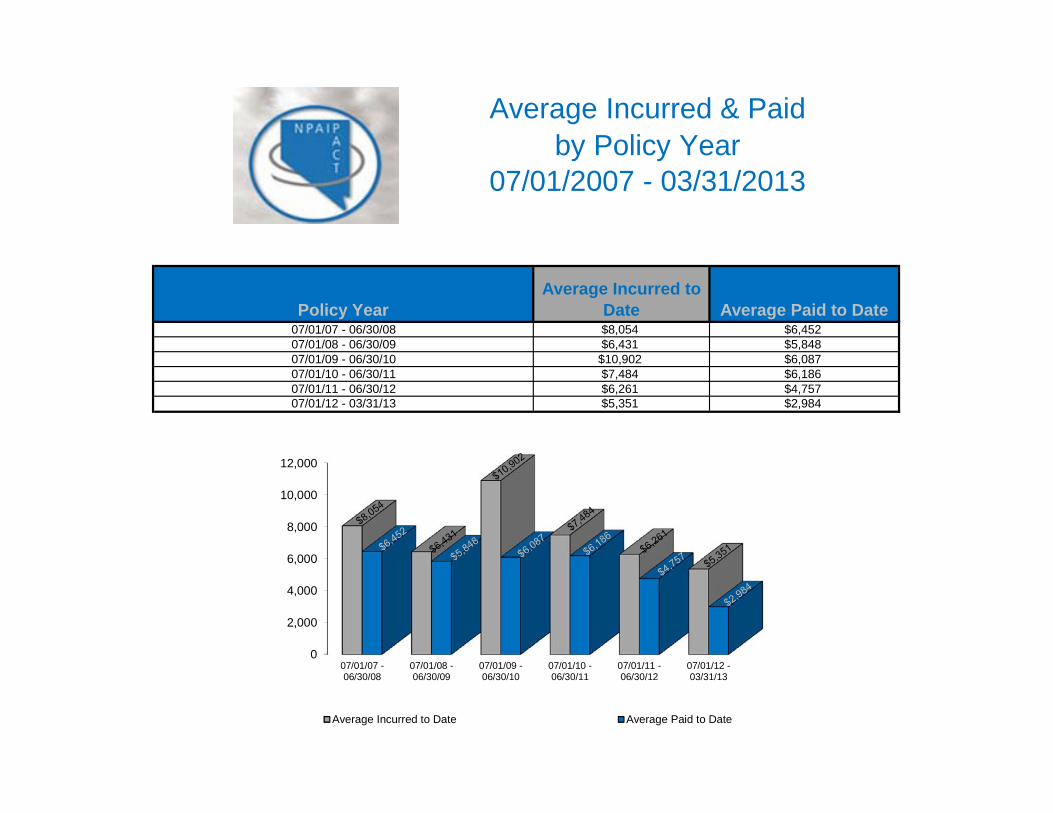
Policy YearAverage Incurred to
Date Average Paid to Date07/01/07 - 06/30/08 $8,054 $6,45207/01/08 - 06/30/09 $6,431 $5,84807/01/09 - 06/30/10 $10,902 $6,08707/01/10 - 06/30/11 $7,484 $6,18607/01/11 - 06/30/12 $6,261 $4,75707/01/12 - 03/31/13 $5,351 $2,984
Average Incurred & Paidby Policy Year
07/01/2007 - 03/31/2013
0
2,000
4,000
6,000
8,000
10,000
12,000
07/01/07 -06/30/08
07/01/08 -06/30/09
07/01/09 -06/30/10
07/01/10 -06/30/11
07/01/11 -06/30/12
07/01/12 -03/31/13
Average Incurred to Date Average Paid to Date
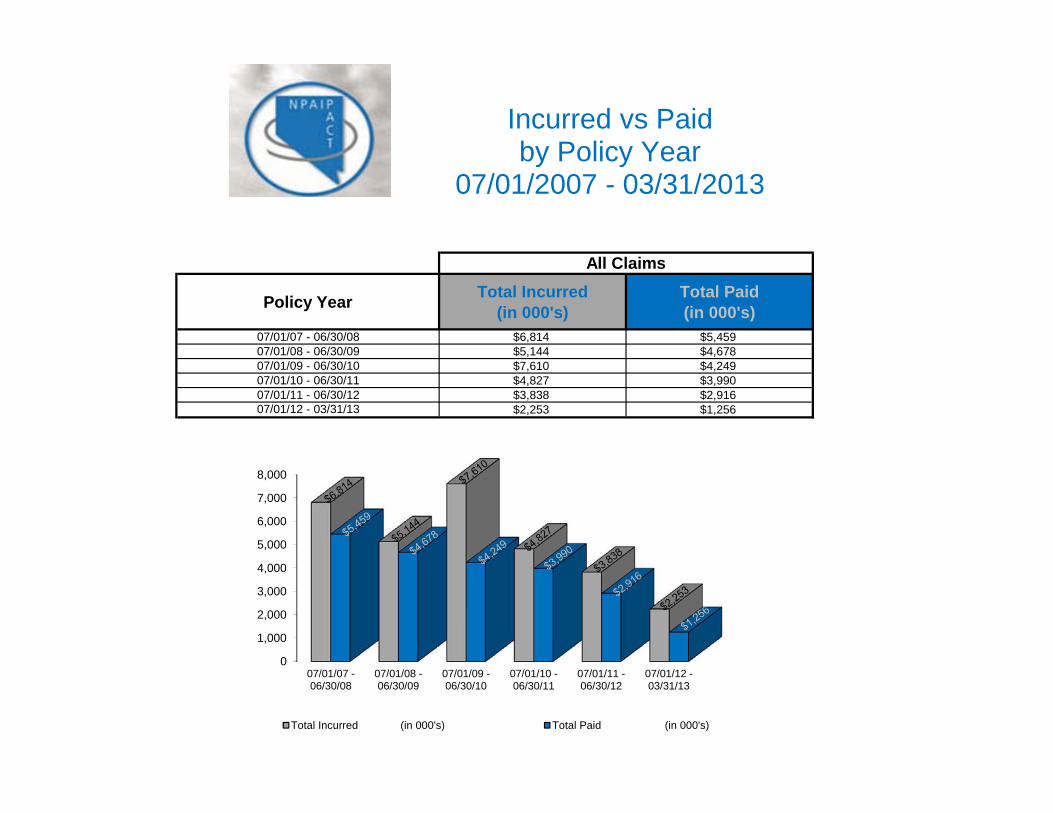
Policy Year Total Incurred (in 000's)
Total Paid (in 000's)
07/01/07 - 06/30/08 $6,814 $5,45907/01/08 - 06/30/09 $5,144 $4,67807/01/09 - 06/30/10 $7,610 $4,24907/01/10 - 06/30/11 $4,827 $3,99007/01/11 - 06/30/12 $3,838 $2,91607/01/12 - 03/31/13 $2,253 $1,256
All Claims
Incurred vs Paidby Policy Year
07/01/2007 - 03/31/2013
0
1,000
2,000
3,000
4,000
5,000
6,000
7,000
8,000
07/01/07 -06/30/08
07/01/08 -06/30/09
07/01/09 -06/30/10
07/01/10 -06/30/11
07/01/11 -06/30/12
07/01/12 -03/31/13
Total Incurred (in 000's) Total Paid (in 000's)
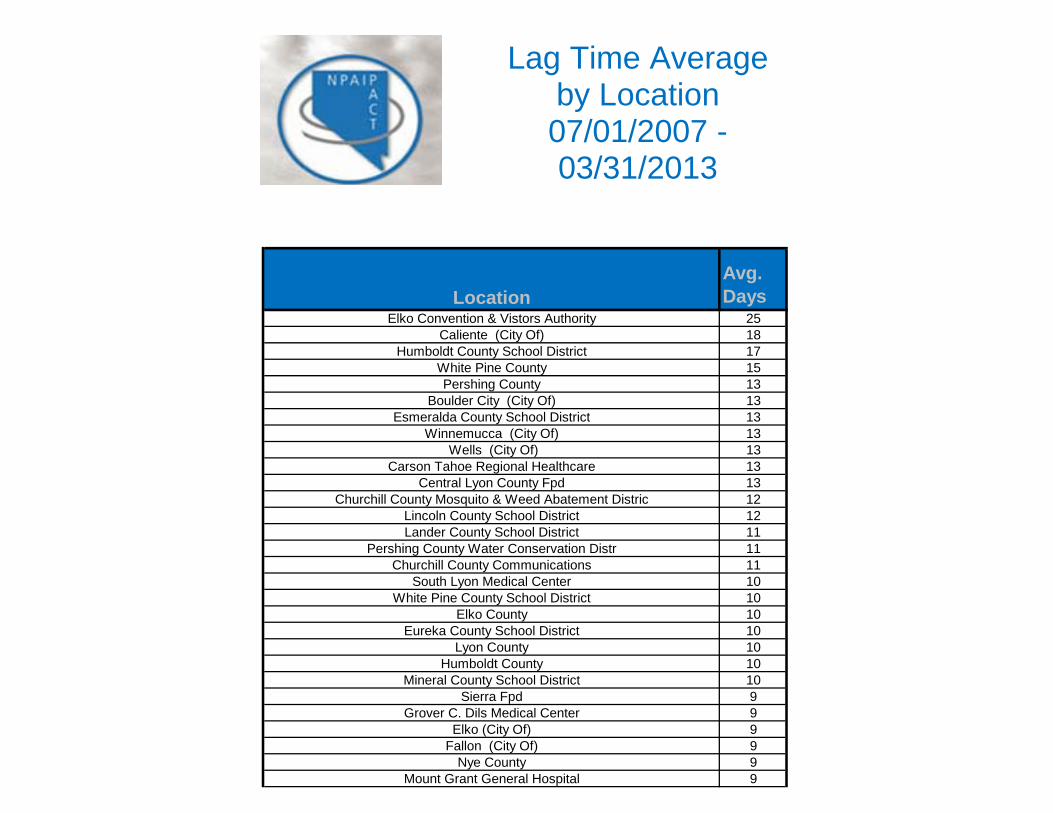
LocationAvg. Days
Elko Convention & Vistors Authority 25Caliente (City Of) 18
Humboldt County School District 17White Pine County 15Pershing County 13
Boulder City (City Of) 13Esmeralda County School District 13
Winnemucca (City Of) 13 Wells (City Of) 13
Carson Tahoe Regional Healthcare 13Central Lyon County Fpd 13
Churchill County Mosquito & Weed Abatement Distric 12Lincoln County School District 12Lander County School District 11
Pershing County Water Conservation Distr 11Churchill County Communications 11
South Lyon Medical Center 10White Pine County School District 10
Elko County 10Eureka County School District 10
Lyon County 10Humboldt County 10
Mineral County School District 10Sierra Fpd 9
Grover C. Dils Medical Center 9Elko (City Of) 9
Fallon (City Of) 9Nye County 9
Mount Grant General Hospital 9
Lag Time Average by Location07/01/2007 -03/31/2013
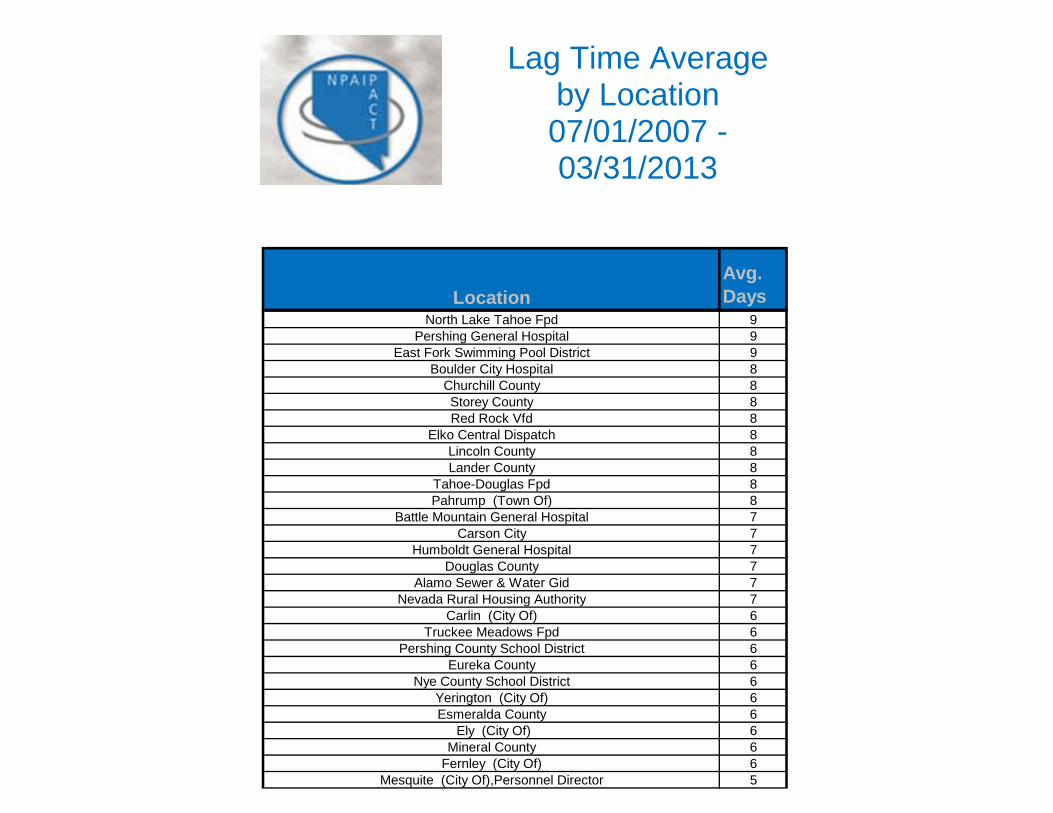
LocationAvg. Days
Lag Time Average by Location07/01/2007 -03/31/2013
North Lake Tahoe Fpd 9Pershing General Hospital 9
East Fork Swimming Pool District 9Boulder City Hospital 8
Churchill County 8Storey County 8Red Rock Vfd 8
Elko Central Dispatch 8Lincoln County 8Lander County 8
Tahoe-Douglas Fpd 8Pahrump (Town Of) 8
Battle Mountain General Hospital 7Carson City 7
Humboldt General Hospital 7Douglas County 7
Alamo Sewer & Water Gid 7Nevada Rural Housing Authority 7
Carlin (City Of) 6Truckee Meadows Fpd 6
Pershing County School District 6Eureka County 6
Nye County School District 6Yerington (City Of) 6Esmeralda County 6
Ely (City Of) 6Mineral County 6
Fernley (City Of) 6Mesquite (City Of),Personnel Director 5
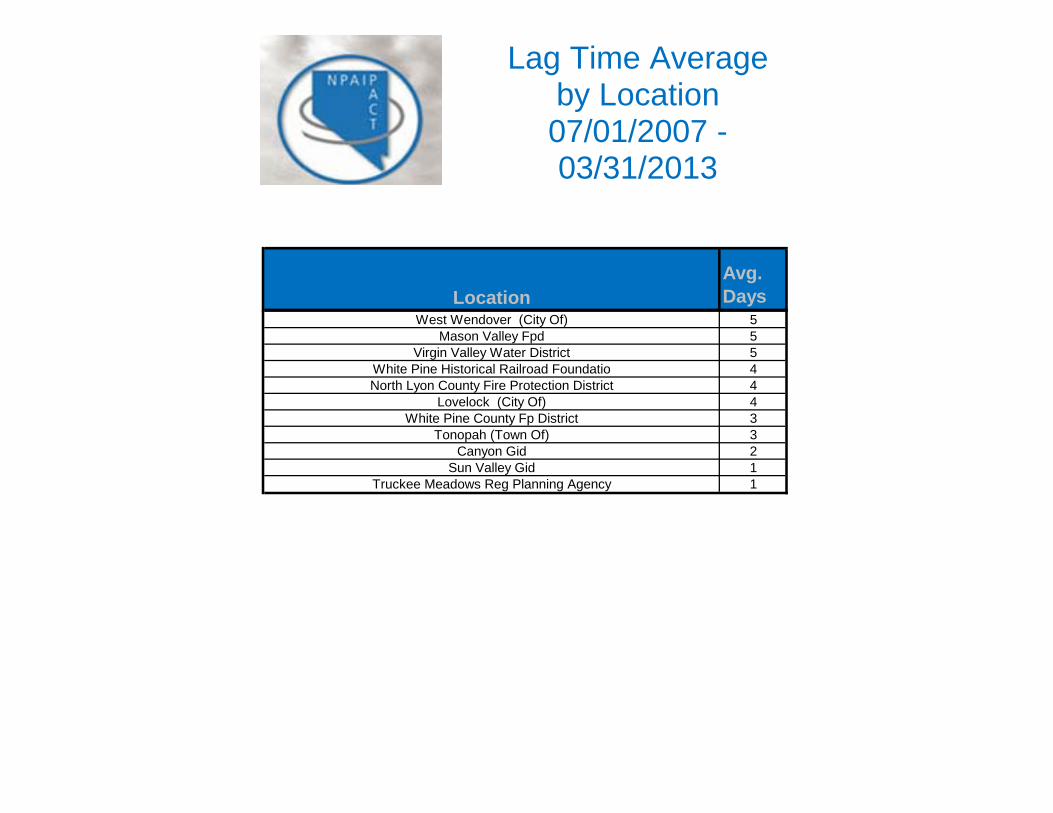
LocationAvg. Days
Lag Time Average by Location07/01/2007 -03/31/2013
West Wendover (City Of) 5Mason Valley Fpd 5
Virgin Valley Water District 5White Pine Historical Railroad Foundatio 4North Lyon County Fire Protection District 4
Lovelock (City Of) 4White Pine County Fp District 3
Tonopah (Town Of) 3Canyon Gid 2
Sun Valley Gid 1Truckee Meadows Reg Planning Agency 1
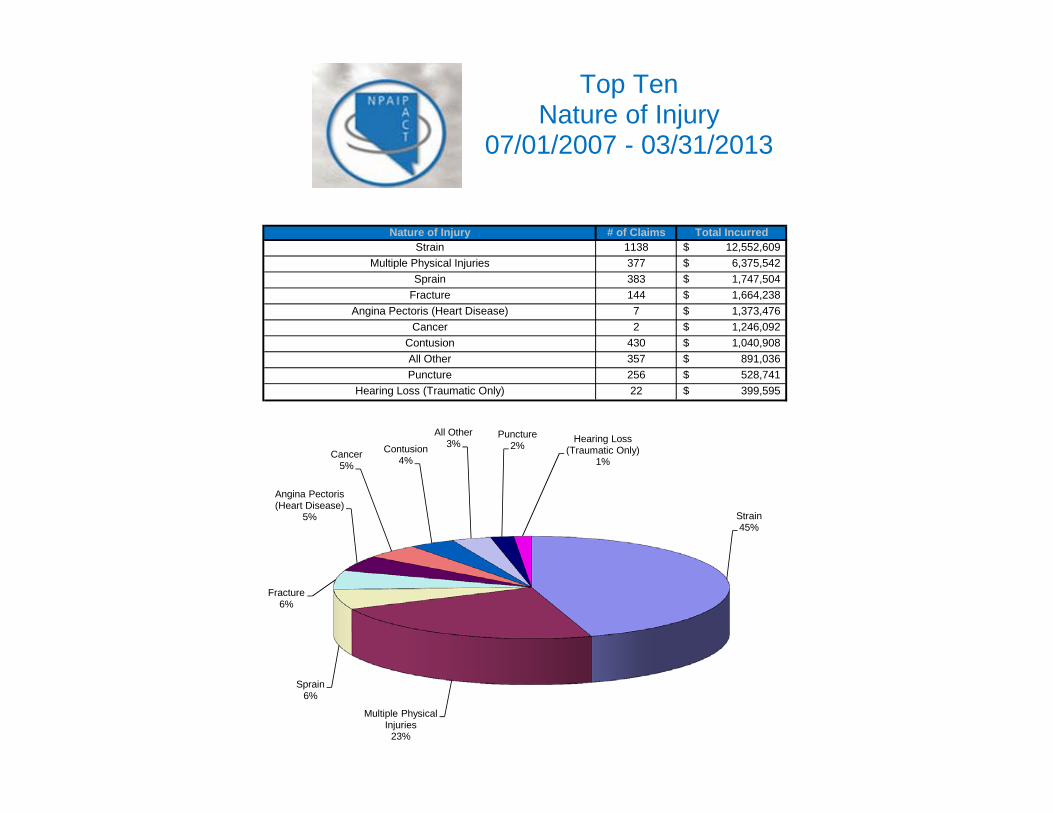
# of Claims Total Incurred1138 12,552,609$ 377 6,375,542$ 383 1,747,504$ 144 1,664,238$ 7 1,373,476$ 2 1,246,092$
430 1,040,908$ 357 891,036$ 256 528,741$ 22 399,595$
Angina Pectoris (Heart Disease)Cancer
ContusionAll OtherPuncture
Hearing Loss (Traumatic Only)
Nature of InjuryStrain
Multiple Physical InjuriesSprain
Fracture
Top TenNature of Injury
07/01/2007 - 03/31/2013
Strain45%
Multiple Physical Injuries
23%
Sprain6%
Fracture6%
Angina Pectoris (Heart Disease)
5%
Cancer5%
Contusion4%
All Other3%
Puncture2%
Hearing Loss (Traumatic Only)
1%
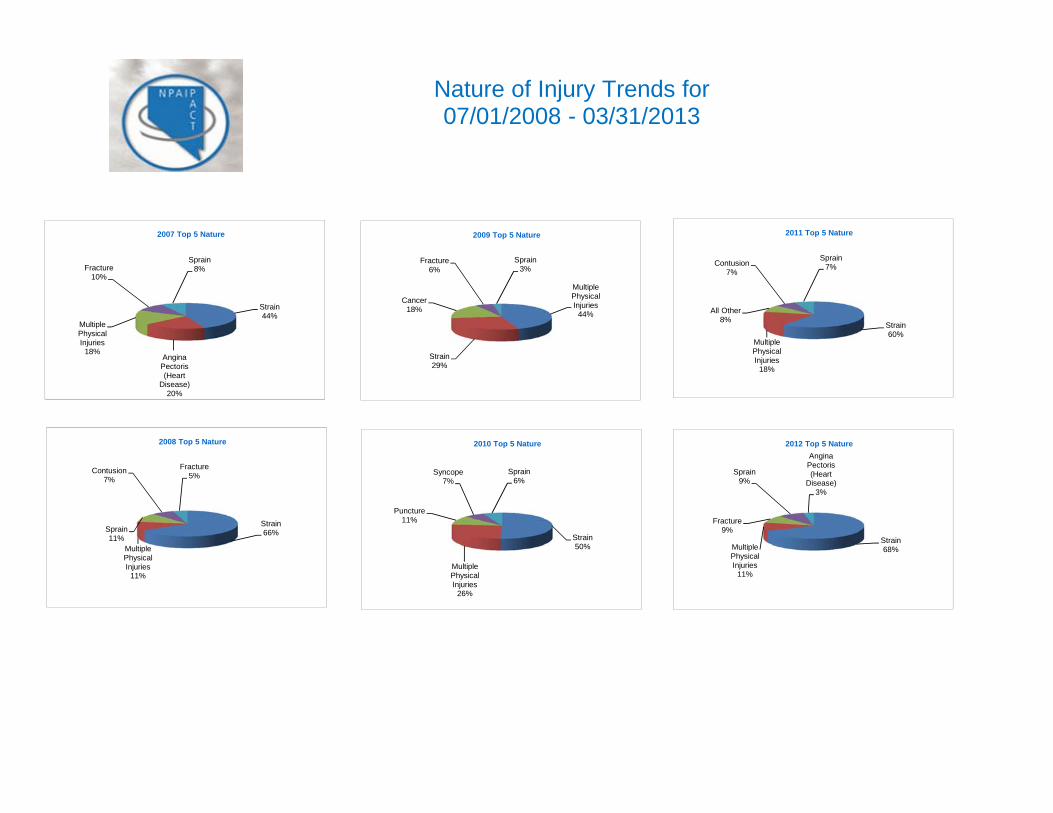
Strain44%
Angina Pectoris (Heart
Disease)20%
Multiple Physical Injuries
18%
Fracture10%
Sprain8%
2007 Top 5 Nature
Nature of Injury Trends for07/01/2008 - 03/31/2013
Strain66%
Multiple Physical Injuries
11%
Sprain11%
Contusion7%
Fracture5%
2008 Top 5 Nature
Multiple Physical Injuries
44%
Strain29%
Cancer18%
Fracture6%
Sprain3%
2009 Top 5 Nature
Strain50%
Multiple Physical Injuries
26%
Puncture11%
Syncope7%
Sprain6%
2010 Top 5 Nature
Strain60%
Multiple Physical Injuries
18%
All Other8%
Contusion7%
Sprain7%
2011 Top 5 Nature
Strain68%Multiple
Physical Injuries
11%
Fracture9%
Sprain9%
Angina Pectoris (Heart
Disease)3%
2012 Top 5 Nature
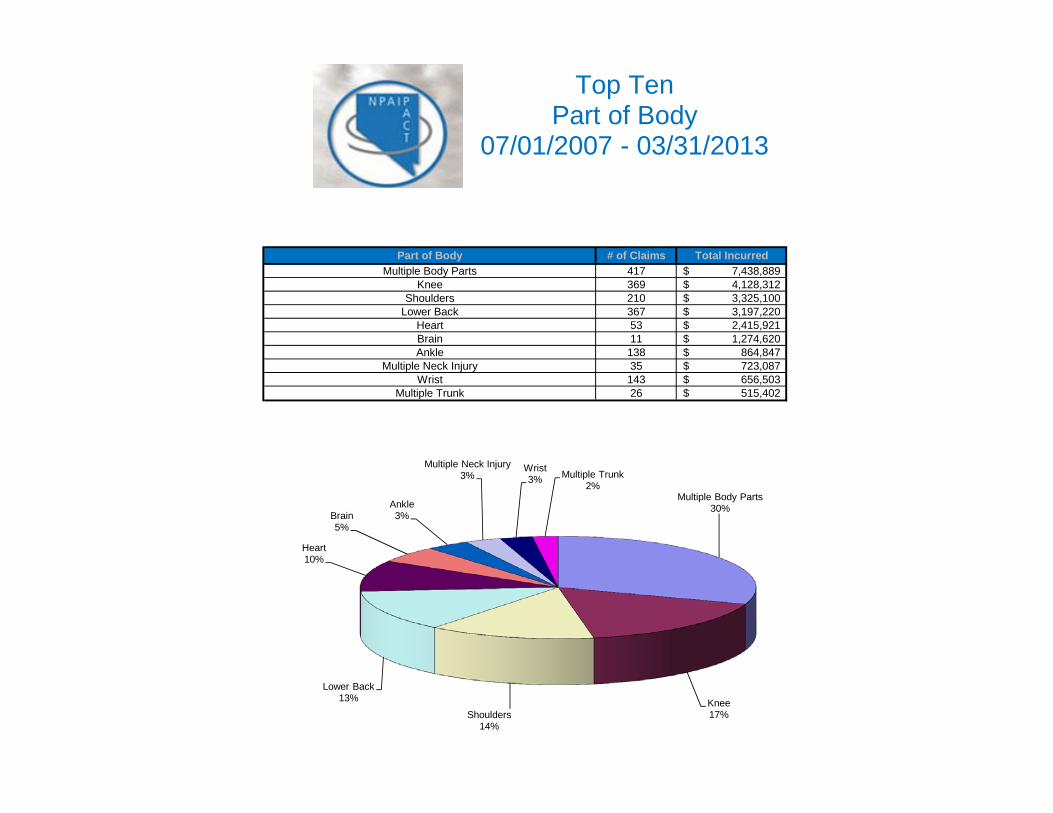
# of Claims Total Incurred417 7,438,889$ 369 4,128,312$ 210 3,325,100$ 367 3,197,220$ 53 2,415,921$ 11 1,274,620$ 138 864,847$ 35 723,087$ 143 656,503$ 26 515,402$
Part of BodyMultiple Body Parts
KneeShoulders
Multiple Trunk
Lower BackHeartBrainAnkle
Multiple Neck InjuryWrist
Top TenPart of Body
07/01/2007 - 03/31/2013
Multiple Body Parts30%
Knee17%Shoulders
14%
Lower Back13%
Heart10%
Brain5%
Ankle3%
Multiple Neck Injury3%
Wrist3% Multiple Trunk
2%
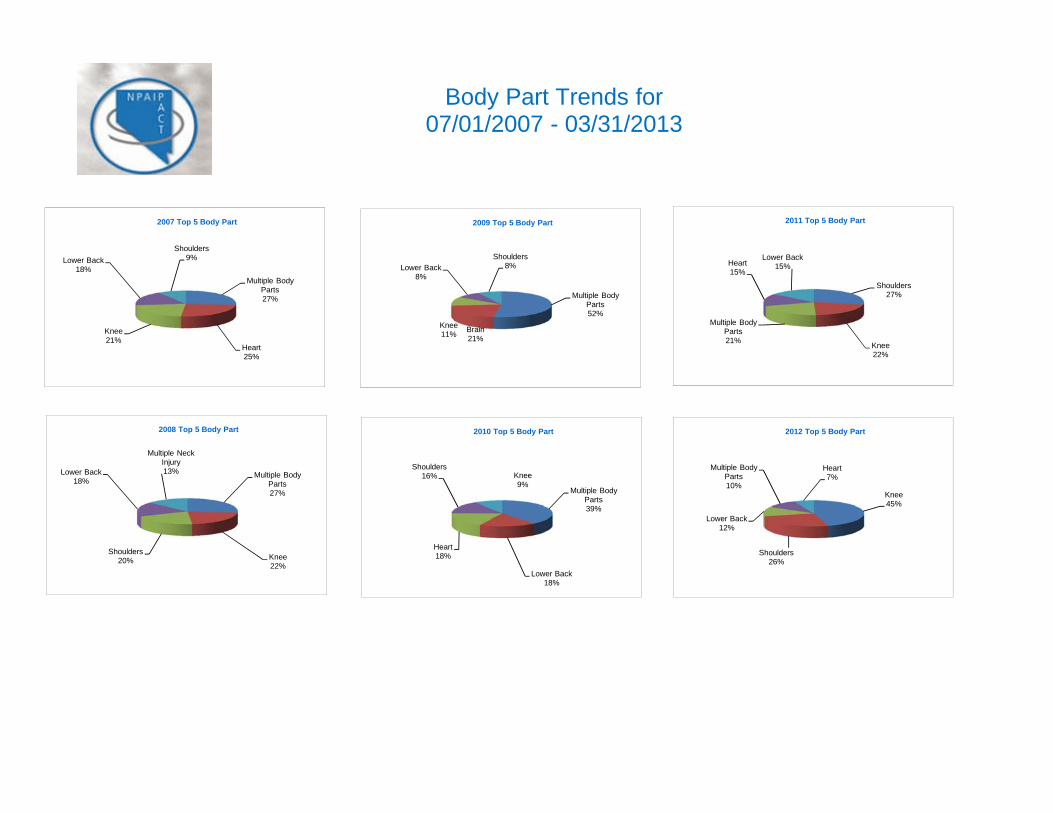
Multiple Body Parts27%
Heart25%
Knee21%
Lower Back18%
Shoulders9%
2007 Top 5 Body Part
Body Part Trends for07/01/2007 - 03/31/2013
Multiple Body Parts27%
Knee22%
Shoulders20%
Lower Back18%
Multiple Neck Injury13%
2008 Top 5 Body Part
Multiple Body Parts52%
Brain21%
Knee11%
Lower Back8%
Shoulders8%
2009 Top 5 Body Part
Multiple Body Parts39%
Lower Back18%
Heart18%
Shoulders16% Knee
9%
2010 Top 5 Body Part
Shoulders27%
Knee22%
Multiple Body Parts21%
Heart15%
Lower Back15%
2011 Top 5 Body Part
Knee45%
Shoulders26%
Lower Back12%
Multiple Body Parts10%
Heart7%
2012 Top 5 Body Part
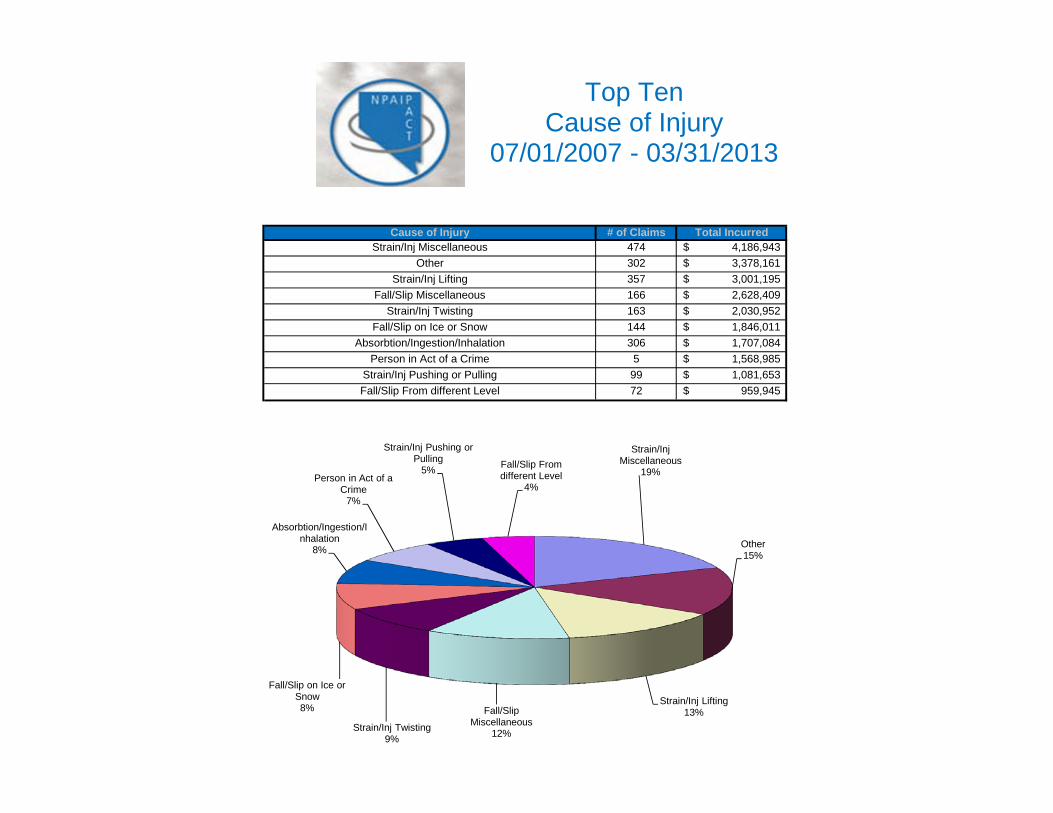
# of Claims Total Incurred474 4,186,943$ 302 3,378,161$ 357 3,001,195$ 166 2,628,409$ 163 2,030,952$ 144 1,846,011$ 306 1,707,084$ 5 1,568,985$ 99 1,081,653$ 72 959,945$
Cause of InjuryStrain/Inj Miscellaneous
OtherStrain/Inj Lifting
Fall/Slip MiscellaneousStrain/Inj Twisting
Fall/Slip on Ice or SnowAbsorbtion/Ingestion/Inhalation
Person in Act of a CrimeStrain/Inj Pushing or PullingFall/Slip From different Level
Top TenCause of Injury
07/01/2007 - 03/31/2013
Strain/Inj Miscellaneous
19%
Other15%
Strain/Inj Lifting13%Fall/Slip
Miscellaneous12%Strain/Inj Twisting
9%
Fall/Slip on Ice or Snow8%
Absorbtion/Ingestion/Inhalation
8%
Person in Act of a Crime
7%
Strain/Inj Pushing or Pulling
5% Fall/Slip From different Level
4%

Fall/Slip Misc43%
Strain/Inj Misc18%
Strain/Inj Twisting
21%
Fall/Slip Misc19%
Strike/Step Misc7%
2007 Top 5 Cause of Injury
Cause of Injury Trends for07/01/2007 - 03/31/2013
Fall/Slip on Ice or Snow
32%
Fall/Slip Misc20%
Strain/Inj Misc15%
Fall/Slip Misc14%
Strain/Inj Pushing or
Pulling13%
2008 Top 5 Cause of Injury
Fall/Slip Misc31%
Strain/Inj Misc24%
Fall/Slip Misc19%
Strike/Step Misc11%
Struck/Inj Misc11%
2009 Top 5 Cause of Injury
Other35%
Strain/Inj Misc22%
Fall/Slip Misc19%
Strain/Inj Misc15%
Gunshot13%
2010 Top 5 Cause of Injury
Strain/Inj Misc32%
Strain/Inj Lifting25%
Strain/Inj Misc13%
Strain/Inj Twisting
13%
Fall/Slip From different Level
10%
2011 Top 5 Cause of Injury
Strain/Inj Misc42%
Strain/Inj Twisting
18%
Strain/Inj Misc19%
Strain/Inj Lifting14%
Other11%
2012 Top 5 Cause of Injury
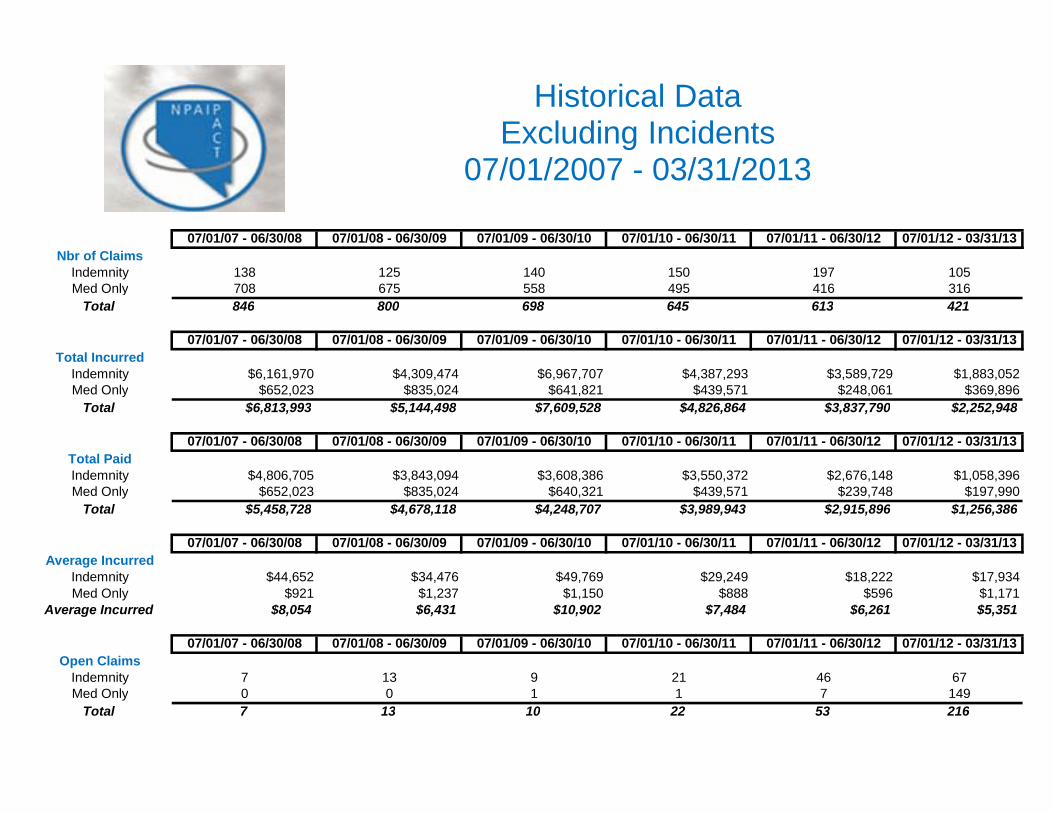
07/01/07 - 06/30/08 07/01/08 - 06/30/09 07/01/09 - 06/30/10 07/01/10 - 06/30/11 07/01/11 - 06/30/12 07/01/12 - 03/31/13Nbr of Claims
Indemnity 138 125 140 150 197 105Med Only 708 675 558 495 416 316
Total 846 800 698 645 613 421
07/01/07 - 06/30/08 07/01/08 - 06/30/09 07/01/09 - 06/30/10 07/01/10 - 06/30/11 07/01/11 - 06/30/12 07/01/12 - 03/31/13Total Incurred
Indemnity $6,161,970 $4,309,474 $6,967,707 $4,387,293 $3,589,729 $1,883,052Med Only $652,023 $835,024 $641,821 $439,571 $248,061 $369,896
Total $6,813,993 $5,144,498 $7,609,528 $4,826,864 $3,837,790 $2,252,948
07/01/07 - 06/30/08 07/01/08 - 06/30/09 07/01/09 - 06/30/10 07/01/10 - 06/30/11 07/01/11 - 06/30/12 07/01/12 - 03/31/13Total PaidIndemnity $4,806,705 $3,843,094 $3,608,386 $3,550,372 $2,676,148 $1,058,396Med Only $652,023 $835,024 $640,321 $439,571 $239,748 $197,990
Total $5,458,728 $4,678,118 $4,248,707 $3,989,943 $2,915,896 $1,256,386
07/01/07 - 06/30/08 07/01/08 - 06/30/09 07/01/09 - 06/30/10 07/01/10 - 06/30/11 07/01/11 - 06/30/12 07/01/12 - 03/31/13Average Incurred
Indemnity $44,652 $34,476 $49,769 $29,249 $18,222 $17,934Med Only $921 $1,237 $1,150 $888 $596 $1,171
Average Incurred $8,054 $6,431 $10,902 $7,484 $6,261 $5,351
07/01/07 - 06/30/08 07/01/08 - 06/30/09 07/01/09 - 06/30/10 07/01/10 - 06/30/11 07/01/11 - 06/30/12 07/01/12 - 03/31/13Open Claims
Indemnity 7 13 9 21 46 67Med Only 0 0 1 1 7 149
Total 7 13 10 22 53 216
Historical DataExcluding Incidents
07/01/2007 - 03/31/2013
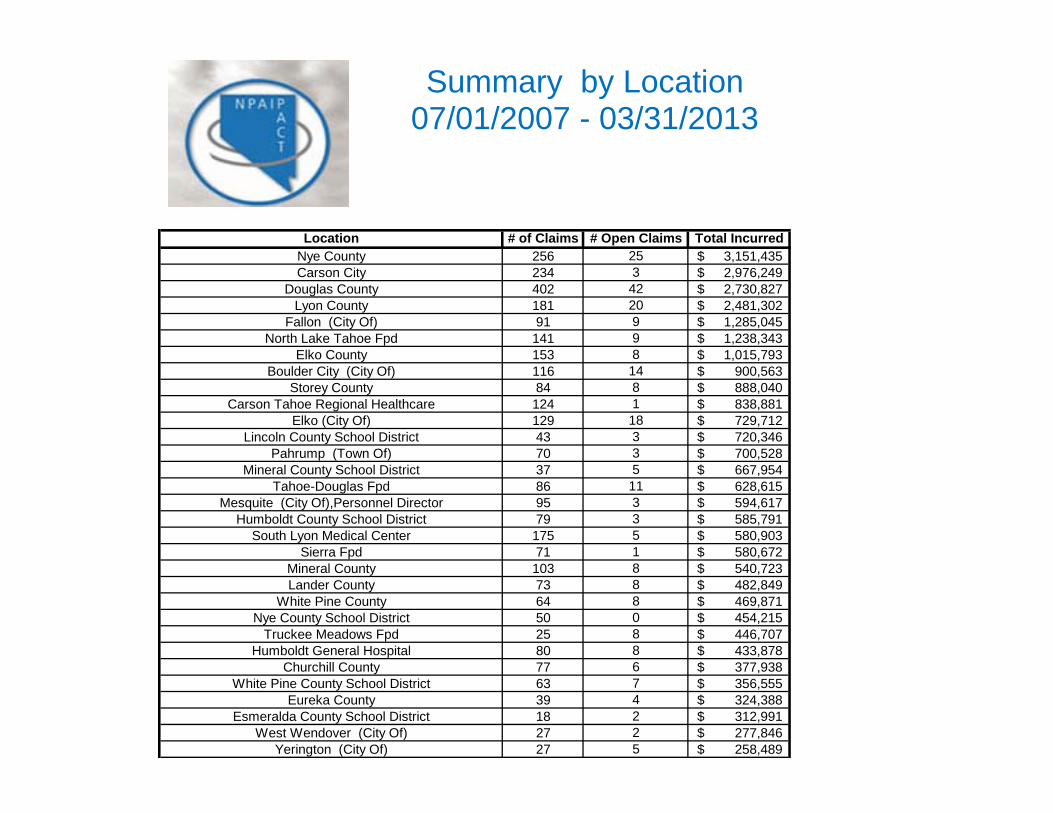
Location # of Claims # Open Claims Total IncurredNye County 256 25 3,151,435$ Carson City 234 3 2,976,249$
Douglas County 402 42 2,730,827$ Lyon County 181 20 2,481,302$
Fallon (City Of) 91 9 1,285,045$ North Lake Tahoe Fpd 141 9 1,238,343$
Elko County 153 8 1,015,793$ Boulder City (City Of) 116 14 900,563$
Storey County 84 8 888,040$ Carson Tahoe Regional Healthcare 124 1 838,881$
Elko (City Of) 129 18 729,712$ Lincoln County School District 43 3 720,346$
Pahrump (Town Of) 70 3 700,528$ Mineral County School District 37 5 667,954$
Tahoe-Douglas Fpd 86 11 628,615$ Mesquite (City Of),Personnel Director 95 3 594,617$
Humboldt County School District 79 3 585,791$ South Lyon Medical Center 175 5 580,903$
Sierra Fpd 71 1 580,672$ Mineral County 103 8 540,723$ Lander County 73 8 482,849$
White Pine County 64 8 469,871$ Nye County School District 50 0 454,215$
Truckee Meadows Fpd 25 8 446,707$ Humboldt General Hospital 80 8 433,878$
Churchill County 77 6 377,938$ White Pine County School District 63 7 356,555$
Eureka County 39 4 324,388$ Esmeralda County School District 18 2 312,991$
West Wendover (City Of) 27 2 277,846$ Yerington (City Of) 27 5 258,489$
Summary by Location07/01/2007 - 03/31/2013
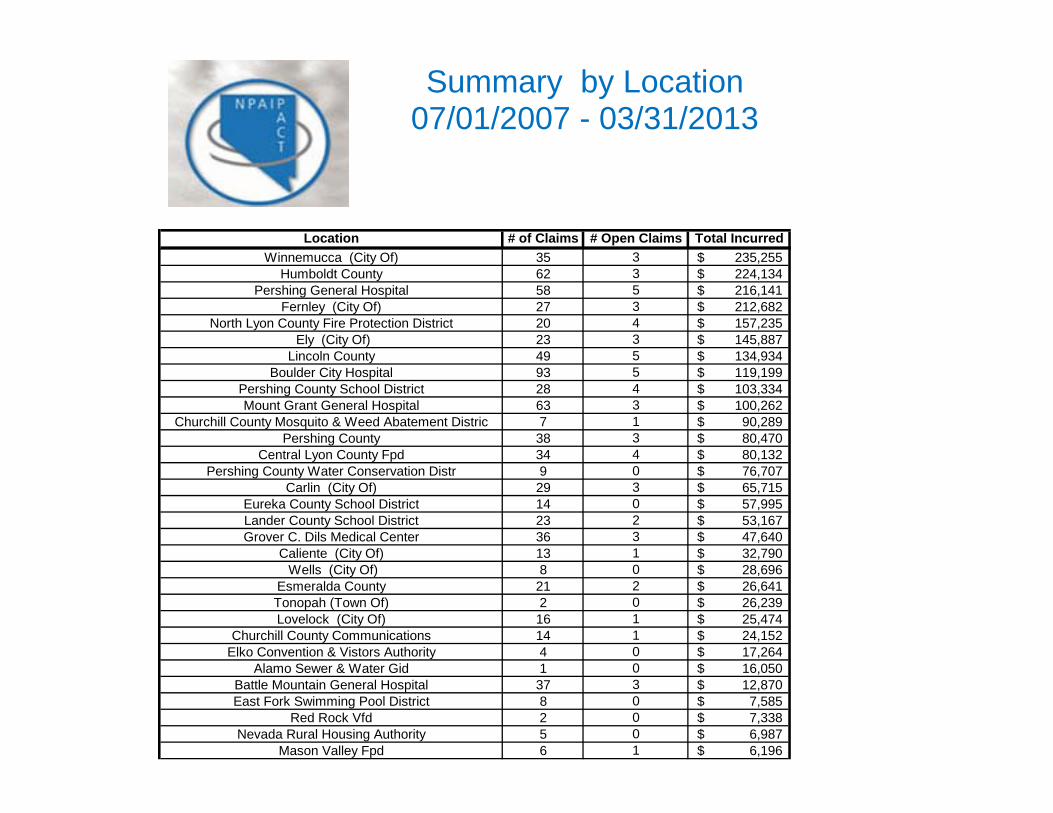
Location # of Claims # Open Claims Total Incurred
Summary by Location07/01/2007 - 03/31/2013
Winnemucca (City Of) 35 3 235,255$ Humboldt County 62 3 224,134$
Pershing General Hospital 58 5 216,141$ Fernley (City Of) 27 3 212,682$
North Lyon County Fire Protection District 20 4 157,235$ Ely (City Of) 23 3 145,887$
Lincoln County 49 5 134,934$ Boulder City Hospital 93 5 119,199$
Pershing County School District 28 4 103,334$ Mount Grant General Hospital 63 3 100,262$
Churchill County Mosquito & Weed Abatement Distric 7 1 90,289$ Pershing County 38 3 80,470$
Central Lyon County Fpd 34 4 80,132$ Pershing County Water Conservation Distr 9 0 76,707$
Carlin (City Of) 29 3 65,715$ Eureka County School District 14 0 57,995$ Lander County School District 23 2 53,167$ Grover C. Dils Medical Center 36 3 47,640$
Caliente (City Of) 13 1 32,790$ Wells (City Of) 8 0 28,696$
Esmeralda County 21 2 26,641$ Tonopah (Town Of) 2 0 26,239$ Lovelock (City Of) 16 1 25,474$
Churchill County Communications 14 1 24,152$ Elko Convention & Vistors Authority 4 0 17,264$
Alamo Sewer & Water Gid 1 0 16,050$ Battle Mountain General Hospital 37 3 12,870$ East Fork Swimming Pool District 8 0 7,585$
Red Rock Vfd 2 0 7,338$ Nevada Rural Housing Authority 5 0 6,987$
Mason Valley Fpd 6 1 6,196$
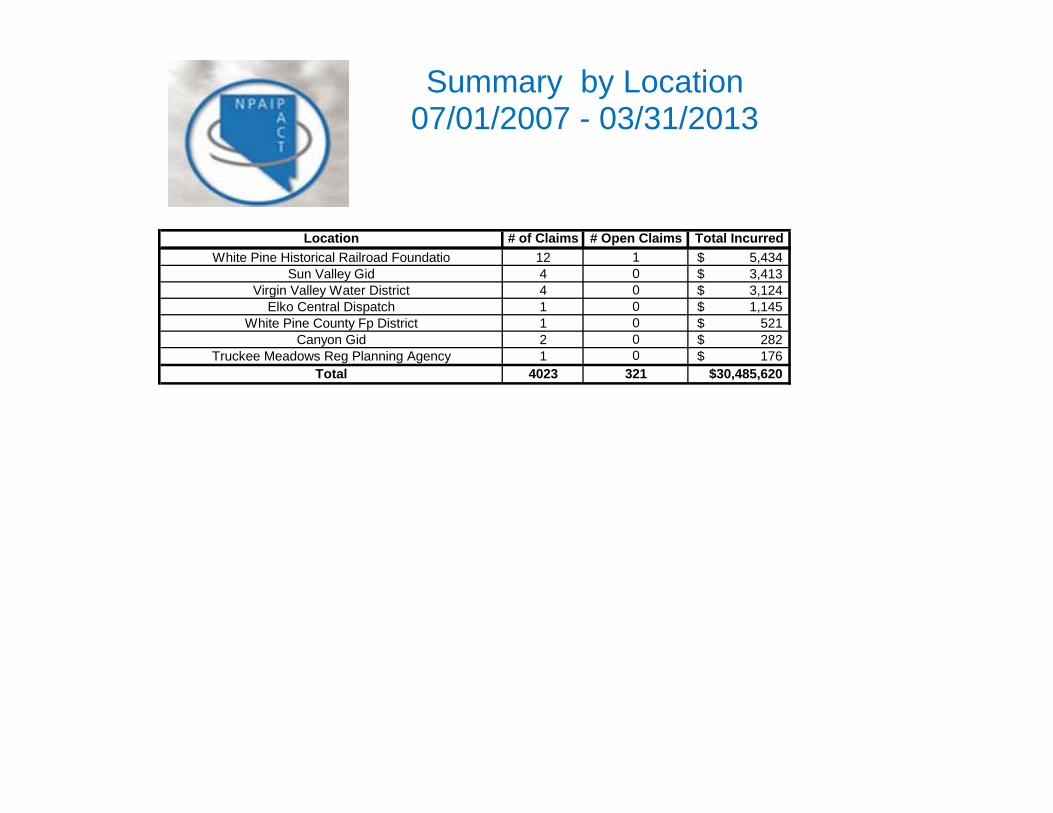
Location # of Claims # Open Claims Total Incurred
Summary by Location07/01/2007 - 03/31/2013
White Pine Historical Railroad Foundatio 12 1 5,434$ Sun Valley Gid 4 0 3,413$
Virgin Valley Water District 4 0 3,124$ Elko Central Dispatch 1 0 1,145$
White Pine County Fp District 1 0 521$ Canyon Gid 2 0 282$
Truckee Meadows Reg Planning Agency 1 0 176$ Total 4023 321 $30,485,620
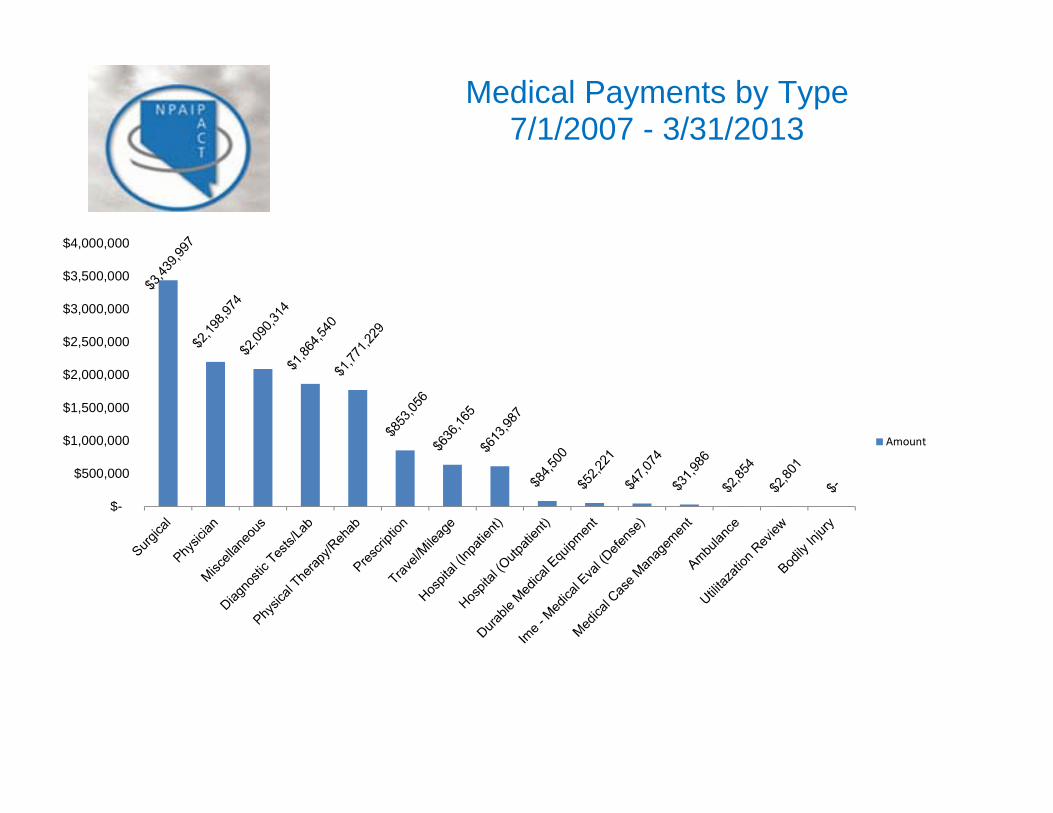
Medical Payments by Type7/1/2007 - 3/31/2013
$-
$500,000
$1,000,000
$1,500,000
$2,000,000
$2,500,000
$3,000,000
$3,500,000
$4,000,000
Amount
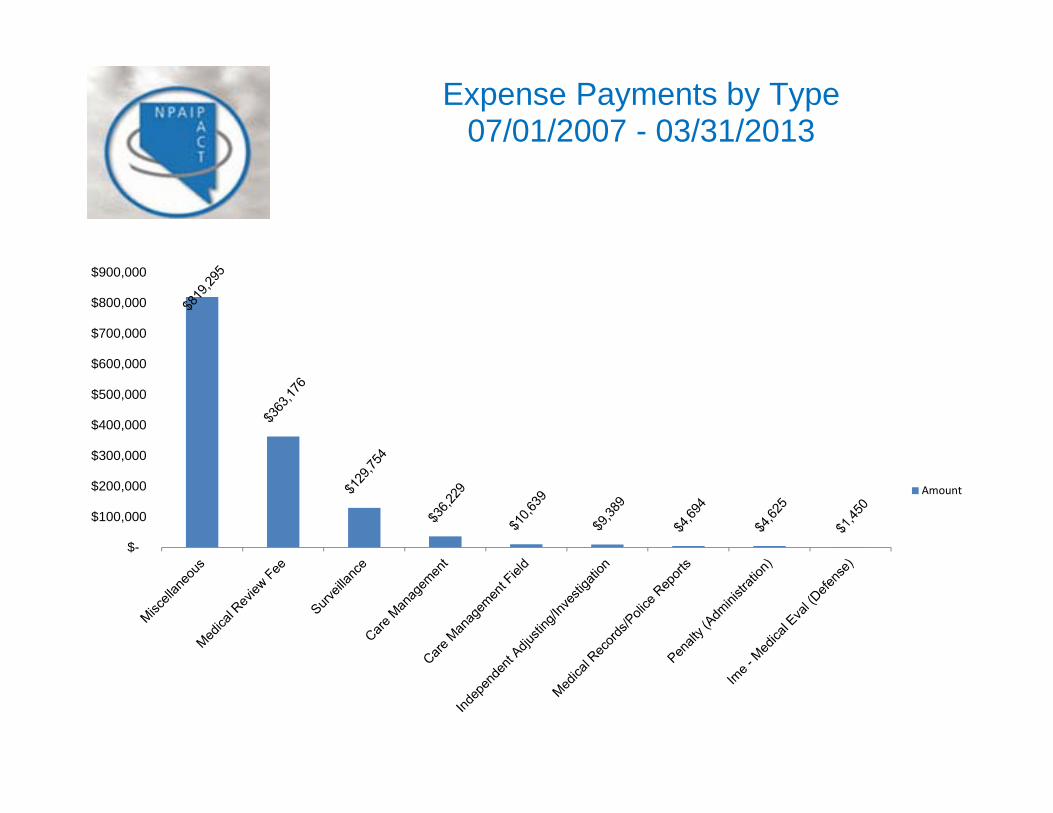
Expense Payments by Type07/01/2007 - 03/31/2013
$-
$100,000
$200,000
$300,000
$400,000
$500,000
$600,000
$700,000
$800,000
$900,000
Amount
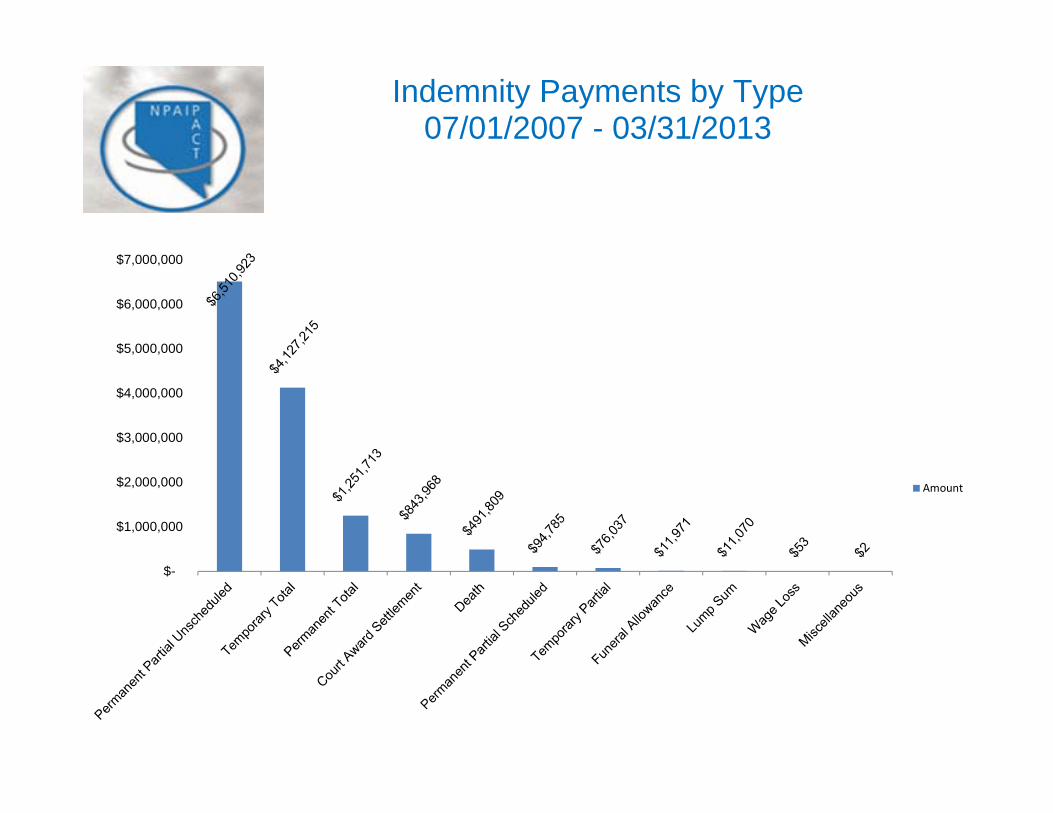
Indemnity Payments by Type07/01/2007 - 03/31/2013
$-
$1,000,000
$2,000,000
$3,000,000
$4,000,000
$5,000,000
$6,000,000
$7,000,000
Amount

Legal Payments by Type07/01/2007 - 03/31/2013
$-
$500,000
$1,000,000
$1,500,000
$2,000,000
$2,500,000
Attorney Expert Witness Other Legal Court Costs
Amount
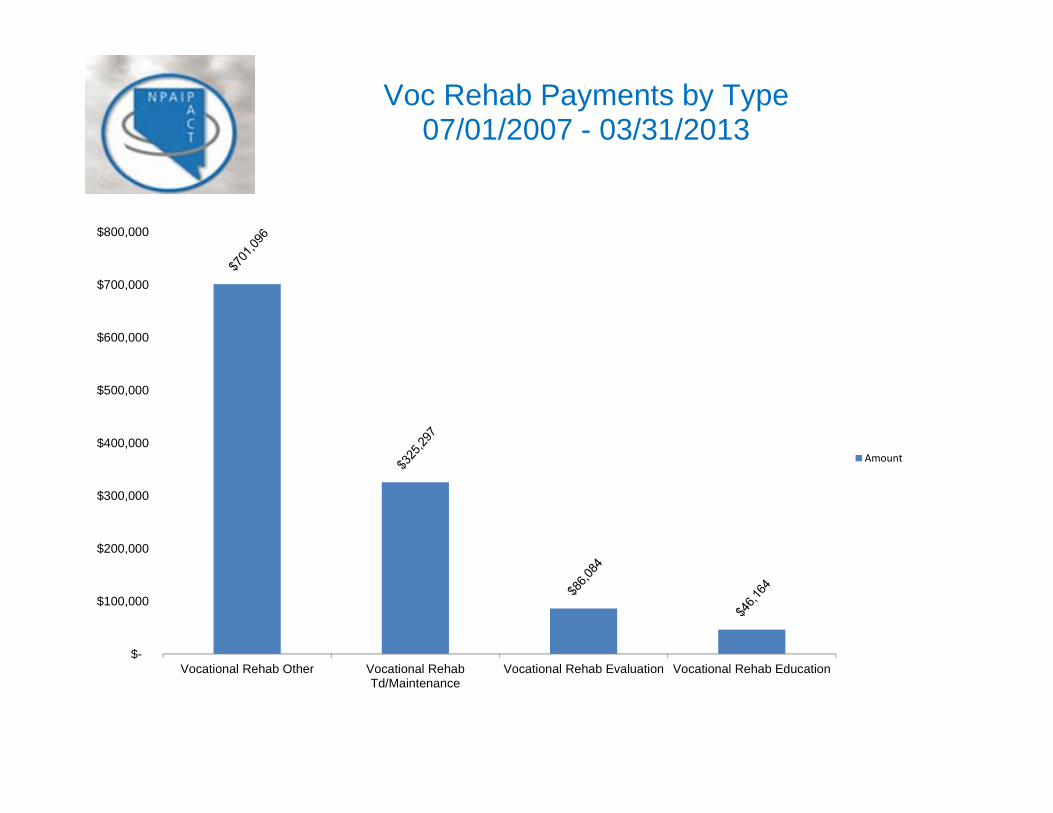
Voc Rehab Payments by Type07/01/2007 - 03/31/2013
$-
$100,000
$200,000
$300,000
$400,000
$500,000
$600,000
$700,000
$800,000
Vocational Rehab Other Vocational RehabTd/Maintenance
Vocational Rehab Evaluation Vocational Rehab Education
Amount
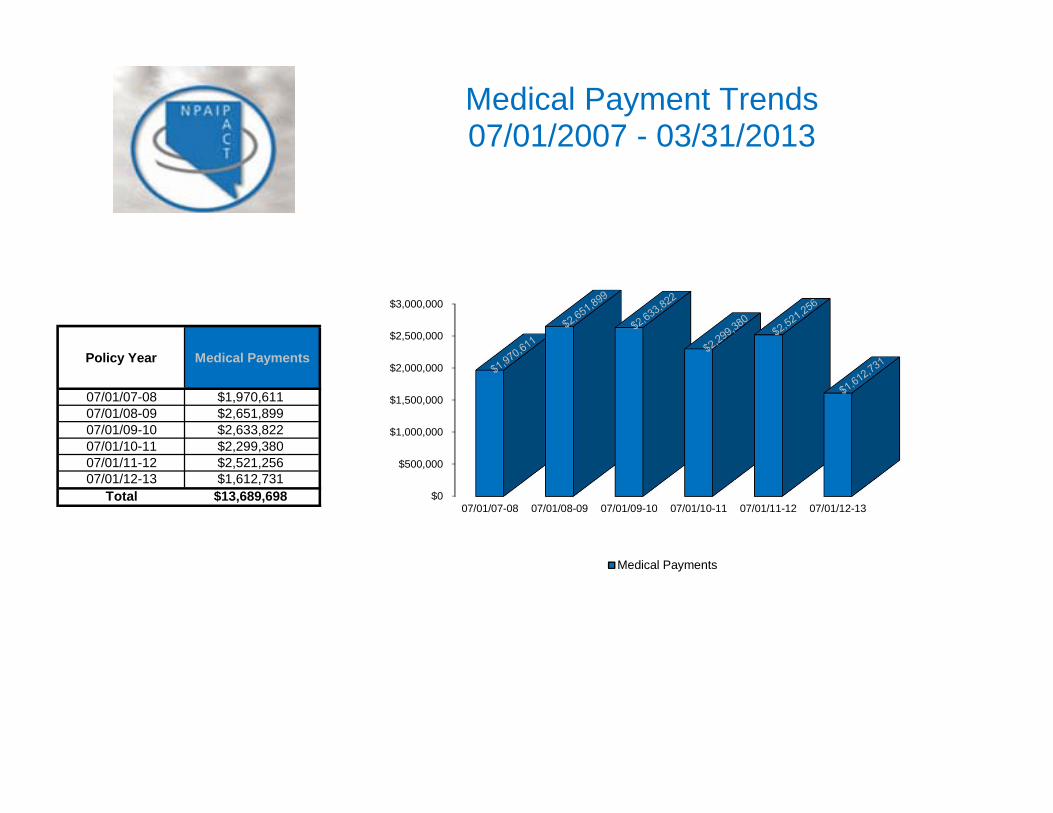
Policy Year Medical Payments
07/01/07-08 $1,970,61107/01/08-09 $2,651,89907/01/09-10 $2,633,82207/01/10-11 $2,299,38007/01/11-12 $2,521,25607/01/12-13 $1,612,731
Total $13,689,698
Medical Payment Trends07/01/2007 - 03/31/2013
$0
$500,000
$1,000,000
$1,500,000
$2,000,000
$2,500,000
$3,000,000
07/01/07-08 07/01/08-09 07/01/09-10 07/01/10-11 07/01/11-12 07/01/12-13
Medical Payments

Policy Year Expense Payments
07/01/07-08 $165,95307/01/08-09 $353,38707/01/09-10 $258,32607/01/10-11 $226,14607/01/11-12 $239,64207/01/12-13 $135,797
Total $1,379,251
Expense Payment Trends07/01/2007 - 03/31/2013
$0
$50,000
$100,000
$150,000
$200,000
$250,000
$300,000
$350,000
$400,000
07/01/07-08 07/01/08-09 07/01/09-10 07/01/10-11 07/01/11-12 07/01/12-13
Expense Payments
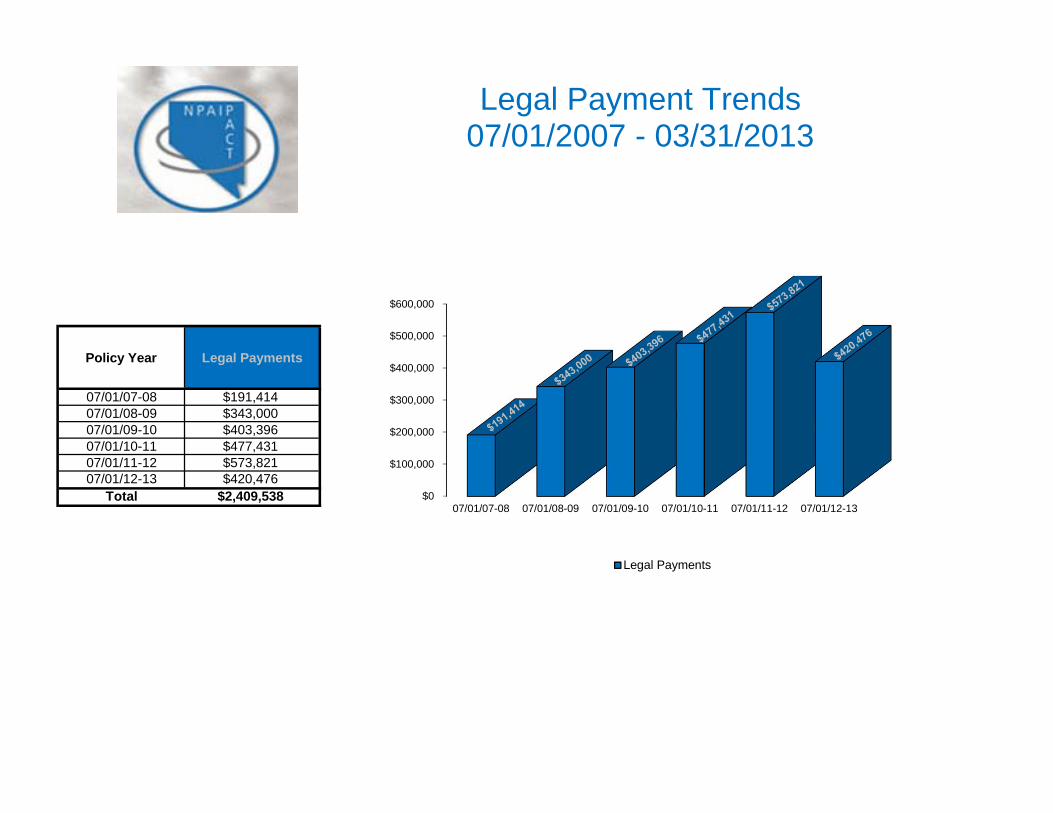
Policy Year Legal Payments
07/01/07-08 $191,41407/01/08-09 $343,00007/01/09-10 $403,39607/01/10-11 $477,43107/01/11-12 $573,82107/01/12-13 $420,476
Total $2,409,538
Legal Payment Trends07/01/2007 - 03/31/2013
$0
$100,000
$200,000
$300,000
$400,000
$500,000
$600,000
07/01/07-08 07/01/08-09 07/01/09-10 07/01/10-11 07/01/11-12 07/01/12-13
Legal Payments
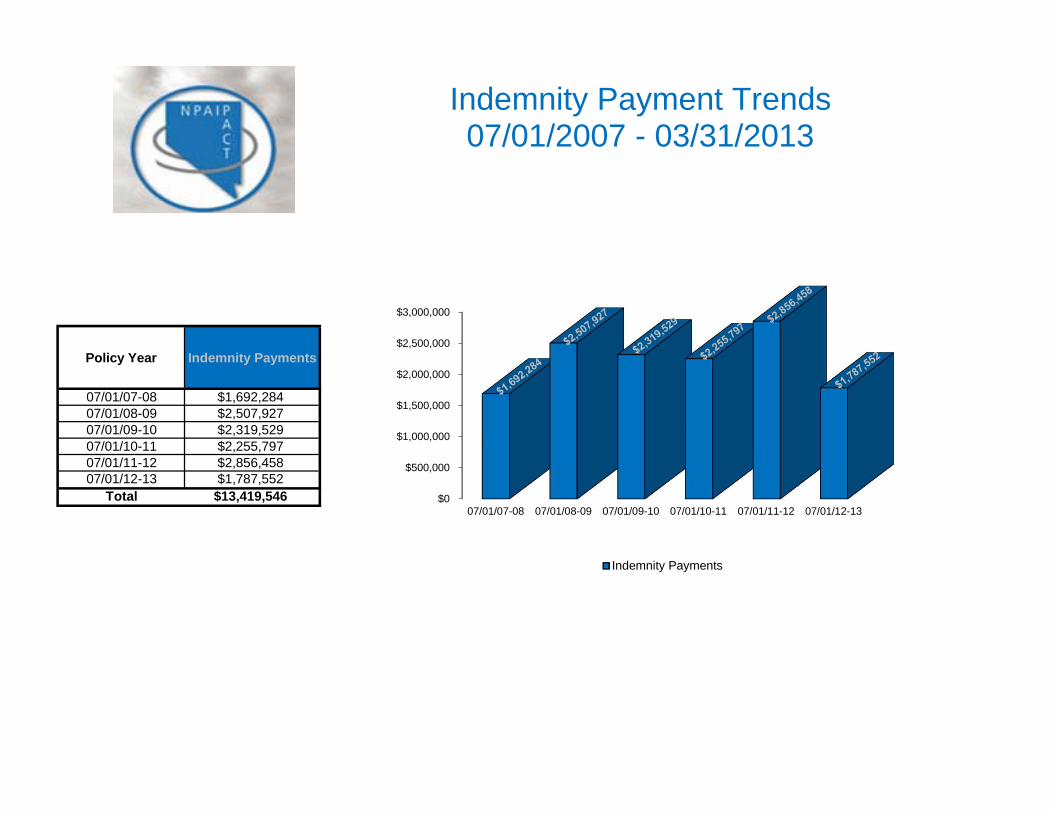
Policy Year Indemnity Payments
07/01/07-08 $1,692,28407/01/08-09 $2,507,92707/01/09-10 $2,319,52907/01/10-11 $2,255,79707/01/11-12 $2,856,45807/01/12-13 $1,787,552
Total $13,419,546
Indemnity Payment Trends07/01/2007 - 03/31/2013
$0
$500,000
$1,000,000
$1,500,000
$2,000,000
$2,500,000
$3,000,000
07/01/07-08 07/01/08-09 07/01/09-10 07/01/10-11 07/01/11-12 07/01/12-13
Indemnity Payments
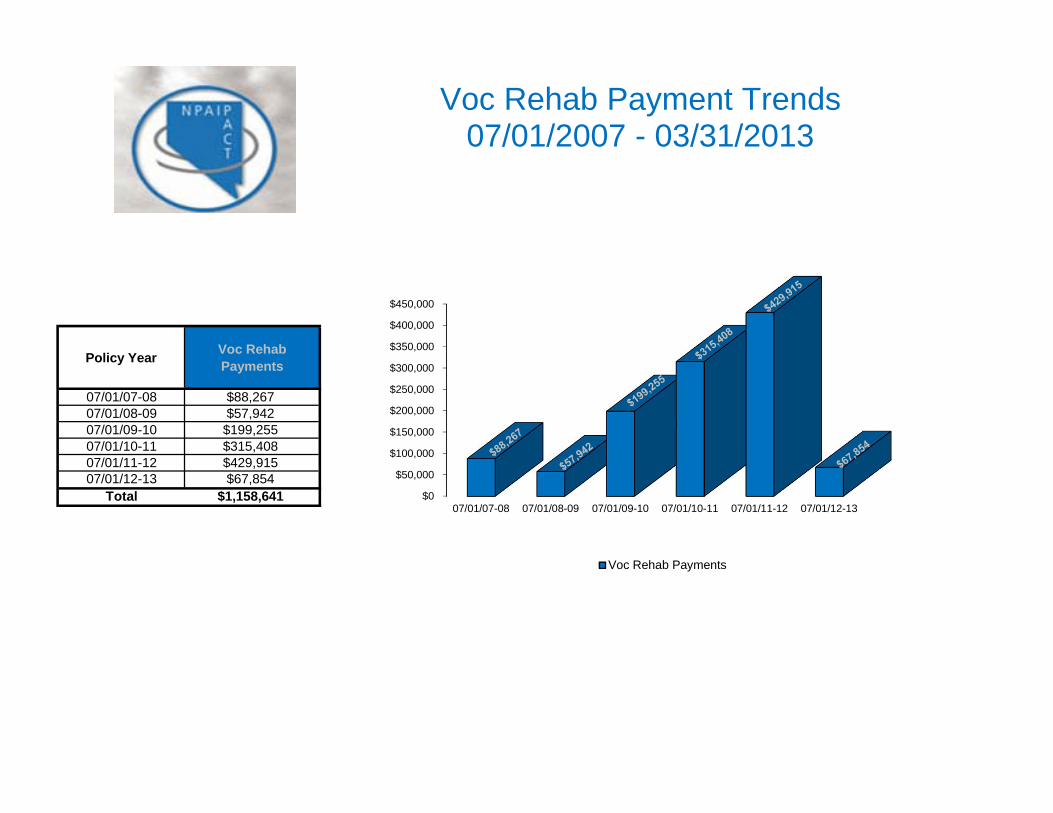
Policy Year Voc Rehab Payments
07/01/07-08 $88,26707/01/08-09 $57,94207/01/09-10 $199,25507/01/10-11 $315,40807/01/11-12 $429,91507/01/12-13 $67,854
Total $1,158,641
Voc Rehab Payment Trends07/01/2007 - 03/31/2013
$0
$50,000
$100,000
$150,000
$200,000
$250,000
$300,000
$350,000
$400,000
$450,000
07/01/07-08 07/01/08-09 07/01/09-10 07/01/10-11 07/01/11-12 07/01/12-13
Voc Rehab Payments