LGE.2Q11 Earnings Presentation
22
0 2Q’11 Earnings Release July 27 th 2011
Transcript of LGE.2Q11 Earnings Presentation

8/6/2019 LGE.2Q11 Earnings Presentation
http://slidepdf.com/reader/full/lge2q11-earnings-presentation 1/22
0
2Q’11 Earnings Release
July 27th 2011

8/6/2019 LGE.2Q11 Earnings Presentation
http://slidepdf.com/reader/full/lge2q11-earnings-presentation 2/22
1
All information regarding management performance and financial results of LG Electronics (the “Company”) during the 2nd
quarter of 2011 as contained herein has been prepared on a consolidated basis in accordance with International FinancialReporting Standards (“IFRS”).
In addition, the information regarding results of 2nd quarter of 2011 has been prepared in advance, prior to being reviewed by
outside auditors, solely for the convenience of investors of the Company, and is subject to change in the process of final
reviewing by outside auditors.
The information contained herein includes forward-looking statements in respect to future plans, prospects, and performances
of the Company as well as the Company’s projected sales plan for the 3rd quarter of 2011. These forward-looking statements
also refer to the Company’s performance on consolidated base, as indicated.
The aforementioned forward-looking statements are influenced by changes in the management environment and relativeevents, and by their nature, these statements refer to uncertain circumstances. Consequently, due to these uncertainties, the
Company’s actual future results may differ materially from those expressed or implied by such statements.
Please note that as the forward-looking statements contained herein are based on the current market situation and the
Company’s management direction, they are subject to change according to the changes in future market environment and
business strategy.
The information contained herein should not be utilized for any legal purposes in regards to investors’ investment results. The
Company hereby expressly disclaims any and all liability for any loss or damage resulting from the investors’ reliance on the
information contained herein.

8/6/2019 LGE.2Q11 Earnings Presentation
http://slidepdf.com/reader/full/lge2q11-earnings-presentation 3/22
2
Table of Contents Table of Contents
Ⅰ. Overview
Ⅱ. 2Q’11 Results (Consolidated)
Ⅲ. Performance and Outlook by Sector

8/6/2019 LGE.2Q11 Earnings Presentation
http://slidepdf.com/reader/full/lge2q11-earnings-presentation 4/22 3
Ⅰ. Overview
Comment on 2Q’11 Results
Comment on 3Q’11 Outlook
1

8/6/2019 LGE.2Q11 Earnings Presentation
http://slidepdf.com/reader/full/lge2q11-earnings-presentation 5/22 4
2Q 2Q ’ ’ 11 Results 11 Results

8/6/2019 LGE.2Q11 Earnings Presentation
http://slidepdf.com/reader/full/lge2q11-earnings-presentation 6/225
II. 2Q’11 Results (LGE Consolidated) Sales/Profit
(Unit : KRW tn)
Sales Profit
(Unit : KRW bn)
0.2%↓
13.16
14.4114.399.3%↑
2Q’11
158
108
462
1Q’11 QoQ YoY
8%
131
429
-16
2Q’101Q’11
2Q’10
2Q’11
n/a 87%
21% 25%
12%
Net Profit
OperatingProfit
EBITDA
126
413
856
2

8/6/2019 LGE.2Q11 Earnings Presentation
http://slidepdf.com/reader/full/lge2q11-earnings-presentation 7/226
II. 2Q’11 Results (LGE Consolidated) Net Profit
Net Profit Investment Income(Unit: KRW bn)(Unit: KRW bn)
1Q’11 2Q’11
6
29
33
-10
Net financialexpense
Investment income
3
Op. Profit
Tax
108
158
29 38
41
LG Display -48
LG Innotek -15
Others7
Investment Income -56
Net Profit

8/6/2019 LGE.2Q11 Earnings Presentation
http://slidepdf.com/reader/full/lge2q11-earnings-presentation 8/227
II. 2Q’11 Results (LGE Consolidated) Cash Flow Statement
2Q Net* Cash Flow(Unit : KRW bn)
Cash Flow Statement(Unit : KRW bn)
2Q’111Q’11Cash Out
4*Net= Excluding Cash flow from financing activities
Cash flow from operating activities
Cash at beginning of period
Net income
Depreciation
Investment income
Increase in working capitalOthers
Cash flow from investing activities
108
304
-29
34236
2,212
653
-669
-16
298
56
-368201
1,944
171
-466
Net *Cash In
-28
34
108
236
29
12
669304
Investment income
FX effect fromforeign currencydenominated cash
Others
Increase inworking capital
Cash flow frominvesting activitiesDepreciation
-388-387Increase in tangible assets
Changes in the scope of consolidation
Cash flow from financing activities 59557
-1480
Net Profit93557Increase in debt
Net changes in cash
FX effect from foreign currencydenominated cash
31
-12
268
6
Cash at end of period 2,2432,212

8/6/2019 LGE.2Q11 Earnings Presentation
http://slidepdf.com/reader/full/lge2q11-earnings-presentation 9/22
8
II. 2Q’11 Results (LGE Consolidated) Financial Structure
Balance Sheet Financial Ratio
(Unit : %)(Unit: KRW tn)
2Q’11 2Q’114Q’10 1Q’111Q’114Q’10
16633.8432.32 33.53 Assets
5
Liabilities
Equity
Current Liabilities
Non-Current Liabilities
Current Assets
Debt
Cash
Inventory
Non-Current Assets
Net Debt
Debt to Equity
Net Debtto Equity
Total Liabilityto Equity
21.1019.46 20.80
12.7412.86 12.73
16.67
4.43
17.53
7.76
2.24
6.09
16.31
1.94
5.87
15.80
2.21
6.38
15.87
5.52
15.39
4.07
16.51
7.19
5.25
16.30
4.51
17.66
7.72
5.51
151
56
41
61
43
163
61
43

8/6/2019 LGE.2Q11 Earnings Presentation
http://slidepdf.com/reader/full/lge2q11-earnings-presentation 10/22
Performance and Outlook Performance and Outlook

8/6/2019 LGE.2Q11 Earnings Presentation
http://slidepdf.com/reader/full/lge2q11-earnings-presentation 11/22
10
*III. Performance and Outlook by Sector Sales/Profit
Consolidated Sales and Profit by Division
(Unit : KRW bn)
Home
Entertainment
Sales
Op. Income
Mobile
Communications
Handset
Home
Appliance
Air Conditioning
& Energy Solution
Sales
Op. Income
Sales
Op. Income
Sales
Op. Income
Sales
Op. Income
2Q’11
5,420
90
2Q’10
5,727
-26
QoQ YoY
3,246
-54
3,403
-119
3,200
-55
3,373
-120
2,885
51
2,722
185
1,876
44
1,628
59
5.1%
15.3%
6.0%
1Q’11
5,280
82
2,909
-101
2,852
-101
2,699
103
1,452
39
4.6%
5.4%
29.2%
2.7%
11.6%
12.2%
6.9%
* Divisional sales includes internal transactions between divisions
6
8/6/2019 LGE.2Q11 Earnings Presentation
http://slidepdf.com/reader/full/lge2q11-earnings-presentation 12/22
11
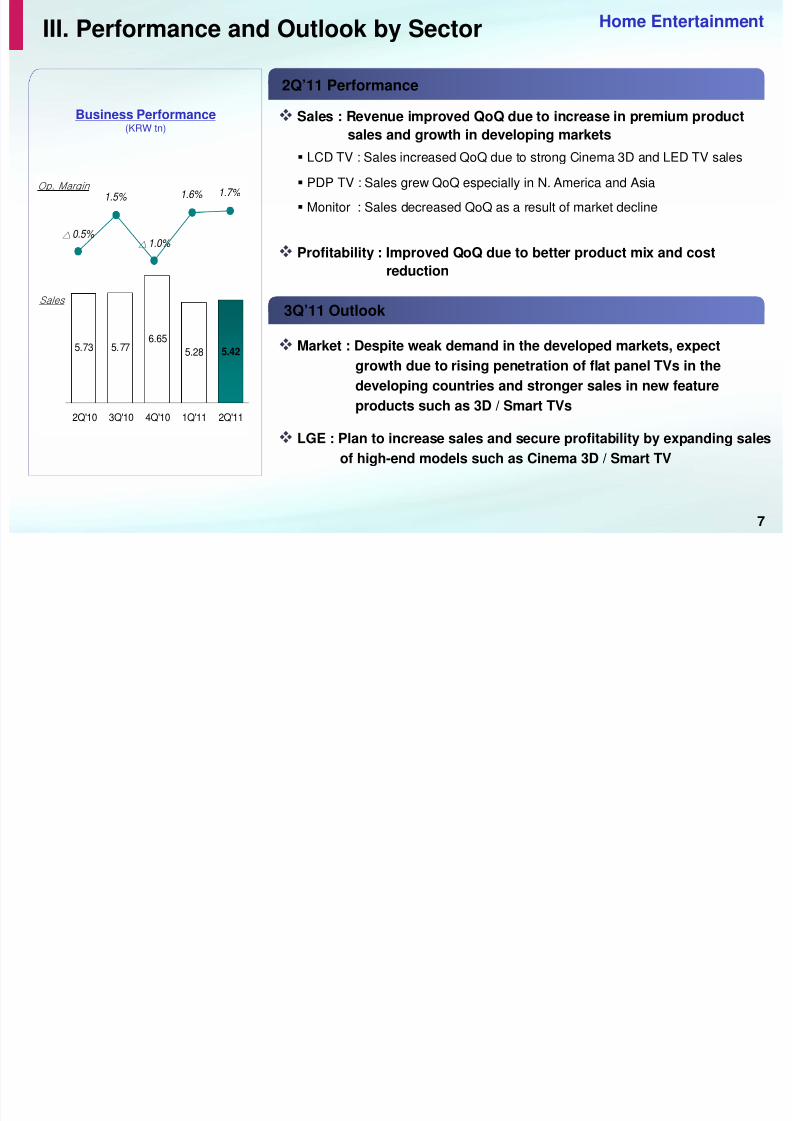
Home EntertainmentIII. Performance and Outlook by Sector
Sales : Revenue improved QoQ due to increase in premium product
sales and growth in developing markets
7
Profitability : Improved QoQ due to better product mix and cost
reduction
LGE : Plan to increase sales and secure profitability by expanding sales
of high-end models such as Cinema 3D / Smart TV
Market : Despite weak demand in the developed markets, expect
growth due to rising penetration of flat panel TVs in the
developing countries and stronger sales in new feature
products such as 3D / Smart TVs
LCD TV : Sales increased QoQ due to strong Cinema 3D and LED TV sales
PDP TV : Sales grew QoQ especially in N. America and Asia Monitor : Sales decreased QoQ as a result of market decline
Business Performance(KRW tn)
5.73 5.776.65
5.28 5.42
2Q'10 3Q'10 4Q'10 1Q'11 2Q'11
1.5% 1.6% 1.7%
△0.5%
△1.0%
Sales
Op. Margin
2Q’11 Performance
3Q’11 Outlook

8/6/2019 LGE.2Q11 Earnings Presentation
http://slidepdf.com/reader/full/lge2q11-earnings-presentation 13/22
12
Mobile CommunicationsIII. Performance and Outlook by Sector
Sales : Shipments slightly grew QoQ to 24.8M while revenue was up
11% QoQ to KRW 3.2 trillion due to increased smartphone portio
Profitability : Profitability improved due to rising smartphone sales
and efforts to cut down fixed costs
Smartphone sales increased while there was a relative decline for feature phone
- N. America : Growth in Optimus One/ 2X sales
- Europe : Increased sales for smartphones (Optimus 2X / Black) whil
featurephone sales were weak
- Emerging markets : Operated a profitability focused business
2Q’11 Performance
3Q’11 Outlook
Business Performance(KRW tn)
3.43.02
3.382.91 3.25
2Q'10 3Q'10 4Q'10 1Q'11 2Q'11
△3.5%
△10.0%
△7.7%
△3.5% △1.7%
Sales
Op. Margin
Market : Competition is expected to intensify with handset makers
launching new models with the opening of the 3D phone marke
and 4G LTE expanding in the developed countries
LGE : Increase sales by timely introducing new models with hardware
competency and gain profitability by improving product mix
8

8/6/2019 LGE.2Q11 Earnings Presentation
http://slidepdf.com/reader/full/lge2q11-earnings-presentation 14/22
13
Market :
LGE
Sales :
Profitability :
Sales :
Overseas :
Korea :
Profitability :
Increased 6% YoY to KRW 2.9 trillion due to rising sales in the
developing markets (14% YoY growth based on USD)
Maintained sales growth by increasing sales of premium products
(850 liter large size refrigerator, 6 motion washing machine,
TROMM Styler)
Grew 15% YoY based on USD due to strong emerging market sales
(India 19%, CIS 59%, MEA 19%, CS America 23%)
Declined due to raw material cost increase, appreciating
KRW, and increased competition
Despite the slow economy in the US and Europe, the appliance
market is expected to increase 7% YoY due to strong growth
in the developing markets
Dominate premium image by continuously launching new products
and increasing sales of larger, more energy efficient, and smart
productsPlan to secure profitability by increasing revenue and cutting costs
despite challenges such as raw material price increase and FX rate
III. Performance and Outlook by Sector Home Appliance
2Q’11 Performance
3Q’11 Outlook
Business Performance(KRW tn)
2.72 2.75 2.82 2.7 2.88
2Q'10 3Q'10 4Q'10 1Q'11 2Q'11
6.8%
2.4% 2.8%
3.8%
1.8%
Sales
Op. Margin
9
Ai C diti i & E S l ti

8/6/2019 LGE.2Q11 Earnings Presentation
http://slidepdf.com/reader/full/lge2q11-earnings-presentation 15/22
14
Sales : Increased 15% YoY due to strong growth in Korea and the
emerging markets such as CIS
Profitability : Despite revenue growth from the improvement of product
mix with new model launches, profitability declined QoQ
and YoY due to rising raw material costs and unfavorableFX movements
Market : Although the market is entering into the slow season, demand
expected to increase YoY in Korea, CIS, and MEA
LGE : Plan to increase global market share by maximizing sales in the
Korean market and utilize our competitive advantage for
strategic products such as Multi V and Inverter products
Overseas : Up 12% YoY with strong Multi V and Inverter product sales
Korea : Posted 55% growth YoY driven by launching products with superior
functions and quality
III. Performance and Outlook by Sector Air-Conditioning & Energy Solution
2Q’11 Performance
3Q’11 Outlook
Business Performance(KRW tn)
1.63
1.110.91
1.451.88
2Q'10 3Q'10 4Q'10 1Q'11 2Q'11
2.3% 2.7% 1.1%
△4.7%
3.6%
Sales
Op, Margin
10

8/6/2019 LGE.2Q11 Earnings Presentation
http://slidepdf.com/reader/full/lge2q11-earnings-presentation 16/22
15
http:/ / w w w .lg.com
Appendix 2011 Business Reorganization

8/6/2019 LGE.2Q11 Earnings Presentation
http://slidepdf.com/reader/full/lge2q11-earnings-presentation 17/22
1611
Appendix. 2011 Business Reorganization
Home
Appliance
Air
Conditioning
Home
Entertainment
Business
Solution
Mobile
Communications
Home
Appliance
Air-Conditioning
& Energy Solution
Home
Entertainment
Mobile
Communications
Independent
Business Unit
- Monitor (to HE)- Commercial Display
& Security (to HE)- Car (to Independent
Business Unit)
- DS (from HE)
- PC (from MC)
- Car (from BS)
- Digital Storage (DS)(to Independent
Business Unit)
- Realigned to 4 business units (vs. previous 5 units) and renamed Regional Headquarters to
Regional Representatives
- BS Company has been dissolved with the Monitor and Commercial Display & Security business unitstransferring to HE Company while the rest became independent business units
- AC Company took on a new name of Air-Conditioning and Energy Solution (AE) Company
- Changes in effect as of December 1, 2010
- PC(to Independent
Business Unit)
- Residential Air-Con.- Commercial Air-Con.
- Air-Con. Compressor
- Solar cell- LED lighting
- Refrigerator- Washing machine
- Cooking & Cleaning
- Compressor & Motor- Healthcare
- Water Treatment
- Handset- Network
- LCD/ CRT TV- PDP TV/ Module
- Media
- CEM (previously RMC)- Monitor (from BS)
- Commercial Display& Security (from BS)
**
* Independent business units report directly to the CEO** CEM= Chemical & Electronic Material / RMC= Recording Media & Chemitronics
Appendix Summarized Financial Statements (LGE Parent Only)

8/6/2019 LGE.2Q11 Earnings Presentation
http://slidepdf.com/reader/full/lge2q11-earnings-presentation 18/22
Appendix Summarized Financial Statements (LGE Parent Only)
Income Statement
(Unit : KRW bn)
Sales 7,227 100.0% 7,653 100.0% 7,229 100.0% 7,129 98.6% 29,239 100.0% 6,933 100.0% 7,574 100.0%
Domestic 1,606 22.2% 1,802 23.5% 1,783 24.7% 1,701 23.5% 6,892 23.6% 1,953 28.2% 2,151 28.4%Export 5,621 77.8% 5,851 76.5% 5,446 75.3% 5,428 75.1% 22,346 76.4% 4,980 71.8% 5,423 71.6%
Cost of goods sold 5,838 80.8% 6,441 84.2% 6,244 86.4% 6,370 88.1% 24,894 85.1% 5,716 82.4% 6,266 82.7%
Gross profit 1,389 19.2% 1,212 15.8% 985 13.6% 759 10.5% 4,345 14.9% 1,217 17.6% 1,308 17.3%
Selling & admin expense 1,244 17.2% 1,443 18.9% 1,443 20.0% 1,338 18.5% 5,468 18.7% 1,300 18.8% 1,410 18.6%
Other operating gain (Loss) 52 0.7% (19) -0.2% (66) -0.9% 14 0.2% (19) -0.1% (34) -0.5% (16) -0.2%
Operating income (Loss) 93 1.3% (213) -2.8% (393) -5.4% (593) -8.2% (1,105) -3.8% (49) -0.7% (87) -1.1%
Financial income (Expense) 143 2.0% (182) -2.4% 85 1.2% (18) -0.2% 28 0.1% 65 0.9% 14 0.2%
Net profit (Loss) before tax 236 3.3% (395) -5.2% (308) -4.3% (611) -8.4% (1,077) -3.7% 16 0.2% (73) -1.0%
Tax 7 0.1% (144) -1.9% (121) -1.7% (184) -2.5% (441) -1.5% 1 0.0% (37) -0.5%
Net profit (Loss) 229 3.2% (251) -3.3% (187) -2.6% (427) -5.9% (636) -2.2% 15 0.2% (36) -0.5%
2Q
2011
4Q3Q2Q
2010
1QTotal1Q
* Since this is not an audited nor reviewed report, content may be changed in the future if an auditor has a concern. 12
Appendix Summarized Financial Statements (LGE Parent Only)
8/6/2019 LGE.2Q11 Earnings Presentation
http://slidepdf.com/reader/full/lge2q11-earnings-presentation 19/22
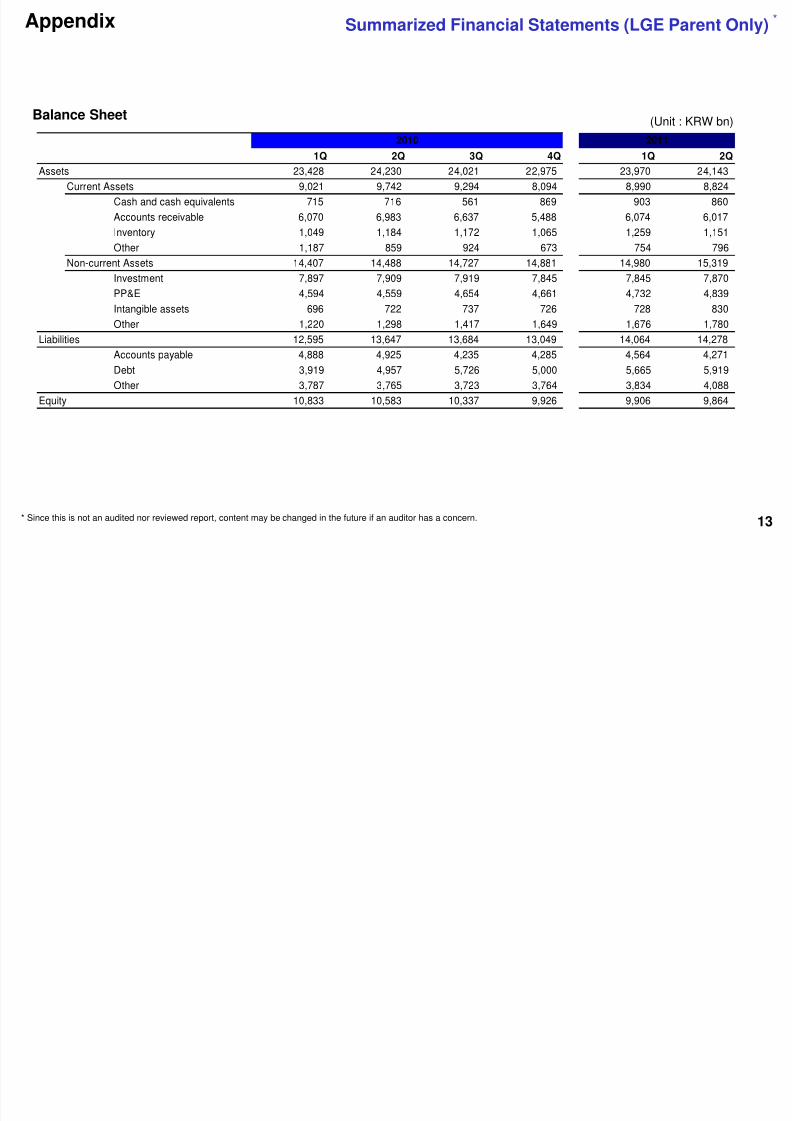
Appendix Summarized Financial Statements (LGE Parent Only)
Balance Sheet(Unit : KRW bn)
1Q 2Q 3Q 4Q 1Q 2Q
Assets 23,428 24,230 24,021 22,975 23,970 24,143
Current Assets 9,021 9,742 9,294 8,094 8,990 8,824Cash and cash equivalents 715 716 561 869 903 860
Accounts receivable 6,070 6,983 6,637 5,488 6,074 6,017
Inventory 1,049 1,184 1,172 1,065 1,259 1,151
Other 1,187 859 924 673 754 796
Non-current Assets 14,407 14,488 14,727 14,881 14,980 15,319
Investment 7,897 7,909 7,919 7,845 7,845 7,870
PP&E 4,594 4,559 4,654 4,661 4,732 4,839
Intangible assets 696 722 737 726 728 830
Other 1,220 1,298 1,417 1,649 1,676 1,780
Liabilities 12,595 13,647 13,684 13,049 14,064 14,278
Accounts payable 4,888 4,925 4,235 4,285 4,564 4,271
Debt 3,919 4,957 5,726 5,000 5,665 5,919
Other 3,787 3,765 3,723 3,764 3,834 4,088
Equity 10,833 10,583 10,337 9,926 9,906 9,864
20112010
* Since this is not an audited nor reviewed report, content may be changed in the future if an auditor has a concern. 13
Appendix S ari ed Financial State ents (LGE Consolidated

8/6/2019 LGE.2Q11 Earnings Presentation
http://slidepdf.com/reader/full/lge2q11-earnings-presentation 20/22
Appendix Summarized Financial Statements (LGE Consolidated
Income Statement(Unit : KRW bn)
Sales 13,217 100.0% 14,410 100.0% 13,429 100.0% 14,698 100.0% 55,754 100.0% 13,160 100.0% 14,385 100.
Cost of goods sold 9,807 74.2% 11,110 77.1% 10,555 78.6% 11,982 81.5% 43,453 77.9% 10,195 77.5% 11,078 77.
Gross profit 3,411 25.8% 3,300 22.9% 2,874 21.4% 2,716 18.5% 12,301 22.1% 2,965 22.5% 3,307 23.
Selling & admin expense 2,895 21.9% 3,185 22.1% 3,187 23.7% 2,946 20.0% 12,213 21.9% 2,896 22.0% 3,193 22.
Other operating gain (Loss) 35 0.3% (11) -0.1% (128) -1.0% 16 0.1% (88) -0.2% (61) -0.5% (44) -0.
Operating income (Loss) 481 3.6% 126 0.9% (185) -1.4% (246) -1.7% 176 0.3% 131 1.0% 158 1.
Financial income (Expense) 59 0.4% (270) -1.9% 45 0.3% (54) -0.4% (219) -0.4% (37) -0.3% (38) -0.
Investment income (Loss) 219 1.7% 210 1.5% 123 0.9% (74) -0.5% 477 0.9% (55) -0.4% 29 0.
Net income before tax 759 5.7% 66 0.5% (17) -0.1% (374) -2.5% 435 0.8% 38 0.3% 150 1.
Tax 117 0.9% 25 0.2% (24) -0.2% (117) -0.8% 0 0.0% 54 0.4% 41 0.
Profit (Loss) from discontinued operations 32 0.2% 815 5.7% 0 0.0% 0 0.0% 848 1.5% 0 0.0% 0 0.
Net income 675 5.1% 856 5.9% 8 0.1% (256) -1.7% 1,282 2.3% (16) -0.1% 108 0.
Controlled shares 650 842 (6) (260) 1,227 (30) 98
Noncontrolled shares 24 14 14 3 55 14 11
Total
2010
2Q
2011
4Q3Q2Q1Q 1Q
* Since this is not an audited nor reviewed report, content may be changed in the future if an auditor has a concern.
14* Profit from LG Innotek being excluded from the consolidation of LGE has been indicated as “Profit (Loss) from discontinued operations”
Appendix Summarized Financial Statements (LGE Consolidated

8/6/2019 LGE.2Q11 Earnings Presentation
http://slidepdf.com/reader/full/lge2q11-earnings-presentation 21/22
Appendix Summarized Financial Statements (LGE Consolidated
Balance Sheet(Unit : KRW bn)
1Q 2Q 3Q 4Q 1Q 2Q
Assets 33,794 34,036 33,822 32,318 33,534 33,845
Current Assets 18,409 18,635 18,195 16,515 17,660 17,534
Cash and cash equivalents 1,977 1,684 1,785 1,944 2,212 2,243
Accounts receivable 8,042 8,629 7,477 7,002 7,376 7,512
Inventory 6,011 6,379 7,025 5,872 6,376 6,091
Other 2,379 1,943 1,908 1,696 1,697 1,688
Non-current Assets 15,386 15,401 15,627 15,804 15,874 16,310
Investment 4,512 6,063 6,158 6,008 5,868 5,889
PP&E 7,736 6,256 6,326 6,500 6,645 6,810
Intangible assets 820 758 773 763 766 881
Other 2,318 2,323 2,371 2,532 2,594 2,731
Liabilities 21,139 20,774 20,738 19,459 20,802 21,101
Accounts payable 6,728 6,707 6,174 5,824 6,367 6,320
Debt 6,907 7,083 7,723 7,193 7,721 7,764
Other 7,505 6,984 6,842 6,442 6,714 7,017Equity 12,655 13,261 13,084 12,860 12,732 12,744
20112010
15* 1Q10 numbers are based on a consolidated basis including LG Innotek
* Since this is not an audited nor reviewed report, content may be changed in the future if an auditor has a concern.
Divisional Sales (LGE Consolidated)Appendix
8/6/2019 LGE.2Q11 Earnings Presentation
http://slidepdf.com/reader/full/lge2q11-earnings-presentation 22/22
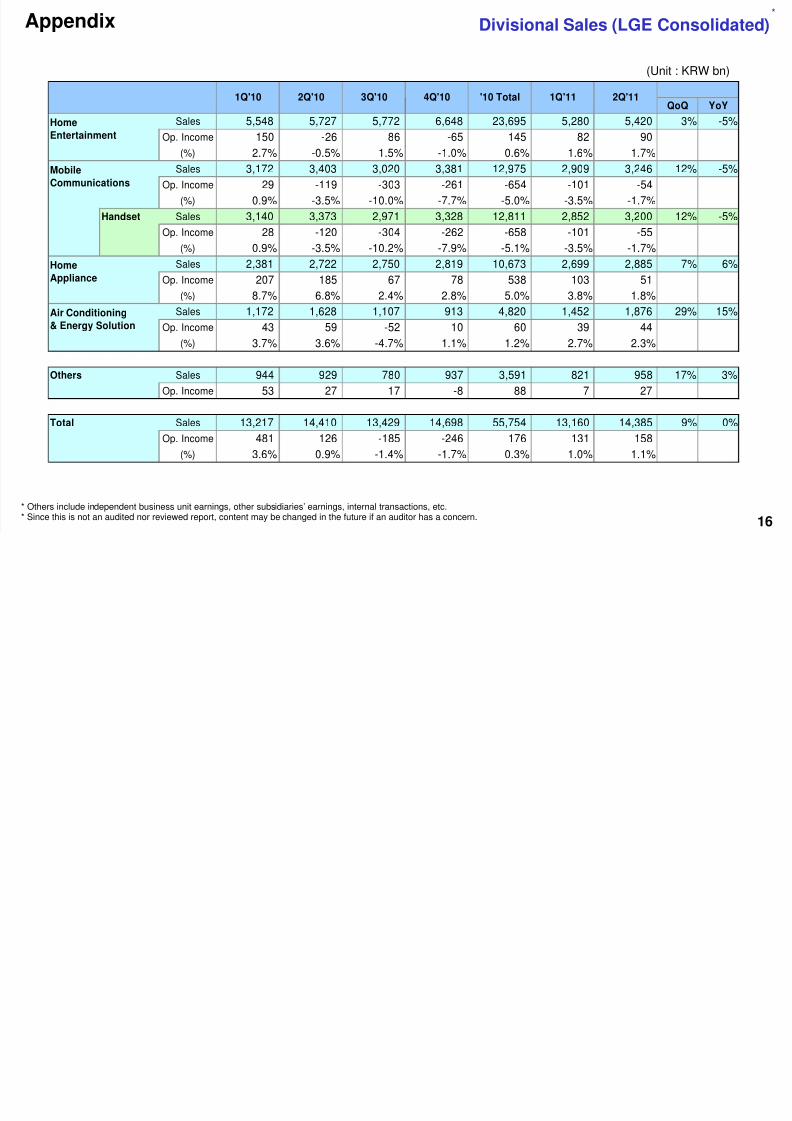
Divisional Sales (LGE Consolidated)Appendix
(Unit : KRW bn)
QoQ YoY
Sales 5,548 5,727 5,772 6,648 23,695 5,280 5,420 3% -5%
Op. Income 150 -26 86 -65 145 82 90
(%) 2.7% -0.5% 1.5% -1.0% 0.6% 1.6% 1.7%
Sales 3,172 3,403 3,020 3,381 12,975 2,909 3,246 12% -5%
Op. Income 29 -119 -303 -261 -654 -101 -54
(%) 0.9% -3.5% -10.0% -7.7% -5.0% -3.5% -1.7%
Handset Sales 3,140 3,373 2,971 3,328 12,811 2,852 3,200 12% -5%
Op. Income 28 -120 -304 -262 -658 -101 -55
(%) 0.9% -3.5% -10.2% -7.9% -5.1% -3.5% -1.7%
Sales 2,381 2,722 2,750 2,819 10,673 2,699 2,885 7% 6%
Op. Income207 185 67 78 538 103 51
(%) 8.7% 6.8% 2.4% 2.8% 5.0% 3.8% 1.8%
Sales 1,172 1,628 1,107 913 4,820 1,452 1,876 29% 15%
Op. Income 43 59 -52 10 60 39 44
(%) 3.7% 3.6% -4.7% 1.1% 1.2% 2.7% 2.3%
Others Sales 944 929 780 937 3,591 821 958 17% 3%Op. Income 53 27 17 -8 88 7 27
Total Sales 13,217 14,410 13,429 14,698 55,754 13,160 14,385 9% 0%
Op. Income 481 126 -185 -246 176 131 158
(%) 3.6% 0.9% -1.4% -1.7% 0.3% 1.0% 1.1%
2Q'11'10 Total 1Q'114Q'101Q'10 2Q'10 3Q'10
Home
Appliance
Air Conditioning
& Energy Solution
Home
Entertainment
Mobile
Communications
* Since this is not an audited nor reviewed report, content may be changed in the future if an auditor has a concern.* Others include independent business unit earnings, other subsidiaries’ earnings, internal transactions, etc.
16