LFG Energy Project Development Handbook, Chapter 4 ...• Payback period • Net present value (NPV)...
19
Evaluating the economic feasibility of an LFG energy project is an essential step and should be completed before preparing a system design, entering into contracts or purchasing materials and equipment. The process for evaluating project alternatives and financing options is discussed in this chapter, highlighting: • Typical capital and O&M costs and influential factors • Potential revenue streams, financial incentives and funding opportunities • Preliminary financial evaluations • Project financing options - - LMOP provides LFGcost Web as a tool for conducting initial economic feasibility analyses for 12 types of LFG energy projects. The tool provides economic analyses and environmental and job creation benefits based on user inputs. Analyses performed using LFGcost Web are considered estimates and should be used for guidance only. The evaluation process begins with a preliminary economic feasibility assessment. 1 If the preliminary assessment shows that a project may be well-suited to the landfill, then a detailed economic assessment should be performed. The detailed economic assessment, which usually requires assistance from a qualified LFG professional engineering consultant or project developer, is tailored to the landfill and considers potential project options. Both the preliminary and detailed economic feasibility assessments follow the same steps, but they are based on different cost estimates. Preliminary economic feasibility studies are based on typical costs. Detailed feasibility studies apply project-specific costs and estimates, such as cost quotes for a specific model of equipment appropriate to the landfill, right-of-way costs for anticipated pipeline routes and current land owners, state-specific permitting requirements, specific financing methods and interest rates. In both cases, the outputs of the economic assessment include costs and measures of financial performance required to make investment decisions, including: • Total installed capital costs • Payback period • Annual costs in first year of operation • Net present value (NPV) • Internal rate of return (IRR) This chapter is relevant for both preliminary and detailed economic feasibility assessments. The cost summaries and example energy cost estimates that are presented in this chapter were calculated using LFGcost-Web, Version 3.2. For additional information and to download the model and user manual, see the LMOP website. Analyses performed using LFGcost-Web are considered estimates and should be used for guidance only. Project Economics and Financing 4-1 1
Transcript of LFG Energy Project Development Handbook, Chapter 4 ...• Payback period • Net present value (NPV)...

Evaluating the economic feasibility of an LFG energy project is an essential step and should be completed before preparing a system design, entering into contracts or purchasing materials and equipment. The process for evaluating project alternatives and financing options is discussed in this chapter, highlighting:
• Typical capital and O&M costs and influential factors • Potential revenue streams, financial incentives and funding
opportunities • Preliminary financial evaluations • Project financing options
-
-
LMOP provides LFGcost Web as a tool for conducting initial economic feasibility analyses for 12 types of LFG energy projects. The tool provides economic analyses and environmental and job creation benefits based on user inputs. Analyses performed using LFGcost Web are considered estimates and should be used for guidance only.
The evaluation process begins with a preliminary economic feasibility assessment.1 If the preliminary assessment shows that a project may be well-suited to the landfill, then a detailed economic assessment should be performed. The detailed economic assessment, which usually requires assistance from a qualified LFG professional engineering consultant or project developer, is tailored to the landfill and considers potential project options.
Both the preliminary and detailed economic feasibility assessments follow the same steps, but they are based on different cost estimates. Preliminary economic feasibility studies are based on typical costs. Detailed feasibility studies apply project-specific costs and estimates, such as cost quotes for a specific model of equipment appropriate to the landfill, right-of-way costs for anticipated pipeline routes and current land owners, state-specific permitting requirements, specific financing methods and interest rates. In both cases, the outputs of the economic assessment include costs and measures of financial performance required to make investment decisions, including:
• Total installed capital costs • Payback period • Annual costs in first year of operation • Net present value (NPV) • Internal rate of return (IRR)
This chapter is relevant for both preliminary and detailed economic feasibility assessments.
The cost summaries and example energy cost estimates that are presented in this chapter were calculated using LFGcost-Web, Version 3.2. For additional information and to download the model and user manual, see the LMOP website. Analyses performed using LFGcost-Web are considered estimates and should be used for guidance only.
Project Economics and Financing 4-1
1

LFG Energy Project Development Handbook
Figure 4-1 illustrates the economic assessment process, which typically involves five steps. The following sections describe the steps and provide helpful links, examples and resources to aid in the evaluation process.
Figure 4-1. The Economic Evaluation Process
Identify Project Design Options
Is the design economically
viable?
Consider changes to the project design to
improve economics
Repeat steps 1-3 for each project design option
Quantify the Expenses for the Project Design • Capital costs • O&M costs
1
Estimate the Revenues for the Project Design • Energy sales • Incentives • Other funding opportunities and revenue streams
2
Assess the Economic Feasibility of the Project Design • Total installed capital costs • Annual costs in first year of operation • Internal rate of return (IRR) • Payback period • Net present value (NPV)
3
Select the Best Project Design from the Economically Viable Options 4
Assess Project Financing Options for the Selected Design 5
Yes
No
4.1 Step 1: Quantify Capital and O&M Costs Generally, the costs for LFG energy projects involve the purchase and installation of equipment (capital costs) and O&M costs. Cost elements common to various types of LFG energy projects are listed below.
Table 4-1. Capital and O&M Cost Elements
Capital Costs Elements O&M Cost Elements Design and engineering Permits and fees Site preparation and installation of utilities Equipment, equipment housing and installation Startup costs and working capital Administration
Parts and materials Labor Utilities Financing costs Taxes Administration
The following sections describe specific factors that may influence the costs of gas collection and flaring, and electricity generation, direct use or other project options. Costs identified below were estimated using
4-2 Project Economics and Financing

LFG Energy Project Development Handbook
LFGcost-Web, Version 3.2. Analyses performed using LFGcost-Web are considered estimates and should be used for guidance only.
Gas Collection System and Flaring Costs
All LFG energy project designs include a gas collection and flare system to collect the LFG for use in electricity-generating equipment or direct-use devices. The flare system also provides a means of combusting the gas when the project is not being operated. A mid-sized LFG collection and flare system for a 40-acre wellfield designed to collect 600 cfm is approximately $1,143,000, or $28,600 per acre for installed capital costs (2013 dollars), with average annual O&M costs of around $191,000 or $4,800 per acre.2 These costs can vary depending on several design variables of the gas collect ion system. Table 4-2 lists the components and key factors that influence the costs of the gas collection and flare system.
Table 4-2. Gas Collection and Flare System Components and Cost Factors
Component / Attribute Key Site-Specific Factors Gas collection wells or connectors Area and depth of waste
Spacing of wells or connectors
Gas piping Gas flow volume Length of piping required
Condensation knockout drum Volume of drum required
Blower Size of blower required
Flare Type of flare (open, ground or elevated) Size of flare
Instrumentation and control system Types of controls required
The collection system and flaring costs should be included as project costs only if these systems do not currently exist at the landfill. If a gas collection and flare system is already in operation, it represents a “sunk” cost and the project costs should include only the costs necessary to modify the system for the LFG energy project design.
It is important to decide early on whether to collect gas from the entire landfill or just the most productive area. Note that this decision may be dictated in some cases by regulatory requirements to collect gas. It is often most cost-effective to install a relatively small collection system first and then expand the system as additional areas of the landfill begin to produce significant quantities of gas. This approach has the added benefit of creating multiple systems that run in parallel, thereby allowing the project to continue operating at reduced capacity when a piece of equipment (such as a blower) is temporarily out of service. However, such an approach might limit economies of scale.
Electricity Project Costs
The most common technology options available for developing an electricity project are internal combustion engines, gas turbines, microturbines and small engines. Each of these technologies is generally better suited to certain project size ranges. Small internal combustion engines and microturbines are generally best suited for small or unique power needs. Standard internal combustion engines are well-suited for small- to mid-size projects, whereas gas turbines are best suited for larger projects. If there is a
U.S. EPA LMOP. LFGcost-Web, Version 3.2.
Project Economics and Financing 4-3
2

LFG Energy Project Development Handbook
use for the waste heat produced from the combustion of the LFG in the electricity-generating equipment, then a CHP project may be a preferable option.
Table 4-3 lists some typical costs and applicable LFG energy project sizes for the most common electricity generation technologies. The costs include electricity generation equipment and typical compression and treatment systems appropriate to the particular technology and interconnection equipment.
Internal combustion engines cannot operate with LFG volumes that are much lower than the designed target. When the volume is too small, efficiency rates decrease significantly. As a result, oversizing equipment of this type should be avoided.
Table 4-3. LFG Electricity Project Technologies — Estimated Cost Summary3
Technology Optimal Project SizeRange
Typical CapitalCosts ($/kW)*
Typical Annual O&MCosts ($/kW)*
Microturbine 1 MW or less $3,000 $280
Small internal combustion engine 799 kW or less $2,500 $270
Large internal combustion engine 800 kW or greater $1,800 $250
Gas turbine 3 MW or greater $1,500 $160 $/kW: dollars per kilowatt kW: kilowatt MW: megawatt *2013 dollars for typical project sizes
Engine size is a key factor to consider because LFG flow rate changes over the life of the project. It is important to decide whether to choose equipment for minimum flow, maximum flow or average flow rates. Because of the high capital cost of electricity generating equipment, it is often advantageous to size the project at (or near) the minimum gas flow expected during the 15-year project life. However, smaller capacity engines may not be able to maximize the opportunity to generate electricity and receive revenues in years when gas is most plentiful. System components and key factors that influence the feasibility of an electricity project are presented in Table 4-4.
Table 4-4. Electricity Generation System Components and Cost Factors
Component / Attribute Key Site-Specific Factors Engine size Flow rate (gas curve)
Electricity rate structures Minimum electricity generation requirements (contract obligations)
Capacity to expand Maximum flow rate Gas flow volume over time (gas curve)
Gas compression and treatment equipment
Quality of the LFG (methane content) Contaminants (for example, siloxane, hydrogen sulfide)
Interconnection equipment Project size Local utility requirements and policies
U.S. EPA LMOP. LFGcost-Web, Version 3.2.
4-4 Project Economics and Financing
3
LFG Energy Project Development Handbook
For more information on interconnection, see the EPA CHP Partnership’s Policies and incentives database (dCHPP) (select ‘Interconnection Standard’ in the “Search by Policy/Incentive Type” box) and the American Council for an Energy-Efficient Economy’s Interconnection Standards webpage.
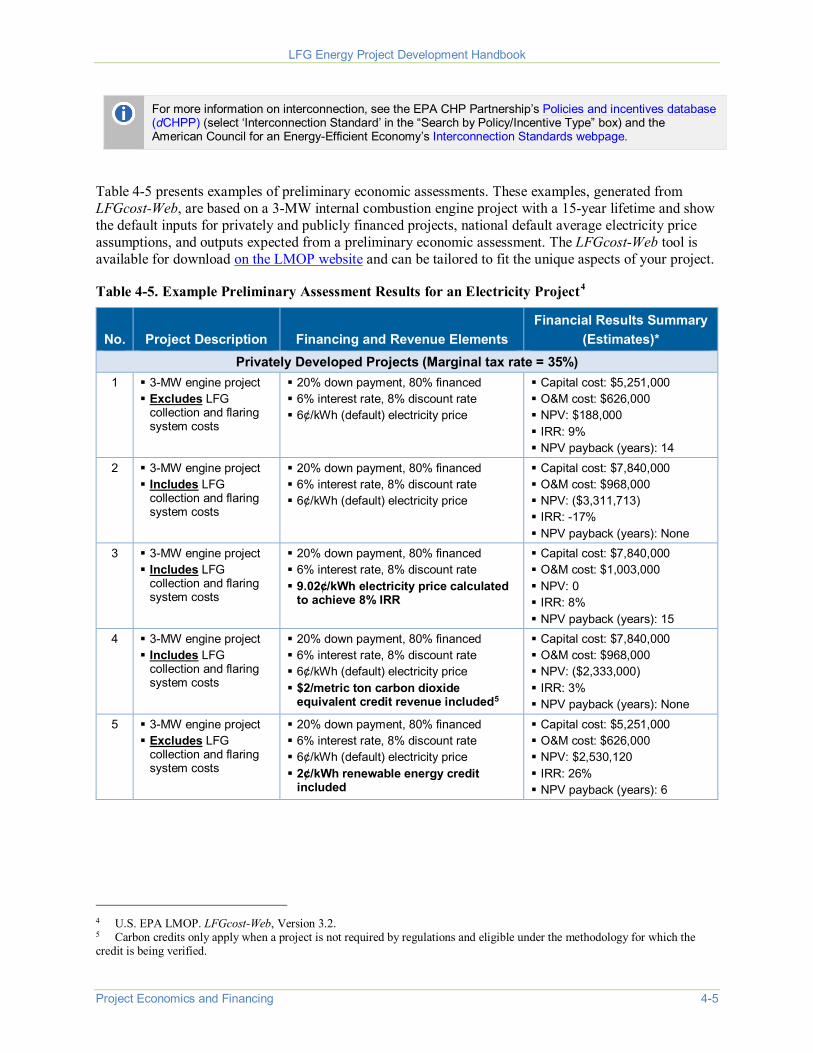
Table 4-5 presents examples of preliminary economic assessments. These examples, generated from LFGcost-Web, are based on a 3-MW internal combustion engine project with a 15-year lifetime and show the default inputs for privately and publicly financed projects, national default average electricity price assumptions, and outputs expected from a preliminary economic assessment. The LFGcost-Web tool is available for download on the LMOP website and can be tailored to fit the unique aspects of your project.
Table 4-5. Example Preliminary Assessment Results for an Electricity Project4
No. Project Description Financing and Revenue Elements Financial Results Summary
(Estimates)* Privately Developed Projects (Marginal tax rate = 35%)
1 3-MW engine project Excludes LFG
collection and flaring system costs
20% down payment, 80% financed 6% interest rate, 8% discount rate 6¢/kWh (default) electricity price
Capital cost: $5,251,000 O&M cost: $626,000 NPV: $188,000 IRR: 9% NPV payback (years): 14
2 3-MW engine project Includes LFG
collection and flaring system costs
20% down payment, 80% financed 6% interest rate, 8% discount rate 6¢/kWh (default) electricity price
Capital cost: $7,840,000 O&M cost: $968,000 NPV: ($3,311,713) IRR: -17% NPV payback (years): None
3 3-MW engine project Includes LFG
collection and flaring system costs
20% down payment, 80% financed 6% interest rate, 8% discount rate 9.02¢/kWh electricity price calculated
to achieve 8% IRR
Capital cost: $7,840,000 O&M cost: $1,003,000 NPV: 0 IRR: 8% NPV payback (years): 15
4 3-MW engine project Includes LFG
collection and flaring system costs
20% down payment, 80% financed 6% interest rate, 8% discount rate 6¢/kWh (default) electricity price $2/metric ton carbon dioxide
equivalent credit revenue included5
Capital cost: $7,840,000 O&M cost: $968,000 NPV: ($2,333,000) IRR: 3% NPV payback (years): None
5 3-MW engine project Excludes LFG
collection and flaring system costs
20% down payment, 80% financed 6% interest rate, 8% discount rate 6¢/kWh (default) electricity price 2¢/kWh renewable energy credit
included
Capital cost: $5,251,000 O&M cost: $626,000 NPV: $2,530,120 IRR: 26% NPV payback (years): 6
4 U.S. EPA LMOP. LFGcost-Web, Version 3.2. 5 Carbon credits only apply when a project is not required by regulations and eligible under the methodology for which the credit is being verified.
Project Economics and Financing 4-5

LFG Energy Project Development Handbook
No. Project Description Financing and Revenue Elements Financial Results Summary
(Estimates)* Municipality Developed Projects (Marginal tax rate = 0%)
6 3-MW engine project Excludes LFG
collection and flaring system costs
100% down payment using municipal budget 5% discount rate 6.0¢/kWh (default) electricity price
Capital cost: $5,251,000 O&M cost: $626,000 NPV: $3,096,000 IRR: 22% NPV payback (years): 7
7 3-MW engine project Excludes LFG
collection and flaring system costs
20% down payment, 80% bond-financed 5% interest rate, 5% discount rate 6.0¢/kWh (default) electricity price
Capital cost: $5,251,000 O&M cost: $626,000 NPV: $1,901,000 IRR: 15% NPV payback (years): 10
8 3-MW engine project Includes LFG
collection and flaring system costs
100% down payment using municipal budget 5% discount rate 6.0¢/kWh (default) electricity price
Capital cost: $7,840,000 O&M cost: $968,000 NPV: ($4,242,000) IRR: -6% NPV payback (years): None
9 3-MW engine project Includes LFG
collection and flaring system costs
20% down payment, 80% bond-financed 5% interest rate, 5% discount rate 6.0¢/kWh (default) electricity price
Capital cost: $7,840,000 O&M cost: $968,000 NPV: ($4,541,000) IRR: -16% NPV payback (years): None
10 3-MW engine project Includes LFG
collection and flaring system costs
20% down payment, 80% bond-financed 5% interest rate, 5% discount rate 8¢/kWh electricity price calculated to
achieve 5% IRR
Capital cost: $7,840,000 O&M cost: $992,000 NPV: $0 IRR: 5% NPV payback (years): 15
IRR: internal rate of return kWh: kilowatt-hour MW: megawatt NPV: net present value O&M: operation and maintenance *2013 dollars for capital costs and NPV in year of construction and 2014 dollars for O&M costs in initial year of engine operation
Medium-Btu Direct-Use Project Costs A medium-Btu direct-use project may be a viable option if an end user is located within a reasonable distance of the landfill. Examples of medium-Btu direct-use projects include industrial boilers, process heaters, kilns or furnaces; or space heating for commercial, industrial or institutional facilities or for greenhouses. Table 4-6 lists typical cost ranges for the components of a medium-Btu direct-use project. The costs for the gas compression and treatment system include compression, moisture removal and filtration equipment typically required to prepare the gas for transport through the pipeline and for use in a boiler or process heater. The gas pipeline costs also assume typical construction conditions and pipeline design. The LFGcost-Web tool is available for download on the LMOP website and can be tailored to fit the unique aspects of your project.
4-6 Project Economics and Financing

LFG Energy Project Development Handbook
Table 4-6. LFG Medium-Btu Direct-Use Project Components — Estimated Cost Summary6
Component Typical Capital Costs* Typical Annual O&M Costs* Gas compression and treatment $640 to $1,200/scfm $120 to $160/scfm
Gas pipeline and condensate management system $600,400 to $767,000/mile Negligible
scfm: standard cubic feet per minute *2013 dollars, ranges compare a 1,000-scfm to 3,000-scfm system. Economies of scale are achieved for gas compression and treatment at larger flow rates; however, the pipeline costs for larger flow rates increase as a result of larger diameter pipe.
Costs for medium-Btu direct-use projects vary depending on the end user’s requirements and the size of the pipelines. For example, costs will be higher if more extensive treatment is required to remove other impurities. Pipelines can range from less than a mile to more than 20 miles long, and length will have a major effect on costs. In addition, the costs of medium-Btu direct-use pipelines are often affected by obstacles along the route, such as highway, railroad or water crossings. The size of the pipeline also can affect project costs. It is often most cost-effective for projects with increasing gas flow over time to size the pipe at or near the full gas flow expected during the life of the project and to add compression and treatment equipment as gas flow increases. Table 4-7 highlights the medium-Btu direct-use system components and key factors that influence the feasibility of a project.
Table 4-7. Medium-Btu Direct-Use Project Components and Cost Factors
Component / Attribute Key Site-Specific Factors End use of the LFG Type of equipment (for example, boiler, process heater, kiln furnace)
Gas flow over time Requirements to modify existing equipment to use LFG
Gas compression and treatment equipment
Quality of the LFG (methane content) Contaminants and moisture removal requirements Filtration requirements
Gas pipeline Length (distance to the end use) Obstacles along the pipeline route Gas flow volume and pipe diameter
Condensate management system
Length of the gas pipeline
End users will likely need to modify their equipment to make it suitable for combusting LFG, but these costs are usually borne by the end user and are site-specific to the combustion device. Landfill owners or LFG energy project developers may need to inform the end users that they are responsible for paying for these modifications, noting that modification costs are normally minimal and that the savings typically achieved by using LFG will make up for equipment modification expenses.
LMOP developed the fact sheet Adapting Boilers to Utilize Landfill Gas: An Environmentally and Economically Beneficial Opportunity to help potential end users understand the types of modifications that may be needed to use LFG. The fact sheet also provides several examples of where LFG has been used in boiler fuel applications.
U.S. EPA LMOP. LFGcost-Web, Version 3.2.
Project Economics and Financing 4-7
6

LFG Energy Project Development Handbook
Example preliminary economic assessments for a typical medium-Btu direct-use project (in this case, 1,000 scfm LFG) with a 5-mile pipeline and a 15-year lifetime are presented in Table 4-8. These examples provide ideas about typical inputs, assumptions and outputs expected from a preliminary economic assessment.
Table 4-8. Example Preliminary Assessment Results for Medium-Btu Direct-Use Projects7
No. Project Description Financing and Revenue
Elements Financial Results Summary*
(Estimates) Privately Developed Projects (Marginal tax rate = 35%)
1 Direct-use project with 5-mile pipeline (includes condensate management) Excludes LFG collection and
flaring system costs
20% down payment, 80% financed 6% interest rate, 8% discount rate $2.25/MMBtu LFG price
Capital cost: $3,480,000 O&M cost: $144,000 NPV: $1,237,000 IRR: 17% NPV payback (years): 11
2 Direct-use project with 5-mile pipeline (includes condensate management) Includes LFG collection and
flaring system costs
20% down payment, 80% financed 6% interest rate, 8% discount rate $2.25/MMBtu LFG price
Capital cost: $6,048,000 O&M cost: $507,000 NPV: ($3,430,000) IRR: -6% NPV payback (years): None
Municipality-Developed Projects (Marginal tax rate = 0%) 3 Direct-use project with 5-mile
pipeline (includes condensate management) Excludes LFG collection and
flaring system costs
20% down payment, 80% bond-financed 5% interest rate, 5% discount rate $2.25/MMBtu LFG price
Capital cost: $3,480,000 O&M cost: $144,000 NPV: $3,7212,000 IRR: 23% NPV payback (years): 8
4 Direct-use project with 5-mile pipeline (includes condensate management) Includes LFG collection and
flaring system costs
20% down payment, 80% bond-financed 5% interest rate, 5% discount rate $2.25/MMBtu LFG price
Capital cost: $6,048,000 O&M cost: $507,000 NPV: ($2,906,000) IRR: -4% NPV payback (years): None
IRR: internal rate of return NPV = net present value MMBtu = million British thermal units O&M = operation and maintenance *2013 dollars for capital costs and NPV in year of construction and 2014 dollars for O&M costs in initial year of project operation
Upgraded High-Btu LFG
• Vehicle Fuel Applications involve the production of compressed natural gas (CNG), liquefied natural gas (LNG) or methanol. This process involves removing carbon dioxide and trace impurities from LFG to produce a high-grade fuel that is approximately 95 percent methane or greater. CNG and LNG vehicles make up a very small portion of motor vehicles in the United States, so there is not a large demand for these vehicle fuels at present. However, as interest in alternative fuels continues to grow, demand is expected to increase. Furthermore, landfill owners and operators can achieve cost savings if these fuels can be used for the landfill’s truck fleets. Costs associated with this option include converting the vehicles to use the alternate fuel and installing a fueling station. There are smaller scale onsite CNG conversion systems, and those costs are summarized in Table 4-9. The
U.S. EPA LMOP. LFGcost-Web, Version 3.2.
4-8 Project Economics and Financing
7

LFG Energy Project Development Handbook
LFGcost-Web tool is available for download on the LMOP website and can be tailored to fit the unique aspects of your project.
• Upgrading to High-Btu Gas Technologies can be used to separate the methane and carbon dioxide components of LFG to provide methane for sale to natural gas suppliers or for use in applications requiring a high-Btu fuel. These projects are ideally suited for large landfills located near natural gas pipelines. Some larger scale high-Btu projects eventually convert the gas into vehicle fuel applications after the gas has been transported across a pipeline network. Table 4-10 summarizes the costs of larger scale high-Btu projects. The LFGcost-Web tool is available for download on the LMOP website and can be tailored to fit the unique aspects of your project.
Table 4-9. Estimated Costs of Onsite Small-scale CNG Fueling Station8
Inlet LFG (scfm) Plant Size (GGE/day) Cost ($/GGE)* 50 198 $2.82
150 594 $2.16
300 1,188 $1.87
600 2,377 $1.64 scfm: standard cubic feet per minute *2013 dollars. Excludes the costs of converting the vehicle fleet.
Table 4-10. High-Btu LFG Project Components — Estimated Cost Summary9
Component Typical Capital Costs* Typical Annual O&M Costs* Gas compression and treatment $2,600 to $6,000/scfm $500/scfm
Gas pipeline $364,300/mile Negligible scfm: standard cubic feet per minute *2013 dollars, O&M costs in first year of operation. Ranges compare a 1,000-scfm to 10,000-scfm system. Economies of scale are achieved for gas compression and treatment at larger flow rates.
Other Project Options
Other LFG energy project options include CHP and leachate evaporation. These technologies are not as universally applicable as the more traditional electricity and direct-use (medium-Btu) and upgraded (high-Btu) LFG energy projects, but they can be very cost-effective options for some landfills. The LFGcost-Web tool is available for download on the LMOP website and can be tailored to fit the unique aspects of your CHP or leachate evaporator project.
• CHP involves capture and use of the waste heat produced by electricity generation. These projects are gaining momentum, as they provide maximum thermal efficiency from the LFG collected. Since the steam or hot water produced by a CHP project is not economically transported long distances, CHP is a better option for end users located near the landfill, or for projects where the LFG is transported to the end user’s site and both the electricity and the waste heat are generated at the site. The electricity produced by the end user can be used on site or sold to the grid.
8 U.S. EPA LMOP. LFGcost-Web, Version 3.2. 9 U.S. EPA LMOP. LFGcost-Web, Version 3.2.
Project Economics and Financing 4-9
LFG Energy Project Development Handbook
• Leachate Evaporators combust LFG to evaporate most of the moisture from landfill leachate, thus greatly reducing the leachate volume and subsequent disposal cost. These projects are cost-effective in situations where leachate disposal in a wastewater treatment plant is unavailable or very expensive.
For more information on CHP, see EPA’s CHP Partnership website.
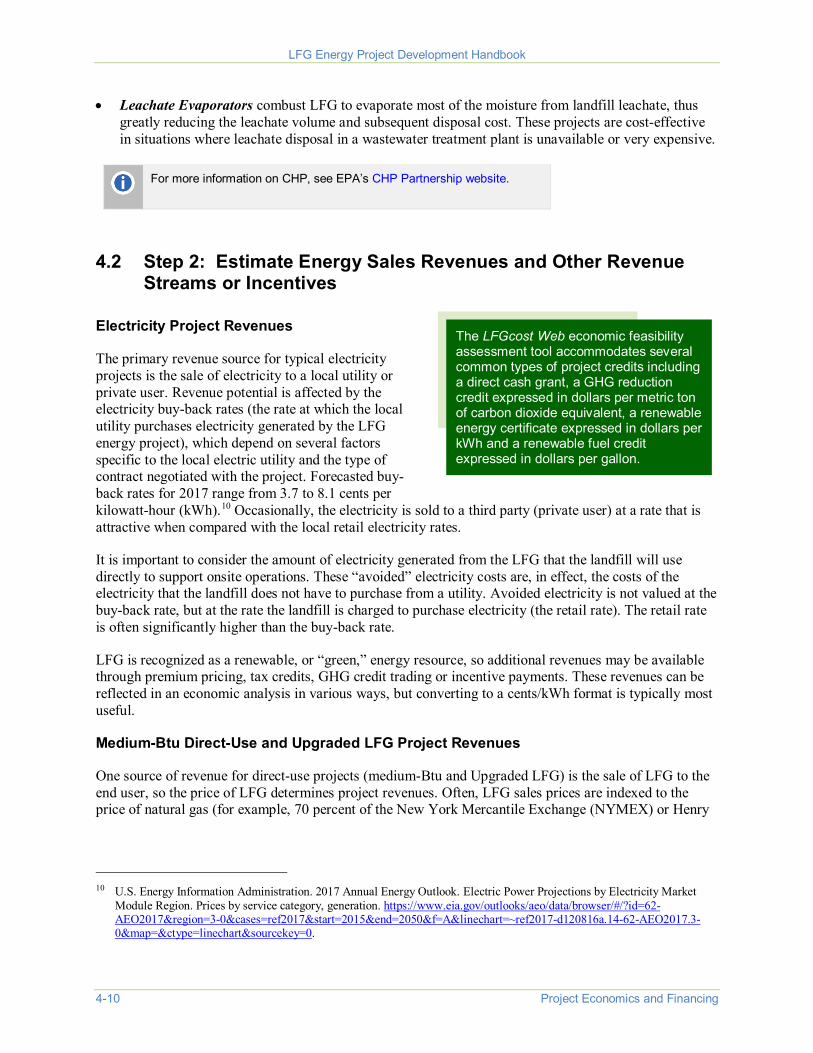
4.2 Step 2: Estimate Energy Sales Revenues and Other Revenue Streams or Incentives
Electricity Project Revenues
The primary revenue source for typical electricity projects is the sale of electricity to a local utility or private user. Revenue potential is affected by the electricity buy-back rates (the rate at which the local utility purchases electricity generated by the LFG energy project), which depend on several factors specific to the local electric utility and the type of contract negotiated with the project. Forecasted buy-back rates for 2017 range from 3.7 to 8.1 cents per kilowatt-hour (kWh).10 Occasionally, the electricity is sold to a third party (private user) at a rate that is attractive when compared with the local retail electricity rates.
It is important to consider the amount of electricity generated from the LFG that the landfill will use directly to support onsite operations. These “avoided” electricity costs are, in effect, the costs of the electricity that the landfill does not have to purchase from a utility. Avoided electricity is not valued at the buy-back rate, but at the rate the landfill is charged to purchase electricity (the retail rate). The retail rate is often significantly higher than the buy-back rate.
LFG is recognized as a renewable, or “green,” energy resource, so additional revenues may be available through premium pricing, tax credits, GHG credit trading or incentive payments. These revenues can be reflected in an economic analysis in various ways, but converting to a cents/kWh format is typically most useful.
Medium-Btu Direct-Use and Upgraded LFG Project Revenues
One source of revenue for direct-use projects (medium-Btu and Upgraded LFG) is the sale of LFG to the end user, so the price of LFG determines project revenues. Often, LFG sales prices are indexed to the price of natural gas (for example, 70 percent of the New York Mercantile Exchange (NYMEX) or Henry
-The LFGcost Web economic feasibility assessment tool accommodates several common types of project credits including a direct cash grant, a GHG reduction credit expressed in dollars per metric ton of carbon dioxide equivalent, a renewable energy certificate expressed in dollars per kWh and a renewable fuel credit expressed in dollars per gallon.
10 U.S. Energy Information Administration. 2017 Annual Energy Outlook. Electric Power Projections by Electricity Market Module Region. Prices by service category, generation. https://www.eia.gov/outlooks/aeo/data/browser/#/?id=62-AEO2017®ion=3-0&cases=ref2017&start=2015&end=2050&f=A&linechart=~ref2017-d120816a.14-62-AEO2017.3-0&map=&ctype=linechart&sourcekey=0.
Project Economics and Financing 4-10

LFG Energy Project Development Handbook
Hub natural gas price indices for medium-Btu projects), but prices will vary depending on site-specific negotiations, the type of contract and other factors.
The Henry Hub, the largest centralized point for natural gas spot and futures trading in the United States, interconnects nine interstate and four intrastate pipelines. The Henry Hub is owned and operated by Sabine Pipe Line, LLC, a subsidiary of EnLink Midstream Partners LP. The Sabine Pipe Line starts near Port Arthur, Texas, and ends in Vermillion Parish, Louisiana, at the Henry Hub near the town of Erath.
NYMEX, the world’s largest physical commodity futures exchange, uses the Henry Hub as the point of delivery for its natural gas futures contract. The NYMEX gas futures contract began trading on April 3, 1990, and is currently traded 72 months into the future. NYMEX deliveries at the Henry Hub are treated in the same way as cash-market transactions.
The current natural gas price is depressed as a result of abundant domestic supply and efficient methods of production. In 2017, the Henry Hub spot price is $3 per MMBtu. Modest increases in natural gas prices are expected as electric power consumption of natural gas increases.11
Incentives
Federal and state tax incentives, loans and grants are available that may provide additional revenue for LFG energy projects. Below is a brief summary of those incentives; LMOP’s Resources for Funding LFG Energy Projects page presents updated information on available incentives and how to qualify for them.
• Renewable Portfolio Standard (RPS) or Portfolio Goal (RPG): Premium pricing is often available for renewable electricity (including LFG) that is included in a green power program, through an RPS, a RPG or a voluntary utility green pricing program. LMOP’s Resources for Funding LFG Energy Projects page provides more details about state RPS and RPG resources that apply to LFG energy projects.
• Renewable Electricity Certificates (RECs): RECs are sold through voluntary markets to consumers seeking to reduce their environmental footprint. They are typically offered in 1 MWh units, and are sold by LFG electricity generators to industries, commercial businesses, institutions and private citizens who wish to achieve a corporate renewable energy portfolio goal or to encourage renewable energy. If the electricity produced by an LFG energy project is not being sold as part of a utility green power program or green pricing program, the project owner may be able to sell RECs through voluntary markets to generate additional revenue. EPA’s Green Power Partnership provides a state-by-state directory of green power providers in the Green Power locator.
• Tax Advantages: Tax credits, tax exemptions and other tax incentives, as well as federal and state grants, low-cost bonds and loan programs, may provide funding resources for an LFG energy project. For example, Section 45 of the Internal Revenue Code provides a 1.2 cent per kWh production tax credit for electricity generated at privately owned LFG electricity projects that commenced construction by December 31, 2016. More details about these incentives can be found in LMOP’s Resources for Funding LFG Energy Projects page.
• State and Regional Incentives: Many state and regional government entities are establishing their own GHG and renewable energy initiatives. For comprehensive and up-to-date information about
11 U.S. Energy Information Administration. 2017 Annual Energy Outlook. Natural Gas Supply, Disposition, and Prices. https://www.eia.gov/outlooks/aeo/data/browser/#/?id=13-AEO2017&cases=ref2017&sourcekey=0.
Project Economics and Financing 4-11

LFG Energy Project Development Handbook
state and regional incentives and policies for renewable energy resources, including LFG, visit the Database of State Incentives for Renewables & Efficiency (DSIRE) website.
• Renewable Fuel Standard (RFS): LFG is considered a qualified pathway under the RFS program. Administered by EPA, the program requires obligated parties (including refiners or importers of gasoline or diesel fuel) to meet a Renewable Volume Obligation (RVO) based on the amount of petroleum-based fuels they produce or import annually. In July 2014, EPA modified the existing pathway to specify that CNG or LNG is the fuel and the biogas is the feedstock. Further, EPA allowed fuels derived from landfill biogas to qualify as a cellulosic biofuel (D3), rather than only an advanced biofuel (D5). EPA also added a new renewable electricity pathway for electricity used in electric vehicles. Annually, EPA sets the renewable volume requirements, which may offer a growing market for LFG.
For LFG (biogas), 77,000 Btu is equal to 1 gallon equivalent or 1 RIN.
• California Low Carbon Fuel Standard (LCFS): The LCFS is administered by the California Air Resources Board and is a market-based mechanism to encourage cleaner low-carbon fuels in California vehicles. The LCFS accounts for the life cycle greenhouse gas emissions of fuel, and any fuel with a certified fuel pathway with a lower carbon intensity for the standard such as biogas-based CNG derived from landfill or digester gas can generate and sell credits. The goal of the LCFS is to achieve a 10 percent carbon intensity reduction between 2010 and 2020 for the transportation fuel sold in the state.
• Nitrogen Oxides Cap-and-Trade: Some LFG energy projects may qualify for participation in nitrogen oxides cap-and-trade programs. The revenues for these incentives vary by state and will depend on factors such as the allowances allocated to each project, the price of allowances on the market, and the end use of the LFG. CHP projects typically receive more revenue based on credit for avoided use as boiler fuel. See the EPA document Environmental Revenue Streams for Combined Heat and Power for additional information.
• Voluntary GHG Credits: Bilateral trading and GHG credit sales are other voluntary sources of revenue. Bilateral trades are project-specific and are negotiated directly between a buyer and seller of GHG credits. In these cases, corporate entities or public institutions, such as universities, may wish to reduce their “carbon footprint” or meet internal sustainability goals, but do not have a means to develop their own project. Therefore, a buyer may help finance a specific project in exchange for the credit of offsetting GHG emissions from their organization. These projects may be simple transactions between a single buyer and seller (for example, the project developer), or may involve brokers that “aggregate” credits from several small projects for sale to large buyers. Bilateral trading programs often involve certification and quantification of GHG reductions to ensure the validity of the trade and, as a result, there can be rigorous monitoring and recordkeeping requirements. The additional revenue is likely to justify these additional efforts.
Exam
ple Golden Triangle Regional Solid Waste Management Authority Power Generation Project,
Mississippi. Golden Triangle staff spent several years evaluating LFG energy project possibilities and seeking solutions to overcome challenges associated with the site’s remote location, lack of nearby potential end users and projected high installation costs. In 2010, Golden Triangle arranged an agreement with the Tennessee Valley Authority’s Generation Partners program to secure premium green power prices for the LFG energy. Within 1 year, the project became the first LFG electricity project in Mississippi, generating just under 1 MW of renewable energy.
Project Economics and Financing 4-12
LFG Energy Project Development Handbook
4.3 Step 3: Assess Economic Feasibility Once the costs and revenues for a project have been determined, and the project is considered technically viable, an economic feasibility analysis should be performed. Project developers can use LFGcost-Web to evaluate the preliminary economic feasibility. Analyses performed using LFGcost-Web are considered estimates and should be used for guidance only. When a more detailed analysis is undertaken, however, many LFG energy consulting companies and LFG energy project developers rely on their own financial pro forma programs, which may enable a more detailed analysis for a specific project.
To perform the analysis, calculate and compare the expenses and revenue on a year-by-year basis for the life of the project. The following elements should be included, most of which can be obtained from LFGcost-Web (or a more detailed site-specific cost analysis) and an analysis of the revenue streams:
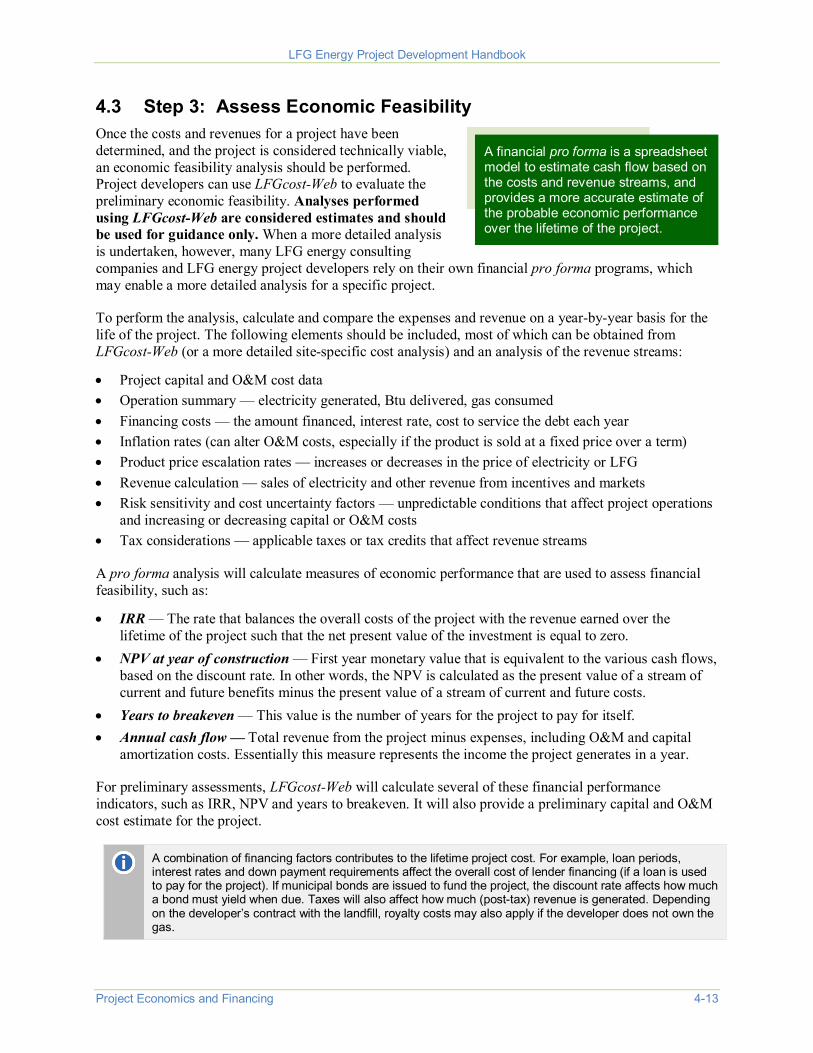
A financial pro forma is a spreadsheet model to estimate cash flow based on the costs and revenue streams, and provides a more accurate estimate of the probable economic performance over the lifetime of the project.
• Project capital and O&M cost data • Operation summary — electricity generated, Btu delivered, gas consumed • Financing costs — the amount financed, interest rate, cost to service the debt each year • Inflation rates (can alter O&M costs, especially if the product is sold at a fixed price over a term) • Product price escalation rates — increases or decreases in the price of electricity or LFG • Revenue calculation — sales of electricity and other revenue from incentives and markets • Risk sensitivity and cost uncertainty factors — unpredictable conditions that affect project operations
and increasing or decreasing capital or O&M costs • Tax considerations — applicable taxes or tax credits that affect revenue streams
A pro forma analysis will calculate measures of economic performance that are used to assess financial feasibility, such as:
• IRR — The rate that balances the overall costs of the project with the revenue earned over the lifetime of the project such that the net present value of the investment is equal to zero.
• NPV at year of construction — First year monetary value that is equivalent to the various cash flows, based on the discount rate. In other words, the NPV is calculated as the present value of a stream of current and future benefits minus the present value of a stream of current and future costs.
• Years to breakeven — This value is the number of years for the project to pay for itself. • Annual cash flow — Total revenue from the project minus expenses, including O&M and capital
amortization costs. Essentially this measure represents the income the project generates in a year.
For preliminary assessments, LFGcost-Web will calculate several of these financial performance indicators, such as IRR, NPV and years to breakeven. It will also provide a preliminary capital and O&M cost estimate for the project.
A combination of financing factors contributes to the lifetime project cost. For example, loan periods, interest rates and down payment requirements affect the overall cost of lender financing (if a loan is used to pay for the project). If municipal bonds are issued to fund the project, the discount rate affects how much a bond must yield when due. Taxes will also affect how much (post-tax) revenue is generated. Depending on the developer’s contract with the landfill, royalty costs may also apply if the developer does not own the gas.
Project Economics and Financing 4-13

c
LFG Energy Project Development Handbook
Table 4-11 provides an example of a preliminary analysis of economic feasibility. The results shown are based on four examples presented in Tables 4-5 and 4-8. These cases assume the landfill does not have an existing gas collection and flaring system. The “private” columns illustrate results for a privately owned landfill or for instances where a private developer implements a project at a municipal landfill.
Table 4-11. Example Financial Performance Indicators for Projects without an Existing Gas Collection and Flare System12
Economic Performance Parameter
3-MW Engine Project (Includes Gas Collection and
Flaring System Costs)*
Direct-Use Project (1,000 scfm) (5-Mile — Includes Gas
Collection and Flaring System Costs)*
(Estimates) Privatea Municipalb Privatec Municipald
Net present value (NPV)** ($4,535,000) ($4,541,000) ($3,430,000) ($2,906,000)
Internal rate of return (IRR) -17% -16% -6% -4%
NPV payback period (years) None None
Capital costs** $7,840,000 $6,048,000
O&M costs** $968,000 $507,000 * Electricity sale price is 6.0¢/kWh (engine projects); LFG price is $2.25/MMBtu (direct-use projects). ** 2013 dollars for capital costs and NPV in year of construction; 2014 dollars for O&M costs (initial year of
engine operation). a 20% down payment, 6% interest rate, 8% discount rate. See example 2 in Table 4-5. b 20% down payment, 80% municipal bond, 5% interest rate, 5% discount rate. See example 9 in Table 4-5.
20% down payment, 6% interest rate, 8% discount rate. See example 2 in Table 4-8. d 20% down payment, 80% municipal bond, 5% interest rate, 5% discount rate. See example 4 in Table 4-8.
Based on these results, neither the direct-use project nor the engine project initially presents an attractive option. However, the electricity project may qualify for various green power incentives. To illustrate how credits or incentives could change the results of the analysis, consider the following:
• If the electricity sales revenue could be increased to 9.02¢/kWh instead of 6¢/kWh through a green power program or sale of RECs, or if the project is located in an area of the country with higher power prices then the IRR for the private 3-MW engine project would increase to a positive 8 percent. This scenario is presented as example 3 in Table 4-5.
LFG energy projects in which a gas collection and flaring system is already in place realize improved economics because the installation costs for the collection system are not attributed to the energy project. Instead, the costs for gas collection are considered a “sunk” cost associated with other landfill operations, such as mitigating methane migration or controlling odors. However, these projects will generally not be eligible for credits for GHG capture if the gas collection and flaring was required by regulatory programs. Table 4-12 presents examples where an LFG collection and flaring system is already in place.
12 U.S. EPA LMOP. LFGcost-Web, Version 3.2.
Project Economics and Financing 4-14

c
LFG Energy Project Development Handbook
Table 4-12. Example Financial Performance Indicators for Projects with a Gas Collection and Flare System in Place13
Economic Performance Parameter
3-MW Engine Project (Excludes Gas Collection and
Flaring System Costs)*
Direct-Use Project (5-Mile — Excludes Gas
Collection and Flaring System Costs)*
(Estimates) Privatea Municipalb Privatec Municipald
Net present value (NPV)** $188,000 $1,901,000 $1,237,000 $3,722,000 Internal rate of return (IRR) 9% 15% 17% 23% NPV payback period (years) 14 10 11 8 Capital costs** $5,251,000 $3,480,000 O&M costs** $626,000 $144,000
* Electricity sale price is 6.0¢/kWh (engine projects); LFG price is $2.25/MMBtu (direct-use projects). ** 2013 dollars for capital costs and NPV in year of construction and 2014 dollars for O&M costs in initial year of
engine operation. a 20% down payment, 6% interest rate, 8% discount rate. See example 1 in Table 4-5. b 20% down payment, 80% municipal bond, 5% interest rate, 5% discount rate. See example 7 in Table 4-5.
20% down payment, 6% interest rate, 8% discount rate. See example 1 in Table 4-8. d 20% down payment, 80% municipal bond, 5% interest rate, 5% discount rate. See example 3 in Table 4-8.
The assumption that the collection and flaring system is already installed makes each option viable. The direct-use projects appear more favorable, but finding a suitable end user within a reasonable distance is not always possible. Assuming additional revenue from premium pricing on electricity, the internal combustion engine case becomes considerably more advantageous. For example, applying a 2¢/kWh credit on top of the buy-back rate increases the IRR for the private 3 MW internal combustion engine to 26 percent, with a payback of 6 years. This scenario is presented as example 5 in Table 4-5.
Finally, it is important to bear the developer’s objectives in mind. Often, municipalities do not expect the same IRR and payback periods as private entities. Corporations, on the other hand, usually have competing uses for their limited capital and prefer to invest in projects with the greatest IRR and to quickly recover the capital investment in only a couple of years. The financial requirements of the parties involved in developing a project must be considered in evaluating economic feasibility and selecting financing mechanisms. A project at a publicly owned landfill that is not financially attractive to a project developer could still be implemented through self-development or partnering arrangements.
See Chapter 5 and Chapter 6 for more information on project structures and development options.
13 U.S. EPA LMOP. LFGcost-Web, Version 3.2.
Project Economics and Financing 4-15

LFG Energy Project Development Handbook
4.4 Step 4: Compare All Economically Feasible Options and SelectWinners
After the initial economic analysis for each project option has been completed, a comparison should be made to decide which one best meets the project objectives. After the comparison, some options may emerge as clearly uncompetitive and not worth further consideration; alternatively, there may be one option that is clearly the superior choice and warrants a more detailed investigation. It is likely, however, that multiple energy project options are viable, and it may be necessary to compare the economic analysis of each to select the most promising option, bearing in mind any non-price factors as discussed below.
A side-by-side economic comparison can be used to rank the financial performance of each option to select a winner. This comparison should incorporate several economic measures in the ranking, since no single measure can guarantee a project’s economic success. For example, projects could be ranked based on the NPV after taxes, making sure that the IRR requirements are satisfied, or that the debt incurred to finance the project is acceptable. Results may show that the project with the highest IRR has capital and O&M costs that exceed available financing. If so, a lower IRR project that costs less and is easier to finance may be the best option.
Conducting a sensitivity analysis can help the project developer understand the risks associated with different scenarios. For example, projects that carry lower risks can be more attractive to investors even if IRRs are higher because of the level of risk each one presents for certain factors. If a specific risk is identified, the investor or developer can use financial operations, such as hedging, to mitigate certain (but not all) risks.
At this point, important non-price factors should be considered, such as risks related to the attainment of emission limits or the use of new technology. Non-price factors that affect the project may not be quantifiable by the economic analysis. For example, the project might be located in a severe non-attainment area where stringent emission limits are in place, making it difficult and expensive to obtain a permit for a new combustion device. In this case, finding a direct user that could supplant some of its current fuel use with LFG might be a more viable project. In another example, project options that use proven technologies may incur lower risk than options using newer technologies. The new technologies might offer the potential for a greater return on investment, but the risk may influence the financing available and may result in a higher interest loan.
4.5 Step 5: Assess Project Financing Options Many financing options are available to landfills and project developers, including finding equity investors, using project finance and issuing municipal bonds. To begin, it is helpful to understand what lenders and investors expect.
What Lenders and Investors Expect
Typically, lenders and project investors examine the anticipated financial performance to decide whether or not to support a project. The debt coverage ratio is an important measure that the lender or investor will want to see, in addition to the IRR and other financial performance indicators from the pro forma analysis. The debt coverage ratio is the ratio of a project’s annual operating income (project revenue minus O&M costs) to the project’s annual debt repayment requirement. Lenders usually expect the debt coverage ratio to be at least 1.3 to 1.5 to demonstrate that the project will be able to adequately meet debt payments.
Project Economics and Financing 4-16

LFG Energy Project Development Handbook
The higher the risk associated with a project, the higher the return expected by lenders or investors. Risks vary by site and by project and may entail various components of the overall project, from the availability of LFG to community acceptance. In many cases, however, risks can be mitigated with a well-thought-out project, strong financial pro forma, use of proven equipment vendors and operators and a well-structured contract. Table 4-13 lists the various categories of risk that might be associated with an LFG energy project and potential measures that can be taken to mitigate these risks.
Table 4-13. Addressing LFG Energy Project Risks
Risk Category Risk Mitigation Measure LFG availability Measure LFG flow from existing system
Hire expert to report on gas availability Model gas production over time Execute gas delivery contract/penalties with landfill owner Provide for backup fuel if necessary
Construction Execute fixed-price turnkey projects Include monetary penalties for missing schedule Establish project acceptance standards and warranties
Equipment performance
Select proven technology for proposed energy use Design LFG treatment system to remove impurities, as necessary Get performance guarantees and warranties from vendor Include major equipment vendor as partner Select qualified operator
Environmental planning
Obtain permits before financing (air, water and building) Plan for condensate disposal
Community acceptance
Obtain zoning approvals Demonstrate community support
Power sales agreement (PSA)
Have signed PSA with local utility Match PSA pricing and escalation to project expenses Include capacity, energy sales and RECs in energy rate Negotiate sufficient contract term to match debt repayment schedule Confirm interconnection point, access and requirements Include force majeure (act of God) provisions in PSA
Energy sales agreement (ESA)
Have signed ESA with energy customer Set fixed energy sales prices with escalation or market-based prices at
sufficient levels to meet financial goals Obtain customer guarantees to purchase all energy delivered by project Limit liability for interruptions and have backup energy sources
Financial performance Create financial pro forma Calculate cash flows and debt coverage Maintain working capital and reserve accounts Budget for major equipment overhauls Avoid hedging on a specific factor – normally outside the control of the project
developer – that presents a significant risk to the overall result of the project
Project Economics and Financing 4-17

LFG Energy Project Development Handbook
Financing Approaches
Several types of approaches can be used to finance a project. The approaches, described below, are not mutually exclusive; a mixture of different approaches may be preferable for a project and might be better suited to meeting specific financial goals. Contact financing consultants, developers, municipal or county staff who deal with bond financing or LMOP Partners who developed similar LFG energy projects for additional information about financing approaches that have been successful in similar situations.
Private Equity Financing has been widely used in past LFG energy projects. It involves an investor who is willing to fund all or a portion of the project in return for a share of project ownership. Potential investors include developers, equipment vendors, gas suppliers, industrial companies and investment banks. Private equity financing may be one of the few ways to obtain financing for small projects without access to municipal bonds. Private equity financing has the advantages of lower transaction costs and usually the ability to move ahead faster than with other financing approaches. However, private equity financing can be more expensive and, in addition to a portion of the cash flow, investors might expect to receive benefits from providing funds such as service contracts or equipment sales.
Project Finance is a popular method for financing private power projects in which lenders look to a project’s projected revenues rather than the assets of the developer to ensure repayment. This approach allows developers to retain ownership control of the project while obtaining financing. Typically, the best sources for project financing are small investment capital companies, banks, law firms or energy investment funds. The primary disadvantages of project finance are high transaction costs and a lender’s high minimum investment threshold.
Municipal Bond Financing, applicable for municipally owned landfills and municipal end users, involves the local government issuing tax-preferred bonds to finance the LFG energy project. This approach is the most cost-effective way to finance a project because the interest rate is low (often 1 or 2 percent below commercial debt interest rates) and the terms can often be structured for long repayment periods. However, municipalities can face barriers to issuing bonds, such as private business use and securities limitations, public disclosure requirements and high financial performance requirements. Project developers should check with the state or municipality where the bond is issued to determine the terms for securing bond financing and the method for qualifying for the bond. Developers also should consider consulting with a tax professional before deciding on whether tax-exempt or taxable bonds should be secured.
Direct Municipal Funding, possibly the lowest-cost financing available, uses the operating budget of the city, county, landfill authority or other municipal government to fund the LFG energy project. This approach eliminates the need to obtain outside financing or project partners, and it avoids delays caused by the extensive project evaluations usually required by lenders or partners. However, many municipalities may not have a budget that is sufficient to finance a project, or may have many projects competing for scarce resources. Delays and complications may also arise if public approval is required.
Lease Financing provides a means for the project owner or operator to lease all or part of the LFG energy project assets. This arrangement usually allows the transfer of tax benefits or credits to an entity that can best make use of them. Lease arrangements can allow for the user to purchase the assets or extend the lease when the term of the lease has been fulfilled. The benefit of lease financing is that it frees up capital funds of the owner or operator but allowing them control of the project. The disadvantages include complex accounting and liability issues and loss of tax benefits to the project owner or operator.
Project Economics and Financing 4-18

LFG Energy Project Development Handbook
Grant Programs offered by many federal and state programs may provide funding for LFG energy projects. A comprehensive and searchable listing of federal and state grant programs is available on the DSIRE website.
Exam
ples Anne Arundel County’s Millersville Landfill Electricity Project, Maryland. After more than
12 years of exploring options and negotiating agreements, Anne Arundel County implemented a 3.2-MW LFG electricity project. The first LFG energy project located in the county, it generates green power for the local grid while providing revenue for county-wide energy efficiency and solid waste projects. A combination of local bond sales and $2 million in American Recovery and Reinvestment Act (ARRA) funding, and cooperation among local, state and federal government contributed to the success of the project.
Orange County’s Olinda Alpha Landfill Combined Cycle Project, California. Creative financing was key to implementation of this project that produced the second-largest LFG-fueled power plant (32.5 MW) in the country. Financing included a $10 million ARRA grant from the Department of Energy and a Section 1603 grant from the U.S. Treasury. Positive impacts on the economy stem from local green power usage by the City of Anaheim, annual county LFG revenues of $2.75 million, and manufacture of all major equipment components in the United States.
Project Economics and Financing 4-19