LEXNET WP2 D28 Global wireless exposure metric...
66
Document ID: D2.8 Global Wireless Exposure Metric Definition FP7 Contract n°318273 PROPRIETARY RIGHTS STATEMENT This document contains information, which is proprietary to the LEXNET Consortium. Neither this document nor the information contained herein shall be used, duplicated or communicated by any means to any third party, in whole or in parts, except with prior written consent of the LEXNET consortium. LEXNET Low EMF Exposure Future Networks D2.8 Global Wireless Exposure Metric Definition Contractual delivery date: M36 Actual delivery date: M36 Document Information Version V1 Dissemination level PU Editor Nadège Varsier (Orange) Other authors Yuanyuan Huang, Anis Krayni, Abdelhamid Hadjem, Joe Wiart (Orange) Günter Vermeeren, David Plets, Wout Joseph, Luc Martens (iMinds) Carla Oliveira, Daniel Sebastião, Manuel Ferreira, Filipe Cardoso, Luis Correia (INOV) Mladen Koprivica, Milica Popović (TKS) Enis Kocan, Milica Pejanovic-Djurisic (University of Montenegro) Ref. Ares(2015)5347928 - 25/11/2015
Transcript of LEXNET WP2 D28 Global wireless exposure metric...

Document ID D28 Global Wireless Exposure Metric DefinitionFP7 Contract ndeg318273
PROPRIETARY RIGHTS STATEMENTThis document contains information which is proprietary to the LEXNET Consortium Neither thisdocument nor the information contained herein shall be used duplicated or communicated by any
means to any third party in whole or in parts except with prior written consent of the LEXNETconsortium
LEXNETLow EMF Exposure Future Networks
D28 Global Wireless Exposure MetricDefinition
Contractual delivery date M36Actual delivery date M36
Document Information
Version V1 Dissemination level PU
Editor Nadegravege Varsier (Orange)
Other authors Yuanyuan Huang Anis Krayni Abdelhamid Hadjem Joe
Wiart (Orange)
Guumlnter Vermeeren David Plets Wout Joseph Luc Martens
(iMinds)
Carla Oliveira Daniel Sebastiatildeo Manuel Ferreira Filipe
Cardoso Luis Correia (INOV)
Mladen Koprivica Milica Popović (TKS)
Enis Kocan Milica Pejanovic-Djurisic (University of
Montenegro)
Ref Ares(2015)5347928 - 25112015
Document ID D28 Global Wireless Exposure Metric DefinitionFP7 Contract ndeg318273
Version V1 2Dissemination level PU
Abstract This deliverable puts an end to the global EMF exposuremetric built in the framework of the LEXNET project Itdescribed this new metric defined in order to evaluate theaveraged exposure of a population in a given area induced bya wireless communication network including base stationsaccess points but also the personal devices of the populationFirst the concept of the new metric called Exposure Index(EI) is detailed The EI is an average of the populationexposure it consequently results from the aggregation of allexposure sources and exposure situations met in theexposed area The computation of EI is based on a chain ofexposure where each branch represents a specific exposuresource and situation The index is a weighted sum of theindividual exposures from all the branches in this chainThen the concept is formalized through an analytical modelwith multiple input variables Each input variable needed forthe EI computation is described and detailed In section 4 theEI integration methodology is described on a dense urbanmacro 3G scenario Finally the uncertainties and thevariability are discussed and ICT usage data variability isdetailed and propagated into the analytical model to evaluatethe variability of the EI
Key words Metric exposure index
Project Information
Grant Agreement ndeg 318273
Dates 1st November 2012 ndash 31th October 2015
Document approval
Name Position inproject Organisation Date Visa
Joe Wiart Coordinator Orange 18112015 OK
Document history
Version Date Modifications Authors
V0 19102015 First draft version for internal review Nadegravege Varsier
V1 09112015 Version after taking into accountinternal reviewer comments Nadegravege Varsier
Document ID D28 Global Wireless Exposure Metric DefinitionFP7 Contract ndeg318273
Version V1 3Dissemination level PU
TABLE OF CONTENTS
TABLE OF CONTENTS 3
1 INTRODUCTION 6
2 THE EXPOSURE INDEX 10
21 KEY CONCEPT 1022 MATHEMATICAL FORMALIZATION 11
3 EXPOSURE INDEX COMPUTATION DATA SOURCES 16
31 LIFE SEGMENTATION DATA 1632 ICT USAGE DATA 1733 SAR DATA 35
4 EI INTEGRATION METHODOLOGY ON A MACRO 3G DENSE URBANSCENARIO 37
41 SCENARIO 3742 INPUT DATA 3743 EI INTEGRATION 40
5 VARIABILITY AND UNCERTAINTIES 43
51 VARIABILITY OF THE POWER TRANSMITTED BY WIRELESS PERSONAL DEVICES 4352 EI VARIABILITY 48
6 CONCLUSION 53
7 REFERENCES 54
8 MAIN PUBLICATIONS 58
APPENDIX 1 NUMERICAL DOSIMETRIC SIMULATIONS FOR GOOGLE GLASSES 59
APPENDIX 2 INTERNAL REVIEW 66
Document ID D28 Global Wireless Exposure Metric DefinitionFP7 Contract ndeg318273
Version V1 4Dissemination level PU
Executive Summary
This deliverable is focused on a global wireless exposure metric defined in order toevaluate the averaged exposure of a population in a given area induced by all thenetworks deployed in the considered area including base stations access points butalso the personal devices of the population The project LEXNET aims at reducingthis averaged exposureThe concept of this new metric is to take into account the global EMF exposure of apopulation to wireless telecommunication networksIt covers the exposure of a population during a given time frame in a given areaincurred by a wireless telecommunication network as a whole combining thedownlink exposure induced all day long by base stations and access points and theuplink exposure incurred by individual wireless communication devicesThe way to build the new metric called Exposure Index (EI) is based on a chain ofexposure covering all the configurations of exposure we are dealing with Individualexposure is integrated over different radio access technologies (GSM UMTShellip)layers (macro-cells micro-cells femto-cells) types of used devices (mobile tablethellip)usages of these devices (voice calls or data sessions) and profiles of users (heavyusers non-usershellip) Finally the EI is a weighted sum of all the branches of the chainof exposure
The first chapter of the deliverable provides a reminder of the need to define a newmetric The second chapter details the new concept of EI and its formalizationthrough an analytical model with multiple input variablesThe third chapter introduces data sources used to compute the EIThen the EI integration methodology is described on a complete macro 3G scenarioFinally the uncertainties and the variability are discussed and ICT usage datavariability is detailed and propagated into the analytical model to evaluate thevariability of the EI
Document ID D28 Global Wireless Exposure Metric DefinitionFP7 Contract ndeg318273
Version V1 5Dissemination level PU
List of Acronyms and Abbreviations
AIC Akaike Information Criterion
ANR Agence Nationale de la Recherche (French National Agency of Research)
BS Base Station
CAD Computer-Aided Design
GSM Global System for Mobile
DL Down-Link
EI Exposure Index
EM ElectroMagnetic
EMF ElectroMagnetic Field
EPRE Energy Per Resource Element
ISD Inter Site Distance
FDD Frequency Division Duplexing
FP7 7th Framework Program of the European Commission
GPU Graphics Processing Unit
ICT Information and Communication Technology
KPI Key Performance Indicator
LOS Line Of Sight
LTE Long Term Evolution
MLW Maximum number of Lines per Wavelength
NLOS Non Line Of Sight
PEC Perfect Electrical Conductor
QoS Quality of Service
RAT Radio Access Technology
RX Received
RF Radio-frequency
SAR Specific Absorption Rate
SAS Statistical Analysis System
SINR Signal to Interference plus Noise Ratio
TX Transmitted
UE User Equipment
UL Up-Link
UMTSUniversal Mobile Telecommunication System
WiFi Wireless Fidelity
Document ID D28 Global Wireless Exposure Metric DefinitionFP7 Contract ndeg318273
Version V1 6Dissemination level PU
1 INTRODUCTION
Wireless communications are being used in almost every aspect of daily life Theextremely rapid technological evolution results in dramatic changes in the usage ofthe wireless devices but not in the perception of the exposure induced by thesenetworks
On the one hand new devices and new generations of wireless networks have madea multitude of new applications popular These applications (used mainly withsmartphones) are consuming more and more data as illustrated in Figure 1[CISCO14]
Figure 1 Global mobile data per month traffic forecast by type of deviceSource Cisco VPN Mobile Forecast 2014
To support this increasing demand traditional macro-cellular networks are not welldimensioned anymore and new types of networks based on heterogeneoustopologies (including small cells) must be used to offload the data trafficThe deployment of new frequency bands and new technologies as LTE as well asthe growth of WiFi usage will help to support this demandAs illustrated on Figure 2 a massive small-cells deployment is forecast in the nextfew years
Document ID D28 Global Wireless Exposure Metric DefinitionFP7 Contract ndeg318273
Version V1 7Dissemination level PU
Figure 2 Worldwide small cells deployment forecast (figure on top) and public accessmetrocells deployment forecast (bottom figure) - Source Maravedis-Rethink RAN Research
Service
But paradoxically as the role of wireless communications in the daily life quicklyexpanded the public concern around EMF health risk grows just as much An in-depth survey has been conducted in the framework of LEXNET Data was collectedfrom April to June 2013 in France Germany Portugal Spain Romania Montenegroand Serbia using an online survey tool A total of 2392 respondents participated inthis survey (mean age 3482 years gender distribution 40 female and 60 male)The first part of the survey focused on the perceived sources of daily RF-EMFexposure of the respondents Additionally we were interested in the factors whichdetermine in their view the degree of EMF exposure Another part of the surveyregarded risk perception and health concernsOnly key findings are reported here but detailed description of the survey and of theresults is in the deliverable entitled ldquoD22 Risk and exposure perceptionrdquo [LEXNETD22 2013]
Regarding the perceived health hazards of various usage scenarios our respondentsevaluated base stations on a school roof as the most dangerous Using mobile phone
Document ID D28 Global Wireless Exposure Metric DefinitionFP7 Contract ndeg318273
Version V1 8Dissemination level PU
for calls is perceived as less dangerous a somewhat lower score characterizes thelaptop used on the lap The results of this survey indicate that risk perceptions of thegeneral public and the underlying health concerns are guided by subjective models ofEMF impact which underestimate near-field exposure and overestimate far-fieldexposure People are more concerned about base stations than about all other RF-EMF sources
Currently different metrics are used to deal with exposure induced by sources closeto the users as mobile phones and with exposure induced by far away sources asbase station antennasThe current state of existing metrics to evaluate the exposure induced by RF-EMFsources has been reviewed in the deliverable ldquoD21 Current metrics for EMFexposure evaluationrdquo [LEXNET D21 2013]Basically two types of metrics are distinguished the ones dedicated to the exposureinduced by sources close to the users as personal devices and expressed in termsof Specific Absorption Rate (SAR) and the ones focusing on the exposure induced byfar field sources as access points or base station antennas and currently expressedin ElectricMagnetic fields or Power DensityPersonal devices and base stations are too often represented as two separate worldswhen dealing with exposure issue But the connection between exposure induced bypersonal devices and base stations is indisputable Measurements on real networksillustrate a strong correlation (Figure 3) between the power emitted by personaldevices and the power received by personal devices from the base station antennas[GCWW10] The higher is the received power by the device the lower is the emitterpower by the device as illustrated by Figure 3
Figure 3 Duality between mobile phones emitted and received powers measured during voicecalls on the 3G Orange France network - source [GCWW10]
The project LEXNET aims at filling the gap between these two separate ways ofdealing with exposure by proposing a new exposure metric named Exposure Index(EI) The EI is assessing the average exposure of a population induced by bothpersonal devices and base stations (or access points) The concept is to average thisglobal exposure over space by assessing the EI in a given area and average it overtime by considering a given time frame Therefore an important question that the
-60 -40 -20 0 20 40
-120
-100
-80
-60
-40
Emitted power by devices (dBm)
Rec
eive
dpo
wer
by
devi
ces
(dB
m)
GSM 900
GSM 1800
UMTS 2100
Document ID D28 Global Wireless Exposure Metric DefinitionFP7 Contract ndeg318273
Version V1 9Dissemination level PU
project must absolutely address is about the understandability and acceptability ofthis new exposure metric by the general publicA second survey has been therefore conducted in the framework of LEXNET Datawere collected from July to September 2014 in France Germany United KingdomPortugal Spain Romania and Serbia among a representative sample of the generalpopulation A total of 1809 respondents participated in this second surveyAn important part of the survey focused on how people are considering strategiesproposed in the framework of the LEXNET project to define and minimize thepopulationrsquos exposure to electromagnetic fieldsOnly key findings are reported here but detailed description of the survey and of theresults is in the deliverable entitled ldquoD25 Risk and exposure perceptionrdquo [LEXNETD25 2014]
When asked about adding up the exposure from personal wireless devices and theexposure from base stations when evaluating the exposure of people to EMF morethan 90 of respondents agreed on the fact that both downlink and uplink exposuresshould be considered when evaluating the population exposure to EMFA large percentage of respondents also agreed when asked if it makes sense tocharacterize the day-to-day exposure to EMF by averaging it over time or if they thinkthat an individual exposure to EMF can be approximated by measuring the exposureover a large population
The next chapter of this deliverable describes the Exposure Index proposed by theproject LEXNET
Document ID D28 Global Wireless Exposure Metric DefinitionFP7 Contract ndeg318273
Version V1 10Dissemination level PU
2 THE EXPOSURE INDEX
21 Key concept
The Exposure Index (EI) takes into account the global EMF exposure of a populationto a given wireless telecommunication network (or a set of networks) The EI in theframework of LEXNET project does not take into account the exposure induced byother RF sources such as Frequency Modulation (FM) radio or digital terrestrialtelevision transmitters However the EI was designed as a future-proof metric andother RF sources could completely be taken into account if neededIt covers the exposure of a population during a given time frame in a given areaincurred by a wireless telecommunication network as a whole aggregating thedownlink exposure induced all day long by base stations and access points and theuplink exposure incurred by individual wireless communication devices The uplinkexposure can be subdivided in exposure due to the uplink of the userrsquos own deviceand the uplink of devices operated by other users nearbyIn order to assess the realistic exposure of a population many parameters influencingthe exposure need to be taken into account in the Exposure Index age (adult andchild exposure are different [CHLWW08] [WIART08]) posture [NAGAOKA08] usagetechnology environment etc
In a nutshell the LEXNET Exposure Index is a function transforming a highlycomplex set of data into a single parameter which has two key benefits it isunderstandable acceptable and usable for all the stakeholders from general publicto regulatory bodies and it is linked in a tangible way to the network operatingparameters
The EI is built from the aggregation of individual exposure contributions generated bya specific exposure source in specific exposure situations For instance an averagedindividual exposure generated by WiFi 24 GHz can be calculated at day time for anadult heavy-user located indoors sitting and with a tablet The same kind ofindividual exposure is estimated for other time periods RATs populationsenvironments usages and postures to get complete elements that compose the EIThe individual exposure contributions are weighted according to theirrepresentativeness before aggregation A complete example of EI integration is givenin section 43The individual exposure is the sum of a down-link (DL ndash generated by surroundingbase stations and access points) and up-link (UL ndash generated from personal mobiledevices) components as explained with more details in section 221
The EI is computed in a given area from the aggregation of individual exposurecontributions in a chain of exposure (see Figure 4) The nodes in this chain arerelated to different exposure sources or exposure situations
bull time periods as the configuration of the network and type of usage depend onthe time of day (low-load night-time vs heavily loaded peak-hour)
bull population category as different population categories will have different lifesegmentations and different usages of wireless devices
bull user profile
Document ID D28 Global Wireless Exposure Metric DefinitionFP7 Contract ndeg318273
Version V1 11Dissemination level PU
bull location as the exposure configurations will be different in differentenvironments typically indoors and outdoors
bull radio access technologies RATs (GSM UMTS LTE WiFi etc) frequencybands and deployment layers (macro micro and femto cells) that usersconnect to
bull posture as different body postures will lead to different absorption rates in thehuman body
bull device usage as for example making a phone call does not lead to the sameexposure as downloading data
Figure 4 the LEXNET chain of exposure
Different exposure scenarios [LEXNET D23 2013] are considered and aggregatedby putting weights on each configuration thereby determining the EI A partial EI canbe for example computed for a scenario that considers only a subset of RATspopulation environment etc Then several partial EI can be aggregated with aweight related to their representativenessEI takes into account different parameters coming both from the telecom world todescribe the accessible network environment and from data on how people segmenttheir life to describe how people are using this network
22 Mathematical formalization
221 Exposure Index Equation
The Exposure Index is calculated for a finite geographical area that must preferablybe homogeneous in terms of population and network usage it can be of urbansuburban or rural type for instanceThe general formulation of the Exposure Index contains a set of technicalparameters as described below The number of values classes or settings of eachparameter depends on the level of detail of the available data and on the level ofachievable complexity in terms of calculation For a given geographical area the EItakes the following into account (see also Table 1)
Document ID D28 Global Wireless Exposure Metric DefinitionFP7 Contract ndeg318273
Version V1 12Dissemination level PU
time period (t) eg day and night population (p) segmented into different categories eg children (under 15
yo) young people (15-29 yo) adults (30-59 yo) and seniors (60 yo andover)
user load profiles (l) eg heavy medium light or non-users environment (e) eg indoor (office home) outdoor and in commuting
(bus car subway etchellip) different available Radio Access Technologies (RATs) (r) eg 2G (900
MHz and 1800 MHz) 3G 4G WiFi the number of RATs depends on thescenario
different cell types (c) eg macro micro pico and femto cells theaccessibility to the different cell types depends on the scenario
posture (pos) eg sitting standing usage (u) is described by the device (eg mobile PC laptop) and the
service (eg voice call data)
TimePopulatio
nUser
ProfileEnvironme
ntRAT Cell Type Posture Usage
Day Children Heavy Indoor 2G Macro Standing Voice mobile
Night Youngpeople
Medium
Outdoor 3G Micro Sitting Data mobile
Adults Light Commuting 4G Pico Data Tablet
Seniors Nonuser
WiFi Femto Data Laptopon the laps
Data Laptopon the desk
Table 1 input variables in the modelling of the EI
The individual exposure contributions rely on the SAR expressed in Wkg The SARdepends on the device the frequency band the morphology and the posture of theuser as well as on the position and distance of the source with respect to the user Aspart of LEXNET a set of numerical dosimetric simulations have been performed inorder to fill out a comprehensive matrix of raw normalized SAR values calculated fora reference transmitted power (near-field exposure) or a reference received powerdensity (far-field exposure) These SAR values can be whole-body or localized SARvalues Whole-body SAR values are evaluated by averaging SAR over the whole-body whereas localized SAR values are values focusing on a body volume specificorgan or tissue Different EI can be evaluated depending on the value of interest(whole-body or localized value)Network measurements or simulation tools are expected to provide transmitted andreceived power density average values to apply to the raw SAR matrixInformation and Communication Technologies (ICT) usage data obtained throughsensors inside the network and segmentation life data will finally provide the levels toapply for the evaluation of the EIIt was decided to build the EI based on the dose (SAR x duration of exposure) even ifthere is no evidence today of a higher correlation between the dose and anyhypothetical health effect than with instantaneous peak SAR
Document ID D28 Global Wireless Exposure Metric DefinitionFP7 Contract ndeg318273
Version V1 13Dissemination level PU
SARܫܧ =1
T
tperlcpos ൫ ത
൯
ே
௨
ேೞ
௦
ேಽ
ே
ேೃ
ேಶ
ேು
ே
௧
+ RXinc + ௦ௗ௩௦ோ௦ௗ௩௦
W
kg൨
(1)
where EISAR is the Exposure Index value the average exposure of the population of
the considered geographical area over the considered time frame T SARrefers to whole-body SAR organ-specific SAR or localized SAR
is the number of considered periods within the considered time frame (egsingle day)
is the number of considered Population categories ா is the number of considered Environments ோ is the number of considered Radio Access Technologies is the number of considered Cell types is the number of considered user Load profiles ௦ is the number of considered Postures
is the number of considered Usages with devices ത
is the mean TX power transmitted by the usersrsquo devices during the periodݐ in usage mode ݑ connected to RAT r in environment For example whenEI is computed from simulation tools the TX power can be predicted over amap that covers the whole considered geographical area and the averagevalue is extracted for the EI evaluation See details in section 223
ோis the mean incident power density on the human body during the periodݐ induced by RAT ݎ in environment A distribution of the incident powerdensity for the whole considered geographical area is considered and theaverage value over this area is taken into account for the EI evaluation
ோ௦ௗ௩௦ is the incident power density on the human body during the
period t induced by a wireless device connected to RAT r of a user in theproximity in environment e This term is important when the exposed personis the user itself it can also be significant for persons in the proximity of usersof a wireless device for instance in a crowded meeting room in publictransportation etc In the applications discussed in this paper this term is
neglected We also remark that ோ௦ௗ௩௦ depends on the orientation of
the user of the wireless device with respect to the body of the people in itsproximity See details in section 223
( ୱ
୩W) ௦ௗ௩௦ (
ୱ
୩
୫ మ) and ( ୱ
୩
୫ మ ) are the normalised
raw dose values for UL the DL from the user in the proximity and DL frombase stations and access points respectively all multiplied by the time spentin the configuration See details in section 222
Document ID D28 Global Wireless Exposure Metric DefinitionFP7 Contract ndeg318273
Version V1 14Dissemination level PU
௧௦ is the fraction of the total population that corresponds to populationcategory p user load profile l in posture pos connected to RAT r for a celltype c in environment e during the time period t
In the following we explain the different terms used in the EI formula in more detail
222 Coefficients and
The coefficient is associated to the exposure induced by the uplink andexpressed as an absorbed dose normalised to a transmitted power of 1 W
[ୱ୩
]
=௧௨௦[ୱ]ܦ
௨௦[ܣ ୩]
[ ]
Ws
kgW൨ (2)
where ௧௨௦ܦ
is the time duration of usage ݑ and a user profile load when
connected to the RAT ݎ operating in cell type in the environment for thepopulation category in the posture pos during the time period of the day ݐ
ௌோೠೞ
ಽ
can be the whole body or an organ-specific or tissue-specific
valueܣ for the usage ݑ and the posture pos in the frequency band of theRAT ݎ and the population category calculated for an incident emitted power
of
and normalized to this power
The coefficient is associated to the exposure induced by the downlink and alsoexpressed as an absorbed dose normalised to an incident power density of 1 Wm2
[ୱ୩
]
=௧௦[ୱ]ܦ
௦[ܣ ୩]
RX[W]inc
Ws
kg
W
mଶ൨ (3)
where ௧௦ܦ
is the time duration of posture ݏ when connected to the RAT ݎ
operating in cell type in the environment for the population during thetime period of the day ݐ
ௌோೞ
ವಽ
ௌೃ can be the whole body or an organ-specific or tissue-specific
valueܣ induced by the base station or access points of the RAT ݎ in thepopulation for the posture ݏ normalized to the received power density
ோ
223 Transmitted power ഥ and received power density ത ܖ
ത is the average power transmitted by the device in busy mode (in active
communication) It should be noted that even in idle mode (not for activecommunication) the devices transmit from time to time some power (to stay
Document ID D28 Global Wireless Exposure Metric DefinitionFP7 Contract ndeg318273
Version V1 15Dissemination level PU
synchronized with the network for example) but the exposure induced by the devicein idle mode is negligible as it is based on rare events is the average power density incident on the human body from the base stationsor access points of the RAT The incident power density is assessed not only forusers of mobile devices but also for non-users It is assumed that the usage patternof the user considered in the EI formula does not influence the average incidentpower density From a theoretical point of view is the average incident powerdensity integrated over all the frequency bands of the RAT and cell type consideredFrom a practical point of view can be assessed directly from spectrum analyzer(SA) measurements dosimeters simulations and indirectly from the received poweron a user device or in a drive test measurementത and Sത୧୬ୡ average out the instantaneous variations of the transmitted power and
incident power density that arise during a communication These variations occurwhen the user is static or moving over a very small distance and are caused bydifferent phenomenas (power regulation small-scale fading resource allocation usertraffic variations etc) Values that will be used in the EI evaluation are averagedvalues over the whole considered geographical area
For both the evaluation of the DL incident power density and UL transmitted powerthe ressource allocation or duty cycle of the system has to be taken into account TheEI computation does not rely on maximum allowed power values (as in existing EMFexposure procedures) but on the incident and transmitted powers that respectivelydepend on the DL network and UL user resource load This definition leads to anestimate of the UL transmitted power that necessarily depend on the type of usertraffic (eg voice web browsing file upload etc) the higher is the instantaneous ULthroughput during the communication the higher is generally the UL transmittedpower
224 Exposure from close users
To account for all possible exposure situations in the EI equation (1) we also have toinclude the exposure induced in persons close to an active device operated by a thirdperson This happens for instance in crowded places public transportation andmeeting rooms The exposure is typically induced by a mobile phone laptop or tabletThe exposure induced by nearby active devices can be viewed as a downlinkexposure at the persons in the proximity (see 3rd term in the EI equation (1)) even ifgenerated by an uplink transmission since it would be treated as a far-field exposureThe contribution of radio-frequency radiation originating from other peoplersquos deviceshas been studied in [PLETS15] This contribution has been compared to the totalpersonal absorption in a train environment They found that the absorption fromnearby active mobile devices cannot always be neglected in a GSM macrocellconnection scenario UL of 15 other users can cause up to 19 of total absorptionfor users having themselves a call and up to 100 for non-active persons In anUMTS femtocell connection scenario UL of 15 other users contributes to totalabsorption of a non-active person for no more than 15 Hence in exposuresituations where mobile devices are operated in close proximity of other persons orusers the 3rd term in the EI equation might be non-negligible
Document ID D28 Global Wireless Exposure Metric DefinitionFP7 Contract ndeg318273
Version V1 16Dissemination level PU
3 EXPOSURE INDEX COMPUTATION DATA SOURCES
The EI evaluation relies on the collection of a wide range of data from simulationtools literature models and measurement equipment that have been demonstratedin the LEXNET technical work-packages All the input data that were collected andwere used in the framework of the project are detailed below
31 Life segmentation data
Life segmentation data were extracted from up-to-date life segmentation surveysperformed in the countries involved in LEXNET
In order to evaluate the Exposure Index we needed data for each of the consideredpopulation categories children (under 15 yo) young people (15-29 yo) adults (30-59 yo) and seniors (60 yo and over)
How young people adults and seniors spend their time in Europe was extracted fromthe HETUS survey [HETUS] the French INSEE survey [INSEE] and the time usesurvey in Republic of Serbia [Survey-Serbia] (see Table 2)
Adults Young people Seniors
Gainful work study 500 440 005
Domestic work 300 115 400
Travel 130 120 0050
Sleep 815 900 845
Meals personal care 215 245 330
Free time indoor (TVsocializing readinginternet surfing)
300 400 430
Free time outdoor (sportsgardening hiking)
100 100 220
Total 2400 2400 2400
Table 2 How young people adults and seniors spend their time in Europe
How children spend their time in Europe was extracted from [HOFFERTH01][LARSON01] [LARSON11] and [COOPER10] (see Table 3) Average daily timespent at school or day care for domestic work sleeping eating and personal carewere deduced from [HOFFERTH01] and [LARSON01] Then it was difficult to extractthe free time indoor and outdoor as categories in [HOFFERTH01] do not precise ifactivities such as ldquoother passive leisurerdquo are outdoor or indoor activities From[LARSON11] we could extract that American children spend in average 2h per daydoing outdoor activities From [COOPER10] we could deduce that UK children spendin average 45 min per day outdoor between 330 and 830 PM
Document ID D28 Global Wireless Exposure Metric DefinitionFP7 Contract ndeg318273
Version V1 17Dissemination level PU
Children
School-Day care 345
Domestic work 045
Travel 030
Sleep 1040
Meals personal care 2 30
Free time indoor (TVplaying reading internetsurfing)
435
Free time outdoor 130
Total 2400
Table 3 How children spend their time in Europe
Extracted from Table 2 and Table 3 the data required in EI equation is reported inTable 4
Populationcategory
Day (8 AM-6 PM) Night (6 PM- 8AM)
Indoor(office-school-home)
Outdoor
Transportation (bus carsubwayetchellip)
Indoor(home)
Outdoor
Transportation (bus carsubwayetchellip)
Adults8h15(825)
1h10(115)
35 min
(6)
13h05 min(935)
20 min(25)
35 min
(4)
Youngpeoplestudents
8h20(83)
1h10(115)
30 min
(55)
13h10 min(94)
20 min(25)
30 min
(35)
Children8h15(825)
1h30 (15)
15 min
(25)
13h45 min(985)
0 min
(0 )
15 min
(15)
Seniors7h35(758)
2h10(217)
15 min
(25)
13h05 min(935)
40 min(5)
15 min
(15)
Table 4 Life segmentation inputs for evaluation of the Exposure Index
32 ICT usage data
321 When and where
Figure 5 and Figure 6 show that we are generally using different wireless devices atdifferent time of the day and in different locations Laptops are used in indoorlocations whether at the office or at home Tablets are preferred at home at nightwhereas mobile phones are used throughout the day with a high usage duringcommuting
Document ID D28 Global Wireless Exposure Metric DefinitionFP7 Contract ndeg318273
Version V1 18Dissemination level PU
Figure 5 Devices preferences throughout the day (Source comScore devices EssentialsJanuary 2013)
Figure 6 How and when we use our mobile phones (Source TNS Mobile Life survey)
Crossing this kind of information extracted from survey and life segmentation datawe can assume that about 100 of laptop or tablet usages happens indoors 70 of phone usages is indoors 20 when commuting and 10 outdoors
Document ID D28 Global Wireless Exposure Metric DefinitionFP7 Contract ndeg318273
Version V1 19Dissemination level PU
We also draw the conclusion that 50 of laptop usage happens during the day (from8 AM to 6 PM) and 50 during the night (from 6 PM to 8 AM) For tablet usage weconsider that 20 of the usage happens during the day and 80 during the night
For WiFi usage we make the hypothesis that 100 of wireless device usageshappen indoors
322 Connections per RAT
As shown in Figure 7 (from [CISCO14]) it is forecasted that in 2016 the 4Gconnections will represent 8 of the mobile connections whereas 2G and 3G willrespectively represent 48 and 44 of the connections
Figure 7 Connections by RAT forecast
Figures are a bit different depending on regions As shown on the table belowextracted from [CISCO14] the 4G connections are expected to represent 24 ofmobile connections in 2018 in Western Europe whereas they will represent only 10 of the connections in Central and Eastern Europe
Document ID D28 Global Wireless Exposure Metric DefinitionFP7 Contract ndeg318273
Version V1 20Dissemination level PU
Table 5 Life segmentation inputs for evaluation of the Exposure Index
This forecast is used as a baseline scenario in some of our studies Then promotingchanges in the RAT percentages can be envisaged as a way to reduce the EI
323 Usersnon-users per population category
Using 2013 data on the equipment rates of classical mobile phones and smartphonesand proportions of the French population using a mobile phone for websurfingextracted from the 2013 CREDOC (Centre de Recherche pour lrsquoEtude etlrsquoObservation des Conditions de vie) report [CREDOC13] and data extracted from aMarch 2014 Ipsos survey entitled ldquoLes nouveaux usages des moins de 20 ansrdquo weevaluated the proportions of users and non-users of mobile phones for voicecommunications and data traffic per population category (see Table 6) For childrenunder 8 years old we make the assumption that they are not wireless device users
Mobile phoneusage
Children(under8 yo)
Children(8-12yo)
Children(12-15
yo)
Youngpeople(15-29
yo)
Adults(30-59
yo)
Seniors(over 60
yo)
Voicecommunication
Non-users
100 60 10 4 5 30
Users 0 40 90 96 95 70
Data traffic Non-users
100 90 45 33 59 90
Users 0 10 55 67 41 10
Table 6 Proportions of users and non-users of mobile phones per population category
Using data on the equipment rates of tablets 3G dongles and laptops from[CREDOC] and the March 2014 Ipsos survey we deduced the proportions of usersand non-users of tablets 3G dongles and laptops per population category (see Table7)
Document ID D28 Global Wireless Exposure Metric DefinitionFP7 Contract ndeg318273
Version V1 21Dissemination level PU
Children(under8 yo)
Children(8-12yo)
Children(12-15yo)
Youngpeople(15-29yo)
Adults(30-59yo)
Seniors(over 60yo)
TabletsNon-users
92 81 7877 79 94
Users 8 19 22 23 21 6
3G donglesNon-users
100 100 9290 90 93
Users 0 0 8 10 10 7
LaptopsNon-users
100 100 2122 34 67
Users 0 0 79 78 66 33Table 7 Proportions of users and non-users of tablets 3G dongles and laptops per population
category
324 Tablets and laptops usage data
From [CISCO14] in 2013 the average worldwide mobile data traffic per tablet (from3G and 4G tablets) was 137 GB per month and 24 GB per month for a 4G tabletFrom subscribers billing data collected in January 2014 in Serbia we could derive anaverage monthly traffic per tablet of 083 GBFigure 8 extracted from [CISCO14] gives cellular vs WiFi only tablets ratios
Figure 8 Cellular vs WiFi tablets ratio
From [CISCO14] in 2013 the average mobile data traffic per laptop was 245 GB permonthFrom subscribers billing data collected in January 2014 in Serbia we could derive anaverage monthly traffic per laptop of 34 GB in Serbia
Finally we took the hypothesis that the UL traffic for tablets and laptops represents 15 of the total mobile data traffic
Document ID D28 Global Wireless Exposure Metric DefinitionFP7 Contract ndeg318273
Version V1 22Dissemination level PU
325 Mobile phone usage data
3251 3G data from Orange
Mobile phone usage data were collected through an access network probe localizedat the RNC (Radio Network Controller) level in the 3G Orange France network Threeareas have been monitored one urban area in a district of Paris one suburban areain the region of Clermont-Ferrand and one rural area in the region of Nancy
Extracted data gives per-user and per-hour measurements during one weekbull total duration of voice callsbull number of voice callsbull total duration of UL data sessionsbull number of UL data sessionsbull total volume of UL data sessionsbull total duration of DL data sessionsbull number of DL data sessionsbull total volume of DL data sessions
Averaged daily profiles have been extracted for voice and data services (Figure 9)
Document ID D28 Global Wireless Exposure Metric DefinitionFP7 Contract ndeg318273
Version V1 23Dissemination level PU
Figure 9 Illustration on time variation of mean voice (top figure) and data (bottom figure)usage per user over a day Data have been collected in urban suburban and rural areas during
a week in November 2013 on the 3G Orange France network
The usage is also completely unbalanced among all the users A small number ofusers are consuming a large part of traffic whatever the type of area as illustrated onFigure 10
0 8 12 18 230
01
02
03
04
05
06
07
08
09
1
Hour
Min
ute
Mean Voice Usage in Munites per User During Daily Hours
Urban
Suburban
Rural
Aggregated
0 8 12 18 230
100
200
300
400
500
600
700
Hour
KB
Mean Volume of Data Exchanged in KB per User During Daily Hours
Urban
Suburban
Rural
Aggregated
Document ID D28 Global Wireless Exposure Metric DefinitionFP7 Contract ndeg318273
Version V1Dissemination level PU
Figure 10 Distribution of the voice (toline) suburban (green line) and rura
Three types of profiles were definedbull heavy users top users cobull moderate users users cobull light users users consum
Based on the data recorded in theAs expected there are not sosuburban and urban All the data hTable 9 Table 10 and Table 11 dvoice communication durations ansummarizes the repartition of user p
0 01 02 03 04 05 06 07 08 09 10
01
02
03
04
05
06
07
08
09
1
of users
o
fto
talv
oic
eca
llsd
ura
tion
aggregation
urban
suburban
rural
0 01 02 030
01
02
03
04
05
06
07
08
09
1
o
fto
talv
olu
me
ofd
ata
tra
ffic intermediate
light
heavy
intermediate
light
p figure) al (black lineareas (blue
for voicensumingnsuminging 5 of
networkmuch difave beenetail for dd data trarofiles fo
04 05 of u
heavy
nd data (bottom) areas and aggrline)
and data serv80 of the tota15 of the totathe total data
the user profileferences quanpooled to definifferent geograffic volumes p
r Orange 3G vo
06 07 08sers
aggr
urba
subu
rural
24
figure) traffic for urban (redegated over the 3 types of
icel datal data
s are defined in Table 8titatively between rurale the mean user profilesphical areas the averageer user profile Table 12ice and data usages
09 1
egation
n
rban
Document ID D28 Global Wireless Exposure Metric DefinitionFP7 Contract ndeg318273
Version V1 25Dissemination level PU
3G network
Rural Suburban Urban Global
tcom
[s]voldata
[kB]tcom
[s]voldata
[kB]tcom [s] voldata
[kB]tcom [s] voldata [kB]
Heavyusers
1972 103635 1899 70711 1610 67875 1762 73065
Moderateusers
249 9210 361 7915 233 5242 305 6940
Lightusers
42 492 71 753 41 345 53 504
Table 8 User profiles defined in rural suburban and urban areas
3G (Orangenetwork)
Voice Data (82 DL 18 UL)
Urban tcom (s) volULdata [kB] volDLdata [kB]
Heavy user
Day 841 4948 25124
Night 689 5879 31922
Moderate user
Day 147 464 2390
Night 86 387 2001
Light user
Day 26 35 158
Night 16 28 124
Table 9 Average voice communication durations and data traffic volumes per user profile for a3G Orange dense urban network
3G (Orangenetwork)
Voice Data (81 DL 19 UL)
Suburban tcom (s) volULdata [kB] volDLdata [kB]
Heavy user
Day 1081 5393 30199
Night 743 5175 29941
Moderate user
Day 242 739 3930
Night 119 505 2740
Light user
Day 49 90 382
Night 22 55 226
Table 10 Average voice communication durations and data traffic volumes per user profile for a3G Orange suburban network
Document ID D28 Global Wireless Exposure Metric DefinitionFP7 Contract ndeg318273
Version V1 26Dissemination level PU
3G (Orangenetwork)
Voice Data (79 DL 21 UL)
Rural tcom (s) volULdata [kB] volDLdata [kB]
Heavy user
Day 928 7013 36925
Night 723 9379 50314
Moderate user
Day 164 735 3716
Night 85 754 4005
Light user
Day 28 54 208
Night 14 48 182
Table 11 Average voice communication durations and data traffic volumes per user profile for a3G Orange rural network
Heavy users Moderate users Light users
Voice 20 30 50
Data 10 20 70Table 12 Repartition of user profiles for Orange 3G voice and data usages
3252 2G and 3G data from Telekom Srbja
Telekom Srbja combined data coming from different sources mainlybull Customer analytics systembull Network management system
On one hand data that could be retrieved from the customer analytics system SAScontains personal information on subscriber as
bull agebull genderbull addressbull account type (voice andor data)bull device type (mobile dongle tablet)
Traffic statistics of these subscribers were also collected through the customeranalytics system
On the other hand cell statistics were obtained from the network managementsystem on an hourly basis as
bull number of voice callsbull duration in Erlangbull number of data sessionsbull duration of all data sessions (min)bull volume of UL DL data transfers (kB)
Analyzing data about customer personal information revealed that these datacorrespond mainly to those who pay the bills at the end Employees and children
Document ID D28 Global Wireless Exposure Metric DefinitionFP7 Contract ndeg318273
Version V1 27Dissemination level PU
have been usually hiding respectively behind companies and parents who pay thebills but do not use many of those subscriptions personally
Data used for LEXNET were collected from the customer analytics system SAS andwere based on usersrsquo billing data for the month of January 2014 A LEXNET test areaconsisted of a few representative cells of different types of environment UrbanSuburban and Rural Subscribers who were located in the test area and did generateat least voice or data traffic have been taken into account Traffic data consisted of2G and 3G networks usage all together
Telekom Srbja LEXNET test area (2G and 3G)
User profile Geographical area
Rural Suburban Urban Global
tcom (s) voldata
(kB)tcom (s) voldata
(kB)tcom (s) voldata
(kB)tcom (s) voldata
(kB)
Heavy user 1176 40072 1230 46410 1372 47315 1313 46777
Moderate user 107 4929 120 11208 187 11367 153 11214
Light user 11 735 15 1186 28 1120 21 1181Table 13 User profiles defined in rural suburban and urban areas from TKS usage data
Specific 2G and 3G data were extrapolated considering for voice communicationsthat 72 of communications were made through the 2G network and 28 throughthe 3G For data traffic 91 of the traffic was assigned to 3G and 9 to 2G UL andDL data traffic proportions were respectively assumed to be 17 and 83 Thoseratios were calculated based on cell statistics that were obtained from the networkmanagement system on an hourly basis for same period of time Cells were same asthose used for identifying subscribers Finally three types of user profiles weredefined for voice and data service (see Figure 11 and Figure 12)bull heavy users top users consuming 80 of the total databull moderate users users consuming 15 of the total databull light users users consuming 5 of the total data
Table 13 details for different geographical areas the average voice communicationdurations and data traffic volumes per user profile
Figure 11 Distribution of the voice traffic for urban (red line) suburban (green line) and rural(black line) areas and aggregated over the 3 types of areas (blue line)
Document ID D28 Global Wireless Exposure Metric DefinitionFP7 Contract ndeg318273
Version V1 28Dissemination level PU
Figure 12 Distribution of the data traffic for urban (red line) suburban (green line) and rural(black line) areas and aggregated over the 3 types of areas (blue line)
The repartition of voice communications and data traffic over the two periods dayand night was extracted from the type of call statistics over 24h (see Figure 13 andFigure 14)The voice hourly extrapolation was based on outgoing calls and data extrapolationwas based on prepaid traffic due to limitations on the customer analytics system
Figure 13 Mobile phone voice communications hourly distribution over 24h
Document ID D28 Global Wireless Exposure Metric DefinitionFP7 Contract ndeg318273
Version V1 29Dissemination level PU
Figure 14 Mobile phone data traffic hourly distribution over 24h
63 of mobile phone voice and 48 data traffic were made during the day period(8 AM ndash 6 PM) and 37 and 52 respectively during the night period (6 PM ndash 8AM)Finally we could extract the average communication times and data traffic volumesper user profile for different geographical areas for 2G and 3G Telekom Srbjanetworks (see tables from 13 to 18)
2G (Telekom Srbja) Voice Data (83 DL 17 UL)
Urban tcom (s) volULdata [kB] volDLdata [kB]
Heavy user
Day 619 342 1660
Night 368 373 1807
Moderate user
Day 84 82 399
Night 50 90 434
Light user
Day 12 9 43
Night 7 10 47
Table 14 Average voice communication durations and data traffic volumes per user profile for a2G Telekom Srbja dense urban network
Document ID D28 Global Wireless Exposure Metric DefinitionFP7 Contract ndeg318273
Version V1 30Dissemination level PU
2G (Telekom Srbja) Voice Data (83 DL 17 UL)
Suburban tcom (s) volULdata [kB] volDLdata [kB]
Heavy user
Day 554 336 1828
Night 330 365 1773
Moderate user
Day 54 81 393
Night 32 88 428
Light user
Day 7 9 42
Night 4 9 45
Table 15 Average voice communication durations and data traffic volumes per user profile for a2G Telekom Srbja suburban network
2G (Telekom Srbja) Voice Data (83 DL 17 UL)
Rural tcom (s) volULdata [kB] volDLdata [kB]
Heavy user
Day 530 290 1406
Night 316 316 1531
Moderate user
Day 48 36 173
Night 29 39 188
Light user
Day 5 5 26
Night 3 6 28
Table 16 Average voice communication durations and data traffic volumes per user profile for a2G Telekom Srbja rural network
3G (Telekom Srbja) Voice Data (83 DL 17 UL)
Urban tcom (s) volULdata [kB] volDLdata [kB]
Heavy user
Day 242 3529 17119
Night 144 3843 18642
Moderate user
Day 33 848 4113
Night 20 923 4479
Light user
Day 5 91 441
Night 3 99 481
Table 17 Average voice communication durations and data traffic volumes per user profile for a3G Telekom Srbja dense urban network
Document ID D28 Global Wireless Exposure Metric DefinitionFP7 Contract ndeg318273
Version V1 31Dissemination level PU
3G (Telekom Srbja) Voice Data (83 DL 17 UL)
Suburban tcom (s) volULdata [kB] volDLdata [kB]
Heavy user
Day 216 3461 16791
Night 129 3769 18286
Moderate user
Day 21 836 4055
Night 13 910 4416
Light user
Day 3 88 429
Night 2 96 467
Table 18 Average voice communication durations and data traffic volumes per user profile for a3G Telekom Srbja suburban network
3G (Telekom Srbja) Voice Data (83 DL 17 UL)
Rural tcom (s) volULdata [kB] volDLdata [kB]
Heavy user
Day 207 2989 14498
Night 123 3255 15789
Moderate user
Day 19 368 1783
Night 11 400 1942
Light user
Day 2 55 266
Night 1 60 290
Table 19 Average voice communication durations and data traffic volumes per user profile for a3G Telekom Srbja rural network
Heavy users Moderate users Light users
Voice 47 25 28
Data 24 18 58Table 20 Repartition of user profiles for Telekom Serbia 2G and 3G voice and data usages
We can see that majority of voice communications at the test area in Serbia is doneover 2G contrary to what has been observed in Orange network Due to that reasonvoice communication is significantly lower on 3G than in the test area in FranceAverage data traffic volumes per user in France are a bit different than average datatraffic volumes at the test area in Serbia depending on the considered geographicalarea The repartitions of user profiles are also very different for voice usagesbetween Orange data and Telekom Serbia data A larger percentage of users areheavy users at Telekom Srbja while at Orange France there are more light users inthe test areas
Document ID D28 Global Wireless Exposure Metric DefinitionFP7 Contract ndeg318273
Version V1 32Dissemination level PU
3253 Extrapolation of 3G data to LTE
LTE data were collected from Orange network probes installed in Orange LTEnetwork For different geographical areas (urban suburban and rural) in the North ofFrance we could collect for some time periods during June 2014 the number of LTEusers and the total volumes of DL and UL data traffic Proceeding like we did for 3Gdata we extracted average user profiles (see Figure 15)
Figure 15 Distribution of data traffic aggregated over the 3 types of geographical areas for LTEnetwork
Then we evaluated the average volumes of LTE data traffic per day and per userprofile (see Table 21)
LTE network voldata [KB]
Heavy users 160639
Moderate users 60396
Light users 31003
Table 21 Average volumes of LTE data traffic per day per user profile
Comparing these data with data in Table 8 in the Global column we extract thefollowing 3G to LTE extrapolation ratios
Heavy user 22 Moderate user 87 Light user 615
The repartition of user profiles for Orange LTE data usages based on Figure 15 issummarized in Table 22
Heavy users Moderate users Light users
60 15 25 Table 22 Repartition of user profiles for Orange LTE data usages
Document ID D28 Global Wireless Exposure Metric DefinitionFP7 Contract ndeg318273
Version V1 33Dissemination level PU
This repartition is completely different compared to the repartition of user profiles forOrange 3G data usages The ratio between heavy usage and moderate usage is only25 for LTE while it is a factor 10 for 3G
326 IP traffic through WiFi
From [CISCO14] in 2014 9739 PB per month of IP traffic were generated byWestern Europeans and 4416 PB per month by Central and Eastern Europeans22 of the IP traffic was generated by tablets 35 by smartphones and 672 by PCs And about 41 of the total IP traffic was transmitted from FixedWiFiaccess
Considering that in Western Europe tablets were accounting for 6 (566 M) of allnetworked devices smartphones for 14 (2239 M) and PCs for 17 (2718 M) wecan evaluate the average IP traffic through WiFi per user per month for WesternEurope The same calculation was performed for Central and Eastern Europe (Table23)
Device Western Europe Central and Eastern Europe
smartphone 623 MB 410 MB
tablet 155 GB 22 GB
PC 99 GB 96 GBTable 23 Average IP traffic volumes through WiFi per device per user per month for Western
Europe and Central and Eastern Europe
We took the hypothesis that the UL traffic for WiFi represents 17 of the total datatraffic
327 Usage differences between the population categories
ICT usages are different depending on the age category of people The numbers inthe previous sections were extracted without distinction of the age category of usersWe are able nevertheless to play with the user profiles repartition For exampleconsidering a high school survey performed in Portugal between 2010 and 2014[SBOC12] teenagers were reported to use their mobile phone for voicecommunication an average of 30 minutes per day which corresponds to a heavyuser profile (see Figure 16) We could then consider a higher heavy user profilepercentage among young peopleIn [BYUN13] they assessed mobile phone usages in terms of number of calls per dayand average duration per call amongst Korean children and teenagers They haveshown that Korean children are on average using less than 5 minutes per day theirmobile phones for calling which would correspond to the usage for voice calls of amoderate userBesides in absence of any known study on the topic we are making the hypothesisthat a large percentage of seniors are light users
Document ID D28 Global Wireless Exposure Metric DefinitionFP7 Contract ndeg318273
Version V1 34Dissemination level PU
Figure 16 Distribution of Daily talk time by teenagers in Portugal (2378 3320 and 597answers in 201011 201112 and 201314 respectively)
We were obliged in the LEXNET project to fix precise numbers in order that to build areference scenario for EI assessment technical workpackages As explained abovesome result from statistical studies some others have been defined from basicassumptions
2G3GTelekom Srbja
Heavy users Moderate users Light users
Children Voice 25 50 25
Data 60 20 20
Young people Voice 47 25 28
Data 60 20 20
Adults Voice 47 25 28
Data 24 18 58
Seniors Voice 47 25 28
Data 5 25 70 Table 24 Repartition of user profiles for Telekom Serbia 2G and 3G usages for each population
category
3G Orange Heavy users Moderate users Light users
Children Voice 20 30 50
Data 50 40 10
Young people Voice 50 30 20
Data 50 40 10
Adults Voice 20 30 50
Data 10 20 70
Seniors Voice 20 30 50
Data 5 25 70Table 25 Repartition of user profiles for Orange 3G usages for each population category
0
5
10
15
20
25
30
35
DNK 0 1-9 10-19 20-29 30-59 60-119 ge120
Daily Talk time [minutes]
201011
201112
201314
Document ID D28 Global Wireless Exposure Metric DefinitionFP7 Contract ndeg318273
Version V1 35Dissemination level PU
LTE Orange Heavy users Moderate users Light users
Children 30 40 30
Young people 80 10 10
Adults 60 15 25
Seniors 10 40 50 Table 26 Repartition of user profiles for Orange LTE usages for each population category
33 SAR data
Reference SAR data were computed using 3D electromagnetic simulation platformsbased on the Finite Difference Time Domain (FDTD) [TAFLOVE00] and FiniteIntegration Technique (FIT) [WEIL77] methods SAR values were calculated for far-field and near-field exposure for two anatomical human body models of the VirtualFamily [CHRIST10] Duke a 34-year-old male and Eartha an 8-year-old girl Twopostures (standing and sitting) and three usages (mobile phone close to the headmobile phone or tablet for data and laptop usage) were selected More details onnumerical simulations can be found in [LEXNET IR21 2013]
Table 27 shows reference Whole-body SAR (WBSAR) values calculated for far-fieldand near-field exposure of the adult and the child models at four different frequencybands (see deliverable D26 Appendix 1 for specifications of frequency bands) Table28 shows reference WBSAR values calculated for exposure of the adult and the childmodels at 2100 MHz relevant for a human model standing or sitting close to theaccess point (this access point can be a femtocell or a WLAN access point)
WBSAR Frequency band
400 MHz 900 MHz 1940 MHz 2600 MHz
Child - voicesitting
DOWN 00088 00082 00071 00066
UP X 0029 0011 0014
Adult - voicesitting
DOWN 00050 00056 00043 00039
UP X 0012 00052 00047
Child - voicestanding
DOWN 00082 00084 00077 00071
UP X 0029 001 0015
Adult - voicestanding
DOWN 00064 00052 00046 00042
UP X 0012 00052 00053
Child - datasitting
DOWN 00090 00088 00071 00065
UP 0011 0011 00135 00094
Adult - datasitting
DOWN 00054 00046 00043 00038
UP 00078 00056 00081 00037
Child - datastanding
DOWN 00088 00090 00077 00072
UP 0013 001 00109 00083
Adult - datastanding
DOWN 0006 00052 00047 00042
UP 00064 00049 00039 00029
Child ndash laptopon the lap
DOWN X X 00069 00066
UP X X 00035 00038
Adult ndash laptop DOWN X X 00053 00049
Document ID D28 Global Wireless Exposure Metric DefinitionFP7 Contract ndeg318273
Version V1 36Dissemination level PU
on the lap UP X X 00027 0003
Child ndash laptopon a desk
DOWN X X 00069 00066
UP X X 00025 00031
Adult ndash laptopon a desk
DOWN X X 00053 00049
UP X X 00035 00027Table 27 Whole-body SAR data in Wkg for child and adult models for different devices in
different postures at different frequencies
WBSAR Femtocell (2100 MHz)Child ndash voice sitting 0000190Adult ndash voice sitting 000014Child ndash voice standing 000023Adult ndash voice standing 000013
Table 28 Whole-body SAR data in Wkg for child and adult models for a femtocell for differentpostures (reference transmitted power of 1 W)
UP stands for Uplink exposure to device) Values are normalized to a referencetransmitted power of 1 WDOWN stands for Downlink exposure to base-stations Values are normalized to areference received power density of 1 Wm-2
For the future we could imagine performing new SAR simulations for new new typesof wireless device For instance Appendix 1 presents the results of dosimetricsimulations performed with Google glasses [GLAS15]
Document ID D28 Global Wireless Exposure Metric DefinitionFP7 Contract ndeg318273
Version V1 37Dissemination level PU
4 EI INTEGRATION METHODOLOGY ON A MACRO 3G DENSE URBAN
SCENARIO
41 Scenario
We are showing in this section the EI integration methodology over 24 hours for amacro urban Orange 3G scenario
TimePopulatio
nEnvironment RAT
CellType
UserProfile
Posture Usage
Day Children Indoor 3G Macro Heavy StandingData
mobile
NightYoungpeople
OutdoorModerat
eSitting
Voicemobile
Adults LightDatatablet
Seniors Non userData
laptopTable 29 Input parameters for the macro urban Orange 3G scenario
The considered urban area is located into a typical European urban area in thecentre of Lyon (3rd largest city in France) (see Figure 17)
Figure 17 Urban area in Lyon
42 Input data
Time period Two time periods are considered the day time period from 8 am to 6 pm (10 hours intotal) and the night time period from 6 pm to 8 am (14 hours in total)
Population categories
Document ID D28 Global Wireless Exposure Metric DefinitionFP7 Contract ndeg318273
Version V1 38Dissemination level PU
4 population categories are considered Children (below 15 years) young people(between 15 and 29 years) adults (between 30 and 59 years) and seniors (over 60years)
Figure 18 Repartition by age of the population in the first district of Lyon in 2007 (from httphttpwwwcartesfrancefr)
From Figure 18 we extracted the repartition of the four population categories in thefirst district of Lyon
Populationcategory
Percentage
Children 139 Young people 328 Adults 382 Seniors 151 Table 30 Repartition of the population in the centre of Lyon
Environment ா
Two environments are considered indoor and outdoor environments Table 31 isderived from Table 4 considering that the time spent commuting is spent outdoor inour scenario
Day (from 8am to 6pm) Night (from 6pm to 8am)
Indoor Outdoor Indoor Outdoor
Children 8h15 (825) 1h45 (175) 13h45 (982) 15 min (18)
Young people 8h20 (83) 1h40 (17) 13h10 (94) 50 min (6)
Adults 8h15 (825) 1h45 (175) 13h05 (935) 55 min (65)
Seniors 7h35 (70) 2h25(30) 13h05 (935) 55 min (65)
Table 31 Repartition of each category of population by environment and time period
Consequently we are considering that 70 of mobile phone usages happen indoorsand 30 outdoors 100 of tablet and laptop usages are indoor usages
Macro 3G network ோ
Document ID D28 Global Wireless Exposure Metric DefinitionFP7 Contract ndeg318273
Version V1 39Dissemination level PU
User Profiles
Three user profiles (heavy moderate and light profiles) are used for mobile phoneusers and one moderate user profile for tablet and laptop users
Posture ௦ and Usage
Two network usages for the mobile phone are considered voice and data trafficusage If the mobile phone is used in indoor environment we consider that the useris in a sitting posture And if the mobile phone is used in outdoor environment weconsider that the user is in a standing posture For each population category wederived from Table 6 and Table 7 the proportions of users and non-users of mobilephones 3G tablets and 3G dongles (Table 32) Table 33 and Table 34 giverespectively average voice communication durations and data traffic volumes permobile phone user profile and the repartition of user profiles per population category
Children(under15 yo)
Youngpeople(15-29
yo)
Adults(30-59
yo)
Seniors(over 60
yo)
Mobile phone usageVoice communication
Non-users 68 4 5 30
Users 32 96 95 70
Mobile phone usageData traffic
Non-users 84 33 59 90
Users 16 67 41 10
3G Tablet usageNon-users 95 92 93 98
Users 5 8 7 2
3G dongle usageNon-users 98 90 90 93
Users 2 10 10 7Table 32 Proportions of users and non-users of mobile phones 3G tablets and 3G dongles perpopulation category
3G Voice Data (82 DL 18 UL)
Urban tcom (s) volULdata [kB] volDLdata [kB]
Heavy user
Day 841 4948 25124
Night 689 5879 31922
Medium user
Day 147 464 2390
Night 86 387 2001
Light user
Day 26 35 158
Night 16 28 124
Table 33 Average voice communication durations and data traffic volumes per mobile phoneuser profile
Document ID D28 Global Wireless Exposure Metric DefinitionFP7 Contract ndeg318273
Version V1 40Dissemination level PU
3G Orange Heavy users Moderate users Light users
Children Voice 20 30 50
Data 50 40 10
Young people Voice 50 30 20
Data 50 40 10
Adults Voice 20 30 50
Data 10 20 70
Seniors Voice 20 30 50
Data 5 25 70Table 34 Repartition of mobile phone user profiles for Orange 3G usages for each populationcategory
For 3G tablet usage we consider an average data traffic volume of 457 MB per dayper user whatever the population category 20 (91 MB) during day time and 80 (366 MB) during night time We are making the assumption that 15 of this traffic ison UL
For 3G dongle usage we consider an average data traffic volume of 816 MB per dayper user whatever the population category 50 (408 MB) during day time and 50 during night time As for the tablet we are making the assumption that 15 of thistraffic is on UL
Reference SAR values
SAR values are those extracted from Table 27 for the 1940 MHz frequency band Weuse adult values for young people adult and senior population categories and childvalues for child category
Received ோ transmittedത powers and UL data throughputs
Received ோ transmittedത powers and UL data throughputs can be derived fromnetwork simulation or from drive-test measurements in Lyon eg dosimetermeasurements for the DL power and TRACE mobile measurements for the ULpowerMean values indoor outdoor during the day and during the night are needed
43 EI integration
Considering Figure 7 we made the hypothesis that in 2016 48 of the population ofthe 1st district of Lyon is using a 3G network And considering the existence of fourtelecom operators in France we assumed that only 25 of these 48 3G users aresubscribers of the Orange 3G network
=ܫܧ 0139 lowast ௗܫܧ + 0328 lowast ௬௨ܫܧ + 0382 lowast +ௗ௨௧௦ܫܧ 0151 lowast ௦௦ܫܧ (4)
We propose to detail the calculation for one population category ie the adult oneTable 35 details the different macro urban 3G input parameters
Document ID D28 Global Wireless Exposure Metric DefinitionFP7 Contract ndeg318273
Version V1 41Dissemination level PU
Variable Abbreviation value
Time spent indoor during the day ௗ௬ௗݐ 29700 s
Time spent outdoor during the day ௗ௬௨௧ௗݐ 6300 s
Time spent indoor during the night ௧ௗݐ 47100 s
Time spent outdoor during the night ௧௨௧ௗݐ 3300 s
Mobile phone usage
Percentage of 3G connections ݎ ݐ ଷೞ 048
Percentage of mobile phone users for voicecalls
ݎ ݐ ௨௦௩ 095
Percentage of mobile phone users for datatraffic
ݎ ݐ ௨௦ௗ௧ 041
Average duration of mobile phone use indoorfor voice calls during the day
ௗ௬ௗ௩ݐ 15771 s
Average duration of mobile phone useoutdoor for voice calls during the day
ௗ௬௨௧ௗ௩ݐ 6759 s
Average duration of mobile phone use indoorfor voice calls during the night
௧ௗ௩ݐ 12012 s
Average duration of mobile phone useoutdoor for voice calls during the night
௧௨௧ௗ௩ݐ 5148 s
Average UL volume of mobile phone datatraffic indoor during the day
ݒ ௗ௧ௗ௬ௗ 42847 kB
Average UL volume of mobile phone datatraffic during the day
ݒ ௗ௧ௗ௬௨௧ௗ 18363 kB
Average UL volume of mobile phone datatraffic indoor during the night
ݒ ௗ௧௧ௗ 47943 kB
Average UL volume of mobile phone datatraffic during the night
ݒ ௗ௧௧௨௧ௗ 20547 kB
3G Tablet usage
Percentage of 3G tablet users ݎ ݐ ௨௦ଷ௧௧ 007
Average UL volume of tablet data trafficduring the day
ݒ ௧௧ௗ௬ 1365 kB
Average UL volume of tablet data trafficduring the night
ݒ ௧௧௧ 5490 kB
3G dongle usage
Percentage of 3G dongle users ݎ ݐ ௨௦ଷௗ 010
Average UL volume of laptop data trafficduring the day
ݒ ௧ௗ௬ 6120 kB
Average UL volume of laptop data trafficduring the night
ݒ ௧௧ 6120 kB
Reference SAR values
UL WBSAR for a phone call in voice modeindoor
ܤ ௩ܣ 00052 Wkg
UL WBSAR for a phone call in voice modeoutdoor
ܤ ௩௨௧ܣ 00052 Wkg
UL WBSAR for a phone call in data mode ܤ ௗ௧ܣ 00081 Wkg
Document ID D28 Global Wireless Exposure Metric DefinitionFP7 Contract ndeg318273
Version V1 42Dissemination level PU
indoor
UL WBSAR for a phone call in data modeoutdoor
ܤ ௗ௧௨௧ܣ 00039 Wkg
UL WBSAR for a laptop usage ܤ ௧ܣ 00035 Wkg
DL WBSAR indoor ܤ ܣ 00043 Wkg
DL WBSAR outdoor ܤ ௨௧ܣ 00047 WkgTable 35 Macro urban 3G scenario input data
ௗ௨௧௦ܫܧ = ܫܧ + ௨௧ܫܧ + ܫܧ + ௨௧ܫܧ (5)
ௗ௨௧௦ܫܧ = ଵ lowast തௗௗ௬௩ + ଶ lowast ത
௨௧ௗௗ௬௩ + ଷ lowast തௗ௧௩ + ସ lowast
ത௨௧ௗ௧௩ + ହ lowast
ത
+ lowast
തೠ
ೠ+ lowast
ത
+ lowast
തೠ
ೠ+ ଽ lowast RXindoorday + ଵ lowast RXoutdoorday + ଵଵ lowast RXindoornight + ଵଶ lowast
RXoutdoornight (6)
Whereത RXTh represent respectively mean transmitted power values mean
received power density values and average UL throughputs
ଵ to ସ are constant coefficients characterizing UL exposure for voice call usage
ଵ =ଶହlowast௧యಸೞ
ଶସlowastଷlowast ௗ௬ௗ௩ݐ] lowast ܤ ௩ܣ lowast ݎ ݐ ௨௦௩]
ଶ =ଶହlowast௧యಸೞ
ଶସlowastଷlowast ௗ௬௨௧ௗ௩ݐ] lowast ܤ lowast௩௨௧ܣ ݎ ݐ ௨௦௩]
ଷ =ଶହlowast௧యಸೞ
ଶସlowastଷlowast ௧ௗ௩ݐ] lowast ܤ ௩ܣ lowast ݎ ݐ ௨௦௩]
ଵ =ଶହlowast௧యಸೞ
ଶସlowastଷlowast ௧௨௧ௗ௩ݐ] lowast ܤ lowast௩௨௧ܣ ݎ ݐ ௨௦௩]
ହ to are constant coefficients characterizing UL exposure for data usage
ହ =025
24 lowast 3600lowast ൫ ݎ ݐ ଷೞ lowast ݎ ݐ ௨௦ௗ௧ lowast ݒ ௗ௧ௗ௬ௗ
+ ݎ ݐ ௨௦ଷ௧௧lowast ݒ ௧௧ௗ௬൯lowast ܤ ௗ௧ܣ+ ݎ ݐ ௨௦ଷௗ lowast ݒ ௧ௗ௬ lowast ௧൧ܤ
=025 lowast ݎ ݐ ଷೞ
24 lowast 3600lowast ݎ ݐ ௨௦ௗ௧ lowast ݒ ௗ௧ௗ௬௨௧ௗ lowast ܤ ௗ௧௨௧ܣ
=025
24 lowast 3600lowast ൫ ݎ ݐ ଷೞ lowast ݎ ݐ ௨௦ௗ௧ lowast ݒ ௗ௧௧ௗ
+ ݎ ݐ ௨௦ଷ௧௧lowast ݒ ௧௧௧൯lowast ܤ ௗ௧ܣ+ ݎ ݐ ௨௦ଷௗ lowast ݒ ௧௧lowast ௧൧ܤ
Document ID D28 Global Wireless Exposure Metric DefinitionFP7 Contract ndeg318273
Version V1 43Dissemination level PU
=025 lowast ݎ ݐ ଷೞ
24 lowast 3600lowast ݎ ݐ ௨௦ௗ௧ lowast ݒ ௗ௧௧௨௧ௗ
lowast ܤ ௗ௧௨௧ܣ
ଽ to ଵଶ are constant coefficients characterizing DL exposure
ଽ =ௗ௬ௗݐ lowast ܤ ܣ
24 lowast 3600
ଵ =ௗ௬௨௧ௗݐ lowast ܤ ௨௧ܣ
24 lowast 3600
ଵଵ =௧ௗݐ lowast ܤ ܣ
24 lowast 3600
ଵଶ =௧௨௧ௗݐ lowast ܤ ௨௧ܣ
24 lowast 3600
5 VARIABILITY AND UNCERTAINTIES
The EI is the output of an analytical model expressed by the equation (1) with anumber of uncertain input variables To propagate the uncertainty associated to theinput variables in the model the first step consists in characterizing the distribution ofinput variables Each uncertain variable input has to be described by a statisticaldistributionAverage DL power density and UL transmitted power are estimated using specificconfigurations environments and usages The downlink power absorbed by the userand the uplink power emitted by the device (and so partially absorbed by the user)depend on these configurations environments and usages Their statisticaldistributions have to be characterized in order to be incorporated in the total EIstatistical uncertaintyThe uncertainties of ICT usage data have been analyzed and modelled usingcomputable functions such as Gamma Gaussian or uniform distributions and asensitivity analysis has been carried out in order to determine the most importantparameters in the EI equation and how we could simplify the EI formula
51 Variability of the power transmitted by wireless personaldevices
In this subsection a methodology dedicated to characterize the variability of the
power radiated by wireless personal devices under specific propagation assumptions
is introduced
Studies focusing on SAR variability induced by sources generally did not take intoconsideration the impact of the propagation channel especially for an uplinktransmission In the framework of numerical dosimetric simulations for the LEXNETproject we analyzed the variability of the power radiated by wireless personal devicesunder specific propagation assumptions Interactions between the human body and
Document ID D28 Global Wireless Exposure Metric DefinitionFP7 Contract ndeg318273
Version V1 44Dissemination level PU
the antenna remain a complicated subject due to the high variability of theseparameters such as the type of antenna and the body shape These interactionshave been often investigated toward two disjoint objectives One is dedicated toanalyze the effect of the antenna radiation on the human body whereas the second isdevoted to study the effects of human body on the antenna performance In wirelesscommunications devices are usually placed close to the human body and as aconsequence part of the energy is necessarily absorbed The averaged SAR overthe whole body depends on many parameters such as the design of the antennaand its position with respect to the human body In our study we focused on both thequantification of the SAR and the statistical characterization of the variability of theradiated power We analyzed the influence of the positioning of the personal deviceagainst the human body on the SAR and the variability of the power radiated in bothLOS and NLOS (Non-line of Sight) scenariosDuring the communication the power radiated by the transmitter system dependsfundamentally on the gain in the LOS direction Since an antenna radiation pattern isusually anisotropic this parameter varies after each change in the transmitterorientation with respect to the base station For interference limitation reasons thetransmitted power is commonly adjusted to a minimum level consistent with apredetermined link quality Then the power radiated P
rmust be simultaneously
changed with the gain Ge (ϕLOS θLOS) in order to meet the requirements of receiver interms of signal to noise ratio (SNR) In practice assuming a constant noise powerthe received power (at the base station) must be such that the same SNR ismaintained in order to ensure a successful decoding This means that the product ofthe power radiated by the transmitting antenna (P
r) and of its power gain (Ge) in the
LOS direction should be constant
PrGe (ϕLOS θLOS) = α (7)
At first the personal device was assumed to be placed in a fixed position with respectto the userrsquos body Thus the userrsquos body and the personal device compose aninvariant transmitter system S The sphere surrounding the system S represents thesphere on which the various parts of a radiation pattern are calculated It is assumedto be fixed with respect to the base station while the system S can rotate alongazimuth and elevation angles The orientation of the system S with respect to the
base station axes is given by a random variable Ωs(S
S) where
Sand
Sare
respectively the angles of rotation of S around the vertical axis zrsquoOz and thehorizontal plane xOy (Figure 19)
Document ID D28 Global Wireless Exposure Metric DefinitionFP7 Contract ndeg318273
Version V1 45Dissemination level PU
Figure 19 Design concept
Figure 20 Comparison of radiation patterns of the laptop in free space and in the presence ofhuman body
Document ID D28 Global Wireless Exposure Metric DefinitionFP7 Contract ndeg318273
Version V1 46Dissemination level PU
Figure 21 Comparison of radiation patterns of the mobile phone in free space and in thepresence of human body
In the case of the laptop (Figure 20) the gain variation is smaller than the oneobtained in the mobile phone case (Figure 21) This can be explained by the fartherdistance between the 3G USB dongle and the human body The gain pattern isactually almost identical to the free space pattern as shown in the two planes Thesmall difference between both stems is due to reflection of waves by the body In thexz plane the effect of the left leg is observable around the direction θ = 270deg Since the exposure is proportional to the power radiated by the device whichdepends on many parameters a statistical analysis of this physical quantity isrequired in the modeling of the exposure Based on relationship (7) the powerradiated can be written in the following form
Pr =
ୋ ሺஐೞǡథಽೀೄǡಽೀೄ)(8)
where α is arbitrarily chosen equal to 1mW The gain Ge (Ω௦ǡைௌ θைௌ) depends on
the relative orientation (Ωs(S
S)) of the transmitter system with respect to the base
station To simplify computations S
and S
are assumed to follow a discrete uniform
distribution over [0deg 360deg] and [-45deg +45deg] respectively
Voice posture case
Figure 22 and Figure 23 show that the radiated power depends strongly on the localattenuation caused by the body shadowing effects It is very clear that it increaseslogarithmically with the attenuation level In this respect the quasi lognormalcharacter of the distribution is not surprising This statistical behavior remains typicalof Body Area Networks
Document ID D28 Global Wireless Exposure Metric DefinitionFP7 Contract ndeg318273
Version V1 47Dissemination level PU
Figure 22 Comparison between the empirical and the analytical distribution function obtainedwith the standing voice communication posture at 900 MHz
Figure 23 Comparison between the empirical and the analytical distributions function obtainedwith the sitting voice communication posture at 900 MHz
Between the two voice postures (standing and sitting) a small variation in theparameters of the distributions is noticed This is due to the fact that the antenna gainis mainly affected by the upper body portion The latter is not perfectly identical inboth postures in spite of the identical positions of the hand and the hand + head withrespect to the mobile phone This is due to a few constraints in building thecomputerized body models
Laptop posture case
In the case of laptop the variability of the radiated power is not very large The highpeaks of radiated power are up to 20mW which is smaller than those noticed withthe mobile phone These results can be explained by the fact that the 3G USBdongle is localized away from the human body (Figure 24)
Document ID D28 Global Wireless Exposure Metric DefinitionFP7 Contract ndeg318273
Version V1 48Dissemination level PU
Figure 24 Comparison between the empirical and the analytical distribution functions obtainedwith the laptop posture at 1940 MHz
During the post-processing a particular attention was given to the limitation of themaximum power that can be radiated by the mobile phone Particularly in the case ofGSM 900 MHz the average power radiated by the mobile antenna is always limitedto a threshold power of 250 mW
The results show that the performance of the antenna is significantly affected interms of radiation efficiency as well as shape of the radiation patterns especially inthe case of a mobile phone use for voice calls This observation is reflected by theabsorption of a huge amount of radiated power by the head and the hand and also bythe partial reflection of the waves by the body Furthermore the degradation of theradiation efficiency and the level of exposure level showed a (moderate) sensitivity tothe change in the position of the personal device with respect to the human bodyparticularly in the case of the laptopIn a wireless network context the exposure has been found to be strongly dependenton the local propagation environment owing to the power control enforced by mostwireless communications standards This was addressed by combining the Whole-body SAR value (calculated for a constant power) with a statistical distribution of theradiated power for various user positions expressing the dependence on theposition of the device with respect to the body and the impact of the propagationchannel (eg the number of paths their attenuation and the departure angles)
52 EI variability
The assessment of the EI is based on input parameters collected from surveyssimulations and measurements These input parameters can be divided into severalgroups as presented in section 3 ICT usage data have a great and direct impact onthe exposure duration And due to the complexity variability as well as confidentialityICT usage data are not easy to obtain and therefore to characterize Using the datacollected in the framework of LEXNET project a statistical analysis was performed inorder to characterize this variability Then a random sampling from probability
Document ID D28 Global Wireless Exposure Metric DefinitionFP7 Contract ndeg318273
Version V1 49Dissemination level PU
distributions of ICT usage data was realized in order to characterize the EI variabilityand uncertainty with respect to ICT usage data (we considered other groups of dataas constant values) by using Monte Carlo method
521 Statistical analysis of ICT usage data
We considered ICT usage data as twelve different input parameters summarized inTable 36 Based on daily traffic consumption recorded on the 3G network of Orangeeach parameter was well defined in order to characterize its statistical distribution
Input parameter Description
Htday Total voice call duration during the day for heavyusers
Mtday Total voice call duration during the day for moderateusers
Ltday Total voice call duration during the day for light users
Htnight Total voice call duration during the night for heavyusers
Mtnight Total voice call duration during the night formoderate users
Ltnight Total voice call duration during the night for lightusers
Hvolday Data traffic volume during the day for heavy users
Mvolday Data traffic volume during the day for moderate users
Lvolday Data traffic volume during the day for light users
Hvolnight Data traffic volume during the night for heavy users
Mvolnight Data traffic volume during the night for moderateusers
Lvolnight Data traffic volume during the night for light usersTable 36 ICT usage data represented by twelve different input parameters
In our study we used Akaike Information Criterion (AIC) in order to determinate thedistributions followed by the different input parameters This measurement isdeveloped using information theory for model selection It offers an estimation of therelative quality among some given statistical models for a set of data by evaluatingAIC value of each model From the equation below we can see that AIC depends onL (value of likelihood function for the model) and k (number of estimated parametersin the model) Great L will offer us a more accurate model but at the same time greatk may lead to overfitting
AIC=2k-2log(L) (9)
Hence AIC encourages the advantage of fitting (by maximizing L) while trying toavoid overfitting (by minimizing k) The preferred model is the one with the minimumAIC value In our study we tried to find the preferred model among a group ofcommon statistical models (Normal Lognormal Rayleigh Weibull ExponentialGamma Rician and Generalized Extreme Value) for our ICT usage data Thedistribution results for urban suburban and rural scenarios are shown in the followingtables
Document ID D28 Global Wireless Exposure Metric DefinitionFP7 Contract ndeg318273
Version V1 50Dissemination level PU
Input Parameter Distribution Param1 Param2 Param3
Htday GEV 3562696e-1 4532385e2 5123877e2
Mtday GEV -155576e-1 8922579e1 1566470e2
Ltday Weibull 4120504e1 1210874
Htnight Weibull 9040221e2 8753780e-1
Mtnight Weibull 1915478e2 1548896
Ltnight Weibull 3779658e1 1159748
Hvolday Weibull 3789408e3 6381982e-1
Mvolday Weibull 5900637e2 9674856e-1
Lvolday Lognormal 3137842 1304834e
Hvolnight Weibull 4513852e3 6264050e-1
Mvolnight Weibull 5412720e2 9230518e-1
Lvolnight Lognormal 3134336e 1306830Table 37 Distribution selection for usage data group of urban scenario
InputParameter
Distribution Param1 Param2 Param3
Htday Gamma 1199636 9934028e2
Mtday GEV -2085134e-1 1413730e2 2283643e2
Ltday Weibull 6628165e1 1126797
Htnight Weibull 8617700e2 8500429e-1
Mtnight Weibull 2164593e2 1176168
Ltnight Weibull 5217715e1 1032256
Hvolday Weibull 4215846e3 6954090e-1
Mvolday Gamma 1125814 7233229e2
Lvolday Lognormal 3793228 1459122
Hvolnight Gamma 7897441e-1 7881916e2
Mvolnight Lognomal 5680914 1529319
Lvolnight Lognormal 3567057 1434982Table 38 Distribution selection for usage data group of suburban scenario
InputParameter
Distribution Param1 Param2 Param3
Htday GEV 3992009e-1 4499851e2 5001061e2
Mtday GEV 5338537e-2 9253486e1 1497340e2
Ltday Weibull 4033680e1 1105567
Htnight Weibull 9138381e2 8435146e-1
Mtnight Weibull 1967658e2 1303428
Ltnight Gamma 110623 3172726e1
Hvolday Weibull 6086792e3 6560783e-1
Mvolday Weibull 9412760e+2 9226993e-1
Lvolday GEV 1329584 1645838e1 1283718e1
Hvolnight Weibull 7731316e+3 6842199e-1
Mvolnight Gamma 9888754e-1 1002908e3
Lvolnight Lognormal 3434330 1494722Table 39 Distribution selection for usage data group of rural scenario
Document ID D28 Global Wireless Exposure Metric DefinitionFP7 Contract ndeg318273
Version V1 51Dissemination level PU
For the 3G urban scenario as shown in Table 40 highest Sobolrsquo indices were foundfor the average time spent on voice call for heavy users during the day period andnight period and average data traffic volumes for heavy users during the day periodand the night period which means that for this specific scenario most influentparameters are data concerning heavy users
Parameter Sobolrsquo Indices
Htday
05874
Mtday
00077
Ltday
00046
Htnight
01812
Mtnight
00055
Ltnight
00044
Hvolday
01625
Mvolday
00054
Lvolday
00043
Hvolnight
01359
Mvolnight
00043
Lvolnight
00042
Table 40 Evaluated Sobolrsquo indices for each ICT usage parameter for the urban scenario
522 EI sensitivity analysis
Several input parameters are needed for EI calculation life segmentation datareference exposure data received (Rx) emitted (Tx) power data and personalwireless devices usage data So in order to integrate the real exposure of thepopulation in different considered scenarios these main parameters should beconsidered one after another In our study we aim to characterize the variability of EIwith respect to ICT usage data group (represented by the twelve parametersdescribed in Table 36) by using Monte Carlo method To this end a random samplingfrom probability distributions of usage data was realized and all the factors in otherthree data groups (life segmentation reference exposure and received (Rx) emitted(Tx) power data group) were considered as constant values and derived fromsurveys and simulations in order to launch Monte Carlo simulations
100000 sample sets data were considered to guaranty the large size simulationsneeded by Monte Carlo method However from our observation the results wereconverging after 25000 simulations The average global exposure (EI) was finallyconverging to 286e-7 Wkg for urban scenario 131e-7 Wkg for suburban scenarioand 143e-7 Wkg for rural scenario The mean estimated central tendency (blackline) and 95 confidence interval (grey zone) as functions of simulation iterationnumber for the three scenarios are shown in Figure 25 The standard deviation (σ)
Document ID D28 Global Wireless Exposure Metric DefinitionFP7 Contract ndeg318273
Version V1 52Dissemination level PU
for the three scenarios is also given in the same figure We obtain the averagevariation coefficients of 53 (urban) 43 (suburban) and 56 (rural) by dividing themean by the corresponding σ The important variation coefficients show that the global exposure is very sensitive due to the high complexity as well as high variabilityof ICT usage data
(a) Urban scenario
(b) Suburban scenario
(c) Rural scenarioFigure 25 Mean estimated central tendency (black line) and 95 confidence interval standard
deviation as a function of simulation iterations for urban (a) suburban (b) and rural (c)scenario
0 05 1 15 2 25 3 35 4 45 5
x 104
14
15
16
17
18
19
2
21
22x 10
-7
Iterations
EI
[Wk
g]
Standard deviation
0 05 1 15 2 25 3 35 4 45 5
x 104
4
45
5
55
6
65
7
75
8x 10
-8
Iterations
[Wk
g]
Standard deviation
0 05 1 15 2 25 3 35 4 45 5
x 104
7
75
8
85
9
95
x 10-8
Iterations
[Wk
g]
Standard deviation
Document ID D28 Global Wireless Exposure Metric DefinitionFP7 Contract ndeg318273
Version V1 53Dissemination level PU
6 CONCLUSION
In this final deliverable of WP2 concerning the global exposure metric the built metrichas been definedThe proposed metric called Exposure Index (EI) has the advantage to overpass thelimitations of the actual metrics that in fact are managing separately the exposureinduced by personal devices and the one induced by the network equipment (basestations and access points) But devices base station antennas and access pointsare definitely parts of the same wireless environment and the global wirelessexposure is induced by all of them
The EI is described with an analytical model with input variables describing thecoverage area of interest the accessible networks the population and the habits interms of location and of wireless devices usage The output is the EI covering theday-to-day averaged exposure of population in a given area incurred by an entirewireless network from base stations and access points to individual devices
The analytical model of the EI has been first detailed and the input variables definedThen we presented the EI integration methodology on a concrete example a macrodense urban 3G scenario We have shown that using all the input data collectedmeasured and simulated during the LEXNET project we are able to integrate themetric we built on a comprehensive scenario
First sensitivity analyses have shown that the EI is highly variable and depending onthe considered scenario is driven by some more influent input parameters
Finally a new human exposure index to EMF is available integrating peoplersquos lifesegmentation and ICT usages and combining both exposure from mobile devicesand exposure from base stations and access pointsThe EI as it is at the end of the LEXNET project is usable but could make a good useof simplification depending on the considered scenario
This new metric might in the future benefit different user groups such as telecomoperators as a Key Performance Indicator for network optimization nationalregulators as such a metric reflects the real global exposure of a population to RF-EMF We can expect also it would be used to feed health risk epidemiologicalstudies
Document ID D28 Global Wireless Exposure Metric DefinitionFP7 Contract ndeg318273
Version V1 54Dissemination level PU
7 REFERENCES
[BYUN13] Byun Y-H et al ldquoEpidemiological Characteristics of
Mobile Phone Ownership and Use in Korean Children and
Adolescentsrdquo Env Health and Toxicology vol 28
published online 2013
[Carte09] httpwwwcartesfrancefr
[CISCO14] Cisco Visual Networking Index Global Mobile Data Traffic
Forecast Update 2013-2018 February 2014 Last update
of the document can be found here
httpwwwciscocomcenussolutionscollateralservice-
providervisual-networking-index-vniwhite_paper_c11-
520862html
[CHLWW08] ConilE Hadjem A Lacroux F Wong M F and Wiart J
ldquoVariability analysis of SAR from 20 MHz to 24 GHz for
different adult and child models using finite-difference
time-domainrdquo Phys Med Biol vol 53 pp 1511-1525
2008
[CHRIST10] Christ A Kainz W Hahn E G Honegger K Zefferer
M Neufeld E Rascher W Janka R Bautz W Chen
J Kiefer B Schmitt P Hollenbach H-P Shen J
Oberle M Szczerba D Kam A Guag J W amp Kuster
N ldquoThe Virtual Family--development of surface-based
anatomical models of two adults and two children for
dosimetric simulationsrdquo Phys Med Biol vol 55 pp 23-
38 2010
[COOPER10] Cooper A R et al ldquoPatterns of GPS measured time
outdoors after school and objective physical activity in
English children the PEACH projectrdquo International Journal
of Behavioral Nutrition and Physical Activity Vol 7 Ndeg 31
2010
[CREDOC13] R Bigot P Croutte and E Daudey laquo La diffusion des
technologies de lrsquoinformation et de la communication dans
la socieacuteteacute franccedilaise (2013) raquo Dec 2013
[CSTM15] CST [Online] Available httpwwwcstcom [Accessed
Sep 2015]
[GCWW10] Gati A Conil E Wong MF Wiart J ldquoDuality between
uplink local and downlink whole body exposures in
Document ID D28 Global Wireless Exposure Metric DefinitionFP7 Contract ndeg318273
Version V1 55Dissemination level PU
operating Networksrdquo IEEE Transactions on EMC Vol 52
ndeg4 Nov 2010
[GLAS15] Google Glass [Online] Available wwwgooglecomglass
[Accessed July 2015]
[GRAB15] GrabCAD [Online] Available wwwgrabcadcom
[Accessed July 2015]
[HETUS06] C Aliaga ldquoHow is the time of women and men distributed
in Europe Statistics in focus population and social
conditionsrdquo Apr 2006
[HOFFERTH01] S L Hofferth et al ldquoHow american children spend their
timerdquo Journal of Marriage and the Family vol 63 Ndeg2
May 2001
[ICNI98] International Commission for Non Ionizing Radiation
Protection (ICNIRP) ldquoGuidelines for limiting exposure to
time-varying electric magnetic and electromagnetic fields
(up to 300 GHz)rdquo Health Physics Vol 74 nordm 4 Apr
1998 pp 494-522
[IEEE02] TC95_SC1 - Techniques Procedures Instrumentation
and Computation Working Group C953-2002 - IEEE
Recommended Practice for Measurements and
Computations of Radio Frequency Electromagnetic Fields
With Respect to Human Exposure to Such Fields 100
kHz-300 GHz IEEE 2002
[INSEE11] L Ricroch and B Roumier Enquecircte Emploi du
temps 2009-2010 laquo Depuis 11 ans moins de tacircches
meacutenagegraveres plus drsquoInternetraquo Insee Premiere Ndeg 1377
Nov 2011
[LARSON01] LarsonR W ldquoHow US Children and Adolescents SpendTime What It Does (and Doesnrsquot) Tell Us About TheirDevelopmentrdquo Current Directions in PsychologicalScience Vol 10 Ndeg 5 Oct 2001
[LARSON11] Larson L R et al ldquoChildrenrsquos Time Outdoors Resultsand Implications of the National Kids Surveyrdquo Journal ofPark and Recreation Administration Vol 29 Ndeg 2 2011
[LEXNET D21 2013] Vermeeren G Thielens A Aerts S Joseph W
Martens L Oliveira C Mackowiak M Correia LM
Pejanovic-Djurisic M Veljovic Z Nešković A
Koprivica M Gati A Varsier N Hadjem A Wiart J
Document ID D28 Global Wireless Exposure Metric DefinitionFP7 Contract ndeg318273
Version V1 56Dissemination level PU
ConilE ldquoD21 Current metrics for EMF exposure
evaluationrdquo LEXNET project April 2013
[LEXNET D22 2013] Wiedemann P M Freudenstein F ldquoD22 Risk and
exposure perceptionrdquo LEXNET project July 2013
[LEXNET D23 2013] Vermeeren G Plets D Joseph W Martens L Conil E
Varsier N Wiart J Corre Y Oliveira C Sebastiatildeo D
Correia LM Aguumlero R Diez L Rodriacuteguez L Koprivica
M Nešković A Popović M Milinković J Nikšić S ldquoD23
Scenariosrdquo LEXNET project November 2013
[LEXNET IR21 2013] ldquoNumerical toolsrdquo LEXNET project July 2013
[LEXNET D25 2014] Wiedemann P M Freudenstein F ldquoD25 Risk and
exposure perceptionrdquo LEXNET project November 2014
[NAGAOKA08] Nagaoka T and Watanabe S ldquoPostured voxel-based
human models for electromagnetic dosimetryrdquo Physics in
medicine and biology vol 53 pp 7047-7061 2008
[PLETS15] Plets D Joseph W Aerts S Vanhecke K
Vermeeren G Varsier N Wiart J and Martens L
ldquoAssessment of contribution of other users to own total
whole-body RF absorption in train environmentrdquo
Bioelectromagnetics (accepted)
[SBOC12] Sebastiao D Branco M Oliveira C and Correia L
MldquoUsage of mobile phones and concerns on
electromagnetic radiations of Portuguese youngstersrdquo
ICNIRP 7th International NIR Workshop 2012
[TAFLOVE00] Taflove A and Hagness S C 2000 Computational
Electrodynamics The Finite-Difference Time-Domain
Method 2nd edn (Boston MA Artech House Publishers)
[TNS10] TNS Sofres survey Observatoire Socieacutetal du teacuteleacutephone
mobile Dec 2010
[TVPO15] T V Population [Online] Available
httpwwwitisethzch [Accessed Sep 2015]
[WEIL77] WeilandT ldquoA discretization model for the solution of
Maxwells equations for six-component fieldsrdquo Electronics
and Communication Vol 31 Mar 1977 pp 116-120
[WIART08] Wiart J Hadjem A Wong M F and Bloch I Analysis of
RF exposure in the head tissues of children and adults
Document ID D28 Global Wireless Exposure Metric DefinitionFP7 Contract ndeg318273
Version V1 57Dissemination level PU
Physics in medicine and biology vol 53 pp 3681-3695
2008
Document ID D28 Global Wireless Exposure Metric DefinitionFP7 Contract ndeg318273
Version V1 58Dissemination level PU
8 MAIN PUBLICATIONS
Hadjem A Varsier N Conil E et al ldquoCharacterization of far-field and near-fieldexposure of the population for RF-EMF in realistic configurations of ICT usagesrdquoBEMS 2014
Plets D Joseph W Aerts S Vanhecke K et al ldquoPrediction and comparison ofdownlink electric-field and uplink localised SAR values for realistic indoor wirelessplanningrdquo Radiat Prot Dosimetry (2014) 162 (4) 487-498 doi 101093rpdncu019
Huang Y Krayni A Hadjem A Wiart J Person C and Varsier N ldquoComparison ofthe average global exposure of a population induced by a macro 3G network inurban suburban and rural areasrdquo URSI AT-RASC 2015
Krayni A ldquoCharacterization of the exposure induced by a wireless networkrdquo URSIAT-RASC 2015
Plets D Joseph W Vanhecke K et al ldquoJoint Minimization of Uplink and DownlinkWhole-Body Exposure Dose in Indoor Wireless Networksrdquo BioMed ResearchInternational vol 2015 Article ID 943415 9 pages 2015 doi1011552015943415
Varsier N Plets D Corre Y Vermeeren G Joseph W Aerts S Martens L andWiart J ldquoA novel method to assess the human population exposure induced by awireless cellular networkrdquo Bioelectromagnetics vol 36 ndeg6 pp 451-463 Sept 2015
Plets D Joseph W Aerts S Vanhecke K Vermeeren G Varsier N Wiart Jand Martens L ldquoAssessment of contribution of other users to own total whole-bodyRF absorption in train environmentrdquo Bioelectromagnetics (accepted)
Document ID D28 Global Wireless Exposure Metric DefinitionFP7 Contract ndeg318273
Version V1 59Dissemination level PU
APPENDIX 1 NUMERICAL DOSIMETRIC SIMULATIONS FOR GOOGLE
GLASSES
This appendix describes the results of SAR simulations for Google glasses[GLAS15] using a numerical simulation tool (CST Microwave Studio [CSTM15]) TheGlass is a pair of augmented reality glasses whose connectivity is assured by twowireless technologies Wi-Fi and Bluetooth in the 24 GHz band No cellular modulewas implemented on the prototype
These simulations have the aim of assessing the user exposure in the potentialscenario of using cellular technologies in the Glass prototype Accordingly SARvalues were evaluated for 900 MHz (GSM) 1940 MHz (UMTS) and 2600 MHz (LTE)
The Google glasses [GLAS15] were modelled using a CAD model [GRAB15] whichwas directly imported into CST Microwave Studio Figure A1
Figure A1 Google glasses CAD model [GRAB15]
As it can be seen from Figure A2 the Google glasses use a monopole whipantenna which was modelled in CST as a wire and a ground plane both made ofPerfect Electric Conductor (PEC) Figure A3 A small vacuum gap was introducedbetween them to insert a discrete port as the feeding point
Document ID D28 Global Wireless Exposure Metric DefinitionFP7 Contract ndeg318273
Version V1 60Dissemination level PU
Figure A2 Google Glass antenna [5]
Figure A3 ndash Google glasses modelled antenna
The antenna length was set using the Time Domain Solver Optimizer of CST tuned tominimise the S11 value at 2436 MHz The antenna optimisation process used theGoogle glass CAD model the modulated antenna and a head voxel model
The value of the S11 parameter is presented in Figure A4 Table A1 shows theGoogle glasses and the antenna main characteristics after optimisation
Document ID D28 Global Wireless Exposure Metric DefinitionFP7 Contract ndeg318273
Version V1 61Dissemination level PU
Figure A4 S11 for Google glasses antenna
Table A1 ndash Google glasses and antenna main characteristics at 2436 MHz
AntennaGoogleGlasses
Ground plane Wire GapS11[dB]
MaterialLength[mm]
MaterialLength[mm]
MaterialLength[mm]
Material
2519 PEC 2519 PEC 200 Vacuum -354Teflon(PTFE)
The computer used for the simulations contains a GPU NVIDIA TESLA C2050 thatsignificantly reduces the simulation time for scenarios with a maximum of 50 millionmesh cells Nevertheless the use of a full body voxel model would exceed this limitTherefore a voxel simulating only the head of a 26 years old woman [TVPO15] wasused Figure A5 It should be noted that the SAR values are only relevant in thehead regions near the antenna therefore validating this approach
Document ID D28 Global Wireless Exposure Metric DefinitionFP7 Contract ndeg318273
Version V1 62Dissemination level PU
Figure A5 ndash 26 years old woman voxel model (head) [TVPO15]
Simulations have been performed using the time domain solver and the automaticmesh generation of CST To achieve an accurate meshing a maximum mesh step of02 mm was defined for the antenna gap This implies that the automatic meshgenerator will not exceed this step width at the bounding box of the antenna gapFigure A6 shows the higher density mesh lines near the antenna gap (in blue)
Figure A6 ndash Mesh lines on the antenna gap
Document ID D28 Global Wireless Exposure Metric DefinitionFP7 Contract ndeg318273
Version V1 63Dissemination level PU
Figure A7 shows the mesh lines for the upper frequency of 3000 MHz whichresulted in 1086 million mesh cells
Figure A7 ndash Model mesh lines for the upper frequency of 3000 MHz
SAR calculations were performed using the averaging method according to the IEEEC953 standard [IEEE02] and the reference (radiated) power was set to thenormalised value of 1 W The SAR calculation at the different frequencies assumesthat there are no reflection lossesTable A2 presents the main parameters used in each simulation scenario Thesimulation frequency range setting is important for the meshing process and theresulting number of mesh cells and simulation time The use of a GPU results in asignificant reduced simulation time eg for the 900 MHz scenario the simulationtime was reduced around 5 times compared to the case when no GPU is usedThe MLW (Maximum number of Lines per Wavelength) value defines the upper limitof lines per wavelength of maximum frequency Increasing this number leads to ahigher accuracy but also increases the total calculation time The value was chosento achieve a trade-off between simulation accuracy and simulation time
Frequency[MHz]
FrequencyRange[MHz]
Mesh cells
AccelerationSimulation
TimeMLWSmallest
[mm]Largest
[mm]Number
[106]
900 500 ndash 1000 10 020 2890 116 2 Intel XeonE620240
GHz
GPU TeslaC2050
3 m 53 s
1940
1000ndash 3000 10 020 980 1086 1 h 0 m 58 s2600
Table A2 Simulation setup
Document ID D28 Global Wireless Exposure Metric DefinitionFP7 Contract ndeg318273
Version V1 64Dissemination level PU
The cutting planes presenting SAR values for the 900 and 2600 MHz are shown inFigure A8 and Figure A9 respectively One can observe the intuitive result thatmost of the energy is absorbed by the head region near to the antenna Moreover ahigher absorption of energy at the lowest frequency (09 GHz) is noticeable
Figure A8 Voxel cutting plane with SAR values for 900 MHz
Figure A9 Voxel cutting plane with SAR values for 2600 MHz
Table A3 shows the peak-spatial averaged SAR (psaSAR10g) and the whole headSAR values for each band
Frequency[MHz]
psaSAR10g[Wkg]
Whole head SAR[Wkg]
SAR CalculationTime
900 1314 0205 7 s
1940 1372 0128 10 m 51 s
2600 1051 0096 11 m 07 s
Table A3 SAR values
The values on Table A4 were evaluated for a radiated power of 1 W which wasused to normalise the results among the LEXNET partners but overestimates thereal typical exposure of 0125 W for UMTS and 01 W for LTE
Document ID D28 Global Wireless Exposure Metric DefinitionFP7 Contract ndeg318273
Version V1 65Dissemination level PU
The values of maximum radiated power (Pmax) to respect the maximumrecommended SAR value for the head (ie 2 Wkg [ICNI98]) are presented inTable A4 So one can see that for UMTS and LTE there are no problems ofexposure since the maximum radiated power that fulfils SAR requirements is abovethe maximum radiated by the devices in GSM the situation is different and in orderto respect the threshold the device will have to radiate a maximum quite below themaximum allowed for a device in general which can be implemented in the devicewithout problems
Frequency[MHz]
Pmax[W]
PeakMaximumEIRP Uplink [W]
GSM 900 0152 2000
UMTS 1940 0146 0125
LTE 2600 0190 0100
Table A4 Maximum radiated power for 2 Wkg SAR
Document ID D28 Global Wireless Exposure Metric DefinitionFP7 Contract ndeg318273
Version V1 66Dissemination level PU
APPENDIX 2 INTERNAL REVIEW
Reviewer 1 Mick Wilson Reviewer 2 Yoann Corre
Answer Comments Type Answer Comments Type
1 Is the deliverable in accordance with
(i) the Descriptionof Work
Yes
No
M
m
a
Yes
No
M
m
a
(ii) the internationalState of theArt
Yes
No
M
m
a
Yes
No
M
m
a
2 Is the quality of the deliverable in a status
(i) that allows tosend it to EC
Yes
No
M
m
a
Yes
No
M
m
a
(ii) that needsimprovement ofthe writing bythe editor of thedeliverable
Yes
No
Minor editorials onlysuggested
M
m
a
Yes
No
Minor modificationssuggested (mostlyeditorial corrections)
M
m
a
(iii) that needsfurther work bythe partnersresponsible forthe deliverable
Yes
No
M
m
a
Yes
No
M
m
a

Document ID D28 Global Wireless Exposure Metric DefinitionFP7 Contract ndeg318273
Version V1 6Dissemination level PU
1 INTRODUCTION
Wireless communications are being used in almost every aspect of daily life Theextremely rapid technological evolution results in dramatic changes in the usage ofthe wireless devices but not in the perception of the exposure induced by thesenetworks
On the one hand new devices and new generations of wireless networks have madea multitude of new applications popular These applications (used mainly withsmartphones) are consuming more and more data as illustrated in Figure 1[CISCO14]
Figure 1 Global mobile data per month traffic forecast by type of deviceSource Cisco VPN Mobile Forecast 2014
To support this increasing demand traditional macro-cellular networks are not welldimensioned anymore and new types of networks based on heterogeneoustopologies (including small cells) must be used to offload the data trafficThe deployment of new frequency bands and new technologies as LTE as well asthe growth of WiFi usage will help to support this demandAs illustrated on Figure 2 a massive small-cells deployment is forecast in the nextfew years
Document ID D28 Global Wireless Exposure Metric DefinitionFP7 Contract ndeg318273
Version V1 7Dissemination level PU
Figure 2 Worldwide small cells deployment forecast (figure on top) and public accessmetrocells deployment forecast (bottom figure) - Source Maravedis-Rethink RAN Research
Service
But paradoxically as the role of wireless communications in the daily life quicklyexpanded the public concern around EMF health risk grows just as much An in-depth survey has been conducted in the framework of LEXNET Data was collectedfrom April to June 2013 in France Germany Portugal Spain Romania Montenegroand Serbia using an online survey tool A total of 2392 respondents participated inthis survey (mean age 3482 years gender distribution 40 female and 60 male)The first part of the survey focused on the perceived sources of daily RF-EMFexposure of the respondents Additionally we were interested in the factors whichdetermine in their view the degree of EMF exposure Another part of the surveyregarded risk perception and health concernsOnly key findings are reported here but detailed description of the survey and of theresults is in the deliverable entitled ldquoD22 Risk and exposure perceptionrdquo [LEXNETD22 2013]
Regarding the perceived health hazards of various usage scenarios our respondentsevaluated base stations on a school roof as the most dangerous Using mobile phone
Document ID D28 Global Wireless Exposure Metric DefinitionFP7 Contract ndeg318273
Version V1 8Dissemination level PU
for calls is perceived as less dangerous a somewhat lower score characterizes thelaptop used on the lap The results of this survey indicate that risk perceptions of thegeneral public and the underlying health concerns are guided by subjective models ofEMF impact which underestimate near-field exposure and overestimate far-fieldexposure People are more concerned about base stations than about all other RF-EMF sources
Currently different metrics are used to deal with exposure induced by sources closeto the users as mobile phones and with exposure induced by far away sources asbase station antennasThe current state of existing metrics to evaluate the exposure induced by RF-EMFsources has been reviewed in the deliverable ldquoD21 Current metrics for EMFexposure evaluationrdquo [LEXNET D21 2013]Basically two types of metrics are distinguished the ones dedicated to the exposureinduced by sources close to the users as personal devices and expressed in termsof Specific Absorption Rate (SAR) and the ones focusing on the exposure induced byfar field sources as access points or base station antennas and currently expressedin ElectricMagnetic fields or Power DensityPersonal devices and base stations are too often represented as two separate worldswhen dealing with exposure issue But the connection between exposure induced bypersonal devices and base stations is indisputable Measurements on real networksillustrate a strong correlation (Figure 3) between the power emitted by personaldevices and the power received by personal devices from the base station antennas[GCWW10] The higher is the received power by the device the lower is the emitterpower by the device as illustrated by Figure 3
Figure 3 Duality between mobile phones emitted and received powers measured during voicecalls on the 3G Orange France network - source [GCWW10]
The project LEXNET aims at filling the gap between these two separate ways ofdealing with exposure by proposing a new exposure metric named Exposure Index(EI) The EI is assessing the average exposure of a population induced by bothpersonal devices and base stations (or access points) The concept is to average thisglobal exposure over space by assessing the EI in a given area and average it overtime by considering a given time frame Therefore an important question that the
-60 -40 -20 0 20 40
-120
-100
-80
-60
-40
Emitted power by devices (dBm)
Rec
eive
dpo
wer
by
devi
ces
(dB
m)
GSM 900
GSM 1800
UMTS 2100
Document ID D28 Global Wireless Exposure Metric DefinitionFP7 Contract ndeg318273
Version V1 9Dissemination level PU
project must absolutely address is about the understandability and acceptability ofthis new exposure metric by the general publicA second survey has been therefore conducted in the framework of LEXNET Datawere collected from July to September 2014 in France Germany United KingdomPortugal Spain Romania and Serbia among a representative sample of the generalpopulation A total of 1809 respondents participated in this second surveyAn important part of the survey focused on how people are considering strategiesproposed in the framework of the LEXNET project to define and minimize thepopulationrsquos exposure to electromagnetic fieldsOnly key findings are reported here but detailed description of the survey and of theresults is in the deliverable entitled ldquoD25 Risk and exposure perceptionrdquo [LEXNETD25 2014]
When asked about adding up the exposure from personal wireless devices and theexposure from base stations when evaluating the exposure of people to EMF morethan 90 of respondents agreed on the fact that both downlink and uplink exposuresshould be considered when evaluating the population exposure to EMFA large percentage of respondents also agreed when asked if it makes sense tocharacterize the day-to-day exposure to EMF by averaging it over time or if they thinkthat an individual exposure to EMF can be approximated by measuring the exposureover a large population
The next chapter of this deliverable describes the Exposure Index proposed by theproject LEXNET
Document ID D28 Global Wireless Exposure Metric DefinitionFP7 Contract ndeg318273
Version V1 10Dissemination level PU
2 THE EXPOSURE INDEX
21 Key concept
The Exposure Index (EI) takes into account the global EMF exposure of a populationto a given wireless telecommunication network (or a set of networks) The EI in theframework of LEXNET project does not take into account the exposure induced byother RF sources such as Frequency Modulation (FM) radio or digital terrestrialtelevision transmitters However the EI was designed as a future-proof metric andother RF sources could completely be taken into account if neededIt covers the exposure of a population during a given time frame in a given areaincurred by a wireless telecommunication network as a whole aggregating thedownlink exposure induced all day long by base stations and access points and theuplink exposure incurred by individual wireless communication devices The uplinkexposure can be subdivided in exposure due to the uplink of the userrsquos own deviceand the uplink of devices operated by other users nearbyIn order to assess the realistic exposure of a population many parameters influencingthe exposure need to be taken into account in the Exposure Index age (adult andchild exposure are different [CHLWW08] [WIART08]) posture [NAGAOKA08] usagetechnology environment etc
In a nutshell the LEXNET Exposure Index is a function transforming a highlycomplex set of data into a single parameter which has two key benefits it isunderstandable acceptable and usable for all the stakeholders from general publicto regulatory bodies and it is linked in a tangible way to the network operatingparameters
The EI is built from the aggregation of individual exposure contributions generated bya specific exposure source in specific exposure situations For instance an averagedindividual exposure generated by WiFi 24 GHz can be calculated at day time for anadult heavy-user located indoors sitting and with a tablet The same kind ofindividual exposure is estimated for other time periods RATs populationsenvironments usages and postures to get complete elements that compose the EIThe individual exposure contributions are weighted according to theirrepresentativeness before aggregation A complete example of EI integration is givenin section 43The individual exposure is the sum of a down-link (DL ndash generated by surroundingbase stations and access points) and up-link (UL ndash generated from personal mobiledevices) components as explained with more details in section 221
The EI is computed in a given area from the aggregation of individual exposurecontributions in a chain of exposure (see Figure 4) The nodes in this chain arerelated to different exposure sources or exposure situations
bull time periods as the configuration of the network and type of usage depend onthe time of day (low-load night-time vs heavily loaded peak-hour)
bull population category as different population categories will have different lifesegmentations and different usages of wireless devices
bull user profile
Document ID D28 Global Wireless Exposure Metric DefinitionFP7 Contract ndeg318273
Version V1 11Dissemination level PU
bull location as the exposure configurations will be different in differentenvironments typically indoors and outdoors
bull radio access technologies RATs (GSM UMTS LTE WiFi etc) frequencybands and deployment layers (macro micro and femto cells) that usersconnect to
bull posture as different body postures will lead to different absorption rates in thehuman body
bull device usage as for example making a phone call does not lead to the sameexposure as downloading data
Figure 4 the LEXNET chain of exposure
Different exposure scenarios [LEXNET D23 2013] are considered and aggregatedby putting weights on each configuration thereby determining the EI A partial EI canbe for example computed for a scenario that considers only a subset of RATspopulation environment etc Then several partial EI can be aggregated with aweight related to their representativenessEI takes into account different parameters coming both from the telecom world todescribe the accessible network environment and from data on how people segmenttheir life to describe how people are using this network
22 Mathematical formalization
221 Exposure Index Equation
The Exposure Index is calculated for a finite geographical area that must preferablybe homogeneous in terms of population and network usage it can be of urbansuburban or rural type for instanceThe general formulation of the Exposure Index contains a set of technicalparameters as described below The number of values classes or settings of eachparameter depends on the level of detail of the available data and on the level ofachievable complexity in terms of calculation For a given geographical area the EItakes the following into account (see also Table 1)
Document ID D28 Global Wireless Exposure Metric DefinitionFP7 Contract ndeg318273
Version V1 12Dissemination level PU
time period (t) eg day and night population (p) segmented into different categories eg children (under 15
yo) young people (15-29 yo) adults (30-59 yo) and seniors (60 yo andover)
user load profiles (l) eg heavy medium light or non-users environment (e) eg indoor (office home) outdoor and in commuting
(bus car subway etchellip) different available Radio Access Technologies (RATs) (r) eg 2G (900
MHz and 1800 MHz) 3G 4G WiFi the number of RATs depends on thescenario
different cell types (c) eg macro micro pico and femto cells theaccessibility to the different cell types depends on the scenario
posture (pos) eg sitting standing usage (u) is described by the device (eg mobile PC laptop) and the
service (eg voice call data)
TimePopulatio
nUser
ProfileEnvironme
ntRAT Cell Type Posture Usage
Day Children Heavy Indoor 2G Macro Standing Voice mobile
Night Youngpeople
Medium
Outdoor 3G Micro Sitting Data mobile
Adults Light Commuting 4G Pico Data Tablet
Seniors Nonuser
WiFi Femto Data Laptopon the laps
Data Laptopon the desk
Table 1 input variables in the modelling of the EI
The individual exposure contributions rely on the SAR expressed in Wkg The SARdepends on the device the frequency band the morphology and the posture of theuser as well as on the position and distance of the source with respect to the user Aspart of LEXNET a set of numerical dosimetric simulations have been performed inorder to fill out a comprehensive matrix of raw normalized SAR values calculated fora reference transmitted power (near-field exposure) or a reference received powerdensity (far-field exposure) These SAR values can be whole-body or localized SARvalues Whole-body SAR values are evaluated by averaging SAR over the whole-body whereas localized SAR values are values focusing on a body volume specificorgan or tissue Different EI can be evaluated depending on the value of interest(whole-body or localized value)Network measurements or simulation tools are expected to provide transmitted andreceived power density average values to apply to the raw SAR matrixInformation and Communication Technologies (ICT) usage data obtained throughsensors inside the network and segmentation life data will finally provide the levels toapply for the evaluation of the EIIt was decided to build the EI based on the dose (SAR x duration of exposure) even ifthere is no evidence today of a higher correlation between the dose and anyhypothetical health effect than with instantaneous peak SAR
Document ID D28 Global Wireless Exposure Metric DefinitionFP7 Contract ndeg318273
Version V1 13Dissemination level PU
SARܫܧ =1
T
tperlcpos ൫ ത
൯
ே
௨
ேೞ
௦
ேಽ
ே
ேೃ
ேಶ
ேು
ே
௧
+ RXinc + ௦ௗ௩௦ோ௦ௗ௩௦
W
kg൨
(1)
where EISAR is the Exposure Index value the average exposure of the population of
the considered geographical area over the considered time frame T SARrefers to whole-body SAR organ-specific SAR or localized SAR
is the number of considered periods within the considered time frame (egsingle day)
is the number of considered Population categories ா is the number of considered Environments ோ is the number of considered Radio Access Technologies is the number of considered Cell types is the number of considered user Load profiles ௦ is the number of considered Postures
is the number of considered Usages with devices ത
is the mean TX power transmitted by the usersrsquo devices during the periodݐ in usage mode ݑ connected to RAT r in environment For example whenEI is computed from simulation tools the TX power can be predicted over amap that covers the whole considered geographical area and the averagevalue is extracted for the EI evaluation See details in section 223
ோis the mean incident power density on the human body during the periodݐ induced by RAT ݎ in environment A distribution of the incident powerdensity for the whole considered geographical area is considered and theaverage value over this area is taken into account for the EI evaluation
ோ௦ௗ௩௦ is the incident power density on the human body during the
period t induced by a wireless device connected to RAT r of a user in theproximity in environment e This term is important when the exposed personis the user itself it can also be significant for persons in the proximity of usersof a wireless device for instance in a crowded meeting room in publictransportation etc In the applications discussed in this paper this term is
neglected We also remark that ோ௦ௗ௩௦ depends on the orientation of
the user of the wireless device with respect to the body of the people in itsproximity See details in section 223
( ୱ
୩W) ௦ௗ௩௦ (
ୱ
୩
୫ మ) and ( ୱ
୩
୫ మ ) are the normalised
raw dose values for UL the DL from the user in the proximity and DL frombase stations and access points respectively all multiplied by the time spentin the configuration See details in section 222
Document ID D28 Global Wireless Exposure Metric DefinitionFP7 Contract ndeg318273
Version V1 14Dissemination level PU
௧௦ is the fraction of the total population that corresponds to populationcategory p user load profile l in posture pos connected to RAT r for a celltype c in environment e during the time period t
In the following we explain the different terms used in the EI formula in more detail
222 Coefficients and
The coefficient is associated to the exposure induced by the uplink andexpressed as an absorbed dose normalised to a transmitted power of 1 W
[ୱ୩
]
=௧௨௦[ୱ]ܦ
௨௦[ܣ ୩]
[ ]
Ws
kgW൨ (2)
where ௧௨௦ܦ
is the time duration of usage ݑ and a user profile load when
connected to the RAT ݎ operating in cell type in the environment for thepopulation category in the posture pos during the time period of the day ݐ
ௌோೠೞ
ಽ
can be the whole body or an organ-specific or tissue-specific
valueܣ for the usage ݑ and the posture pos in the frequency band of theRAT ݎ and the population category calculated for an incident emitted power
of
and normalized to this power
The coefficient is associated to the exposure induced by the downlink and alsoexpressed as an absorbed dose normalised to an incident power density of 1 Wm2
[ୱ୩
]
=௧௦[ୱ]ܦ
௦[ܣ ୩]
RX[W]inc
Ws
kg
W
mଶ൨ (3)
where ௧௦ܦ
is the time duration of posture ݏ when connected to the RAT ݎ
operating in cell type in the environment for the population during thetime period of the day ݐ
ௌோೞ
ವಽ
ௌೃ can be the whole body or an organ-specific or tissue-specific
valueܣ induced by the base station or access points of the RAT ݎ in thepopulation for the posture ݏ normalized to the received power density
ோ
223 Transmitted power ഥ and received power density ത ܖ
ത is the average power transmitted by the device in busy mode (in active
communication) It should be noted that even in idle mode (not for activecommunication) the devices transmit from time to time some power (to stay
Document ID D28 Global Wireless Exposure Metric DefinitionFP7 Contract ndeg318273
Version V1 15Dissemination level PU
synchronized with the network for example) but the exposure induced by the devicein idle mode is negligible as it is based on rare events is the average power density incident on the human body from the base stationsor access points of the RAT The incident power density is assessed not only forusers of mobile devices but also for non-users It is assumed that the usage patternof the user considered in the EI formula does not influence the average incidentpower density From a theoretical point of view is the average incident powerdensity integrated over all the frequency bands of the RAT and cell type consideredFrom a practical point of view can be assessed directly from spectrum analyzer(SA) measurements dosimeters simulations and indirectly from the received poweron a user device or in a drive test measurementത and Sത୧୬ୡ average out the instantaneous variations of the transmitted power and
incident power density that arise during a communication These variations occurwhen the user is static or moving over a very small distance and are caused bydifferent phenomenas (power regulation small-scale fading resource allocation usertraffic variations etc) Values that will be used in the EI evaluation are averagedvalues over the whole considered geographical area
For both the evaluation of the DL incident power density and UL transmitted powerthe ressource allocation or duty cycle of the system has to be taken into account TheEI computation does not rely on maximum allowed power values (as in existing EMFexposure procedures) but on the incident and transmitted powers that respectivelydepend on the DL network and UL user resource load This definition leads to anestimate of the UL transmitted power that necessarily depend on the type of usertraffic (eg voice web browsing file upload etc) the higher is the instantaneous ULthroughput during the communication the higher is generally the UL transmittedpower
224 Exposure from close users
To account for all possible exposure situations in the EI equation (1) we also have toinclude the exposure induced in persons close to an active device operated by a thirdperson This happens for instance in crowded places public transportation andmeeting rooms The exposure is typically induced by a mobile phone laptop or tabletThe exposure induced by nearby active devices can be viewed as a downlinkexposure at the persons in the proximity (see 3rd term in the EI equation (1)) even ifgenerated by an uplink transmission since it would be treated as a far-field exposureThe contribution of radio-frequency radiation originating from other peoplersquos deviceshas been studied in [PLETS15] This contribution has been compared to the totalpersonal absorption in a train environment They found that the absorption fromnearby active mobile devices cannot always be neglected in a GSM macrocellconnection scenario UL of 15 other users can cause up to 19 of total absorptionfor users having themselves a call and up to 100 for non-active persons In anUMTS femtocell connection scenario UL of 15 other users contributes to totalabsorption of a non-active person for no more than 15 Hence in exposuresituations where mobile devices are operated in close proximity of other persons orusers the 3rd term in the EI equation might be non-negligible
Document ID D28 Global Wireless Exposure Metric DefinitionFP7 Contract ndeg318273
Version V1 16Dissemination level PU
3 EXPOSURE INDEX COMPUTATION DATA SOURCES
The EI evaluation relies on the collection of a wide range of data from simulationtools literature models and measurement equipment that have been demonstratedin the LEXNET technical work-packages All the input data that were collected andwere used in the framework of the project are detailed below
31 Life segmentation data
Life segmentation data were extracted from up-to-date life segmentation surveysperformed in the countries involved in LEXNET
In order to evaluate the Exposure Index we needed data for each of the consideredpopulation categories children (under 15 yo) young people (15-29 yo) adults (30-59 yo) and seniors (60 yo and over)
How young people adults and seniors spend their time in Europe was extracted fromthe HETUS survey [HETUS] the French INSEE survey [INSEE] and the time usesurvey in Republic of Serbia [Survey-Serbia] (see Table 2)
Adults Young people Seniors
Gainful work study 500 440 005
Domestic work 300 115 400
Travel 130 120 0050
Sleep 815 900 845
Meals personal care 215 245 330
Free time indoor (TVsocializing readinginternet surfing)
300 400 430
Free time outdoor (sportsgardening hiking)
100 100 220
Total 2400 2400 2400
Table 2 How young people adults and seniors spend their time in Europe
How children spend their time in Europe was extracted from [HOFFERTH01][LARSON01] [LARSON11] and [COOPER10] (see Table 3) Average daily timespent at school or day care for domestic work sleeping eating and personal carewere deduced from [HOFFERTH01] and [LARSON01] Then it was difficult to extractthe free time indoor and outdoor as categories in [HOFFERTH01] do not precise ifactivities such as ldquoother passive leisurerdquo are outdoor or indoor activities From[LARSON11] we could extract that American children spend in average 2h per daydoing outdoor activities From [COOPER10] we could deduce that UK children spendin average 45 min per day outdoor between 330 and 830 PM
Document ID D28 Global Wireless Exposure Metric DefinitionFP7 Contract ndeg318273
Version V1 17Dissemination level PU
Children
School-Day care 345
Domestic work 045
Travel 030
Sleep 1040
Meals personal care 2 30
Free time indoor (TVplaying reading internetsurfing)
435
Free time outdoor 130
Total 2400
Table 3 How children spend their time in Europe
Extracted from Table 2 and Table 3 the data required in EI equation is reported inTable 4
Populationcategory
Day (8 AM-6 PM) Night (6 PM- 8AM)
Indoor(office-school-home)
Outdoor
Transportation (bus carsubwayetchellip)
Indoor(home)
Outdoor
Transportation (bus carsubwayetchellip)
Adults8h15(825)
1h10(115)
35 min
(6)
13h05 min(935)
20 min(25)
35 min
(4)
Youngpeoplestudents
8h20(83)
1h10(115)
30 min
(55)
13h10 min(94)
20 min(25)
30 min
(35)
Children8h15(825)
1h30 (15)
15 min
(25)
13h45 min(985)
0 min
(0 )
15 min
(15)
Seniors7h35(758)
2h10(217)
15 min
(25)
13h05 min(935)
40 min(5)
15 min
(15)
Table 4 Life segmentation inputs for evaluation of the Exposure Index
32 ICT usage data
321 When and where
Figure 5 and Figure 6 show that we are generally using different wireless devices atdifferent time of the day and in different locations Laptops are used in indoorlocations whether at the office or at home Tablets are preferred at home at nightwhereas mobile phones are used throughout the day with a high usage duringcommuting
Document ID D28 Global Wireless Exposure Metric DefinitionFP7 Contract ndeg318273
Version V1 18Dissemination level PU
Figure 5 Devices preferences throughout the day (Source comScore devices EssentialsJanuary 2013)
Figure 6 How and when we use our mobile phones (Source TNS Mobile Life survey)
Crossing this kind of information extracted from survey and life segmentation datawe can assume that about 100 of laptop or tablet usages happens indoors 70 of phone usages is indoors 20 when commuting and 10 outdoors
Document ID D28 Global Wireless Exposure Metric DefinitionFP7 Contract ndeg318273
Version V1 19Dissemination level PU
We also draw the conclusion that 50 of laptop usage happens during the day (from8 AM to 6 PM) and 50 during the night (from 6 PM to 8 AM) For tablet usage weconsider that 20 of the usage happens during the day and 80 during the night
For WiFi usage we make the hypothesis that 100 of wireless device usageshappen indoors
322 Connections per RAT
As shown in Figure 7 (from [CISCO14]) it is forecasted that in 2016 the 4Gconnections will represent 8 of the mobile connections whereas 2G and 3G willrespectively represent 48 and 44 of the connections
Figure 7 Connections by RAT forecast
Figures are a bit different depending on regions As shown on the table belowextracted from [CISCO14] the 4G connections are expected to represent 24 ofmobile connections in 2018 in Western Europe whereas they will represent only 10 of the connections in Central and Eastern Europe
Document ID D28 Global Wireless Exposure Metric DefinitionFP7 Contract ndeg318273
Version V1 20Dissemination level PU
Table 5 Life segmentation inputs for evaluation of the Exposure Index
This forecast is used as a baseline scenario in some of our studies Then promotingchanges in the RAT percentages can be envisaged as a way to reduce the EI
323 Usersnon-users per population category
Using 2013 data on the equipment rates of classical mobile phones and smartphonesand proportions of the French population using a mobile phone for websurfingextracted from the 2013 CREDOC (Centre de Recherche pour lrsquoEtude etlrsquoObservation des Conditions de vie) report [CREDOC13] and data extracted from aMarch 2014 Ipsos survey entitled ldquoLes nouveaux usages des moins de 20 ansrdquo weevaluated the proportions of users and non-users of mobile phones for voicecommunications and data traffic per population category (see Table 6) For childrenunder 8 years old we make the assumption that they are not wireless device users
Mobile phoneusage
Children(under8 yo)
Children(8-12yo)
Children(12-15
yo)
Youngpeople(15-29
yo)
Adults(30-59
yo)
Seniors(over 60
yo)
Voicecommunication
Non-users
100 60 10 4 5 30
Users 0 40 90 96 95 70
Data traffic Non-users
100 90 45 33 59 90
Users 0 10 55 67 41 10
Table 6 Proportions of users and non-users of mobile phones per population category
Using data on the equipment rates of tablets 3G dongles and laptops from[CREDOC] and the March 2014 Ipsos survey we deduced the proportions of usersand non-users of tablets 3G dongles and laptops per population category (see Table7)
Document ID D28 Global Wireless Exposure Metric DefinitionFP7 Contract ndeg318273
Version V1 21Dissemination level PU
Children(under8 yo)
Children(8-12yo)
Children(12-15yo)
Youngpeople(15-29yo)
Adults(30-59yo)
Seniors(over 60yo)
TabletsNon-users
92 81 7877 79 94
Users 8 19 22 23 21 6
3G donglesNon-users
100 100 9290 90 93
Users 0 0 8 10 10 7
LaptopsNon-users
100 100 2122 34 67
Users 0 0 79 78 66 33Table 7 Proportions of users and non-users of tablets 3G dongles and laptops per population
category
324 Tablets and laptops usage data
From [CISCO14] in 2013 the average worldwide mobile data traffic per tablet (from3G and 4G tablets) was 137 GB per month and 24 GB per month for a 4G tabletFrom subscribers billing data collected in January 2014 in Serbia we could derive anaverage monthly traffic per tablet of 083 GBFigure 8 extracted from [CISCO14] gives cellular vs WiFi only tablets ratios
Figure 8 Cellular vs WiFi tablets ratio
From [CISCO14] in 2013 the average mobile data traffic per laptop was 245 GB permonthFrom subscribers billing data collected in January 2014 in Serbia we could derive anaverage monthly traffic per laptop of 34 GB in Serbia
Finally we took the hypothesis that the UL traffic for tablets and laptops represents 15 of the total mobile data traffic
Document ID D28 Global Wireless Exposure Metric DefinitionFP7 Contract ndeg318273
Version V1 22Dissemination level PU
325 Mobile phone usage data
3251 3G data from Orange
Mobile phone usage data were collected through an access network probe localizedat the RNC (Radio Network Controller) level in the 3G Orange France network Threeareas have been monitored one urban area in a district of Paris one suburban areain the region of Clermont-Ferrand and one rural area in the region of Nancy
Extracted data gives per-user and per-hour measurements during one weekbull total duration of voice callsbull number of voice callsbull total duration of UL data sessionsbull number of UL data sessionsbull total volume of UL data sessionsbull total duration of DL data sessionsbull number of DL data sessionsbull total volume of DL data sessions
Averaged daily profiles have been extracted for voice and data services (Figure 9)
Document ID D28 Global Wireless Exposure Metric DefinitionFP7 Contract ndeg318273
Version V1 23Dissemination level PU
Figure 9 Illustration on time variation of mean voice (top figure) and data (bottom figure)usage per user over a day Data have been collected in urban suburban and rural areas during
a week in November 2013 on the 3G Orange France network
The usage is also completely unbalanced among all the users A small number ofusers are consuming a large part of traffic whatever the type of area as illustrated onFigure 10
0 8 12 18 230
01
02
03
04
05
06
07
08
09
1
Hour
Min
ute
Mean Voice Usage in Munites per User During Daily Hours
Urban
Suburban
Rural
Aggregated
0 8 12 18 230
100
200
300
400
500
600
700
Hour
KB
Mean Volume of Data Exchanged in KB per User During Daily Hours
Urban
Suburban
Rural
Aggregated
Document ID D28 Global Wireless Exposure Metric DefinitionFP7 Contract ndeg318273
Version V1Dissemination level PU
Figure 10 Distribution of the voice (toline) suburban (green line) and rura
Three types of profiles were definedbull heavy users top users cobull moderate users users cobull light users users consum
Based on the data recorded in theAs expected there are not sosuburban and urban All the data hTable 9 Table 10 and Table 11 dvoice communication durations ansummarizes the repartition of user p
0 01 02 03 04 05 06 07 08 09 10
01
02
03
04
05
06
07
08
09
1
of users
o
fto
talv
oic
eca
llsd
ura
tion
aggregation
urban
suburban
rural
0 01 02 030
01
02
03
04
05
06
07
08
09
1
o
fto
talv
olu
me
ofd
ata
tra
ffic intermediate
light
heavy
intermediate
light
p figure) al (black lineareas (blue
for voicensumingnsuminging 5 of
networkmuch difave beenetail for dd data trarofiles fo
04 05 of u
heavy
nd data (bottom) areas and aggrline)
and data serv80 of the tota15 of the totathe total data
the user profileferences quanpooled to definifferent geograffic volumes p
r Orange 3G vo
06 07 08sers
aggr
urba
subu
rural
24
figure) traffic for urban (redegated over the 3 types of
icel datal data
s are defined in Table 8titatively between rurale the mean user profilesphical areas the averageer user profile Table 12ice and data usages
09 1
egation
n
rban
Document ID D28 Global Wireless Exposure Metric DefinitionFP7 Contract ndeg318273
Version V1 25Dissemination level PU
3G network
Rural Suburban Urban Global
tcom
[s]voldata
[kB]tcom
[s]voldata
[kB]tcom [s] voldata
[kB]tcom [s] voldata [kB]
Heavyusers
1972 103635 1899 70711 1610 67875 1762 73065
Moderateusers
249 9210 361 7915 233 5242 305 6940
Lightusers
42 492 71 753 41 345 53 504
Table 8 User profiles defined in rural suburban and urban areas
3G (Orangenetwork)
Voice Data (82 DL 18 UL)
Urban tcom (s) volULdata [kB] volDLdata [kB]
Heavy user
Day 841 4948 25124
Night 689 5879 31922
Moderate user
Day 147 464 2390
Night 86 387 2001
Light user
Day 26 35 158
Night 16 28 124
Table 9 Average voice communication durations and data traffic volumes per user profile for a3G Orange dense urban network
3G (Orangenetwork)
Voice Data (81 DL 19 UL)
Suburban tcom (s) volULdata [kB] volDLdata [kB]
Heavy user
Day 1081 5393 30199
Night 743 5175 29941
Moderate user
Day 242 739 3930
Night 119 505 2740
Light user
Day 49 90 382
Night 22 55 226
Table 10 Average voice communication durations and data traffic volumes per user profile for a3G Orange suburban network
Document ID D28 Global Wireless Exposure Metric DefinitionFP7 Contract ndeg318273
Version V1 26Dissemination level PU
3G (Orangenetwork)
Voice Data (79 DL 21 UL)
Rural tcom (s) volULdata [kB] volDLdata [kB]
Heavy user
Day 928 7013 36925
Night 723 9379 50314
Moderate user
Day 164 735 3716
Night 85 754 4005
Light user
Day 28 54 208
Night 14 48 182
Table 11 Average voice communication durations and data traffic volumes per user profile for a3G Orange rural network
Heavy users Moderate users Light users
Voice 20 30 50
Data 10 20 70Table 12 Repartition of user profiles for Orange 3G voice and data usages
3252 2G and 3G data from Telekom Srbja
Telekom Srbja combined data coming from different sources mainlybull Customer analytics systembull Network management system
On one hand data that could be retrieved from the customer analytics system SAScontains personal information on subscriber as
bull agebull genderbull addressbull account type (voice andor data)bull device type (mobile dongle tablet)
Traffic statistics of these subscribers were also collected through the customeranalytics system
On the other hand cell statistics were obtained from the network managementsystem on an hourly basis as
bull number of voice callsbull duration in Erlangbull number of data sessionsbull duration of all data sessions (min)bull volume of UL DL data transfers (kB)
Analyzing data about customer personal information revealed that these datacorrespond mainly to those who pay the bills at the end Employees and children
Document ID D28 Global Wireless Exposure Metric DefinitionFP7 Contract ndeg318273
Version V1 27Dissemination level PU
have been usually hiding respectively behind companies and parents who pay thebills but do not use many of those subscriptions personally
Data used for LEXNET were collected from the customer analytics system SAS andwere based on usersrsquo billing data for the month of January 2014 A LEXNET test areaconsisted of a few representative cells of different types of environment UrbanSuburban and Rural Subscribers who were located in the test area and did generateat least voice or data traffic have been taken into account Traffic data consisted of2G and 3G networks usage all together
Telekom Srbja LEXNET test area (2G and 3G)
User profile Geographical area
Rural Suburban Urban Global
tcom (s) voldata
(kB)tcom (s) voldata
(kB)tcom (s) voldata
(kB)tcom (s) voldata
(kB)
Heavy user 1176 40072 1230 46410 1372 47315 1313 46777
Moderate user 107 4929 120 11208 187 11367 153 11214
Light user 11 735 15 1186 28 1120 21 1181Table 13 User profiles defined in rural suburban and urban areas from TKS usage data
Specific 2G and 3G data were extrapolated considering for voice communicationsthat 72 of communications were made through the 2G network and 28 throughthe 3G For data traffic 91 of the traffic was assigned to 3G and 9 to 2G UL andDL data traffic proportions were respectively assumed to be 17 and 83 Thoseratios were calculated based on cell statistics that were obtained from the networkmanagement system on an hourly basis for same period of time Cells were same asthose used for identifying subscribers Finally three types of user profiles weredefined for voice and data service (see Figure 11 and Figure 12)bull heavy users top users consuming 80 of the total databull moderate users users consuming 15 of the total databull light users users consuming 5 of the total data
Table 13 details for different geographical areas the average voice communicationdurations and data traffic volumes per user profile
Figure 11 Distribution of the voice traffic for urban (red line) suburban (green line) and rural(black line) areas and aggregated over the 3 types of areas (blue line)
Document ID D28 Global Wireless Exposure Metric DefinitionFP7 Contract ndeg318273
Version V1 28Dissemination level PU
Figure 12 Distribution of the data traffic for urban (red line) suburban (green line) and rural(black line) areas and aggregated over the 3 types of areas (blue line)
The repartition of voice communications and data traffic over the two periods dayand night was extracted from the type of call statistics over 24h (see Figure 13 andFigure 14)The voice hourly extrapolation was based on outgoing calls and data extrapolationwas based on prepaid traffic due to limitations on the customer analytics system
Figure 13 Mobile phone voice communications hourly distribution over 24h
Document ID D28 Global Wireless Exposure Metric DefinitionFP7 Contract ndeg318273
Version V1 29Dissemination level PU
Figure 14 Mobile phone data traffic hourly distribution over 24h
63 of mobile phone voice and 48 data traffic were made during the day period(8 AM ndash 6 PM) and 37 and 52 respectively during the night period (6 PM ndash 8AM)Finally we could extract the average communication times and data traffic volumesper user profile for different geographical areas for 2G and 3G Telekom Srbjanetworks (see tables from 13 to 18)
2G (Telekom Srbja) Voice Data (83 DL 17 UL)
Urban tcom (s) volULdata [kB] volDLdata [kB]
Heavy user
Day 619 342 1660
Night 368 373 1807
Moderate user
Day 84 82 399
Night 50 90 434
Light user
Day 12 9 43
Night 7 10 47
Table 14 Average voice communication durations and data traffic volumes per user profile for a2G Telekom Srbja dense urban network
Document ID D28 Global Wireless Exposure Metric DefinitionFP7 Contract ndeg318273
Version V1 30Dissemination level PU
2G (Telekom Srbja) Voice Data (83 DL 17 UL)
Suburban tcom (s) volULdata [kB] volDLdata [kB]
Heavy user
Day 554 336 1828
Night 330 365 1773
Moderate user
Day 54 81 393
Night 32 88 428
Light user
Day 7 9 42
Night 4 9 45
Table 15 Average voice communication durations and data traffic volumes per user profile for a2G Telekom Srbja suburban network
2G (Telekom Srbja) Voice Data (83 DL 17 UL)
Rural tcom (s) volULdata [kB] volDLdata [kB]
Heavy user
Day 530 290 1406
Night 316 316 1531
Moderate user
Day 48 36 173
Night 29 39 188
Light user
Day 5 5 26
Night 3 6 28
Table 16 Average voice communication durations and data traffic volumes per user profile for a2G Telekom Srbja rural network
3G (Telekom Srbja) Voice Data (83 DL 17 UL)
Urban tcom (s) volULdata [kB] volDLdata [kB]
Heavy user
Day 242 3529 17119
Night 144 3843 18642
Moderate user
Day 33 848 4113
Night 20 923 4479
Light user
Day 5 91 441
Night 3 99 481
Table 17 Average voice communication durations and data traffic volumes per user profile for a3G Telekom Srbja dense urban network
Document ID D28 Global Wireless Exposure Metric DefinitionFP7 Contract ndeg318273
Version V1 31Dissemination level PU
3G (Telekom Srbja) Voice Data (83 DL 17 UL)
Suburban tcom (s) volULdata [kB] volDLdata [kB]
Heavy user
Day 216 3461 16791
Night 129 3769 18286
Moderate user
Day 21 836 4055
Night 13 910 4416
Light user
Day 3 88 429
Night 2 96 467
Table 18 Average voice communication durations and data traffic volumes per user profile for a3G Telekom Srbja suburban network
3G (Telekom Srbja) Voice Data (83 DL 17 UL)
Rural tcom (s) volULdata [kB] volDLdata [kB]
Heavy user
Day 207 2989 14498
Night 123 3255 15789
Moderate user
Day 19 368 1783
Night 11 400 1942
Light user
Day 2 55 266
Night 1 60 290
Table 19 Average voice communication durations and data traffic volumes per user profile for a3G Telekom Srbja rural network
Heavy users Moderate users Light users
Voice 47 25 28
Data 24 18 58Table 20 Repartition of user profiles for Telekom Serbia 2G and 3G voice and data usages
We can see that majority of voice communications at the test area in Serbia is doneover 2G contrary to what has been observed in Orange network Due to that reasonvoice communication is significantly lower on 3G than in the test area in FranceAverage data traffic volumes per user in France are a bit different than average datatraffic volumes at the test area in Serbia depending on the considered geographicalarea The repartitions of user profiles are also very different for voice usagesbetween Orange data and Telekom Serbia data A larger percentage of users areheavy users at Telekom Srbja while at Orange France there are more light users inthe test areas
Document ID D28 Global Wireless Exposure Metric DefinitionFP7 Contract ndeg318273
Version V1 32Dissemination level PU
3253 Extrapolation of 3G data to LTE
LTE data were collected from Orange network probes installed in Orange LTEnetwork For different geographical areas (urban suburban and rural) in the North ofFrance we could collect for some time periods during June 2014 the number of LTEusers and the total volumes of DL and UL data traffic Proceeding like we did for 3Gdata we extracted average user profiles (see Figure 15)
Figure 15 Distribution of data traffic aggregated over the 3 types of geographical areas for LTEnetwork
Then we evaluated the average volumes of LTE data traffic per day and per userprofile (see Table 21)
LTE network voldata [KB]
Heavy users 160639
Moderate users 60396
Light users 31003
Table 21 Average volumes of LTE data traffic per day per user profile
Comparing these data with data in Table 8 in the Global column we extract thefollowing 3G to LTE extrapolation ratios
Heavy user 22 Moderate user 87 Light user 615
The repartition of user profiles for Orange LTE data usages based on Figure 15 issummarized in Table 22
Heavy users Moderate users Light users
60 15 25 Table 22 Repartition of user profiles for Orange LTE data usages
Document ID D28 Global Wireless Exposure Metric DefinitionFP7 Contract ndeg318273
Version V1 33Dissemination level PU
This repartition is completely different compared to the repartition of user profiles forOrange 3G data usages The ratio between heavy usage and moderate usage is only25 for LTE while it is a factor 10 for 3G
326 IP traffic through WiFi
From [CISCO14] in 2014 9739 PB per month of IP traffic were generated byWestern Europeans and 4416 PB per month by Central and Eastern Europeans22 of the IP traffic was generated by tablets 35 by smartphones and 672 by PCs And about 41 of the total IP traffic was transmitted from FixedWiFiaccess
Considering that in Western Europe tablets were accounting for 6 (566 M) of allnetworked devices smartphones for 14 (2239 M) and PCs for 17 (2718 M) wecan evaluate the average IP traffic through WiFi per user per month for WesternEurope The same calculation was performed for Central and Eastern Europe (Table23)
Device Western Europe Central and Eastern Europe
smartphone 623 MB 410 MB
tablet 155 GB 22 GB
PC 99 GB 96 GBTable 23 Average IP traffic volumes through WiFi per device per user per month for Western
Europe and Central and Eastern Europe
We took the hypothesis that the UL traffic for WiFi represents 17 of the total datatraffic
327 Usage differences between the population categories
ICT usages are different depending on the age category of people The numbers inthe previous sections were extracted without distinction of the age category of usersWe are able nevertheless to play with the user profiles repartition For exampleconsidering a high school survey performed in Portugal between 2010 and 2014[SBOC12] teenagers were reported to use their mobile phone for voicecommunication an average of 30 minutes per day which corresponds to a heavyuser profile (see Figure 16) We could then consider a higher heavy user profilepercentage among young peopleIn [BYUN13] they assessed mobile phone usages in terms of number of calls per dayand average duration per call amongst Korean children and teenagers They haveshown that Korean children are on average using less than 5 minutes per day theirmobile phones for calling which would correspond to the usage for voice calls of amoderate userBesides in absence of any known study on the topic we are making the hypothesisthat a large percentage of seniors are light users
Document ID D28 Global Wireless Exposure Metric DefinitionFP7 Contract ndeg318273
Version V1 34Dissemination level PU
Figure 16 Distribution of Daily talk time by teenagers in Portugal (2378 3320 and 597answers in 201011 201112 and 201314 respectively)
We were obliged in the LEXNET project to fix precise numbers in order that to build areference scenario for EI assessment technical workpackages As explained abovesome result from statistical studies some others have been defined from basicassumptions
2G3GTelekom Srbja
Heavy users Moderate users Light users
Children Voice 25 50 25
Data 60 20 20
Young people Voice 47 25 28
Data 60 20 20
Adults Voice 47 25 28
Data 24 18 58
Seniors Voice 47 25 28
Data 5 25 70 Table 24 Repartition of user profiles for Telekom Serbia 2G and 3G usages for each population
category
3G Orange Heavy users Moderate users Light users
Children Voice 20 30 50
Data 50 40 10
Young people Voice 50 30 20
Data 50 40 10
Adults Voice 20 30 50
Data 10 20 70
Seniors Voice 20 30 50
Data 5 25 70Table 25 Repartition of user profiles for Orange 3G usages for each population category
0
5
10
15
20
25
30
35
DNK 0 1-9 10-19 20-29 30-59 60-119 ge120
Daily Talk time [minutes]
201011
201112
201314
Document ID D28 Global Wireless Exposure Metric DefinitionFP7 Contract ndeg318273
Version V1 35Dissemination level PU
LTE Orange Heavy users Moderate users Light users
Children 30 40 30
Young people 80 10 10
Adults 60 15 25
Seniors 10 40 50 Table 26 Repartition of user profiles for Orange LTE usages for each population category
33 SAR data
Reference SAR data were computed using 3D electromagnetic simulation platformsbased on the Finite Difference Time Domain (FDTD) [TAFLOVE00] and FiniteIntegration Technique (FIT) [WEIL77] methods SAR values were calculated for far-field and near-field exposure for two anatomical human body models of the VirtualFamily [CHRIST10] Duke a 34-year-old male and Eartha an 8-year-old girl Twopostures (standing and sitting) and three usages (mobile phone close to the headmobile phone or tablet for data and laptop usage) were selected More details onnumerical simulations can be found in [LEXNET IR21 2013]
Table 27 shows reference Whole-body SAR (WBSAR) values calculated for far-fieldand near-field exposure of the adult and the child models at four different frequencybands (see deliverable D26 Appendix 1 for specifications of frequency bands) Table28 shows reference WBSAR values calculated for exposure of the adult and the childmodels at 2100 MHz relevant for a human model standing or sitting close to theaccess point (this access point can be a femtocell or a WLAN access point)
WBSAR Frequency band
400 MHz 900 MHz 1940 MHz 2600 MHz
Child - voicesitting
DOWN 00088 00082 00071 00066
UP X 0029 0011 0014
Adult - voicesitting
DOWN 00050 00056 00043 00039
UP X 0012 00052 00047
Child - voicestanding
DOWN 00082 00084 00077 00071
UP X 0029 001 0015
Adult - voicestanding
DOWN 00064 00052 00046 00042
UP X 0012 00052 00053
Child - datasitting
DOWN 00090 00088 00071 00065
UP 0011 0011 00135 00094
Adult - datasitting
DOWN 00054 00046 00043 00038
UP 00078 00056 00081 00037
Child - datastanding
DOWN 00088 00090 00077 00072
UP 0013 001 00109 00083
Adult - datastanding
DOWN 0006 00052 00047 00042
UP 00064 00049 00039 00029
Child ndash laptopon the lap
DOWN X X 00069 00066
UP X X 00035 00038
Adult ndash laptop DOWN X X 00053 00049
Document ID D28 Global Wireless Exposure Metric DefinitionFP7 Contract ndeg318273
Version V1 36Dissemination level PU
on the lap UP X X 00027 0003
Child ndash laptopon a desk
DOWN X X 00069 00066
UP X X 00025 00031
Adult ndash laptopon a desk
DOWN X X 00053 00049
UP X X 00035 00027Table 27 Whole-body SAR data in Wkg for child and adult models for different devices in
different postures at different frequencies
WBSAR Femtocell (2100 MHz)Child ndash voice sitting 0000190Adult ndash voice sitting 000014Child ndash voice standing 000023Adult ndash voice standing 000013
Table 28 Whole-body SAR data in Wkg for child and adult models for a femtocell for differentpostures (reference transmitted power of 1 W)
UP stands for Uplink exposure to device) Values are normalized to a referencetransmitted power of 1 WDOWN stands for Downlink exposure to base-stations Values are normalized to areference received power density of 1 Wm-2
For the future we could imagine performing new SAR simulations for new new typesof wireless device For instance Appendix 1 presents the results of dosimetricsimulations performed with Google glasses [GLAS15]
Document ID D28 Global Wireless Exposure Metric DefinitionFP7 Contract ndeg318273
Version V1 37Dissemination level PU
4 EI INTEGRATION METHODOLOGY ON A MACRO 3G DENSE URBAN
SCENARIO
41 Scenario
We are showing in this section the EI integration methodology over 24 hours for amacro urban Orange 3G scenario
TimePopulatio
nEnvironment RAT
CellType
UserProfile
Posture Usage
Day Children Indoor 3G Macro Heavy StandingData
mobile
NightYoungpeople
OutdoorModerat
eSitting
Voicemobile
Adults LightDatatablet
Seniors Non userData
laptopTable 29 Input parameters for the macro urban Orange 3G scenario
The considered urban area is located into a typical European urban area in thecentre of Lyon (3rd largest city in France) (see Figure 17)
Figure 17 Urban area in Lyon
42 Input data
Time period Two time periods are considered the day time period from 8 am to 6 pm (10 hours intotal) and the night time period from 6 pm to 8 am (14 hours in total)
Population categories
Document ID D28 Global Wireless Exposure Metric DefinitionFP7 Contract ndeg318273
Version V1 38Dissemination level PU
4 population categories are considered Children (below 15 years) young people(between 15 and 29 years) adults (between 30 and 59 years) and seniors (over 60years)
Figure 18 Repartition by age of the population in the first district of Lyon in 2007 (from httphttpwwwcartesfrancefr)
From Figure 18 we extracted the repartition of the four population categories in thefirst district of Lyon
Populationcategory
Percentage
Children 139 Young people 328 Adults 382 Seniors 151 Table 30 Repartition of the population in the centre of Lyon
Environment ா
Two environments are considered indoor and outdoor environments Table 31 isderived from Table 4 considering that the time spent commuting is spent outdoor inour scenario
Day (from 8am to 6pm) Night (from 6pm to 8am)
Indoor Outdoor Indoor Outdoor
Children 8h15 (825) 1h45 (175) 13h45 (982) 15 min (18)
Young people 8h20 (83) 1h40 (17) 13h10 (94) 50 min (6)
Adults 8h15 (825) 1h45 (175) 13h05 (935) 55 min (65)
Seniors 7h35 (70) 2h25(30) 13h05 (935) 55 min (65)
Table 31 Repartition of each category of population by environment and time period
Consequently we are considering that 70 of mobile phone usages happen indoorsand 30 outdoors 100 of tablet and laptop usages are indoor usages
Macro 3G network ோ
Document ID D28 Global Wireless Exposure Metric DefinitionFP7 Contract ndeg318273
Version V1 39Dissemination level PU
User Profiles
Three user profiles (heavy moderate and light profiles) are used for mobile phoneusers and one moderate user profile for tablet and laptop users
Posture ௦ and Usage
Two network usages for the mobile phone are considered voice and data trafficusage If the mobile phone is used in indoor environment we consider that the useris in a sitting posture And if the mobile phone is used in outdoor environment weconsider that the user is in a standing posture For each population category wederived from Table 6 and Table 7 the proportions of users and non-users of mobilephones 3G tablets and 3G dongles (Table 32) Table 33 and Table 34 giverespectively average voice communication durations and data traffic volumes permobile phone user profile and the repartition of user profiles per population category
Children(under15 yo)
Youngpeople(15-29
yo)
Adults(30-59
yo)
Seniors(over 60
yo)
Mobile phone usageVoice communication
Non-users 68 4 5 30
Users 32 96 95 70
Mobile phone usageData traffic
Non-users 84 33 59 90
Users 16 67 41 10
3G Tablet usageNon-users 95 92 93 98
Users 5 8 7 2
3G dongle usageNon-users 98 90 90 93
Users 2 10 10 7Table 32 Proportions of users and non-users of mobile phones 3G tablets and 3G dongles perpopulation category
3G Voice Data (82 DL 18 UL)
Urban tcom (s) volULdata [kB] volDLdata [kB]
Heavy user
Day 841 4948 25124
Night 689 5879 31922
Medium user
Day 147 464 2390
Night 86 387 2001
Light user
Day 26 35 158
Night 16 28 124
Table 33 Average voice communication durations and data traffic volumes per mobile phoneuser profile
Document ID D28 Global Wireless Exposure Metric DefinitionFP7 Contract ndeg318273
Version V1 40Dissemination level PU
3G Orange Heavy users Moderate users Light users
Children Voice 20 30 50
Data 50 40 10
Young people Voice 50 30 20
Data 50 40 10
Adults Voice 20 30 50
Data 10 20 70
Seniors Voice 20 30 50
Data 5 25 70Table 34 Repartition of mobile phone user profiles for Orange 3G usages for each populationcategory
For 3G tablet usage we consider an average data traffic volume of 457 MB per dayper user whatever the population category 20 (91 MB) during day time and 80 (366 MB) during night time We are making the assumption that 15 of this traffic ison UL
For 3G dongle usage we consider an average data traffic volume of 816 MB per dayper user whatever the population category 50 (408 MB) during day time and 50 during night time As for the tablet we are making the assumption that 15 of thistraffic is on UL
Reference SAR values
SAR values are those extracted from Table 27 for the 1940 MHz frequency band Weuse adult values for young people adult and senior population categories and childvalues for child category
Received ோ transmittedത powers and UL data throughputs
Received ோ transmittedത powers and UL data throughputs can be derived fromnetwork simulation or from drive-test measurements in Lyon eg dosimetermeasurements for the DL power and TRACE mobile measurements for the ULpowerMean values indoor outdoor during the day and during the night are needed
43 EI integration
Considering Figure 7 we made the hypothesis that in 2016 48 of the population ofthe 1st district of Lyon is using a 3G network And considering the existence of fourtelecom operators in France we assumed that only 25 of these 48 3G users aresubscribers of the Orange 3G network
=ܫܧ 0139 lowast ௗܫܧ + 0328 lowast ௬௨ܫܧ + 0382 lowast +ௗ௨௧௦ܫܧ 0151 lowast ௦௦ܫܧ (4)
We propose to detail the calculation for one population category ie the adult oneTable 35 details the different macro urban 3G input parameters
Document ID D28 Global Wireless Exposure Metric DefinitionFP7 Contract ndeg318273
Version V1 41Dissemination level PU
Variable Abbreviation value
Time spent indoor during the day ௗ௬ௗݐ 29700 s
Time spent outdoor during the day ௗ௬௨௧ௗݐ 6300 s
Time spent indoor during the night ௧ௗݐ 47100 s
Time spent outdoor during the night ௧௨௧ௗݐ 3300 s
Mobile phone usage
Percentage of 3G connections ݎ ݐ ଷೞ 048
Percentage of mobile phone users for voicecalls
ݎ ݐ ௨௦௩ 095
Percentage of mobile phone users for datatraffic
ݎ ݐ ௨௦ௗ௧ 041
Average duration of mobile phone use indoorfor voice calls during the day
ௗ௬ௗ௩ݐ 15771 s
Average duration of mobile phone useoutdoor for voice calls during the day
ௗ௬௨௧ௗ௩ݐ 6759 s
Average duration of mobile phone use indoorfor voice calls during the night
௧ௗ௩ݐ 12012 s
Average duration of mobile phone useoutdoor for voice calls during the night
௧௨௧ௗ௩ݐ 5148 s
Average UL volume of mobile phone datatraffic indoor during the day
ݒ ௗ௧ௗ௬ௗ 42847 kB
Average UL volume of mobile phone datatraffic during the day
ݒ ௗ௧ௗ௬௨௧ௗ 18363 kB
Average UL volume of mobile phone datatraffic indoor during the night
ݒ ௗ௧௧ௗ 47943 kB
Average UL volume of mobile phone datatraffic during the night
ݒ ௗ௧௧௨௧ௗ 20547 kB
3G Tablet usage
Percentage of 3G tablet users ݎ ݐ ௨௦ଷ௧௧ 007
Average UL volume of tablet data trafficduring the day
ݒ ௧௧ௗ௬ 1365 kB
Average UL volume of tablet data trafficduring the night
ݒ ௧௧௧ 5490 kB
3G dongle usage
Percentage of 3G dongle users ݎ ݐ ௨௦ଷௗ 010
Average UL volume of laptop data trafficduring the day
ݒ ௧ௗ௬ 6120 kB
Average UL volume of laptop data trafficduring the night
ݒ ௧௧ 6120 kB
Reference SAR values
UL WBSAR for a phone call in voice modeindoor
ܤ ௩ܣ 00052 Wkg
UL WBSAR for a phone call in voice modeoutdoor
ܤ ௩௨௧ܣ 00052 Wkg
UL WBSAR for a phone call in data mode ܤ ௗ௧ܣ 00081 Wkg
Document ID D28 Global Wireless Exposure Metric DefinitionFP7 Contract ndeg318273
Version V1 42Dissemination level PU
indoor
UL WBSAR for a phone call in data modeoutdoor
ܤ ௗ௧௨௧ܣ 00039 Wkg
UL WBSAR for a laptop usage ܤ ௧ܣ 00035 Wkg
DL WBSAR indoor ܤ ܣ 00043 Wkg
DL WBSAR outdoor ܤ ௨௧ܣ 00047 WkgTable 35 Macro urban 3G scenario input data
ௗ௨௧௦ܫܧ = ܫܧ + ௨௧ܫܧ + ܫܧ + ௨௧ܫܧ (5)
ௗ௨௧௦ܫܧ = ଵ lowast തௗௗ௬௩ + ଶ lowast ത
௨௧ௗௗ௬௩ + ଷ lowast തௗ௧௩ + ସ lowast
ത௨௧ௗ௧௩ + ହ lowast
ത
+ lowast
തೠ
ೠ+ lowast
ത
+ lowast
തೠ
ೠ+ ଽ lowast RXindoorday + ଵ lowast RXoutdoorday + ଵଵ lowast RXindoornight + ଵଶ lowast
RXoutdoornight (6)
Whereത RXTh represent respectively mean transmitted power values mean
received power density values and average UL throughputs
ଵ to ସ are constant coefficients characterizing UL exposure for voice call usage
ଵ =ଶହlowast௧యಸೞ
ଶସlowastଷlowast ௗ௬ௗ௩ݐ] lowast ܤ ௩ܣ lowast ݎ ݐ ௨௦௩]
ଶ =ଶହlowast௧యಸೞ
ଶସlowastଷlowast ௗ௬௨௧ௗ௩ݐ] lowast ܤ lowast௩௨௧ܣ ݎ ݐ ௨௦௩]
ଷ =ଶହlowast௧యಸೞ
ଶସlowastଷlowast ௧ௗ௩ݐ] lowast ܤ ௩ܣ lowast ݎ ݐ ௨௦௩]
ଵ =ଶହlowast௧యಸೞ
ଶସlowastଷlowast ௧௨௧ௗ௩ݐ] lowast ܤ lowast௩௨௧ܣ ݎ ݐ ௨௦௩]
ହ to are constant coefficients characterizing UL exposure for data usage
ହ =025
24 lowast 3600lowast ൫ ݎ ݐ ଷೞ lowast ݎ ݐ ௨௦ௗ௧ lowast ݒ ௗ௧ௗ௬ௗ
+ ݎ ݐ ௨௦ଷ௧௧lowast ݒ ௧௧ௗ௬൯lowast ܤ ௗ௧ܣ+ ݎ ݐ ௨௦ଷௗ lowast ݒ ௧ௗ௬ lowast ௧൧ܤ
=025 lowast ݎ ݐ ଷೞ
24 lowast 3600lowast ݎ ݐ ௨௦ௗ௧ lowast ݒ ௗ௧ௗ௬௨௧ௗ lowast ܤ ௗ௧௨௧ܣ
=025
24 lowast 3600lowast ൫ ݎ ݐ ଷೞ lowast ݎ ݐ ௨௦ௗ௧ lowast ݒ ௗ௧௧ௗ
+ ݎ ݐ ௨௦ଷ௧௧lowast ݒ ௧௧௧൯lowast ܤ ௗ௧ܣ+ ݎ ݐ ௨௦ଷௗ lowast ݒ ௧௧lowast ௧൧ܤ
Document ID D28 Global Wireless Exposure Metric DefinitionFP7 Contract ndeg318273
Version V1 43Dissemination level PU
=025 lowast ݎ ݐ ଷೞ
24 lowast 3600lowast ݎ ݐ ௨௦ௗ௧ lowast ݒ ௗ௧௧௨௧ௗ
lowast ܤ ௗ௧௨௧ܣ
ଽ to ଵଶ are constant coefficients characterizing DL exposure
ଽ =ௗ௬ௗݐ lowast ܤ ܣ
24 lowast 3600
ଵ =ௗ௬௨௧ௗݐ lowast ܤ ௨௧ܣ
24 lowast 3600
ଵଵ =௧ௗݐ lowast ܤ ܣ
24 lowast 3600
ଵଶ =௧௨௧ௗݐ lowast ܤ ௨௧ܣ
24 lowast 3600
5 VARIABILITY AND UNCERTAINTIES
The EI is the output of an analytical model expressed by the equation (1) with anumber of uncertain input variables To propagate the uncertainty associated to theinput variables in the model the first step consists in characterizing the distribution ofinput variables Each uncertain variable input has to be described by a statisticaldistributionAverage DL power density and UL transmitted power are estimated using specificconfigurations environments and usages The downlink power absorbed by the userand the uplink power emitted by the device (and so partially absorbed by the user)depend on these configurations environments and usages Their statisticaldistributions have to be characterized in order to be incorporated in the total EIstatistical uncertaintyThe uncertainties of ICT usage data have been analyzed and modelled usingcomputable functions such as Gamma Gaussian or uniform distributions and asensitivity analysis has been carried out in order to determine the most importantparameters in the EI equation and how we could simplify the EI formula
51 Variability of the power transmitted by wireless personaldevices
In this subsection a methodology dedicated to characterize the variability of the
power radiated by wireless personal devices under specific propagation assumptions
is introduced
Studies focusing on SAR variability induced by sources generally did not take intoconsideration the impact of the propagation channel especially for an uplinktransmission In the framework of numerical dosimetric simulations for the LEXNETproject we analyzed the variability of the power radiated by wireless personal devicesunder specific propagation assumptions Interactions between the human body and
Document ID D28 Global Wireless Exposure Metric DefinitionFP7 Contract ndeg318273
Version V1 44Dissemination level PU
the antenna remain a complicated subject due to the high variability of theseparameters such as the type of antenna and the body shape These interactionshave been often investigated toward two disjoint objectives One is dedicated toanalyze the effect of the antenna radiation on the human body whereas the second isdevoted to study the effects of human body on the antenna performance In wirelesscommunications devices are usually placed close to the human body and as aconsequence part of the energy is necessarily absorbed The averaged SAR overthe whole body depends on many parameters such as the design of the antennaand its position with respect to the human body In our study we focused on both thequantification of the SAR and the statistical characterization of the variability of theradiated power We analyzed the influence of the positioning of the personal deviceagainst the human body on the SAR and the variability of the power radiated in bothLOS and NLOS (Non-line of Sight) scenariosDuring the communication the power radiated by the transmitter system dependsfundamentally on the gain in the LOS direction Since an antenna radiation pattern isusually anisotropic this parameter varies after each change in the transmitterorientation with respect to the base station For interference limitation reasons thetransmitted power is commonly adjusted to a minimum level consistent with apredetermined link quality Then the power radiated P
rmust be simultaneously
changed with the gain Ge (ϕLOS θLOS) in order to meet the requirements of receiver interms of signal to noise ratio (SNR) In practice assuming a constant noise powerthe received power (at the base station) must be such that the same SNR ismaintained in order to ensure a successful decoding This means that the product ofthe power radiated by the transmitting antenna (P
r) and of its power gain (Ge) in the
LOS direction should be constant
PrGe (ϕLOS θLOS) = α (7)
At first the personal device was assumed to be placed in a fixed position with respectto the userrsquos body Thus the userrsquos body and the personal device compose aninvariant transmitter system S The sphere surrounding the system S represents thesphere on which the various parts of a radiation pattern are calculated It is assumedto be fixed with respect to the base station while the system S can rotate alongazimuth and elevation angles The orientation of the system S with respect to the
base station axes is given by a random variable Ωs(S
S) where
Sand
Sare
respectively the angles of rotation of S around the vertical axis zrsquoOz and thehorizontal plane xOy (Figure 19)
Document ID D28 Global Wireless Exposure Metric DefinitionFP7 Contract ndeg318273
Version V1 45Dissemination level PU
Figure 19 Design concept
Figure 20 Comparison of radiation patterns of the laptop in free space and in the presence ofhuman body
Document ID D28 Global Wireless Exposure Metric DefinitionFP7 Contract ndeg318273
Version V1 46Dissemination level PU
Figure 21 Comparison of radiation patterns of the mobile phone in free space and in thepresence of human body
In the case of the laptop (Figure 20) the gain variation is smaller than the oneobtained in the mobile phone case (Figure 21) This can be explained by the fartherdistance between the 3G USB dongle and the human body The gain pattern isactually almost identical to the free space pattern as shown in the two planes Thesmall difference between both stems is due to reflection of waves by the body In thexz plane the effect of the left leg is observable around the direction θ = 270deg Since the exposure is proportional to the power radiated by the device whichdepends on many parameters a statistical analysis of this physical quantity isrequired in the modeling of the exposure Based on relationship (7) the powerradiated can be written in the following form
Pr =
ୋ ሺஐೞǡథಽೀೄǡಽೀೄ)(8)
where α is arbitrarily chosen equal to 1mW The gain Ge (Ω௦ǡைௌ θைௌ) depends on
the relative orientation (Ωs(S
S)) of the transmitter system with respect to the base
station To simplify computations S
and S
are assumed to follow a discrete uniform
distribution over [0deg 360deg] and [-45deg +45deg] respectively
Voice posture case
Figure 22 and Figure 23 show that the radiated power depends strongly on the localattenuation caused by the body shadowing effects It is very clear that it increaseslogarithmically with the attenuation level In this respect the quasi lognormalcharacter of the distribution is not surprising This statistical behavior remains typicalof Body Area Networks
Document ID D28 Global Wireless Exposure Metric DefinitionFP7 Contract ndeg318273
Version V1 47Dissemination level PU
Figure 22 Comparison between the empirical and the analytical distribution function obtainedwith the standing voice communication posture at 900 MHz
Figure 23 Comparison between the empirical and the analytical distributions function obtainedwith the sitting voice communication posture at 900 MHz
Between the two voice postures (standing and sitting) a small variation in theparameters of the distributions is noticed This is due to the fact that the antenna gainis mainly affected by the upper body portion The latter is not perfectly identical inboth postures in spite of the identical positions of the hand and the hand + head withrespect to the mobile phone This is due to a few constraints in building thecomputerized body models
Laptop posture case
In the case of laptop the variability of the radiated power is not very large The highpeaks of radiated power are up to 20mW which is smaller than those noticed withthe mobile phone These results can be explained by the fact that the 3G USBdongle is localized away from the human body (Figure 24)
Document ID D28 Global Wireless Exposure Metric DefinitionFP7 Contract ndeg318273
Version V1 48Dissemination level PU
Figure 24 Comparison between the empirical and the analytical distribution functions obtainedwith the laptop posture at 1940 MHz
During the post-processing a particular attention was given to the limitation of themaximum power that can be radiated by the mobile phone Particularly in the case ofGSM 900 MHz the average power radiated by the mobile antenna is always limitedto a threshold power of 250 mW
The results show that the performance of the antenna is significantly affected interms of radiation efficiency as well as shape of the radiation patterns especially inthe case of a mobile phone use for voice calls This observation is reflected by theabsorption of a huge amount of radiated power by the head and the hand and also bythe partial reflection of the waves by the body Furthermore the degradation of theradiation efficiency and the level of exposure level showed a (moderate) sensitivity tothe change in the position of the personal device with respect to the human bodyparticularly in the case of the laptopIn a wireless network context the exposure has been found to be strongly dependenton the local propagation environment owing to the power control enforced by mostwireless communications standards This was addressed by combining the Whole-body SAR value (calculated for a constant power) with a statistical distribution of theradiated power for various user positions expressing the dependence on theposition of the device with respect to the body and the impact of the propagationchannel (eg the number of paths their attenuation and the departure angles)
52 EI variability
The assessment of the EI is based on input parameters collected from surveyssimulations and measurements These input parameters can be divided into severalgroups as presented in section 3 ICT usage data have a great and direct impact onthe exposure duration And due to the complexity variability as well as confidentialityICT usage data are not easy to obtain and therefore to characterize Using the datacollected in the framework of LEXNET project a statistical analysis was performed inorder to characterize this variability Then a random sampling from probability
Document ID D28 Global Wireless Exposure Metric DefinitionFP7 Contract ndeg318273
Version V1 49Dissemination level PU
distributions of ICT usage data was realized in order to characterize the EI variabilityand uncertainty with respect to ICT usage data (we considered other groups of dataas constant values) by using Monte Carlo method
521 Statistical analysis of ICT usage data
We considered ICT usage data as twelve different input parameters summarized inTable 36 Based on daily traffic consumption recorded on the 3G network of Orangeeach parameter was well defined in order to characterize its statistical distribution
Input parameter Description
Htday Total voice call duration during the day for heavyusers
Mtday Total voice call duration during the day for moderateusers
Ltday Total voice call duration during the day for light users
Htnight Total voice call duration during the night for heavyusers
Mtnight Total voice call duration during the night formoderate users
Ltnight Total voice call duration during the night for lightusers
Hvolday Data traffic volume during the day for heavy users
Mvolday Data traffic volume during the day for moderate users
Lvolday Data traffic volume during the day for light users
Hvolnight Data traffic volume during the night for heavy users
Mvolnight Data traffic volume during the night for moderateusers
Lvolnight Data traffic volume during the night for light usersTable 36 ICT usage data represented by twelve different input parameters
In our study we used Akaike Information Criterion (AIC) in order to determinate thedistributions followed by the different input parameters This measurement isdeveloped using information theory for model selection It offers an estimation of therelative quality among some given statistical models for a set of data by evaluatingAIC value of each model From the equation below we can see that AIC depends onL (value of likelihood function for the model) and k (number of estimated parametersin the model) Great L will offer us a more accurate model but at the same time greatk may lead to overfitting
AIC=2k-2log(L) (9)
Hence AIC encourages the advantage of fitting (by maximizing L) while trying toavoid overfitting (by minimizing k) The preferred model is the one with the minimumAIC value In our study we tried to find the preferred model among a group ofcommon statistical models (Normal Lognormal Rayleigh Weibull ExponentialGamma Rician and Generalized Extreme Value) for our ICT usage data Thedistribution results for urban suburban and rural scenarios are shown in the followingtables
Document ID D28 Global Wireless Exposure Metric DefinitionFP7 Contract ndeg318273
Version V1 50Dissemination level PU
Input Parameter Distribution Param1 Param2 Param3
Htday GEV 3562696e-1 4532385e2 5123877e2
Mtday GEV -155576e-1 8922579e1 1566470e2
Ltday Weibull 4120504e1 1210874
Htnight Weibull 9040221e2 8753780e-1
Mtnight Weibull 1915478e2 1548896
Ltnight Weibull 3779658e1 1159748
Hvolday Weibull 3789408e3 6381982e-1
Mvolday Weibull 5900637e2 9674856e-1
Lvolday Lognormal 3137842 1304834e
Hvolnight Weibull 4513852e3 6264050e-1
Mvolnight Weibull 5412720e2 9230518e-1
Lvolnight Lognormal 3134336e 1306830Table 37 Distribution selection for usage data group of urban scenario
InputParameter
Distribution Param1 Param2 Param3
Htday Gamma 1199636 9934028e2
Mtday GEV -2085134e-1 1413730e2 2283643e2
Ltday Weibull 6628165e1 1126797
Htnight Weibull 8617700e2 8500429e-1
Mtnight Weibull 2164593e2 1176168
Ltnight Weibull 5217715e1 1032256
Hvolday Weibull 4215846e3 6954090e-1
Mvolday Gamma 1125814 7233229e2
Lvolday Lognormal 3793228 1459122
Hvolnight Gamma 7897441e-1 7881916e2
Mvolnight Lognomal 5680914 1529319
Lvolnight Lognormal 3567057 1434982Table 38 Distribution selection for usage data group of suburban scenario
InputParameter
Distribution Param1 Param2 Param3
Htday GEV 3992009e-1 4499851e2 5001061e2
Mtday GEV 5338537e-2 9253486e1 1497340e2
Ltday Weibull 4033680e1 1105567
Htnight Weibull 9138381e2 8435146e-1
Mtnight Weibull 1967658e2 1303428
Ltnight Gamma 110623 3172726e1
Hvolday Weibull 6086792e3 6560783e-1
Mvolday Weibull 9412760e+2 9226993e-1
Lvolday GEV 1329584 1645838e1 1283718e1
Hvolnight Weibull 7731316e+3 6842199e-1
Mvolnight Gamma 9888754e-1 1002908e3
Lvolnight Lognormal 3434330 1494722Table 39 Distribution selection for usage data group of rural scenario
Document ID D28 Global Wireless Exposure Metric DefinitionFP7 Contract ndeg318273
Version V1 51Dissemination level PU
For the 3G urban scenario as shown in Table 40 highest Sobolrsquo indices were foundfor the average time spent on voice call for heavy users during the day period andnight period and average data traffic volumes for heavy users during the day periodand the night period which means that for this specific scenario most influentparameters are data concerning heavy users
Parameter Sobolrsquo Indices
Htday
05874
Mtday
00077
Ltday
00046
Htnight
01812
Mtnight
00055
Ltnight
00044
Hvolday
01625
Mvolday
00054
Lvolday
00043
Hvolnight
01359
Mvolnight
00043
Lvolnight
00042
Table 40 Evaluated Sobolrsquo indices for each ICT usage parameter for the urban scenario
522 EI sensitivity analysis
Several input parameters are needed for EI calculation life segmentation datareference exposure data received (Rx) emitted (Tx) power data and personalwireless devices usage data So in order to integrate the real exposure of thepopulation in different considered scenarios these main parameters should beconsidered one after another In our study we aim to characterize the variability of EIwith respect to ICT usage data group (represented by the twelve parametersdescribed in Table 36) by using Monte Carlo method To this end a random samplingfrom probability distributions of usage data was realized and all the factors in otherthree data groups (life segmentation reference exposure and received (Rx) emitted(Tx) power data group) were considered as constant values and derived fromsurveys and simulations in order to launch Monte Carlo simulations
100000 sample sets data were considered to guaranty the large size simulationsneeded by Monte Carlo method However from our observation the results wereconverging after 25000 simulations The average global exposure (EI) was finallyconverging to 286e-7 Wkg for urban scenario 131e-7 Wkg for suburban scenarioand 143e-7 Wkg for rural scenario The mean estimated central tendency (blackline) and 95 confidence interval (grey zone) as functions of simulation iterationnumber for the three scenarios are shown in Figure 25 The standard deviation (σ)
Document ID D28 Global Wireless Exposure Metric DefinitionFP7 Contract ndeg318273
Version V1 52Dissemination level PU
for the three scenarios is also given in the same figure We obtain the averagevariation coefficients of 53 (urban) 43 (suburban) and 56 (rural) by dividing themean by the corresponding σ The important variation coefficients show that the global exposure is very sensitive due to the high complexity as well as high variabilityof ICT usage data
(a) Urban scenario
(b) Suburban scenario
(c) Rural scenarioFigure 25 Mean estimated central tendency (black line) and 95 confidence interval standard
deviation as a function of simulation iterations for urban (a) suburban (b) and rural (c)scenario
0 05 1 15 2 25 3 35 4 45 5
x 104
14
15
16
17
18
19
2
21
22x 10
-7
Iterations
EI
[Wk
g]
Standard deviation
0 05 1 15 2 25 3 35 4 45 5
x 104
4
45
5
55
6
65
7
75
8x 10
-8
Iterations
[Wk
g]
Standard deviation
0 05 1 15 2 25 3 35 4 45 5
x 104
7
75
8
85
9
95
x 10-8
Iterations
[Wk
g]
Standard deviation
Document ID D28 Global Wireless Exposure Metric DefinitionFP7 Contract ndeg318273
Version V1 53Dissemination level PU
6 CONCLUSION
In this final deliverable of WP2 concerning the global exposure metric the built metrichas been definedThe proposed metric called Exposure Index (EI) has the advantage to overpass thelimitations of the actual metrics that in fact are managing separately the exposureinduced by personal devices and the one induced by the network equipment (basestations and access points) But devices base station antennas and access pointsare definitely parts of the same wireless environment and the global wirelessexposure is induced by all of them
The EI is described with an analytical model with input variables describing thecoverage area of interest the accessible networks the population and the habits interms of location and of wireless devices usage The output is the EI covering theday-to-day averaged exposure of population in a given area incurred by an entirewireless network from base stations and access points to individual devices
The analytical model of the EI has been first detailed and the input variables definedThen we presented the EI integration methodology on a concrete example a macrodense urban 3G scenario We have shown that using all the input data collectedmeasured and simulated during the LEXNET project we are able to integrate themetric we built on a comprehensive scenario
First sensitivity analyses have shown that the EI is highly variable and depending onthe considered scenario is driven by some more influent input parameters
Finally a new human exposure index to EMF is available integrating peoplersquos lifesegmentation and ICT usages and combining both exposure from mobile devicesand exposure from base stations and access pointsThe EI as it is at the end of the LEXNET project is usable but could make a good useof simplification depending on the considered scenario
This new metric might in the future benefit different user groups such as telecomoperators as a Key Performance Indicator for network optimization nationalregulators as such a metric reflects the real global exposure of a population to RF-EMF We can expect also it would be used to feed health risk epidemiologicalstudies
Document ID D28 Global Wireless Exposure Metric DefinitionFP7 Contract ndeg318273
Version V1 54Dissemination level PU
7 REFERENCES
[BYUN13] Byun Y-H et al ldquoEpidemiological Characteristics of
Mobile Phone Ownership and Use in Korean Children and
Adolescentsrdquo Env Health and Toxicology vol 28
published online 2013
[Carte09] httpwwwcartesfrancefr
[CISCO14] Cisco Visual Networking Index Global Mobile Data Traffic
Forecast Update 2013-2018 February 2014 Last update
of the document can be found here
httpwwwciscocomcenussolutionscollateralservice-
providervisual-networking-index-vniwhite_paper_c11-
520862html
[CHLWW08] ConilE Hadjem A Lacroux F Wong M F and Wiart J
ldquoVariability analysis of SAR from 20 MHz to 24 GHz for
different adult and child models using finite-difference
time-domainrdquo Phys Med Biol vol 53 pp 1511-1525
2008
[CHRIST10] Christ A Kainz W Hahn E G Honegger K Zefferer
M Neufeld E Rascher W Janka R Bautz W Chen
J Kiefer B Schmitt P Hollenbach H-P Shen J
Oberle M Szczerba D Kam A Guag J W amp Kuster
N ldquoThe Virtual Family--development of surface-based
anatomical models of two adults and two children for
dosimetric simulationsrdquo Phys Med Biol vol 55 pp 23-
38 2010
[COOPER10] Cooper A R et al ldquoPatterns of GPS measured time
outdoors after school and objective physical activity in
English children the PEACH projectrdquo International Journal
of Behavioral Nutrition and Physical Activity Vol 7 Ndeg 31
2010
[CREDOC13] R Bigot P Croutte and E Daudey laquo La diffusion des
technologies de lrsquoinformation et de la communication dans
la socieacuteteacute franccedilaise (2013) raquo Dec 2013
[CSTM15] CST [Online] Available httpwwwcstcom [Accessed
Sep 2015]
[GCWW10] Gati A Conil E Wong MF Wiart J ldquoDuality between
uplink local and downlink whole body exposures in
Document ID D28 Global Wireless Exposure Metric DefinitionFP7 Contract ndeg318273
Version V1 55Dissemination level PU
operating Networksrdquo IEEE Transactions on EMC Vol 52
ndeg4 Nov 2010
[GLAS15] Google Glass [Online] Available wwwgooglecomglass
[Accessed July 2015]
[GRAB15] GrabCAD [Online] Available wwwgrabcadcom
[Accessed July 2015]
[HETUS06] C Aliaga ldquoHow is the time of women and men distributed
in Europe Statistics in focus population and social
conditionsrdquo Apr 2006
[HOFFERTH01] S L Hofferth et al ldquoHow american children spend their
timerdquo Journal of Marriage and the Family vol 63 Ndeg2
May 2001
[ICNI98] International Commission for Non Ionizing Radiation
Protection (ICNIRP) ldquoGuidelines for limiting exposure to
time-varying electric magnetic and electromagnetic fields
(up to 300 GHz)rdquo Health Physics Vol 74 nordm 4 Apr
1998 pp 494-522
[IEEE02] TC95_SC1 - Techniques Procedures Instrumentation
and Computation Working Group C953-2002 - IEEE
Recommended Practice for Measurements and
Computations of Radio Frequency Electromagnetic Fields
With Respect to Human Exposure to Such Fields 100
kHz-300 GHz IEEE 2002
[INSEE11] L Ricroch and B Roumier Enquecircte Emploi du
temps 2009-2010 laquo Depuis 11 ans moins de tacircches
meacutenagegraveres plus drsquoInternetraquo Insee Premiere Ndeg 1377
Nov 2011
[LARSON01] LarsonR W ldquoHow US Children and Adolescents SpendTime What It Does (and Doesnrsquot) Tell Us About TheirDevelopmentrdquo Current Directions in PsychologicalScience Vol 10 Ndeg 5 Oct 2001
[LARSON11] Larson L R et al ldquoChildrenrsquos Time Outdoors Resultsand Implications of the National Kids Surveyrdquo Journal ofPark and Recreation Administration Vol 29 Ndeg 2 2011
[LEXNET D21 2013] Vermeeren G Thielens A Aerts S Joseph W
Martens L Oliveira C Mackowiak M Correia LM
Pejanovic-Djurisic M Veljovic Z Nešković A
Koprivica M Gati A Varsier N Hadjem A Wiart J
Document ID D28 Global Wireless Exposure Metric DefinitionFP7 Contract ndeg318273
Version V1 56Dissemination level PU
ConilE ldquoD21 Current metrics for EMF exposure
evaluationrdquo LEXNET project April 2013
[LEXNET D22 2013] Wiedemann P M Freudenstein F ldquoD22 Risk and
exposure perceptionrdquo LEXNET project July 2013
[LEXNET D23 2013] Vermeeren G Plets D Joseph W Martens L Conil E
Varsier N Wiart J Corre Y Oliveira C Sebastiatildeo D
Correia LM Aguumlero R Diez L Rodriacuteguez L Koprivica
M Nešković A Popović M Milinković J Nikšić S ldquoD23
Scenariosrdquo LEXNET project November 2013
[LEXNET IR21 2013] ldquoNumerical toolsrdquo LEXNET project July 2013
[LEXNET D25 2014] Wiedemann P M Freudenstein F ldquoD25 Risk and
exposure perceptionrdquo LEXNET project November 2014
[NAGAOKA08] Nagaoka T and Watanabe S ldquoPostured voxel-based
human models for electromagnetic dosimetryrdquo Physics in
medicine and biology vol 53 pp 7047-7061 2008
[PLETS15] Plets D Joseph W Aerts S Vanhecke K
Vermeeren G Varsier N Wiart J and Martens L
ldquoAssessment of contribution of other users to own total
whole-body RF absorption in train environmentrdquo
Bioelectromagnetics (accepted)
[SBOC12] Sebastiao D Branco M Oliveira C and Correia L
MldquoUsage of mobile phones and concerns on
electromagnetic radiations of Portuguese youngstersrdquo
ICNIRP 7th International NIR Workshop 2012
[TAFLOVE00] Taflove A and Hagness S C 2000 Computational
Electrodynamics The Finite-Difference Time-Domain
Method 2nd edn (Boston MA Artech House Publishers)
[TNS10] TNS Sofres survey Observatoire Socieacutetal du teacuteleacutephone
mobile Dec 2010
[TVPO15] T V Population [Online] Available
httpwwwitisethzch [Accessed Sep 2015]
[WEIL77] WeilandT ldquoA discretization model for the solution of
Maxwells equations for six-component fieldsrdquo Electronics
and Communication Vol 31 Mar 1977 pp 116-120
[WIART08] Wiart J Hadjem A Wong M F and Bloch I Analysis of
RF exposure in the head tissues of children and adults
Document ID D28 Global Wireless Exposure Metric DefinitionFP7 Contract ndeg318273
Version V1 57Dissemination level PU
Physics in medicine and biology vol 53 pp 3681-3695
2008
Document ID D28 Global Wireless Exposure Metric DefinitionFP7 Contract ndeg318273
Version V1 58Dissemination level PU
8 MAIN PUBLICATIONS
Hadjem A Varsier N Conil E et al ldquoCharacterization of far-field and near-fieldexposure of the population for RF-EMF in realistic configurations of ICT usagesrdquoBEMS 2014
Plets D Joseph W Aerts S Vanhecke K et al ldquoPrediction and comparison ofdownlink electric-field and uplink localised SAR values for realistic indoor wirelessplanningrdquo Radiat Prot Dosimetry (2014) 162 (4) 487-498 doi 101093rpdncu019
Huang Y Krayni A Hadjem A Wiart J Person C and Varsier N ldquoComparison ofthe average global exposure of a population induced by a macro 3G network inurban suburban and rural areasrdquo URSI AT-RASC 2015
Krayni A ldquoCharacterization of the exposure induced by a wireless networkrdquo URSIAT-RASC 2015
Plets D Joseph W Vanhecke K et al ldquoJoint Minimization of Uplink and DownlinkWhole-Body Exposure Dose in Indoor Wireless Networksrdquo BioMed ResearchInternational vol 2015 Article ID 943415 9 pages 2015 doi1011552015943415
Varsier N Plets D Corre Y Vermeeren G Joseph W Aerts S Martens L andWiart J ldquoA novel method to assess the human population exposure induced by awireless cellular networkrdquo Bioelectromagnetics vol 36 ndeg6 pp 451-463 Sept 2015
Plets D Joseph W Aerts S Vanhecke K Vermeeren G Varsier N Wiart Jand Martens L ldquoAssessment of contribution of other users to own total whole-bodyRF absorption in train environmentrdquo Bioelectromagnetics (accepted)
Document ID D28 Global Wireless Exposure Metric DefinitionFP7 Contract ndeg318273
Version V1 59Dissemination level PU
APPENDIX 1 NUMERICAL DOSIMETRIC SIMULATIONS FOR GOOGLE
GLASSES
This appendix describes the results of SAR simulations for Google glasses[GLAS15] using a numerical simulation tool (CST Microwave Studio [CSTM15]) TheGlass is a pair of augmented reality glasses whose connectivity is assured by twowireless technologies Wi-Fi and Bluetooth in the 24 GHz band No cellular modulewas implemented on the prototype
These simulations have the aim of assessing the user exposure in the potentialscenario of using cellular technologies in the Glass prototype Accordingly SARvalues were evaluated for 900 MHz (GSM) 1940 MHz (UMTS) and 2600 MHz (LTE)
The Google glasses [GLAS15] were modelled using a CAD model [GRAB15] whichwas directly imported into CST Microwave Studio Figure A1
Figure A1 Google glasses CAD model [GRAB15]
As it can be seen from Figure A2 the Google glasses use a monopole whipantenna which was modelled in CST as a wire and a ground plane both made ofPerfect Electric Conductor (PEC) Figure A3 A small vacuum gap was introducedbetween them to insert a discrete port as the feeding point
Document ID D28 Global Wireless Exposure Metric DefinitionFP7 Contract ndeg318273
Version V1 60Dissemination level PU
Figure A2 Google Glass antenna [5]
Figure A3 ndash Google glasses modelled antenna
The antenna length was set using the Time Domain Solver Optimizer of CST tuned tominimise the S11 value at 2436 MHz The antenna optimisation process used theGoogle glass CAD model the modulated antenna and a head voxel model
The value of the S11 parameter is presented in Figure A4 Table A1 shows theGoogle glasses and the antenna main characteristics after optimisation
Document ID D28 Global Wireless Exposure Metric DefinitionFP7 Contract ndeg318273
Version V1 61Dissemination level PU
Figure A4 S11 for Google glasses antenna
Table A1 ndash Google glasses and antenna main characteristics at 2436 MHz
AntennaGoogleGlasses
Ground plane Wire GapS11[dB]
MaterialLength[mm]
MaterialLength[mm]
MaterialLength[mm]
Material
2519 PEC 2519 PEC 200 Vacuum -354Teflon(PTFE)
The computer used for the simulations contains a GPU NVIDIA TESLA C2050 thatsignificantly reduces the simulation time for scenarios with a maximum of 50 millionmesh cells Nevertheless the use of a full body voxel model would exceed this limitTherefore a voxel simulating only the head of a 26 years old woman [TVPO15] wasused Figure A5 It should be noted that the SAR values are only relevant in thehead regions near the antenna therefore validating this approach
Document ID D28 Global Wireless Exposure Metric DefinitionFP7 Contract ndeg318273
Version V1 62Dissemination level PU
Figure A5 ndash 26 years old woman voxel model (head) [TVPO15]
Simulations have been performed using the time domain solver and the automaticmesh generation of CST To achieve an accurate meshing a maximum mesh step of02 mm was defined for the antenna gap This implies that the automatic meshgenerator will not exceed this step width at the bounding box of the antenna gapFigure A6 shows the higher density mesh lines near the antenna gap (in blue)
Figure A6 ndash Mesh lines on the antenna gap
Document ID D28 Global Wireless Exposure Metric DefinitionFP7 Contract ndeg318273
Version V1 63Dissemination level PU
Figure A7 shows the mesh lines for the upper frequency of 3000 MHz whichresulted in 1086 million mesh cells
Figure A7 ndash Model mesh lines for the upper frequency of 3000 MHz
SAR calculations were performed using the averaging method according to the IEEEC953 standard [IEEE02] and the reference (radiated) power was set to thenormalised value of 1 W The SAR calculation at the different frequencies assumesthat there are no reflection lossesTable A2 presents the main parameters used in each simulation scenario Thesimulation frequency range setting is important for the meshing process and theresulting number of mesh cells and simulation time The use of a GPU results in asignificant reduced simulation time eg for the 900 MHz scenario the simulationtime was reduced around 5 times compared to the case when no GPU is usedThe MLW (Maximum number of Lines per Wavelength) value defines the upper limitof lines per wavelength of maximum frequency Increasing this number leads to ahigher accuracy but also increases the total calculation time The value was chosento achieve a trade-off between simulation accuracy and simulation time
Frequency[MHz]
FrequencyRange[MHz]
Mesh cells
AccelerationSimulation
TimeMLWSmallest
[mm]Largest
[mm]Number
[106]
900 500 ndash 1000 10 020 2890 116 2 Intel XeonE620240
GHz
GPU TeslaC2050
3 m 53 s
1940
1000ndash 3000 10 020 980 1086 1 h 0 m 58 s2600
Table A2 Simulation setup
Document ID D28 Global Wireless Exposure Metric DefinitionFP7 Contract ndeg318273
Version V1 64Dissemination level PU
The cutting planes presenting SAR values for the 900 and 2600 MHz are shown inFigure A8 and Figure A9 respectively One can observe the intuitive result thatmost of the energy is absorbed by the head region near to the antenna Moreover ahigher absorption of energy at the lowest frequency (09 GHz) is noticeable
Figure A8 Voxel cutting plane with SAR values for 900 MHz
Figure A9 Voxel cutting plane with SAR values for 2600 MHz
Table A3 shows the peak-spatial averaged SAR (psaSAR10g) and the whole headSAR values for each band
Frequency[MHz]
psaSAR10g[Wkg]
Whole head SAR[Wkg]
SAR CalculationTime
900 1314 0205 7 s
1940 1372 0128 10 m 51 s
2600 1051 0096 11 m 07 s
Table A3 SAR values
The values on Table A4 were evaluated for a radiated power of 1 W which wasused to normalise the results among the LEXNET partners but overestimates thereal typical exposure of 0125 W for UMTS and 01 W for LTE
Document ID D28 Global Wireless Exposure Metric DefinitionFP7 Contract ndeg318273
Version V1 65Dissemination level PU
The values of maximum radiated power (Pmax) to respect the maximumrecommended SAR value for the head (ie 2 Wkg [ICNI98]) are presented inTable A4 So one can see that for UMTS and LTE there are no problems ofexposure since the maximum radiated power that fulfils SAR requirements is abovethe maximum radiated by the devices in GSM the situation is different and in orderto respect the threshold the device will have to radiate a maximum quite below themaximum allowed for a device in general which can be implemented in the devicewithout problems
Frequency[MHz]
Pmax[W]
PeakMaximumEIRP Uplink [W]
GSM 900 0152 2000
UMTS 1940 0146 0125
LTE 2600 0190 0100
Table A4 Maximum radiated power for 2 Wkg SAR
Document ID D28 Global Wireless Exposure Metric DefinitionFP7 Contract ndeg318273
Version V1 66Dissemination level PU
APPENDIX 2 INTERNAL REVIEW
Reviewer 1 Mick Wilson Reviewer 2 Yoann Corre
Answer Comments Type Answer Comments Type
1 Is the deliverable in accordance with
(i) the Descriptionof Work
Yes
No
M
m
a
Yes
No
M
m
a
(ii) the internationalState of theArt
Yes
No
M
m
a
Yes
No
M
m
a
2 Is the quality of the deliverable in a status
(i) that allows tosend it to EC
Yes
No
M
m
a
Yes
No
M
m
a
(ii) that needsimprovement ofthe writing bythe editor of thedeliverable
Yes
No
Minor editorials onlysuggested
M
m
a
Yes
No
Minor modificationssuggested (mostlyeditorial corrections)
M
m
a
(iii) that needsfurther work bythe partnersresponsible forthe deliverable
Yes
No
M
m
a
Yes
No
M
m
a
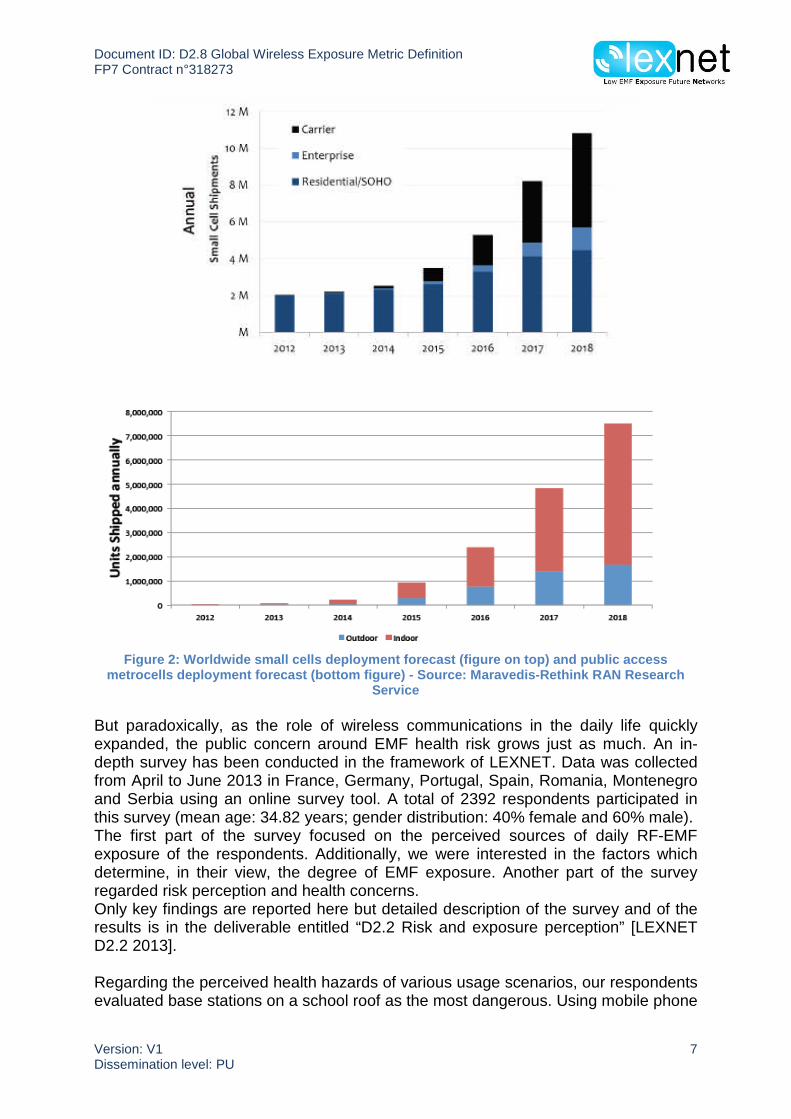
Document ID D28 Global Wireless Exposure Metric DefinitionFP7 Contract ndeg318273
Version V1 8Dissemination level PU
for calls is perceived as less dangerous a somewhat lower score characterizes thelaptop used on the lap The results of this survey indicate that risk perceptions of thegeneral public and the underlying health concerns are guided by subjective models ofEMF impact which underestimate near-field exposure and overestimate far-fieldexposure People are more concerned about base stations than about all other RF-EMF sources
Currently different metrics are used to deal with exposure induced by sources closeto the users as mobile phones and with exposure induced by far away sources asbase station antennasThe current state of existing metrics to evaluate the exposure induced by RF-EMFsources has been reviewed in the deliverable ldquoD21 Current metrics for EMFexposure evaluationrdquo [LEXNET D21 2013]Basically two types of metrics are distinguished the ones dedicated to the exposureinduced by sources close to the users as personal devices and expressed in termsof Specific Absorption Rate (SAR) and the ones focusing on the exposure induced byfar field sources as access points or base station antennas and currently expressedin ElectricMagnetic fields or Power DensityPersonal devices and base stations are too often represented as two separate worldswhen dealing with exposure issue But the connection between exposure induced bypersonal devices and base stations is indisputable Measurements on real networksillustrate a strong correlation (Figure 3) between the power emitted by personaldevices and the power received by personal devices from the base station antennas[GCWW10] The higher is the received power by the device the lower is the emitterpower by the device as illustrated by Figure 3
Figure 3 Duality between mobile phones emitted and received powers measured during voicecalls on the 3G Orange France network - source [GCWW10]
The project LEXNET aims at filling the gap between these two separate ways ofdealing with exposure by proposing a new exposure metric named Exposure Index(EI) The EI is assessing the average exposure of a population induced by bothpersonal devices and base stations (or access points) The concept is to average thisglobal exposure over space by assessing the EI in a given area and average it overtime by considering a given time frame Therefore an important question that the
-60 -40 -20 0 20 40
-120
-100
-80
-60
-40
Emitted power by devices (dBm)
Rec
eive
dpo
wer
by
devi
ces
(dB
m)
GSM 900
GSM 1800
UMTS 2100
Document ID D28 Global Wireless Exposure Metric DefinitionFP7 Contract ndeg318273
Version V1 9Dissemination level PU
project must absolutely address is about the understandability and acceptability ofthis new exposure metric by the general publicA second survey has been therefore conducted in the framework of LEXNET Datawere collected from July to September 2014 in France Germany United KingdomPortugal Spain Romania and Serbia among a representative sample of the generalpopulation A total of 1809 respondents participated in this second surveyAn important part of the survey focused on how people are considering strategiesproposed in the framework of the LEXNET project to define and minimize thepopulationrsquos exposure to electromagnetic fieldsOnly key findings are reported here but detailed description of the survey and of theresults is in the deliverable entitled ldquoD25 Risk and exposure perceptionrdquo [LEXNETD25 2014]
When asked about adding up the exposure from personal wireless devices and theexposure from base stations when evaluating the exposure of people to EMF morethan 90 of respondents agreed on the fact that both downlink and uplink exposuresshould be considered when evaluating the population exposure to EMFA large percentage of respondents also agreed when asked if it makes sense tocharacterize the day-to-day exposure to EMF by averaging it over time or if they thinkthat an individual exposure to EMF can be approximated by measuring the exposureover a large population
The next chapter of this deliverable describes the Exposure Index proposed by theproject LEXNET
Document ID D28 Global Wireless Exposure Metric DefinitionFP7 Contract ndeg318273
Version V1 10Dissemination level PU
2 THE EXPOSURE INDEX
21 Key concept
The Exposure Index (EI) takes into account the global EMF exposure of a populationto a given wireless telecommunication network (or a set of networks) The EI in theframework of LEXNET project does not take into account the exposure induced byother RF sources such as Frequency Modulation (FM) radio or digital terrestrialtelevision transmitters However the EI was designed as a future-proof metric andother RF sources could completely be taken into account if neededIt covers the exposure of a population during a given time frame in a given areaincurred by a wireless telecommunication network as a whole aggregating thedownlink exposure induced all day long by base stations and access points and theuplink exposure incurred by individual wireless communication devices The uplinkexposure can be subdivided in exposure due to the uplink of the userrsquos own deviceand the uplink of devices operated by other users nearbyIn order to assess the realistic exposure of a population many parameters influencingthe exposure need to be taken into account in the Exposure Index age (adult andchild exposure are different [CHLWW08] [WIART08]) posture [NAGAOKA08] usagetechnology environment etc
In a nutshell the LEXNET Exposure Index is a function transforming a highlycomplex set of data into a single parameter which has two key benefits it isunderstandable acceptable and usable for all the stakeholders from general publicto regulatory bodies and it is linked in a tangible way to the network operatingparameters
The EI is built from the aggregation of individual exposure contributions generated bya specific exposure source in specific exposure situations For instance an averagedindividual exposure generated by WiFi 24 GHz can be calculated at day time for anadult heavy-user located indoors sitting and with a tablet The same kind ofindividual exposure is estimated for other time periods RATs populationsenvironments usages and postures to get complete elements that compose the EIThe individual exposure contributions are weighted according to theirrepresentativeness before aggregation A complete example of EI integration is givenin section 43The individual exposure is the sum of a down-link (DL ndash generated by surroundingbase stations and access points) and up-link (UL ndash generated from personal mobiledevices) components as explained with more details in section 221
The EI is computed in a given area from the aggregation of individual exposurecontributions in a chain of exposure (see Figure 4) The nodes in this chain arerelated to different exposure sources or exposure situations
bull time periods as the configuration of the network and type of usage depend onthe time of day (low-load night-time vs heavily loaded peak-hour)
bull population category as different population categories will have different lifesegmentations and different usages of wireless devices
bull user profile
Document ID D28 Global Wireless Exposure Metric DefinitionFP7 Contract ndeg318273
Version V1 11Dissemination level PU
bull location as the exposure configurations will be different in differentenvironments typically indoors and outdoors
bull radio access technologies RATs (GSM UMTS LTE WiFi etc) frequencybands and deployment layers (macro micro and femto cells) that usersconnect to
bull posture as different body postures will lead to different absorption rates in thehuman body
bull device usage as for example making a phone call does not lead to the sameexposure as downloading data
Figure 4 the LEXNET chain of exposure
Different exposure scenarios [LEXNET D23 2013] are considered and aggregatedby putting weights on each configuration thereby determining the EI A partial EI canbe for example computed for a scenario that considers only a subset of RATspopulation environment etc Then several partial EI can be aggregated with aweight related to their representativenessEI takes into account different parameters coming both from the telecom world todescribe the accessible network environment and from data on how people segmenttheir life to describe how people are using this network
22 Mathematical formalization
221 Exposure Index Equation
The Exposure Index is calculated for a finite geographical area that must preferablybe homogeneous in terms of population and network usage it can be of urbansuburban or rural type for instanceThe general formulation of the Exposure Index contains a set of technicalparameters as described below The number of values classes or settings of eachparameter depends on the level of detail of the available data and on the level ofachievable complexity in terms of calculation For a given geographical area the EItakes the following into account (see also Table 1)
Document ID D28 Global Wireless Exposure Metric DefinitionFP7 Contract ndeg318273
Version V1 12Dissemination level PU
time period (t) eg day and night population (p) segmented into different categories eg children (under 15
yo) young people (15-29 yo) adults (30-59 yo) and seniors (60 yo andover)
user load profiles (l) eg heavy medium light or non-users environment (e) eg indoor (office home) outdoor and in commuting
(bus car subway etchellip) different available Radio Access Technologies (RATs) (r) eg 2G (900
MHz and 1800 MHz) 3G 4G WiFi the number of RATs depends on thescenario
different cell types (c) eg macro micro pico and femto cells theaccessibility to the different cell types depends on the scenario
posture (pos) eg sitting standing usage (u) is described by the device (eg mobile PC laptop) and the
service (eg voice call data)
TimePopulatio
nUser
ProfileEnvironme
ntRAT Cell Type Posture Usage
Day Children Heavy Indoor 2G Macro Standing Voice mobile
Night Youngpeople
Medium
Outdoor 3G Micro Sitting Data mobile
Adults Light Commuting 4G Pico Data Tablet
Seniors Nonuser
WiFi Femto Data Laptopon the laps
Data Laptopon the desk
Table 1 input variables in the modelling of the EI
The individual exposure contributions rely on the SAR expressed in Wkg The SARdepends on the device the frequency band the morphology and the posture of theuser as well as on the position and distance of the source with respect to the user Aspart of LEXNET a set of numerical dosimetric simulations have been performed inorder to fill out a comprehensive matrix of raw normalized SAR values calculated fora reference transmitted power (near-field exposure) or a reference received powerdensity (far-field exposure) These SAR values can be whole-body or localized SARvalues Whole-body SAR values are evaluated by averaging SAR over the whole-body whereas localized SAR values are values focusing on a body volume specificorgan or tissue Different EI can be evaluated depending on the value of interest(whole-body or localized value)Network measurements or simulation tools are expected to provide transmitted andreceived power density average values to apply to the raw SAR matrixInformation and Communication Technologies (ICT) usage data obtained throughsensors inside the network and segmentation life data will finally provide the levels toapply for the evaluation of the EIIt was decided to build the EI based on the dose (SAR x duration of exposure) even ifthere is no evidence today of a higher correlation between the dose and anyhypothetical health effect than with instantaneous peak SAR
Document ID D28 Global Wireless Exposure Metric DefinitionFP7 Contract ndeg318273
Version V1 13Dissemination level PU
SARܫܧ =1
T
tperlcpos ൫ ത
൯
ே
௨
ேೞ
௦
ேಽ
ே
ேೃ
ேಶ
ேು
ே
௧
+ RXinc + ௦ௗ௩௦ோ௦ௗ௩௦
W
kg൨
(1)
where EISAR is the Exposure Index value the average exposure of the population of
the considered geographical area over the considered time frame T SARrefers to whole-body SAR organ-specific SAR or localized SAR
is the number of considered periods within the considered time frame (egsingle day)
is the number of considered Population categories ா is the number of considered Environments ோ is the number of considered Radio Access Technologies is the number of considered Cell types is the number of considered user Load profiles ௦ is the number of considered Postures
is the number of considered Usages with devices ത
is the mean TX power transmitted by the usersrsquo devices during the periodݐ in usage mode ݑ connected to RAT r in environment For example whenEI is computed from simulation tools the TX power can be predicted over amap that covers the whole considered geographical area and the averagevalue is extracted for the EI evaluation See details in section 223
ோis the mean incident power density on the human body during the periodݐ induced by RAT ݎ in environment A distribution of the incident powerdensity for the whole considered geographical area is considered and theaverage value over this area is taken into account for the EI evaluation
ோ௦ௗ௩௦ is the incident power density on the human body during the
period t induced by a wireless device connected to RAT r of a user in theproximity in environment e This term is important when the exposed personis the user itself it can also be significant for persons in the proximity of usersof a wireless device for instance in a crowded meeting room in publictransportation etc In the applications discussed in this paper this term is
neglected We also remark that ோ௦ௗ௩௦ depends on the orientation of
the user of the wireless device with respect to the body of the people in itsproximity See details in section 223
( ୱ
୩W) ௦ௗ௩௦ (
ୱ
୩
୫ మ) and ( ୱ
୩
୫ మ ) are the normalised
raw dose values for UL the DL from the user in the proximity and DL frombase stations and access points respectively all multiplied by the time spentin the configuration See details in section 222
Document ID D28 Global Wireless Exposure Metric DefinitionFP7 Contract ndeg318273
Version V1 14Dissemination level PU
௧௦ is the fraction of the total population that corresponds to populationcategory p user load profile l in posture pos connected to RAT r for a celltype c in environment e during the time period t
In the following we explain the different terms used in the EI formula in more detail
222 Coefficients and
The coefficient is associated to the exposure induced by the uplink andexpressed as an absorbed dose normalised to a transmitted power of 1 W
[ୱ୩
]
=௧௨௦[ୱ]ܦ
௨௦[ܣ ୩]
[ ]
Ws
kgW൨ (2)
where ௧௨௦ܦ
is the time duration of usage ݑ and a user profile load when
connected to the RAT ݎ operating in cell type in the environment for thepopulation category in the posture pos during the time period of the day ݐ
ௌோೠೞ
ಽ
can be the whole body or an organ-specific or tissue-specific
valueܣ for the usage ݑ and the posture pos in the frequency band of theRAT ݎ and the population category calculated for an incident emitted power
of
and normalized to this power
The coefficient is associated to the exposure induced by the downlink and alsoexpressed as an absorbed dose normalised to an incident power density of 1 Wm2
[ୱ୩
]
=௧௦[ୱ]ܦ
௦[ܣ ୩]
RX[W]inc
Ws
kg
W
mଶ൨ (3)
where ௧௦ܦ
is the time duration of posture ݏ when connected to the RAT ݎ
operating in cell type in the environment for the population during thetime period of the day ݐ
ௌோೞ
ವಽ
ௌೃ can be the whole body or an organ-specific or tissue-specific
valueܣ induced by the base station or access points of the RAT ݎ in thepopulation for the posture ݏ normalized to the received power density
ோ
223 Transmitted power ഥ and received power density ത ܖ
ത is the average power transmitted by the device in busy mode (in active
communication) It should be noted that even in idle mode (not for activecommunication) the devices transmit from time to time some power (to stay
Document ID D28 Global Wireless Exposure Metric DefinitionFP7 Contract ndeg318273
Version V1 15Dissemination level PU
synchronized with the network for example) but the exposure induced by the devicein idle mode is negligible as it is based on rare events is the average power density incident on the human body from the base stationsor access points of the RAT The incident power density is assessed not only forusers of mobile devices but also for non-users It is assumed that the usage patternof the user considered in the EI formula does not influence the average incidentpower density From a theoretical point of view is the average incident powerdensity integrated over all the frequency bands of the RAT and cell type consideredFrom a practical point of view can be assessed directly from spectrum analyzer(SA) measurements dosimeters simulations and indirectly from the received poweron a user device or in a drive test measurementത and Sത୧୬ୡ average out the instantaneous variations of the transmitted power and
incident power density that arise during a communication These variations occurwhen the user is static or moving over a very small distance and are caused bydifferent phenomenas (power regulation small-scale fading resource allocation usertraffic variations etc) Values that will be used in the EI evaluation are averagedvalues over the whole considered geographical area
For both the evaluation of the DL incident power density and UL transmitted powerthe ressource allocation or duty cycle of the system has to be taken into account TheEI computation does not rely on maximum allowed power values (as in existing EMFexposure procedures) but on the incident and transmitted powers that respectivelydepend on the DL network and UL user resource load This definition leads to anestimate of the UL transmitted power that necessarily depend on the type of usertraffic (eg voice web browsing file upload etc) the higher is the instantaneous ULthroughput during the communication the higher is generally the UL transmittedpower
224 Exposure from close users
To account for all possible exposure situations in the EI equation (1) we also have toinclude the exposure induced in persons close to an active device operated by a thirdperson This happens for instance in crowded places public transportation andmeeting rooms The exposure is typically induced by a mobile phone laptop or tabletThe exposure induced by nearby active devices can be viewed as a downlinkexposure at the persons in the proximity (see 3rd term in the EI equation (1)) even ifgenerated by an uplink transmission since it would be treated as a far-field exposureThe contribution of radio-frequency radiation originating from other peoplersquos deviceshas been studied in [PLETS15] This contribution has been compared to the totalpersonal absorption in a train environment They found that the absorption fromnearby active mobile devices cannot always be neglected in a GSM macrocellconnection scenario UL of 15 other users can cause up to 19 of total absorptionfor users having themselves a call and up to 100 for non-active persons In anUMTS femtocell connection scenario UL of 15 other users contributes to totalabsorption of a non-active person for no more than 15 Hence in exposuresituations where mobile devices are operated in close proximity of other persons orusers the 3rd term in the EI equation might be non-negligible
Document ID D28 Global Wireless Exposure Metric DefinitionFP7 Contract ndeg318273
Version V1 16Dissemination level PU
3 EXPOSURE INDEX COMPUTATION DATA SOURCES
The EI evaluation relies on the collection of a wide range of data from simulationtools literature models and measurement equipment that have been demonstratedin the LEXNET technical work-packages All the input data that were collected andwere used in the framework of the project are detailed below
31 Life segmentation data
Life segmentation data were extracted from up-to-date life segmentation surveysperformed in the countries involved in LEXNET
In order to evaluate the Exposure Index we needed data for each of the consideredpopulation categories children (under 15 yo) young people (15-29 yo) adults (30-59 yo) and seniors (60 yo and over)
How young people adults and seniors spend their time in Europe was extracted fromthe HETUS survey [HETUS] the French INSEE survey [INSEE] and the time usesurvey in Republic of Serbia [Survey-Serbia] (see Table 2)
Adults Young people Seniors
Gainful work study 500 440 005
Domestic work 300 115 400
Travel 130 120 0050
Sleep 815 900 845
Meals personal care 215 245 330
Free time indoor (TVsocializing readinginternet surfing)
300 400 430
Free time outdoor (sportsgardening hiking)
100 100 220
Total 2400 2400 2400
Table 2 How young people adults and seniors spend their time in Europe
How children spend their time in Europe was extracted from [HOFFERTH01][LARSON01] [LARSON11] and [COOPER10] (see Table 3) Average daily timespent at school or day care for domestic work sleeping eating and personal carewere deduced from [HOFFERTH01] and [LARSON01] Then it was difficult to extractthe free time indoor and outdoor as categories in [HOFFERTH01] do not precise ifactivities such as ldquoother passive leisurerdquo are outdoor or indoor activities From[LARSON11] we could extract that American children spend in average 2h per daydoing outdoor activities From [COOPER10] we could deduce that UK children spendin average 45 min per day outdoor between 330 and 830 PM
Document ID D28 Global Wireless Exposure Metric DefinitionFP7 Contract ndeg318273
Version V1 17Dissemination level PU
Children
School-Day care 345
Domestic work 045
Travel 030
Sleep 1040
Meals personal care 2 30
Free time indoor (TVplaying reading internetsurfing)
435
Free time outdoor 130
Total 2400
Table 3 How children spend their time in Europe
Extracted from Table 2 and Table 3 the data required in EI equation is reported inTable 4
Populationcategory
Day (8 AM-6 PM) Night (6 PM- 8AM)
Indoor(office-school-home)
Outdoor
Transportation (bus carsubwayetchellip)
Indoor(home)
Outdoor
Transportation (bus carsubwayetchellip)
Adults8h15(825)
1h10(115)
35 min
(6)
13h05 min(935)
20 min(25)
35 min
(4)
Youngpeoplestudents
8h20(83)
1h10(115)
30 min
(55)
13h10 min(94)
20 min(25)
30 min
(35)
Children8h15(825)
1h30 (15)
15 min
(25)
13h45 min(985)
0 min
(0 )
15 min
(15)
Seniors7h35(758)
2h10(217)
15 min
(25)
13h05 min(935)
40 min(5)
15 min
(15)
Table 4 Life segmentation inputs for evaluation of the Exposure Index
32 ICT usage data
321 When and where
Figure 5 and Figure 6 show that we are generally using different wireless devices atdifferent time of the day and in different locations Laptops are used in indoorlocations whether at the office or at home Tablets are preferred at home at nightwhereas mobile phones are used throughout the day with a high usage duringcommuting
Document ID D28 Global Wireless Exposure Metric DefinitionFP7 Contract ndeg318273
Version V1 18Dissemination level PU
Figure 5 Devices preferences throughout the day (Source comScore devices EssentialsJanuary 2013)
Figure 6 How and when we use our mobile phones (Source TNS Mobile Life survey)
Crossing this kind of information extracted from survey and life segmentation datawe can assume that about 100 of laptop or tablet usages happens indoors 70 of phone usages is indoors 20 when commuting and 10 outdoors
Document ID D28 Global Wireless Exposure Metric DefinitionFP7 Contract ndeg318273
Version V1 19Dissemination level PU
We also draw the conclusion that 50 of laptop usage happens during the day (from8 AM to 6 PM) and 50 during the night (from 6 PM to 8 AM) For tablet usage weconsider that 20 of the usage happens during the day and 80 during the night
For WiFi usage we make the hypothesis that 100 of wireless device usageshappen indoors
322 Connections per RAT
As shown in Figure 7 (from [CISCO14]) it is forecasted that in 2016 the 4Gconnections will represent 8 of the mobile connections whereas 2G and 3G willrespectively represent 48 and 44 of the connections
Figure 7 Connections by RAT forecast
Figures are a bit different depending on regions As shown on the table belowextracted from [CISCO14] the 4G connections are expected to represent 24 ofmobile connections in 2018 in Western Europe whereas they will represent only 10 of the connections in Central and Eastern Europe
Document ID D28 Global Wireless Exposure Metric DefinitionFP7 Contract ndeg318273
Version V1 20Dissemination level PU
Table 5 Life segmentation inputs for evaluation of the Exposure Index
This forecast is used as a baseline scenario in some of our studies Then promotingchanges in the RAT percentages can be envisaged as a way to reduce the EI
323 Usersnon-users per population category
Using 2013 data on the equipment rates of classical mobile phones and smartphonesand proportions of the French population using a mobile phone for websurfingextracted from the 2013 CREDOC (Centre de Recherche pour lrsquoEtude etlrsquoObservation des Conditions de vie) report [CREDOC13] and data extracted from aMarch 2014 Ipsos survey entitled ldquoLes nouveaux usages des moins de 20 ansrdquo weevaluated the proportions of users and non-users of mobile phones for voicecommunications and data traffic per population category (see Table 6) For childrenunder 8 years old we make the assumption that they are not wireless device users
Mobile phoneusage
Children(under8 yo)
Children(8-12yo)
Children(12-15
yo)
Youngpeople(15-29
yo)
Adults(30-59
yo)
Seniors(over 60
yo)
Voicecommunication
Non-users
100 60 10 4 5 30
Users 0 40 90 96 95 70
Data traffic Non-users
100 90 45 33 59 90
Users 0 10 55 67 41 10
Table 6 Proportions of users and non-users of mobile phones per population category
Using data on the equipment rates of tablets 3G dongles and laptops from[CREDOC] and the March 2014 Ipsos survey we deduced the proportions of usersand non-users of tablets 3G dongles and laptops per population category (see Table7)
Document ID D28 Global Wireless Exposure Metric DefinitionFP7 Contract ndeg318273
Version V1 21Dissemination level PU
Children(under8 yo)
Children(8-12yo)
Children(12-15yo)
Youngpeople(15-29yo)
Adults(30-59yo)
Seniors(over 60yo)
TabletsNon-users
92 81 7877 79 94
Users 8 19 22 23 21 6
3G donglesNon-users
100 100 9290 90 93
Users 0 0 8 10 10 7
LaptopsNon-users
100 100 2122 34 67
Users 0 0 79 78 66 33Table 7 Proportions of users and non-users of tablets 3G dongles and laptops per population
category
324 Tablets and laptops usage data
From [CISCO14] in 2013 the average worldwide mobile data traffic per tablet (from3G and 4G tablets) was 137 GB per month and 24 GB per month for a 4G tabletFrom subscribers billing data collected in January 2014 in Serbia we could derive anaverage monthly traffic per tablet of 083 GBFigure 8 extracted from [CISCO14] gives cellular vs WiFi only tablets ratios
Figure 8 Cellular vs WiFi tablets ratio
From [CISCO14] in 2013 the average mobile data traffic per laptop was 245 GB permonthFrom subscribers billing data collected in January 2014 in Serbia we could derive anaverage monthly traffic per laptop of 34 GB in Serbia
Finally we took the hypothesis that the UL traffic for tablets and laptops represents 15 of the total mobile data traffic
Document ID D28 Global Wireless Exposure Metric DefinitionFP7 Contract ndeg318273
Version V1 22Dissemination level PU
325 Mobile phone usage data
3251 3G data from Orange
Mobile phone usage data were collected through an access network probe localizedat the RNC (Radio Network Controller) level in the 3G Orange France network Threeareas have been monitored one urban area in a district of Paris one suburban areain the region of Clermont-Ferrand and one rural area in the region of Nancy
Extracted data gives per-user and per-hour measurements during one weekbull total duration of voice callsbull number of voice callsbull total duration of UL data sessionsbull number of UL data sessionsbull total volume of UL data sessionsbull total duration of DL data sessionsbull number of DL data sessionsbull total volume of DL data sessions
Averaged daily profiles have been extracted for voice and data services (Figure 9)
Document ID D28 Global Wireless Exposure Metric DefinitionFP7 Contract ndeg318273
Version V1 23Dissemination level PU
Figure 9 Illustration on time variation of mean voice (top figure) and data (bottom figure)usage per user over a day Data have been collected in urban suburban and rural areas during
a week in November 2013 on the 3G Orange France network
The usage is also completely unbalanced among all the users A small number ofusers are consuming a large part of traffic whatever the type of area as illustrated onFigure 10
0 8 12 18 230
01
02
03
04
05
06
07
08
09
1
Hour
Min
ute
Mean Voice Usage in Munites per User During Daily Hours
Urban
Suburban
Rural
Aggregated
0 8 12 18 230
100
200
300
400
500
600
700
Hour
KB
Mean Volume of Data Exchanged in KB per User During Daily Hours
Urban
Suburban
Rural
Aggregated
Document ID D28 Global Wireless Exposure Metric DefinitionFP7 Contract ndeg318273
Version V1Dissemination level PU
Figure 10 Distribution of the voice (toline) suburban (green line) and rura
Three types of profiles were definedbull heavy users top users cobull moderate users users cobull light users users consum
Based on the data recorded in theAs expected there are not sosuburban and urban All the data hTable 9 Table 10 and Table 11 dvoice communication durations ansummarizes the repartition of user p
0 01 02 03 04 05 06 07 08 09 10
01
02
03
04
05
06
07
08
09
1
of users
o
fto
talv
oic
eca
llsd
ura
tion
aggregation
urban
suburban
rural
0 01 02 030
01
02
03
04
05
06
07
08
09
1
o
fto
talv
olu
me
ofd
ata
tra
ffic intermediate
light
heavy
intermediate
light
p figure) al (black lineareas (blue
for voicensumingnsuminging 5 of
networkmuch difave beenetail for dd data trarofiles fo
04 05 of u
heavy
nd data (bottom) areas and aggrline)
and data serv80 of the tota15 of the totathe total data
the user profileferences quanpooled to definifferent geograffic volumes p
r Orange 3G vo
06 07 08sers
aggr
urba
subu
rural
24
figure) traffic for urban (redegated over the 3 types of
icel datal data
s are defined in Table 8titatively between rurale the mean user profilesphical areas the averageer user profile Table 12ice and data usages
09 1
egation
n
rban
Document ID D28 Global Wireless Exposure Metric DefinitionFP7 Contract ndeg318273
Version V1 25Dissemination level PU
3G network
Rural Suburban Urban Global
tcom
[s]voldata
[kB]tcom
[s]voldata
[kB]tcom [s] voldata
[kB]tcom [s] voldata [kB]
Heavyusers
1972 103635 1899 70711 1610 67875 1762 73065
Moderateusers
249 9210 361 7915 233 5242 305 6940
Lightusers
42 492 71 753 41 345 53 504
Table 8 User profiles defined in rural suburban and urban areas
3G (Orangenetwork)
Voice Data (82 DL 18 UL)
Urban tcom (s) volULdata [kB] volDLdata [kB]
Heavy user
Day 841 4948 25124
Night 689 5879 31922
Moderate user
Day 147 464 2390
Night 86 387 2001
Light user
Day 26 35 158
Night 16 28 124
Table 9 Average voice communication durations and data traffic volumes per user profile for a3G Orange dense urban network
3G (Orangenetwork)
Voice Data (81 DL 19 UL)
Suburban tcom (s) volULdata [kB] volDLdata [kB]
Heavy user
Day 1081 5393 30199
Night 743 5175 29941
Moderate user
Day 242 739 3930
Night 119 505 2740
Light user
Day 49 90 382
Night 22 55 226
Table 10 Average voice communication durations and data traffic volumes per user profile for a3G Orange suburban network
Document ID D28 Global Wireless Exposure Metric DefinitionFP7 Contract ndeg318273
Version V1 26Dissemination level PU
3G (Orangenetwork)
Voice Data (79 DL 21 UL)
Rural tcom (s) volULdata [kB] volDLdata [kB]
Heavy user
Day 928 7013 36925
Night 723 9379 50314
Moderate user
Day 164 735 3716
Night 85 754 4005
Light user
Day 28 54 208
Night 14 48 182
Table 11 Average voice communication durations and data traffic volumes per user profile for a3G Orange rural network
Heavy users Moderate users Light users
Voice 20 30 50
Data 10 20 70Table 12 Repartition of user profiles for Orange 3G voice and data usages
3252 2G and 3G data from Telekom Srbja
Telekom Srbja combined data coming from different sources mainlybull Customer analytics systembull Network management system
On one hand data that could be retrieved from the customer analytics system SAScontains personal information on subscriber as
bull agebull genderbull addressbull account type (voice andor data)bull device type (mobile dongle tablet)
Traffic statistics of these subscribers were also collected through the customeranalytics system
On the other hand cell statistics were obtained from the network managementsystem on an hourly basis as
bull number of voice callsbull duration in Erlangbull number of data sessionsbull duration of all data sessions (min)bull volume of UL DL data transfers (kB)
Analyzing data about customer personal information revealed that these datacorrespond mainly to those who pay the bills at the end Employees and children
Document ID D28 Global Wireless Exposure Metric DefinitionFP7 Contract ndeg318273
Version V1 27Dissemination level PU
have been usually hiding respectively behind companies and parents who pay thebills but do not use many of those subscriptions personally
Data used for LEXNET were collected from the customer analytics system SAS andwere based on usersrsquo billing data for the month of January 2014 A LEXNET test areaconsisted of a few representative cells of different types of environment UrbanSuburban and Rural Subscribers who were located in the test area and did generateat least voice or data traffic have been taken into account Traffic data consisted of2G and 3G networks usage all together
Telekom Srbja LEXNET test area (2G and 3G)
User profile Geographical area
Rural Suburban Urban Global
tcom (s) voldata
(kB)tcom (s) voldata
(kB)tcom (s) voldata
(kB)tcom (s) voldata
(kB)
Heavy user 1176 40072 1230 46410 1372 47315 1313 46777
Moderate user 107 4929 120 11208 187 11367 153 11214
Light user 11 735 15 1186 28 1120 21 1181Table 13 User profiles defined in rural suburban and urban areas from TKS usage data
Specific 2G and 3G data were extrapolated considering for voice communicationsthat 72 of communications were made through the 2G network and 28 throughthe 3G For data traffic 91 of the traffic was assigned to 3G and 9 to 2G UL andDL data traffic proportions were respectively assumed to be 17 and 83 Thoseratios were calculated based on cell statistics that were obtained from the networkmanagement system on an hourly basis for same period of time Cells were same asthose used for identifying subscribers Finally three types of user profiles weredefined for voice and data service (see Figure 11 and Figure 12)bull heavy users top users consuming 80 of the total databull moderate users users consuming 15 of the total databull light users users consuming 5 of the total data
Table 13 details for different geographical areas the average voice communicationdurations and data traffic volumes per user profile
Figure 11 Distribution of the voice traffic for urban (red line) suburban (green line) and rural(black line) areas and aggregated over the 3 types of areas (blue line)
Document ID D28 Global Wireless Exposure Metric DefinitionFP7 Contract ndeg318273
Version V1 28Dissemination level PU
Figure 12 Distribution of the data traffic for urban (red line) suburban (green line) and rural(black line) areas and aggregated over the 3 types of areas (blue line)
The repartition of voice communications and data traffic over the two periods dayand night was extracted from the type of call statistics over 24h (see Figure 13 andFigure 14)The voice hourly extrapolation was based on outgoing calls and data extrapolationwas based on prepaid traffic due to limitations on the customer analytics system
Figure 13 Mobile phone voice communications hourly distribution over 24h
Document ID D28 Global Wireless Exposure Metric DefinitionFP7 Contract ndeg318273
Version V1 29Dissemination level PU
Figure 14 Mobile phone data traffic hourly distribution over 24h
63 of mobile phone voice and 48 data traffic were made during the day period(8 AM ndash 6 PM) and 37 and 52 respectively during the night period (6 PM ndash 8AM)Finally we could extract the average communication times and data traffic volumesper user profile for different geographical areas for 2G and 3G Telekom Srbjanetworks (see tables from 13 to 18)
2G (Telekom Srbja) Voice Data (83 DL 17 UL)
Urban tcom (s) volULdata [kB] volDLdata [kB]
Heavy user
Day 619 342 1660
Night 368 373 1807
Moderate user
Day 84 82 399
Night 50 90 434
Light user
Day 12 9 43
Night 7 10 47
Table 14 Average voice communication durations and data traffic volumes per user profile for a2G Telekom Srbja dense urban network
Document ID D28 Global Wireless Exposure Metric DefinitionFP7 Contract ndeg318273
Version V1 30Dissemination level PU
2G (Telekom Srbja) Voice Data (83 DL 17 UL)
Suburban tcom (s) volULdata [kB] volDLdata [kB]
Heavy user
Day 554 336 1828
Night 330 365 1773
Moderate user
Day 54 81 393
Night 32 88 428
Light user
Day 7 9 42
Night 4 9 45
Table 15 Average voice communication durations and data traffic volumes per user profile for a2G Telekom Srbja suburban network
2G (Telekom Srbja) Voice Data (83 DL 17 UL)
Rural tcom (s) volULdata [kB] volDLdata [kB]
Heavy user
Day 530 290 1406
Night 316 316 1531
Moderate user
Day 48 36 173
Night 29 39 188
Light user
Day 5 5 26
Night 3 6 28
Table 16 Average voice communication durations and data traffic volumes per user profile for a2G Telekom Srbja rural network
3G (Telekom Srbja) Voice Data (83 DL 17 UL)
Urban tcom (s) volULdata [kB] volDLdata [kB]
Heavy user
Day 242 3529 17119
Night 144 3843 18642
Moderate user
Day 33 848 4113
Night 20 923 4479
Light user
Day 5 91 441
Night 3 99 481
Table 17 Average voice communication durations and data traffic volumes per user profile for a3G Telekom Srbja dense urban network
Document ID D28 Global Wireless Exposure Metric DefinitionFP7 Contract ndeg318273
Version V1 31Dissemination level PU
3G (Telekom Srbja) Voice Data (83 DL 17 UL)
Suburban tcom (s) volULdata [kB] volDLdata [kB]
Heavy user
Day 216 3461 16791
Night 129 3769 18286
Moderate user
Day 21 836 4055
Night 13 910 4416
Light user
Day 3 88 429
Night 2 96 467
Table 18 Average voice communication durations and data traffic volumes per user profile for a3G Telekom Srbja suburban network
3G (Telekom Srbja) Voice Data (83 DL 17 UL)
Rural tcom (s) volULdata [kB] volDLdata [kB]
Heavy user
Day 207 2989 14498
Night 123 3255 15789
Moderate user
Day 19 368 1783
Night 11 400 1942
Light user
Day 2 55 266
Night 1 60 290
Table 19 Average voice communication durations and data traffic volumes per user profile for a3G Telekom Srbja rural network
Heavy users Moderate users Light users
Voice 47 25 28
Data 24 18 58Table 20 Repartition of user profiles for Telekom Serbia 2G and 3G voice and data usages
We can see that majority of voice communications at the test area in Serbia is doneover 2G contrary to what has been observed in Orange network Due to that reasonvoice communication is significantly lower on 3G than in the test area in FranceAverage data traffic volumes per user in France are a bit different than average datatraffic volumes at the test area in Serbia depending on the considered geographicalarea The repartitions of user profiles are also very different for voice usagesbetween Orange data and Telekom Serbia data A larger percentage of users areheavy users at Telekom Srbja while at Orange France there are more light users inthe test areas
Document ID D28 Global Wireless Exposure Metric DefinitionFP7 Contract ndeg318273
Version V1 32Dissemination level PU
3253 Extrapolation of 3G data to LTE
LTE data were collected from Orange network probes installed in Orange LTEnetwork For different geographical areas (urban suburban and rural) in the North ofFrance we could collect for some time periods during June 2014 the number of LTEusers and the total volumes of DL and UL data traffic Proceeding like we did for 3Gdata we extracted average user profiles (see Figure 15)
Figure 15 Distribution of data traffic aggregated over the 3 types of geographical areas for LTEnetwork
Then we evaluated the average volumes of LTE data traffic per day and per userprofile (see Table 21)
LTE network voldata [KB]
Heavy users 160639
Moderate users 60396
Light users 31003
Table 21 Average volumes of LTE data traffic per day per user profile
Comparing these data with data in Table 8 in the Global column we extract thefollowing 3G to LTE extrapolation ratios
Heavy user 22 Moderate user 87 Light user 615
The repartition of user profiles for Orange LTE data usages based on Figure 15 issummarized in Table 22
Heavy users Moderate users Light users
60 15 25 Table 22 Repartition of user profiles for Orange LTE data usages
Document ID D28 Global Wireless Exposure Metric DefinitionFP7 Contract ndeg318273
Version V1 33Dissemination level PU
This repartition is completely different compared to the repartition of user profiles forOrange 3G data usages The ratio between heavy usage and moderate usage is only25 for LTE while it is a factor 10 for 3G
326 IP traffic through WiFi
From [CISCO14] in 2014 9739 PB per month of IP traffic were generated byWestern Europeans and 4416 PB per month by Central and Eastern Europeans22 of the IP traffic was generated by tablets 35 by smartphones and 672 by PCs And about 41 of the total IP traffic was transmitted from FixedWiFiaccess
Considering that in Western Europe tablets were accounting for 6 (566 M) of allnetworked devices smartphones for 14 (2239 M) and PCs for 17 (2718 M) wecan evaluate the average IP traffic through WiFi per user per month for WesternEurope The same calculation was performed for Central and Eastern Europe (Table23)
Device Western Europe Central and Eastern Europe
smartphone 623 MB 410 MB
tablet 155 GB 22 GB
PC 99 GB 96 GBTable 23 Average IP traffic volumes through WiFi per device per user per month for Western
Europe and Central and Eastern Europe
We took the hypothesis that the UL traffic for WiFi represents 17 of the total datatraffic
327 Usage differences between the population categories
ICT usages are different depending on the age category of people The numbers inthe previous sections were extracted without distinction of the age category of usersWe are able nevertheless to play with the user profiles repartition For exampleconsidering a high school survey performed in Portugal between 2010 and 2014[SBOC12] teenagers were reported to use their mobile phone for voicecommunication an average of 30 minutes per day which corresponds to a heavyuser profile (see Figure 16) We could then consider a higher heavy user profilepercentage among young peopleIn [BYUN13] they assessed mobile phone usages in terms of number of calls per dayand average duration per call amongst Korean children and teenagers They haveshown that Korean children are on average using less than 5 minutes per day theirmobile phones for calling which would correspond to the usage for voice calls of amoderate userBesides in absence of any known study on the topic we are making the hypothesisthat a large percentage of seniors are light users
Document ID D28 Global Wireless Exposure Metric DefinitionFP7 Contract ndeg318273
Version V1 34Dissemination level PU
Figure 16 Distribution of Daily talk time by teenagers in Portugal (2378 3320 and 597answers in 201011 201112 and 201314 respectively)
We were obliged in the LEXNET project to fix precise numbers in order that to build areference scenario for EI assessment technical workpackages As explained abovesome result from statistical studies some others have been defined from basicassumptions
2G3GTelekom Srbja
Heavy users Moderate users Light users
Children Voice 25 50 25
Data 60 20 20
Young people Voice 47 25 28
Data 60 20 20
Adults Voice 47 25 28
Data 24 18 58
Seniors Voice 47 25 28
Data 5 25 70 Table 24 Repartition of user profiles for Telekom Serbia 2G and 3G usages for each population
category
3G Orange Heavy users Moderate users Light users
Children Voice 20 30 50
Data 50 40 10
Young people Voice 50 30 20
Data 50 40 10
Adults Voice 20 30 50
Data 10 20 70
Seniors Voice 20 30 50
Data 5 25 70Table 25 Repartition of user profiles for Orange 3G usages for each population category
0
5
10
15
20
25
30
35
DNK 0 1-9 10-19 20-29 30-59 60-119 ge120
Daily Talk time [minutes]
201011
201112
201314
Document ID D28 Global Wireless Exposure Metric DefinitionFP7 Contract ndeg318273
Version V1 35Dissemination level PU
LTE Orange Heavy users Moderate users Light users
Children 30 40 30
Young people 80 10 10
Adults 60 15 25
Seniors 10 40 50 Table 26 Repartition of user profiles for Orange LTE usages for each population category
33 SAR data
Reference SAR data were computed using 3D electromagnetic simulation platformsbased on the Finite Difference Time Domain (FDTD) [TAFLOVE00] and FiniteIntegration Technique (FIT) [WEIL77] methods SAR values were calculated for far-field and near-field exposure for two anatomical human body models of the VirtualFamily [CHRIST10] Duke a 34-year-old male and Eartha an 8-year-old girl Twopostures (standing and sitting) and three usages (mobile phone close to the headmobile phone or tablet for data and laptop usage) were selected More details onnumerical simulations can be found in [LEXNET IR21 2013]
Table 27 shows reference Whole-body SAR (WBSAR) values calculated for far-fieldand near-field exposure of the adult and the child models at four different frequencybands (see deliverable D26 Appendix 1 for specifications of frequency bands) Table28 shows reference WBSAR values calculated for exposure of the adult and the childmodels at 2100 MHz relevant for a human model standing or sitting close to theaccess point (this access point can be a femtocell or a WLAN access point)
WBSAR Frequency band
400 MHz 900 MHz 1940 MHz 2600 MHz
Child - voicesitting
DOWN 00088 00082 00071 00066
UP X 0029 0011 0014
Adult - voicesitting
DOWN 00050 00056 00043 00039
UP X 0012 00052 00047
Child - voicestanding
DOWN 00082 00084 00077 00071
UP X 0029 001 0015
Adult - voicestanding
DOWN 00064 00052 00046 00042
UP X 0012 00052 00053
Child - datasitting
DOWN 00090 00088 00071 00065
UP 0011 0011 00135 00094
Adult - datasitting
DOWN 00054 00046 00043 00038
UP 00078 00056 00081 00037
Child - datastanding
DOWN 00088 00090 00077 00072
UP 0013 001 00109 00083
Adult - datastanding
DOWN 0006 00052 00047 00042
UP 00064 00049 00039 00029
Child ndash laptopon the lap
DOWN X X 00069 00066
UP X X 00035 00038
Adult ndash laptop DOWN X X 00053 00049
Document ID D28 Global Wireless Exposure Metric DefinitionFP7 Contract ndeg318273
Version V1 36Dissemination level PU
on the lap UP X X 00027 0003
Child ndash laptopon a desk
DOWN X X 00069 00066
UP X X 00025 00031
Adult ndash laptopon a desk
DOWN X X 00053 00049
UP X X 00035 00027Table 27 Whole-body SAR data in Wkg for child and adult models for different devices in
different postures at different frequencies
WBSAR Femtocell (2100 MHz)Child ndash voice sitting 0000190Adult ndash voice sitting 000014Child ndash voice standing 000023Adult ndash voice standing 000013
Table 28 Whole-body SAR data in Wkg for child and adult models for a femtocell for differentpostures (reference transmitted power of 1 W)
UP stands for Uplink exposure to device) Values are normalized to a referencetransmitted power of 1 WDOWN stands for Downlink exposure to base-stations Values are normalized to areference received power density of 1 Wm-2
For the future we could imagine performing new SAR simulations for new new typesof wireless device For instance Appendix 1 presents the results of dosimetricsimulations performed with Google glasses [GLAS15]
Document ID D28 Global Wireless Exposure Metric DefinitionFP7 Contract ndeg318273
Version V1 37Dissemination level PU
4 EI INTEGRATION METHODOLOGY ON A MACRO 3G DENSE URBAN
SCENARIO
41 Scenario
We are showing in this section the EI integration methodology over 24 hours for amacro urban Orange 3G scenario
TimePopulatio
nEnvironment RAT
CellType
UserProfile
Posture Usage
Day Children Indoor 3G Macro Heavy StandingData
mobile
NightYoungpeople
OutdoorModerat
eSitting
Voicemobile
Adults LightDatatablet
Seniors Non userData
laptopTable 29 Input parameters for the macro urban Orange 3G scenario
The considered urban area is located into a typical European urban area in thecentre of Lyon (3rd largest city in France) (see Figure 17)
Figure 17 Urban area in Lyon
42 Input data
Time period Two time periods are considered the day time period from 8 am to 6 pm (10 hours intotal) and the night time period from 6 pm to 8 am (14 hours in total)
Population categories
Document ID D28 Global Wireless Exposure Metric DefinitionFP7 Contract ndeg318273
Version V1 38Dissemination level PU
4 population categories are considered Children (below 15 years) young people(between 15 and 29 years) adults (between 30 and 59 years) and seniors (over 60years)
Figure 18 Repartition by age of the population in the first district of Lyon in 2007 (from httphttpwwwcartesfrancefr)
From Figure 18 we extracted the repartition of the four population categories in thefirst district of Lyon
Populationcategory
Percentage
Children 139 Young people 328 Adults 382 Seniors 151 Table 30 Repartition of the population in the centre of Lyon
Environment ா
Two environments are considered indoor and outdoor environments Table 31 isderived from Table 4 considering that the time spent commuting is spent outdoor inour scenario
Day (from 8am to 6pm) Night (from 6pm to 8am)
Indoor Outdoor Indoor Outdoor
Children 8h15 (825) 1h45 (175) 13h45 (982) 15 min (18)
Young people 8h20 (83) 1h40 (17) 13h10 (94) 50 min (6)
Adults 8h15 (825) 1h45 (175) 13h05 (935) 55 min (65)
Seniors 7h35 (70) 2h25(30) 13h05 (935) 55 min (65)
Table 31 Repartition of each category of population by environment and time period
Consequently we are considering that 70 of mobile phone usages happen indoorsand 30 outdoors 100 of tablet and laptop usages are indoor usages
Macro 3G network ோ
Document ID D28 Global Wireless Exposure Metric DefinitionFP7 Contract ndeg318273
Version V1 39Dissemination level PU
User Profiles
Three user profiles (heavy moderate and light profiles) are used for mobile phoneusers and one moderate user profile for tablet and laptop users
Posture ௦ and Usage
Two network usages for the mobile phone are considered voice and data trafficusage If the mobile phone is used in indoor environment we consider that the useris in a sitting posture And if the mobile phone is used in outdoor environment weconsider that the user is in a standing posture For each population category wederived from Table 6 and Table 7 the proportions of users and non-users of mobilephones 3G tablets and 3G dongles (Table 32) Table 33 and Table 34 giverespectively average voice communication durations and data traffic volumes permobile phone user profile and the repartition of user profiles per population category
Children(under15 yo)
Youngpeople(15-29
yo)
Adults(30-59
yo)
Seniors(over 60
yo)
Mobile phone usageVoice communication
Non-users 68 4 5 30
Users 32 96 95 70
Mobile phone usageData traffic
Non-users 84 33 59 90
Users 16 67 41 10
3G Tablet usageNon-users 95 92 93 98
Users 5 8 7 2
3G dongle usageNon-users 98 90 90 93
Users 2 10 10 7Table 32 Proportions of users and non-users of mobile phones 3G tablets and 3G dongles perpopulation category
3G Voice Data (82 DL 18 UL)
Urban tcom (s) volULdata [kB] volDLdata [kB]
Heavy user
Day 841 4948 25124
Night 689 5879 31922
Medium user
Day 147 464 2390
Night 86 387 2001
Light user
Day 26 35 158
Night 16 28 124
Table 33 Average voice communication durations and data traffic volumes per mobile phoneuser profile
Document ID D28 Global Wireless Exposure Metric DefinitionFP7 Contract ndeg318273
Version V1 40Dissemination level PU
3G Orange Heavy users Moderate users Light users
Children Voice 20 30 50
Data 50 40 10
Young people Voice 50 30 20
Data 50 40 10
Adults Voice 20 30 50
Data 10 20 70
Seniors Voice 20 30 50
Data 5 25 70Table 34 Repartition of mobile phone user profiles for Orange 3G usages for each populationcategory
For 3G tablet usage we consider an average data traffic volume of 457 MB per dayper user whatever the population category 20 (91 MB) during day time and 80 (366 MB) during night time We are making the assumption that 15 of this traffic ison UL
For 3G dongle usage we consider an average data traffic volume of 816 MB per dayper user whatever the population category 50 (408 MB) during day time and 50 during night time As for the tablet we are making the assumption that 15 of thistraffic is on UL
Reference SAR values
SAR values are those extracted from Table 27 for the 1940 MHz frequency band Weuse adult values for young people adult and senior population categories and childvalues for child category
Received ோ transmittedത powers and UL data throughputs
Received ோ transmittedത powers and UL data throughputs can be derived fromnetwork simulation or from drive-test measurements in Lyon eg dosimetermeasurements for the DL power and TRACE mobile measurements for the ULpowerMean values indoor outdoor during the day and during the night are needed
43 EI integration
Considering Figure 7 we made the hypothesis that in 2016 48 of the population ofthe 1st district of Lyon is using a 3G network And considering the existence of fourtelecom operators in France we assumed that only 25 of these 48 3G users aresubscribers of the Orange 3G network
=ܫܧ 0139 lowast ௗܫܧ + 0328 lowast ௬௨ܫܧ + 0382 lowast +ௗ௨௧௦ܫܧ 0151 lowast ௦௦ܫܧ (4)
We propose to detail the calculation for one population category ie the adult oneTable 35 details the different macro urban 3G input parameters
Document ID D28 Global Wireless Exposure Metric DefinitionFP7 Contract ndeg318273
Version V1 41Dissemination level PU
Variable Abbreviation value
Time spent indoor during the day ௗ௬ௗݐ 29700 s
Time spent outdoor during the day ௗ௬௨௧ௗݐ 6300 s
Time spent indoor during the night ௧ௗݐ 47100 s
Time spent outdoor during the night ௧௨௧ௗݐ 3300 s
Mobile phone usage
Percentage of 3G connections ݎ ݐ ଷೞ 048
Percentage of mobile phone users for voicecalls
ݎ ݐ ௨௦௩ 095
Percentage of mobile phone users for datatraffic
ݎ ݐ ௨௦ௗ௧ 041
Average duration of mobile phone use indoorfor voice calls during the day
ௗ௬ௗ௩ݐ 15771 s
Average duration of mobile phone useoutdoor for voice calls during the day
ௗ௬௨௧ௗ௩ݐ 6759 s
Average duration of mobile phone use indoorfor voice calls during the night
௧ௗ௩ݐ 12012 s
Average duration of mobile phone useoutdoor for voice calls during the night
௧௨௧ௗ௩ݐ 5148 s
Average UL volume of mobile phone datatraffic indoor during the day
ݒ ௗ௧ௗ௬ௗ 42847 kB
Average UL volume of mobile phone datatraffic during the day
ݒ ௗ௧ௗ௬௨௧ௗ 18363 kB
Average UL volume of mobile phone datatraffic indoor during the night
ݒ ௗ௧௧ௗ 47943 kB
Average UL volume of mobile phone datatraffic during the night
ݒ ௗ௧௧௨௧ௗ 20547 kB
3G Tablet usage
Percentage of 3G tablet users ݎ ݐ ௨௦ଷ௧௧ 007
Average UL volume of tablet data trafficduring the day
ݒ ௧௧ௗ௬ 1365 kB
Average UL volume of tablet data trafficduring the night
ݒ ௧௧௧ 5490 kB
3G dongle usage
Percentage of 3G dongle users ݎ ݐ ௨௦ଷௗ 010
Average UL volume of laptop data trafficduring the day
ݒ ௧ௗ௬ 6120 kB
Average UL volume of laptop data trafficduring the night
ݒ ௧௧ 6120 kB
Reference SAR values
UL WBSAR for a phone call in voice modeindoor
ܤ ௩ܣ 00052 Wkg
UL WBSAR for a phone call in voice modeoutdoor
ܤ ௩௨௧ܣ 00052 Wkg
UL WBSAR for a phone call in data mode ܤ ௗ௧ܣ 00081 Wkg
Document ID D28 Global Wireless Exposure Metric DefinitionFP7 Contract ndeg318273
Version V1 42Dissemination level PU
indoor
UL WBSAR for a phone call in data modeoutdoor
ܤ ௗ௧௨௧ܣ 00039 Wkg
UL WBSAR for a laptop usage ܤ ௧ܣ 00035 Wkg
DL WBSAR indoor ܤ ܣ 00043 Wkg
DL WBSAR outdoor ܤ ௨௧ܣ 00047 WkgTable 35 Macro urban 3G scenario input data
ௗ௨௧௦ܫܧ = ܫܧ + ௨௧ܫܧ + ܫܧ + ௨௧ܫܧ (5)
ௗ௨௧௦ܫܧ = ଵ lowast തௗௗ௬௩ + ଶ lowast ത
௨௧ௗௗ௬௩ + ଷ lowast തௗ௧௩ + ସ lowast
ത௨௧ௗ௧௩ + ହ lowast
ത
+ lowast
തೠ
ೠ+ lowast
ത
+ lowast
തೠ
ೠ+ ଽ lowast RXindoorday + ଵ lowast RXoutdoorday + ଵଵ lowast RXindoornight + ଵଶ lowast
RXoutdoornight (6)
Whereത RXTh represent respectively mean transmitted power values mean
received power density values and average UL throughputs
ଵ to ସ are constant coefficients characterizing UL exposure for voice call usage
ଵ =ଶହlowast௧యಸೞ
ଶସlowastଷlowast ௗ௬ௗ௩ݐ] lowast ܤ ௩ܣ lowast ݎ ݐ ௨௦௩]
ଶ =ଶହlowast௧యಸೞ
ଶସlowastଷlowast ௗ௬௨௧ௗ௩ݐ] lowast ܤ lowast௩௨௧ܣ ݎ ݐ ௨௦௩]
ଷ =ଶହlowast௧యಸೞ
ଶସlowastଷlowast ௧ௗ௩ݐ] lowast ܤ ௩ܣ lowast ݎ ݐ ௨௦௩]
ଵ =ଶହlowast௧యಸೞ
ଶସlowastଷlowast ௧௨௧ௗ௩ݐ] lowast ܤ lowast௩௨௧ܣ ݎ ݐ ௨௦௩]
ହ to are constant coefficients characterizing UL exposure for data usage
ହ =025
24 lowast 3600lowast ൫ ݎ ݐ ଷೞ lowast ݎ ݐ ௨௦ௗ௧ lowast ݒ ௗ௧ௗ௬ௗ
+ ݎ ݐ ௨௦ଷ௧௧lowast ݒ ௧௧ௗ௬൯lowast ܤ ௗ௧ܣ+ ݎ ݐ ௨௦ଷௗ lowast ݒ ௧ௗ௬ lowast ௧൧ܤ
=025 lowast ݎ ݐ ଷೞ
24 lowast 3600lowast ݎ ݐ ௨௦ௗ௧ lowast ݒ ௗ௧ௗ௬௨௧ௗ lowast ܤ ௗ௧௨௧ܣ
=025
24 lowast 3600lowast ൫ ݎ ݐ ଷೞ lowast ݎ ݐ ௨௦ௗ௧ lowast ݒ ௗ௧௧ௗ
+ ݎ ݐ ௨௦ଷ௧௧lowast ݒ ௧௧௧൯lowast ܤ ௗ௧ܣ+ ݎ ݐ ௨௦ଷௗ lowast ݒ ௧௧lowast ௧൧ܤ
Document ID D28 Global Wireless Exposure Metric DefinitionFP7 Contract ndeg318273
Version V1 43Dissemination level PU
=025 lowast ݎ ݐ ଷೞ
24 lowast 3600lowast ݎ ݐ ௨௦ௗ௧ lowast ݒ ௗ௧௧௨௧ௗ
lowast ܤ ௗ௧௨௧ܣ
ଽ to ଵଶ are constant coefficients characterizing DL exposure
ଽ =ௗ௬ௗݐ lowast ܤ ܣ
24 lowast 3600
ଵ =ௗ௬௨௧ௗݐ lowast ܤ ௨௧ܣ
24 lowast 3600
ଵଵ =௧ௗݐ lowast ܤ ܣ
24 lowast 3600
ଵଶ =௧௨௧ௗݐ lowast ܤ ௨௧ܣ
24 lowast 3600
5 VARIABILITY AND UNCERTAINTIES
The EI is the output of an analytical model expressed by the equation (1) with anumber of uncertain input variables To propagate the uncertainty associated to theinput variables in the model the first step consists in characterizing the distribution ofinput variables Each uncertain variable input has to be described by a statisticaldistributionAverage DL power density and UL transmitted power are estimated using specificconfigurations environments and usages The downlink power absorbed by the userand the uplink power emitted by the device (and so partially absorbed by the user)depend on these configurations environments and usages Their statisticaldistributions have to be characterized in order to be incorporated in the total EIstatistical uncertaintyThe uncertainties of ICT usage data have been analyzed and modelled usingcomputable functions such as Gamma Gaussian or uniform distributions and asensitivity analysis has been carried out in order to determine the most importantparameters in the EI equation and how we could simplify the EI formula
51 Variability of the power transmitted by wireless personaldevices
In this subsection a methodology dedicated to characterize the variability of the
power radiated by wireless personal devices under specific propagation assumptions
is introduced
Studies focusing on SAR variability induced by sources generally did not take intoconsideration the impact of the propagation channel especially for an uplinktransmission In the framework of numerical dosimetric simulations for the LEXNETproject we analyzed the variability of the power radiated by wireless personal devicesunder specific propagation assumptions Interactions between the human body and
Document ID D28 Global Wireless Exposure Metric DefinitionFP7 Contract ndeg318273
Version V1 44Dissemination level PU
the antenna remain a complicated subject due to the high variability of theseparameters such as the type of antenna and the body shape These interactionshave been often investigated toward two disjoint objectives One is dedicated toanalyze the effect of the antenna radiation on the human body whereas the second isdevoted to study the effects of human body on the antenna performance In wirelesscommunications devices are usually placed close to the human body and as aconsequence part of the energy is necessarily absorbed The averaged SAR overthe whole body depends on many parameters such as the design of the antennaand its position with respect to the human body In our study we focused on both thequantification of the SAR and the statistical characterization of the variability of theradiated power We analyzed the influence of the positioning of the personal deviceagainst the human body on the SAR and the variability of the power radiated in bothLOS and NLOS (Non-line of Sight) scenariosDuring the communication the power radiated by the transmitter system dependsfundamentally on the gain in the LOS direction Since an antenna radiation pattern isusually anisotropic this parameter varies after each change in the transmitterorientation with respect to the base station For interference limitation reasons thetransmitted power is commonly adjusted to a minimum level consistent with apredetermined link quality Then the power radiated P
rmust be simultaneously
changed with the gain Ge (ϕLOS θLOS) in order to meet the requirements of receiver interms of signal to noise ratio (SNR) In practice assuming a constant noise powerthe received power (at the base station) must be such that the same SNR ismaintained in order to ensure a successful decoding This means that the product ofthe power radiated by the transmitting antenna (P
r) and of its power gain (Ge) in the
LOS direction should be constant
PrGe (ϕLOS θLOS) = α (7)
At first the personal device was assumed to be placed in a fixed position with respectto the userrsquos body Thus the userrsquos body and the personal device compose aninvariant transmitter system S The sphere surrounding the system S represents thesphere on which the various parts of a radiation pattern are calculated It is assumedto be fixed with respect to the base station while the system S can rotate alongazimuth and elevation angles The orientation of the system S with respect to the
base station axes is given by a random variable Ωs(S
S) where
Sand
Sare
respectively the angles of rotation of S around the vertical axis zrsquoOz and thehorizontal plane xOy (Figure 19)
Document ID D28 Global Wireless Exposure Metric DefinitionFP7 Contract ndeg318273
Version V1 45Dissemination level PU
Figure 19 Design concept
Figure 20 Comparison of radiation patterns of the laptop in free space and in the presence ofhuman body
Document ID D28 Global Wireless Exposure Metric DefinitionFP7 Contract ndeg318273
Version V1 46Dissemination level PU
Figure 21 Comparison of radiation patterns of the mobile phone in free space and in thepresence of human body
In the case of the laptop (Figure 20) the gain variation is smaller than the oneobtained in the mobile phone case (Figure 21) This can be explained by the fartherdistance between the 3G USB dongle and the human body The gain pattern isactually almost identical to the free space pattern as shown in the two planes Thesmall difference between both stems is due to reflection of waves by the body In thexz plane the effect of the left leg is observable around the direction θ = 270deg Since the exposure is proportional to the power radiated by the device whichdepends on many parameters a statistical analysis of this physical quantity isrequired in the modeling of the exposure Based on relationship (7) the powerradiated can be written in the following form
Pr =
ୋ ሺஐೞǡథಽೀೄǡಽೀೄ)(8)
where α is arbitrarily chosen equal to 1mW The gain Ge (Ω௦ǡைௌ θைௌ) depends on
the relative orientation (Ωs(S
S)) of the transmitter system with respect to the base
station To simplify computations S
and S
are assumed to follow a discrete uniform
distribution over [0deg 360deg] and [-45deg +45deg] respectively
Voice posture case
Figure 22 and Figure 23 show that the radiated power depends strongly on the localattenuation caused by the body shadowing effects It is very clear that it increaseslogarithmically with the attenuation level In this respect the quasi lognormalcharacter of the distribution is not surprising This statistical behavior remains typicalof Body Area Networks
Document ID D28 Global Wireless Exposure Metric DefinitionFP7 Contract ndeg318273
Version V1 47Dissemination level PU
Figure 22 Comparison between the empirical and the analytical distribution function obtainedwith the standing voice communication posture at 900 MHz
Figure 23 Comparison between the empirical and the analytical distributions function obtainedwith the sitting voice communication posture at 900 MHz
Between the two voice postures (standing and sitting) a small variation in theparameters of the distributions is noticed This is due to the fact that the antenna gainis mainly affected by the upper body portion The latter is not perfectly identical inboth postures in spite of the identical positions of the hand and the hand + head withrespect to the mobile phone This is due to a few constraints in building thecomputerized body models
Laptop posture case
In the case of laptop the variability of the radiated power is not very large The highpeaks of radiated power are up to 20mW which is smaller than those noticed withthe mobile phone These results can be explained by the fact that the 3G USBdongle is localized away from the human body (Figure 24)
Document ID D28 Global Wireless Exposure Metric DefinitionFP7 Contract ndeg318273
Version V1 48Dissemination level PU
Figure 24 Comparison between the empirical and the analytical distribution functions obtainedwith the laptop posture at 1940 MHz
During the post-processing a particular attention was given to the limitation of themaximum power that can be radiated by the mobile phone Particularly in the case ofGSM 900 MHz the average power radiated by the mobile antenna is always limitedto a threshold power of 250 mW
The results show that the performance of the antenna is significantly affected interms of radiation efficiency as well as shape of the radiation patterns especially inthe case of a mobile phone use for voice calls This observation is reflected by theabsorption of a huge amount of radiated power by the head and the hand and also bythe partial reflection of the waves by the body Furthermore the degradation of theradiation efficiency and the level of exposure level showed a (moderate) sensitivity tothe change in the position of the personal device with respect to the human bodyparticularly in the case of the laptopIn a wireless network context the exposure has been found to be strongly dependenton the local propagation environment owing to the power control enforced by mostwireless communications standards This was addressed by combining the Whole-body SAR value (calculated for a constant power) with a statistical distribution of theradiated power for various user positions expressing the dependence on theposition of the device with respect to the body and the impact of the propagationchannel (eg the number of paths their attenuation and the departure angles)
52 EI variability
The assessment of the EI is based on input parameters collected from surveyssimulations and measurements These input parameters can be divided into severalgroups as presented in section 3 ICT usage data have a great and direct impact onthe exposure duration And due to the complexity variability as well as confidentialityICT usage data are not easy to obtain and therefore to characterize Using the datacollected in the framework of LEXNET project a statistical analysis was performed inorder to characterize this variability Then a random sampling from probability
Document ID D28 Global Wireless Exposure Metric DefinitionFP7 Contract ndeg318273
Version V1 49Dissemination level PU
distributions of ICT usage data was realized in order to characterize the EI variabilityand uncertainty with respect to ICT usage data (we considered other groups of dataas constant values) by using Monte Carlo method
521 Statistical analysis of ICT usage data
We considered ICT usage data as twelve different input parameters summarized inTable 36 Based on daily traffic consumption recorded on the 3G network of Orangeeach parameter was well defined in order to characterize its statistical distribution
Input parameter Description
Htday Total voice call duration during the day for heavyusers
Mtday Total voice call duration during the day for moderateusers
Ltday Total voice call duration during the day for light users
Htnight Total voice call duration during the night for heavyusers
Mtnight Total voice call duration during the night formoderate users
Ltnight Total voice call duration during the night for lightusers
Hvolday Data traffic volume during the day for heavy users
Mvolday Data traffic volume during the day for moderate users
Lvolday Data traffic volume during the day for light users
Hvolnight Data traffic volume during the night for heavy users
Mvolnight Data traffic volume during the night for moderateusers
Lvolnight Data traffic volume during the night for light usersTable 36 ICT usage data represented by twelve different input parameters
In our study we used Akaike Information Criterion (AIC) in order to determinate thedistributions followed by the different input parameters This measurement isdeveloped using information theory for model selection It offers an estimation of therelative quality among some given statistical models for a set of data by evaluatingAIC value of each model From the equation below we can see that AIC depends onL (value of likelihood function for the model) and k (number of estimated parametersin the model) Great L will offer us a more accurate model but at the same time greatk may lead to overfitting
AIC=2k-2log(L) (9)
Hence AIC encourages the advantage of fitting (by maximizing L) while trying toavoid overfitting (by minimizing k) The preferred model is the one with the minimumAIC value In our study we tried to find the preferred model among a group ofcommon statistical models (Normal Lognormal Rayleigh Weibull ExponentialGamma Rician and Generalized Extreme Value) for our ICT usage data Thedistribution results for urban suburban and rural scenarios are shown in the followingtables
Document ID D28 Global Wireless Exposure Metric DefinitionFP7 Contract ndeg318273
Version V1 50Dissemination level PU
Input Parameter Distribution Param1 Param2 Param3
Htday GEV 3562696e-1 4532385e2 5123877e2
Mtday GEV -155576e-1 8922579e1 1566470e2
Ltday Weibull 4120504e1 1210874
Htnight Weibull 9040221e2 8753780e-1
Mtnight Weibull 1915478e2 1548896
Ltnight Weibull 3779658e1 1159748
Hvolday Weibull 3789408e3 6381982e-1
Mvolday Weibull 5900637e2 9674856e-1
Lvolday Lognormal 3137842 1304834e
Hvolnight Weibull 4513852e3 6264050e-1
Mvolnight Weibull 5412720e2 9230518e-1
Lvolnight Lognormal 3134336e 1306830Table 37 Distribution selection for usage data group of urban scenario
InputParameter
Distribution Param1 Param2 Param3
Htday Gamma 1199636 9934028e2
Mtday GEV -2085134e-1 1413730e2 2283643e2
Ltday Weibull 6628165e1 1126797
Htnight Weibull 8617700e2 8500429e-1
Mtnight Weibull 2164593e2 1176168
Ltnight Weibull 5217715e1 1032256
Hvolday Weibull 4215846e3 6954090e-1
Mvolday Gamma 1125814 7233229e2
Lvolday Lognormal 3793228 1459122
Hvolnight Gamma 7897441e-1 7881916e2
Mvolnight Lognomal 5680914 1529319
Lvolnight Lognormal 3567057 1434982Table 38 Distribution selection for usage data group of suburban scenario
InputParameter
Distribution Param1 Param2 Param3
Htday GEV 3992009e-1 4499851e2 5001061e2
Mtday GEV 5338537e-2 9253486e1 1497340e2
Ltday Weibull 4033680e1 1105567
Htnight Weibull 9138381e2 8435146e-1
Mtnight Weibull 1967658e2 1303428
Ltnight Gamma 110623 3172726e1
Hvolday Weibull 6086792e3 6560783e-1
Mvolday Weibull 9412760e+2 9226993e-1
Lvolday GEV 1329584 1645838e1 1283718e1
Hvolnight Weibull 7731316e+3 6842199e-1
Mvolnight Gamma 9888754e-1 1002908e3
Lvolnight Lognormal 3434330 1494722Table 39 Distribution selection for usage data group of rural scenario
Document ID D28 Global Wireless Exposure Metric DefinitionFP7 Contract ndeg318273
Version V1 51Dissemination level PU
For the 3G urban scenario as shown in Table 40 highest Sobolrsquo indices were foundfor the average time spent on voice call for heavy users during the day period andnight period and average data traffic volumes for heavy users during the day periodand the night period which means that for this specific scenario most influentparameters are data concerning heavy users
Parameter Sobolrsquo Indices
Htday
05874
Mtday
00077
Ltday
00046
Htnight
01812
Mtnight
00055
Ltnight
00044
Hvolday
01625
Mvolday
00054
Lvolday
00043
Hvolnight
01359
Mvolnight
00043
Lvolnight
00042
Table 40 Evaluated Sobolrsquo indices for each ICT usage parameter for the urban scenario
522 EI sensitivity analysis
Several input parameters are needed for EI calculation life segmentation datareference exposure data received (Rx) emitted (Tx) power data and personalwireless devices usage data So in order to integrate the real exposure of thepopulation in different considered scenarios these main parameters should beconsidered one after another In our study we aim to characterize the variability of EIwith respect to ICT usage data group (represented by the twelve parametersdescribed in Table 36) by using Monte Carlo method To this end a random samplingfrom probability distributions of usage data was realized and all the factors in otherthree data groups (life segmentation reference exposure and received (Rx) emitted(Tx) power data group) were considered as constant values and derived fromsurveys and simulations in order to launch Monte Carlo simulations
100000 sample sets data were considered to guaranty the large size simulationsneeded by Monte Carlo method However from our observation the results wereconverging after 25000 simulations The average global exposure (EI) was finallyconverging to 286e-7 Wkg for urban scenario 131e-7 Wkg for suburban scenarioand 143e-7 Wkg for rural scenario The mean estimated central tendency (blackline) and 95 confidence interval (grey zone) as functions of simulation iterationnumber for the three scenarios are shown in Figure 25 The standard deviation (σ)
Document ID D28 Global Wireless Exposure Metric DefinitionFP7 Contract ndeg318273
Version V1 52Dissemination level PU
for the three scenarios is also given in the same figure We obtain the averagevariation coefficients of 53 (urban) 43 (suburban) and 56 (rural) by dividing themean by the corresponding σ The important variation coefficients show that the global exposure is very sensitive due to the high complexity as well as high variabilityof ICT usage data
(a) Urban scenario
(b) Suburban scenario
(c) Rural scenarioFigure 25 Mean estimated central tendency (black line) and 95 confidence interval standard
deviation as a function of simulation iterations for urban (a) suburban (b) and rural (c)scenario
0 05 1 15 2 25 3 35 4 45 5
x 104
14
15
16
17
18
19
2
21
22x 10
-7
Iterations
EI
[Wk
g]
Standard deviation
0 05 1 15 2 25 3 35 4 45 5
x 104
4
45
5
55
6
65
7
75
8x 10
-8
Iterations
[Wk
g]
Standard deviation
0 05 1 15 2 25 3 35 4 45 5
x 104
7
75
8
85
9
95
x 10-8
Iterations
[Wk
g]
Standard deviation
Document ID D28 Global Wireless Exposure Metric DefinitionFP7 Contract ndeg318273
Version V1 53Dissemination level PU
6 CONCLUSION
In this final deliverable of WP2 concerning the global exposure metric the built metrichas been definedThe proposed metric called Exposure Index (EI) has the advantage to overpass thelimitations of the actual metrics that in fact are managing separately the exposureinduced by personal devices and the one induced by the network equipment (basestations and access points) But devices base station antennas and access pointsare definitely parts of the same wireless environment and the global wirelessexposure is induced by all of them
The EI is described with an analytical model with input variables describing thecoverage area of interest the accessible networks the population and the habits interms of location and of wireless devices usage The output is the EI covering theday-to-day averaged exposure of population in a given area incurred by an entirewireless network from base stations and access points to individual devices
The analytical model of the EI has been first detailed and the input variables definedThen we presented the EI integration methodology on a concrete example a macrodense urban 3G scenario We have shown that using all the input data collectedmeasured and simulated during the LEXNET project we are able to integrate themetric we built on a comprehensive scenario
First sensitivity analyses have shown that the EI is highly variable and depending onthe considered scenario is driven by some more influent input parameters
Finally a new human exposure index to EMF is available integrating peoplersquos lifesegmentation and ICT usages and combining both exposure from mobile devicesand exposure from base stations and access pointsThe EI as it is at the end of the LEXNET project is usable but could make a good useof simplification depending on the considered scenario
This new metric might in the future benefit different user groups such as telecomoperators as a Key Performance Indicator for network optimization nationalregulators as such a metric reflects the real global exposure of a population to RF-EMF We can expect also it would be used to feed health risk epidemiologicalstudies
Document ID D28 Global Wireless Exposure Metric DefinitionFP7 Contract ndeg318273
Version V1 54Dissemination level PU
7 REFERENCES
[BYUN13] Byun Y-H et al ldquoEpidemiological Characteristics of
Mobile Phone Ownership and Use in Korean Children and
Adolescentsrdquo Env Health and Toxicology vol 28
published online 2013
[Carte09] httpwwwcartesfrancefr
[CISCO14] Cisco Visual Networking Index Global Mobile Data Traffic
Forecast Update 2013-2018 February 2014 Last update
of the document can be found here
httpwwwciscocomcenussolutionscollateralservice-
providervisual-networking-index-vniwhite_paper_c11-
520862html
[CHLWW08] ConilE Hadjem A Lacroux F Wong M F and Wiart J
ldquoVariability analysis of SAR from 20 MHz to 24 GHz for
different adult and child models using finite-difference
time-domainrdquo Phys Med Biol vol 53 pp 1511-1525
2008
[CHRIST10] Christ A Kainz W Hahn E G Honegger K Zefferer
M Neufeld E Rascher W Janka R Bautz W Chen
J Kiefer B Schmitt P Hollenbach H-P Shen J
Oberle M Szczerba D Kam A Guag J W amp Kuster
N ldquoThe Virtual Family--development of surface-based
anatomical models of two adults and two children for
dosimetric simulationsrdquo Phys Med Biol vol 55 pp 23-
38 2010
[COOPER10] Cooper A R et al ldquoPatterns of GPS measured time
outdoors after school and objective physical activity in
English children the PEACH projectrdquo International Journal
of Behavioral Nutrition and Physical Activity Vol 7 Ndeg 31
2010
[CREDOC13] R Bigot P Croutte and E Daudey laquo La diffusion des
technologies de lrsquoinformation et de la communication dans
la socieacuteteacute franccedilaise (2013) raquo Dec 2013
[CSTM15] CST [Online] Available httpwwwcstcom [Accessed
Sep 2015]
[GCWW10] Gati A Conil E Wong MF Wiart J ldquoDuality between
uplink local and downlink whole body exposures in
Document ID D28 Global Wireless Exposure Metric DefinitionFP7 Contract ndeg318273
Version V1 55Dissemination level PU
operating Networksrdquo IEEE Transactions on EMC Vol 52
ndeg4 Nov 2010
[GLAS15] Google Glass [Online] Available wwwgooglecomglass
[Accessed July 2015]
[GRAB15] GrabCAD [Online] Available wwwgrabcadcom
[Accessed July 2015]
[HETUS06] C Aliaga ldquoHow is the time of women and men distributed
in Europe Statistics in focus population and social
conditionsrdquo Apr 2006
[HOFFERTH01] S L Hofferth et al ldquoHow american children spend their
timerdquo Journal of Marriage and the Family vol 63 Ndeg2
May 2001
[ICNI98] International Commission for Non Ionizing Radiation
Protection (ICNIRP) ldquoGuidelines for limiting exposure to
time-varying electric magnetic and electromagnetic fields
(up to 300 GHz)rdquo Health Physics Vol 74 nordm 4 Apr
1998 pp 494-522
[IEEE02] TC95_SC1 - Techniques Procedures Instrumentation
and Computation Working Group C953-2002 - IEEE
Recommended Practice for Measurements and
Computations of Radio Frequency Electromagnetic Fields
With Respect to Human Exposure to Such Fields 100
kHz-300 GHz IEEE 2002
[INSEE11] L Ricroch and B Roumier Enquecircte Emploi du
temps 2009-2010 laquo Depuis 11 ans moins de tacircches
meacutenagegraveres plus drsquoInternetraquo Insee Premiere Ndeg 1377
Nov 2011
[LARSON01] LarsonR W ldquoHow US Children and Adolescents SpendTime What It Does (and Doesnrsquot) Tell Us About TheirDevelopmentrdquo Current Directions in PsychologicalScience Vol 10 Ndeg 5 Oct 2001
[LARSON11] Larson L R et al ldquoChildrenrsquos Time Outdoors Resultsand Implications of the National Kids Surveyrdquo Journal ofPark and Recreation Administration Vol 29 Ndeg 2 2011
[LEXNET D21 2013] Vermeeren G Thielens A Aerts S Joseph W
Martens L Oliveira C Mackowiak M Correia LM
Pejanovic-Djurisic M Veljovic Z Nešković A
Koprivica M Gati A Varsier N Hadjem A Wiart J
Document ID D28 Global Wireless Exposure Metric DefinitionFP7 Contract ndeg318273
Version V1 56Dissemination level PU
ConilE ldquoD21 Current metrics for EMF exposure
evaluationrdquo LEXNET project April 2013
[LEXNET D22 2013] Wiedemann P M Freudenstein F ldquoD22 Risk and
exposure perceptionrdquo LEXNET project July 2013
[LEXNET D23 2013] Vermeeren G Plets D Joseph W Martens L Conil E
Varsier N Wiart J Corre Y Oliveira C Sebastiatildeo D
Correia LM Aguumlero R Diez L Rodriacuteguez L Koprivica
M Nešković A Popović M Milinković J Nikšić S ldquoD23
Scenariosrdquo LEXNET project November 2013
[LEXNET IR21 2013] ldquoNumerical toolsrdquo LEXNET project July 2013
[LEXNET D25 2014] Wiedemann P M Freudenstein F ldquoD25 Risk and
exposure perceptionrdquo LEXNET project November 2014
[NAGAOKA08] Nagaoka T and Watanabe S ldquoPostured voxel-based
human models for electromagnetic dosimetryrdquo Physics in
medicine and biology vol 53 pp 7047-7061 2008
[PLETS15] Plets D Joseph W Aerts S Vanhecke K
Vermeeren G Varsier N Wiart J and Martens L
ldquoAssessment of contribution of other users to own total
whole-body RF absorption in train environmentrdquo
Bioelectromagnetics (accepted)
[SBOC12] Sebastiao D Branco M Oliveira C and Correia L
MldquoUsage of mobile phones and concerns on
electromagnetic radiations of Portuguese youngstersrdquo
ICNIRP 7th International NIR Workshop 2012
[TAFLOVE00] Taflove A and Hagness S C 2000 Computational
Electrodynamics The Finite-Difference Time-Domain
Method 2nd edn (Boston MA Artech House Publishers)
[TNS10] TNS Sofres survey Observatoire Socieacutetal du teacuteleacutephone
mobile Dec 2010
[TVPO15] T V Population [Online] Available
httpwwwitisethzch [Accessed Sep 2015]
[WEIL77] WeilandT ldquoA discretization model for the solution of
Maxwells equations for six-component fieldsrdquo Electronics
and Communication Vol 31 Mar 1977 pp 116-120
[WIART08] Wiart J Hadjem A Wong M F and Bloch I Analysis of
RF exposure in the head tissues of children and adults
Document ID D28 Global Wireless Exposure Metric DefinitionFP7 Contract ndeg318273
Version V1 57Dissemination level PU
Physics in medicine and biology vol 53 pp 3681-3695
2008
Document ID D28 Global Wireless Exposure Metric DefinitionFP7 Contract ndeg318273
Version V1 58Dissemination level PU
8 MAIN PUBLICATIONS
Hadjem A Varsier N Conil E et al ldquoCharacterization of far-field and near-fieldexposure of the population for RF-EMF in realistic configurations of ICT usagesrdquoBEMS 2014
Plets D Joseph W Aerts S Vanhecke K et al ldquoPrediction and comparison ofdownlink electric-field and uplink localised SAR values for realistic indoor wirelessplanningrdquo Radiat Prot Dosimetry (2014) 162 (4) 487-498 doi 101093rpdncu019
Huang Y Krayni A Hadjem A Wiart J Person C and Varsier N ldquoComparison ofthe average global exposure of a population induced by a macro 3G network inurban suburban and rural areasrdquo URSI AT-RASC 2015
Krayni A ldquoCharacterization of the exposure induced by a wireless networkrdquo URSIAT-RASC 2015
Plets D Joseph W Vanhecke K et al ldquoJoint Minimization of Uplink and DownlinkWhole-Body Exposure Dose in Indoor Wireless Networksrdquo BioMed ResearchInternational vol 2015 Article ID 943415 9 pages 2015 doi1011552015943415
Varsier N Plets D Corre Y Vermeeren G Joseph W Aerts S Martens L andWiart J ldquoA novel method to assess the human population exposure induced by awireless cellular networkrdquo Bioelectromagnetics vol 36 ndeg6 pp 451-463 Sept 2015
Plets D Joseph W Aerts S Vanhecke K Vermeeren G Varsier N Wiart Jand Martens L ldquoAssessment of contribution of other users to own total whole-bodyRF absorption in train environmentrdquo Bioelectromagnetics (accepted)
Document ID D28 Global Wireless Exposure Metric DefinitionFP7 Contract ndeg318273
Version V1 59Dissemination level PU
APPENDIX 1 NUMERICAL DOSIMETRIC SIMULATIONS FOR GOOGLE
GLASSES
This appendix describes the results of SAR simulations for Google glasses[GLAS15] using a numerical simulation tool (CST Microwave Studio [CSTM15]) TheGlass is a pair of augmented reality glasses whose connectivity is assured by twowireless technologies Wi-Fi and Bluetooth in the 24 GHz band No cellular modulewas implemented on the prototype
These simulations have the aim of assessing the user exposure in the potentialscenario of using cellular technologies in the Glass prototype Accordingly SARvalues were evaluated for 900 MHz (GSM) 1940 MHz (UMTS) and 2600 MHz (LTE)
The Google glasses [GLAS15] were modelled using a CAD model [GRAB15] whichwas directly imported into CST Microwave Studio Figure A1
Figure A1 Google glasses CAD model [GRAB15]
As it can be seen from Figure A2 the Google glasses use a monopole whipantenna which was modelled in CST as a wire and a ground plane both made ofPerfect Electric Conductor (PEC) Figure A3 A small vacuum gap was introducedbetween them to insert a discrete port as the feeding point
Document ID D28 Global Wireless Exposure Metric DefinitionFP7 Contract ndeg318273
Version V1 60Dissemination level PU
Figure A2 Google Glass antenna [5]
Figure A3 ndash Google glasses modelled antenna
The antenna length was set using the Time Domain Solver Optimizer of CST tuned tominimise the S11 value at 2436 MHz The antenna optimisation process used theGoogle glass CAD model the modulated antenna and a head voxel model
The value of the S11 parameter is presented in Figure A4 Table A1 shows theGoogle glasses and the antenna main characteristics after optimisation
Document ID D28 Global Wireless Exposure Metric DefinitionFP7 Contract ndeg318273
Version V1 61Dissemination level PU
Figure A4 S11 for Google glasses antenna
Table A1 ndash Google glasses and antenna main characteristics at 2436 MHz
AntennaGoogleGlasses
Ground plane Wire GapS11[dB]
MaterialLength[mm]
MaterialLength[mm]
MaterialLength[mm]
Material
2519 PEC 2519 PEC 200 Vacuum -354Teflon(PTFE)
The computer used for the simulations contains a GPU NVIDIA TESLA C2050 thatsignificantly reduces the simulation time for scenarios with a maximum of 50 millionmesh cells Nevertheless the use of a full body voxel model would exceed this limitTherefore a voxel simulating only the head of a 26 years old woman [TVPO15] wasused Figure A5 It should be noted that the SAR values are only relevant in thehead regions near the antenna therefore validating this approach
Document ID D28 Global Wireless Exposure Metric DefinitionFP7 Contract ndeg318273
Version V1 62Dissemination level PU
Figure A5 ndash 26 years old woman voxel model (head) [TVPO15]
Simulations have been performed using the time domain solver and the automaticmesh generation of CST To achieve an accurate meshing a maximum mesh step of02 mm was defined for the antenna gap This implies that the automatic meshgenerator will not exceed this step width at the bounding box of the antenna gapFigure A6 shows the higher density mesh lines near the antenna gap (in blue)
Figure A6 ndash Mesh lines on the antenna gap
Document ID D28 Global Wireless Exposure Metric DefinitionFP7 Contract ndeg318273
Version V1 63Dissemination level PU
Figure A7 shows the mesh lines for the upper frequency of 3000 MHz whichresulted in 1086 million mesh cells
Figure A7 ndash Model mesh lines for the upper frequency of 3000 MHz
SAR calculations were performed using the averaging method according to the IEEEC953 standard [IEEE02] and the reference (radiated) power was set to thenormalised value of 1 W The SAR calculation at the different frequencies assumesthat there are no reflection lossesTable A2 presents the main parameters used in each simulation scenario Thesimulation frequency range setting is important for the meshing process and theresulting number of mesh cells and simulation time The use of a GPU results in asignificant reduced simulation time eg for the 900 MHz scenario the simulationtime was reduced around 5 times compared to the case when no GPU is usedThe MLW (Maximum number of Lines per Wavelength) value defines the upper limitof lines per wavelength of maximum frequency Increasing this number leads to ahigher accuracy but also increases the total calculation time The value was chosento achieve a trade-off between simulation accuracy and simulation time
Frequency[MHz]
FrequencyRange[MHz]
Mesh cells
AccelerationSimulation
TimeMLWSmallest
[mm]Largest
[mm]Number
[106]
900 500 ndash 1000 10 020 2890 116 2 Intel XeonE620240
GHz
GPU TeslaC2050
3 m 53 s
1940
1000ndash 3000 10 020 980 1086 1 h 0 m 58 s2600
Table A2 Simulation setup
Document ID D28 Global Wireless Exposure Metric DefinitionFP7 Contract ndeg318273
Version V1 64Dissemination level PU
The cutting planes presenting SAR values for the 900 and 2600 MHz are shown inFigure A8 and Figure A9 respectively One can observe the intuitive result thatmost of the energy is absorbed by the head region near to the antenna Moreover ahigher absorption of energy at the lowest frequency (09 GHz) is noticeable
Figure A8 Voxel cutting plane with SAR values for 900 MHz
Figure A9 Voxel cutting plane with SAR values for 2600 MHz
Table A3 shows the peak-spatial averaged SAR (psaSAR10g) and the whole headSAR values for each band
Frequency[MHz]
psaSAR10g[Wkg]
Whole head SAR[Wkg]
SAR CalculationTime
900 1314 0205 7 s
1940 1372 0128 10 m 51 s
2600 1051 0096 11 m 07 s
Table A3 SAR values
The values on Table A4 were evaluated for a radiated power of 1 W which wasused to normalise the results among the LEXNET partners but overestimates thereal typical exposure of 0125 W for UMTS and 01 W for LTE
Document ID D28 Global Wireless Exposure Metric DefinitionFP7 Contract ndeg318273
Version V1 65Dissemination level PU
The values of maximum radiated power (Pmax) to respect the maximumrecommended SAR value for the head (ie 2 Wkg [ICNI98]) are presented inTable A4 So one can see that for UMTS and LTE there are no problems ofexposure since the maximum radiated power that fulfils SAR requirements is abovethe maximum radiated by the devices in GSM the situation is different and in orderto respect the threshold the device will have to radiate a maximum quite below themaximum allowed for a device in general which can be implemented in the devicewithout problems
Frequency[MHz]
Pmax[W]
PeakMaximumEIRP Uplink [W]
GSM 900 0152 2000
UMTS 1940 0146 0125
LTE 2600 0190 0100
Table A4 Maximum radiated power for 2 Wkg SAR
Document ID D28 Global Wireless Exposure Metric DefinitionFP7 Contract ndeg318273
Version V1 66Dissemination level PU
APPENDIX 2 INTERNAL REVIEW
Reviewer 1 Mick Wilson Reviewer 2 Yoann Corre
Answer Comments Type Answer Comments Type
1 Is the deliverable in accordance with
(i) the Descriptionof Work
Yes
No
M
m
a
Yes
No
M
m
a
(ii) the internationalState of theArt
Yes
No
M
m
a
Yes
No
M
m
a
2 Is the quality of the deliverable in a status
(i) that allows tosend it to EC
Yes
No
M
m
a
Yes
No
M
m
a
(ii) that needsimprovement ofthe writing bythe editor of thedeliverable
Yes
No
Minor editorials onlysuggested
M
m
a
Yes
No
Minor modificationssuggested (mostlyeditorial corrections)
M
m
a
(iii) that needsfurther work bythe partnersresponsible forthe deliverable
Yes
No
M
m
a
Yes
No
M
m
a
Document ID D28 Global Wireless Exposure Metric DefinitionFP7 Contract ndeg318273
Version V1 9Dissemination level PU
project must absolutely address is about the understandability and acceptability ofthis new exposure metric by the general publicA second survey has been therefore conducted in the framework of LEXNET Datawere collected from July to September 2014 in France Germany United KingdomPortugal Spain Romania and Serbia among a representative sample of the generalpopulation A total of 1809 respondents participated in this second surveyAn important part of the survey focused on how people are considering strategiesproposed in the framework of the LEXNET project to define and minimize thepopulationrsquos exposure to electromagnetic fieldsOnly key findings are reported here but detailed description of the survey and of theresults is in the deliverable entitled ldquoD25 Risk and exposure perceptionrdquo [LEXNETD25 2014]
When asked about adding up the exposure from personal wireless devices and theexposure from base stations when evaluating the exposure of people to EMF morethan 90 of respondents agreed on the fact that both downlink and uplink exposuresshould be considered when evaluating the population exposure to EMFA large percentage of respondents also agreed when asked if it makes sense tocharacterize the day-to-day exposure to EMF by averaging it over time or if they thinkthat an individual exposure to EMF can be approximated by measuring the exposureover a large population
The next chapter of this deliverable describes the Exposure Index proposed by theproject LEXNET
Document ID D28 Global Wireless Exposure Metric DefinitionFP7 Contract ndeg318273
Version V1 10Dissemination level PU
2 THE EXPOSURE INDEX
21 Key concept
The Exposure Index (EI) takes into account the global EMF exposure of a populationto a given wireless telecommunication network (or a set of networks) The EI in theframework of LEXNET project does not take into account the exposure induced byother RF sources such as Frequency Modulation (FM) radio or digital terrestrialtelevision transmitters However the EI was designed as a future-proof metric andother RF sources could completely be taken into account if neededIt covers the exposure of a population during a given time frame in a given areaincurred by a wireless telecommunication network as a whole aggregating thedownlink exposure induced all day long by base stations and access points and theuplink exposure incurred by individual wireless communication devices The uplinkexposure can be subdivided in exposure due to the uplink of the userrsquos own deviceand the uplink of devices operated by other users nearbyIn order to assess the realistic exposure of a population many parameters influencingthe exposure need to be taken into account in the Exposure Index age (adult andchild exposure are different [CHLWW08] [WIART08]) posture [NAGAOKA08] usagetechnology environment etc
In a nutshell the LEXNET Exposure Index is a function transforming a highlycomplex set of data into a single parameter which has two key benefits it isunderstandable acceptable and usable for all the stakeholders from general publicto regulatory bodies and it is linked in a tangible way to the network operatingparameters
The EI is built from the aggregation of individual exposure contributions generated bya specific exposure source in specific exposure situations For instance an averagedindividual exposure generated by WiFi 24 GHz can be calculated at day time for anadult heavy-user located indoors sitting and with a tablet The same kind ofindividual exposure is estimated for other time periods RATs populationsenvironments usages and postures to get complete elements that compose the EIThe individual exposure contributions are weighted according to theirrepresentativeness before aggregation A complete example of EI integration is givenin section 43The individual exposure is the sum of a down-link (DL ndash generated by surroundingbase stations and access points) and up-link (UL ndash generated from personal mobiledevices) components as explained with more details in section 221
The EI is computed in a given area from the aggregation of individual exposurecontributions in a chain of exposure (see Figure 4) The nodes in this chain arerelated to different exposure sources or exposure situations
bull time periods as the configuration of the network and type of usage depend onthe time of day (low-load night-time vs heavily loaded peak-hour)
bull population category as different population categories will have different lifesegmentations and different usages of wireless devices
bull user profile
Document ID D28 Global Wireless Exposure Metric DefinitionFP7 Contract ndeg318273
Version V1 11Dissemination level PU
bull location as the exposure configurations will be different in differentenvironments typically indoors and outdoors
bull radio access technologies RATs (GSM UMTS LTE WiFi etc) frequencybands and deployment layers (macro micro and femto cells) that usersconnect to
bull posture as different body postures will lead to different absorption rates in thehuman body
bull device usage as for example making a phone call does not lead to the sameexposure as downloading data
Figure 4 the LEXNET chain of exposure
Different exposure scenarios [LEXNET D23 2013] are considered and aggregatedby putting weights on each configuration thereby determining the EI A partial EI canbe for example computed for a scenario that considers only a subset of RATspopulation environment etc Then several partial EI can be aggregated with aweight related to their representativenessEI takes into account different parameters coming both from the telecom world todescribe the accessible network environment and from data on how people segmenttheir life to describe how people are using this network
22 Mathematical formalization
221 Exposure Index Equation
The Exposure Index is calculated for a finite geographical area that must preferablybe homogeneous in terms of population and network usage it can be of urbansuburban or rural type for instanceThe general formulation of the Exposure Index contains a set of technicalparameters as described below The number of values classes or settings of eachparameter depends on the level of detail of the available data and on the level ofachievable complexity in terms of calculation For a given geographical area the EItakes the following into account (see also Table 1)
Document ID D28 Global Wireless Exposure Metric DefinitionFP7 Contract ndeg318273
Version V1 12Dissemination level PU
time period (t) eg day and night population (p) segmented into different categories eg children (under 15
yo) young people (15-29 yo) adults (30-59 yo) and seniors (60 yo andover)
user load profiles (l) eg heavy medium light or non-users environment (e) eg indoor (office home) outdoor and in commuting
(bus car subway etchellip) different available Radio Access Technologies (RATs) (r) eg 2G (900
MHz and 1800 MHz) 3G 4G WiFi the number of RATs depends on thescenario
different cell types (c) eg macro micro pico and femto cells theaccessibility to the different cell types depends on the scenario
posture (pos) eg sitting standing usage (u) is described by the device (eg mobile PC laptop) and the
service (eg voice call data)
TimePopulatio
nUser
ProfileEnvironme
ntRAT Cell Type Posture Usage
Day Children Heavy Indoor 2G Macro Standing Voice mobile
Night Youngpeople
Medium
Outdoor 3G Micro Sitting Data mobile
Adults Light Commuting 4G Pico Data Tablet
Seniors Nonuser
WiFi Femto Data Laptopon the laps
Data Laptopon the desk
Table 1 input variables in the modelling of the EI
The individual exposure contributions rely on the SAR expressed in Wkg The SARdepends on the device the frequency band the morphology and the posture of theuser as well as on the position and distance of the source with respect to the user Aspart of LEXNET a set of numerical dosimetric simulations have been performed inorder to fill out a comprehensive matrix of raw normalized SAR values calculated fora reference transmitted power (near-field exposure) or a reference received powerdensity (far-field exposure) These SAR values can be whole-body or localized SARvalues Whole-body SAR values are evaluated by averaging SAR over the whole-body whereas localized SAR values are values focusing on a body volume specificorgan or tissue Different EI can be evaluated depending on the value of interest(whole-body or localized value)Network measurements or simulation tools are expected to provide transmitted andreceived power density average values to apply to the raw SAR matrixInformation and Communication Technologies (ICT) usage data obtained throughsensors inside the network and segmentation life data will finally provide the levels toapply for the evaluation of the EIIt was decided to build the EI based on the dose (SAR x duration of exposure) even ifthere is no evidence today of a higher correlation between the dose and anyhypothetical health effect than with instantaneous peak SAR
Document ID D28 Global Wireless Exposure Metric DefinitionFP7 Contract ndeg318273
Version V1 13Dissemination level PU
SARܫܧ =1
T
tperlcpos ൫ ത
൯
ே
௨
ேೞ
௦
ேಽ
ே
ேೃ
ேಶ
ேು
ே
௧
+ RXinc + ௦ௗ௩௦ோ௦ௗ௩௦
W
kg൨
(1)
where EISAR is the Exposure Index value the average exposure of the population of
the considered geographical area over the considered time frame T SARrefers to whole-body SAR organ-specific SAR or localized SAR
is the number of considered periods within the considered time frame (egsingle day)
is the number of considered Population categories ா is the number of considered Environments ோ is the number of considered Radio Access Technologies is the number of considered Cell types is the number of considered user Load profiles ௦ is the number of considered Postures
is the number of considered Usages with devices ത
is the mean TX power transmitted by the usersrsquo devices during the periodݐ in usage mode ݑ connected to RAT r in environment For example whenEI is computed from simulation tools the TX power can be predicted over amap that covers the whole considered geographical area and the averagevalue is extracted for the EI evaluation See details in section 223
ோis the mean incident power density on the human body during the periodݐ induced by RAT ݎ in environment A distribution of the incident powerdensity for the whole considered geographical area is considered and theaverage value over this area is taken into account for the EI evaluation
ோ௦ௗ௩௦ is the incident power density on the human body during the
period t induced by a wireless device connected to RAT r of a user in theproximity in environment e This term is important when the exposed personis the user itself it can also be significant for persons in the proximity of usersof a wireless device for instance in a crowded meeting room in publictransportation etc In the applications discussed in this paper this term is
neglected We also remark that ோ௦ௗ௩௦ depends on the orientation of
the user of the wireless device with respect to the body of the people in itsproximity See details in section 223
( ୱ
୩W) ௦ௗ௩௦ (
ୱ
୩
୫ మ) and ( ୱ
୩
୫ మ ) are the normalised
raw dose values for UL the DL from the user in the proximity and DL frombase stations and access points respectively all multiplied by the time spentin the configuration See details in section 222
Document ID D28 Global Wireless Exposure Metric DefinitionFP7 Contract ndeg318273
Version V1 14Dissemination level PU
௧௦ is the fraction of the total population that corresponds to populationcategory p user load profile l in posture pos connected to RAT r for a celltype c in environment e during the time period t
In the following we explain the different terms used in the EI formula in more detail
222 Coefficients and
The coefficient is associated to the exposure induced by the uplink andexpressed as an absorbed dose normalised to a transmitted power of 1 W
[ୱ୩
]
=௧௨௦[ୱ]ܦ
௨௦[ܣ ୩]
[ ]
Ws
kgW൨ (2)
where ௧௨௦ܦ
is the time duration of usage ݑ and a user profile load when
connected to the RAT ݎ operating in cell type in the environment for thepopulation category in the posture pos during the time period of the day ݐ
ௌோೠೞ
ಽ
can be the whole body or an organ-specific or tissue-specific
valueܣ for the usage ݑ and the posture pos in the frequency band of theRAT ݎ and the population category calculated for an incident emitted power
of
and normalized to this power
The coefficient is associated to the exposure induced by the downlink and alsoexpressed as an absorbed dose normalised to an incident power density of 1 Wm2
[ୱ୩
]
=௧௦[ୱ]ܦ
௦[ܣ ୩]
RX[W]inc
Ws
kg
W
mଶ൨ (3)
where ௧௦ܦ
is the time duration of posture ݏ when connected to the RAT ݎ
operating in cell type in the environment for the population during thetime period of the day ݐ
ௌோೞ
ವಽ
ௌೃ can be the whole body or an organ-specific or tissue-specific
valueܣ induced by the base station or access points of the RAT ݎ in thepopulation for the posture ݏ normalized to the received power density
ோ
223 Transmitted power ഥ and received power density ത ܖ
ത is the average power transmitted by the device in busy mode (in active
communication) It should be noted that even in idle mode (not for activecommunication) the devices transmit from time to time some power (to stay
Document ID D28 Global Wireless Exposure Metric DefinitionFP7 Contract ndeg318273
Version V1 15Dissemination level PU
synchronized with the network for example) but the exposure induced by the devicein idle mode is negligible as it is based on rare events is the average power density incident on the human body from the base stationsor access points of the RAT The incident power density is assessed not only forusers of mobile devices but also for non-users It is assumed that the usage patternof the user considered in the EI formula does not influence the average incidentpower density From a theoretical point of view is the average incident powerdensity integrated over all the frequency bands of the RAT and cell type consideredFrom a practical point of view can be assessed directly from spectrum analyzer(SA) measurements dosimeters simulations and indirectly from the received poweron a user device or in a drive test measurementത and Sത୧୬ୡ average out the instantaneous variations of the transmitted power and
incident power density that arise during a communication These variations occurwhen the user is static or moving over a very small distance and are caused bydifferent phenomenas (power regulation small-scale fading resource allocation usertraffic variations etc) Values that will be used in the EI evaluation are averagedvalues over the whole considered geographical area
For both the evaluation of the DL incident power density and UL transmitted powerthe ressource allocation or duty cycle of the system has to be taken into account TheEI computation does not rely on maximum allowed power values (as in existing EMFexposure procedures) but on the incident and transmitted powers that respectivelydepend on the DL network and UL user resource load This definition leads to anestimate of the UL transmitted power that necessarily depend on the type of usertraffic (eg voice web browsing file upload etc) the higher is the instantaneous ULthroughput during the communication the higher is generally the UL transmittedpower
224 Exposure from close users
To account for all possible exposure situations in the EI equation (1) we also have toinclude the exposure induced in persons close to an active device operated by a thirdperson This happens for instance in crowded places public transportation andmeeting rooms The exposure is typically induced by a mobile phone laptop or tabletThe exposure induced by nearby active devices can be viewed as a downlinkexposure at the persons in the proximity (see 3rd term in the EI equation (1)) even ifgenerated by an uplink transmission since it would be treated as a far-field exposureThe contribution of radio-frequency radiation originating from other peoplersquos deviceshas been studied in [PLETS15] This contribution has been compared to the totalpersonal absorption in a train environment They found that the absorption fromnearby active mobile devices cannot always be neglected in a GSM macrocellconnection scenario UL of 15 other users can cause up to 19 of total absorptionfor users having themselves a call and up to 100 for non-active persons In anUMTS femtocell connection scenario UL of 15 other users contributes to totalabsorption of a non-active person for no more than 15 Hence in exposuresituations where mobile devices are operated in close proximity of other persons orusers the 3rd term in the EI equation might be non-negligible
Document ID D28 Global Wireless Exposure Metric DefinitionFP7 Contract ndeg318273
Version V1 16Dissemination level PU
3 EXPOSURE INDEX COMPUTATION DATA SOURCES
The EI evaluation relies on the collection of a wide range of data from simulationtools literature models and measurement equipment that have been demonstratedin the LEXNET technical work-packages All the input data that were collected andwere used in the framework of the project are detailed below
31 Life segmentation data
Life segmentation data were extracted from up-to-date life segmentation surveysperformed in the countries involved in LEXNET
In order to evaluate the Exposure Index we needed data for each of the consideredpopulation categories children (under 15 yo) young people (15-29 yo) adults (30-59 yo) and seniors (60 yo and over)
How young people adults and seniors spend their time in Europe was extracted fromthe HETUS survey [HETUS] the French INSEE survey [INSEE] and the time usesurvey in Republic of Serbia [Survey-Serbia] (see Table 2)
Adults Young people Seniors
Gainful work study 500 440 005
Domestic work 300 115 400
Travel 130 120 0050
Sleep 815 900 845
Meals personal care 215 245 330
Free time indoor (TVsocializing readinginternet surfing)
300 400 430
Free time outdoor (sportsgardening hiking)
100 100 220
Total 2400 2400 2400
Table 2 How young people adults and seniors spend their time in Europe
How children spend their time in Europe was extracted from [HOFFERTH01][LARSON01] [LARSON11] and [COOPER10] (see Table 3) Average daily timespent at school or day care for domestic work sleeping eating and personal carewere deduced from [HOFFERTH01] and [LARSON01] Then it was difficult to extractthe free time indoor and outdoor as categories in [HOFFERTH01] do not precise ifactivities such as ldquoother passive leisurerdquo are outdoor or indoor activities From[LARSON11] we could extract that American children spend in average 2h per daydoing outdoor activities From [COOPER10] we could deduce that UK children spendin average 45 min per day outdoor between 330 and 830 PM
Document ID D28 Global Wireless Exposure Metric DefinitionFP7 Contract ndeg318273
Version V1 17Dissemination level PU
Children
School-Day care 345
Domestic work 045
Travel 030
Sleep 1040
Meals personal care 2 30
Free time indoor (TVplaying reading internetsurfing)
435
Free time outdoor 130
Total 2400
Table 3 How children spend their time in Europe
Extracted from Table 2 and Table 3 the data required in EI equation is reported inTable 4
Populationcategory
Day (8 AM-6 PM) Night (6 PM- 8AM)
Indoor(office-school-home)
Outdoor
Transportation (bus carsubwayetchellip)
Indoor(home)
Outdoor
Transportation (bus carsubwayetchellip)
Adults8h15(825)
1h10(115)
35 min
(6)
13h05 min(935)
20 min(25)
35 min
(4)
Youngpeoplestudents
8h20(83)
1h10(115)
30 min
(55)
13h10 min(94)
20 min(25)
30 min
(35)
Children8h15(825)
1h30 (15)
15 min
(25)
13h45 min(985)
0 min
(0 )
15 min
(15)
Seniors7h35(758)
2h10(217)
15 min
(25)
13h05 min(935)
40 min(5)
15 min
(15)
Table 4 Life segmentation inputs for evaluation of the Exposure Index
32 ICT usage data
321 When and where
Figure 5 and Figure 6 show that we are generally using different wireless devices atdifferent time of the day and in different locations Laptops are used in indoorlocations whether at the office or at home Tablets are preferred at home at nightwhereas mobile phones are used throughout the day with a high usage duringcommuting
Document ID D28 Global Wireless Exposure Metric DefinitionFP7 Contract ndeg318273
Version V1 18Dissemination level PU
Figure 5 Devices preferences throughout the day (Source comScore devices EssentialsJanuary 2013)
Figure 6 How and when we use our mobile phones (Source TNS Mobile Life survey)
Crossing this kind of information extracted from survey and life segmentation datawe can assume that about 100 of laptop or tablet usages happens indoors 70 of phone usages is indoors 20 when commuting and 10 outdoors
Document ID D28 Global Wireless Exposure Metric DefinitionFP7 Contract ndeg318273
Version V1 19Dissemination level PU
We also draw the conclusion that 50 of laptop usage happens during the day (from8 AM to 6 PM) and 50 during the night (from 6 PM to 8 AM) For tablet usage weconsider that 20 of the usage happens during the day and 80 during the night
For WiFi usage we make the hypothesis that 100 of wireless device usageshappen indoors
322 Connections per RAT
As shown in Figure 7 (from [CISCO14]) it is forecasted that in 2016 the 4Gconnections will represent 8 of the mobile connections whereas 2G and 3G willrespectively represent 48 and 44 of the connections
Figure 7 Connections by RAT forecast
Figures are a bit different depending on regions As shown on the table belowextracted from [CISCO14] the 4G connections are expected to represent 24 ofmobile connections in 2018 in Western Europe whereas they will represent only 10 of the connections in Central and Eastern Europe
Document ID D28 Global Wireless Exposure Metric DefinitionFP7 Contract ndeg318273
Version V1 20Dissemination level PU
Table 5 Life segmentation inputs for evaluation of the Exposure Index
This forecast is used as a baseline scenario in some of our studies Then promotingchanges in the RAT percentages can be envisaged as a way to reduce the EI
323 Usersnon-users per population category
Using 2013 data on the equipment rates of classical mobile phones and smartphonesand proportions of the French population using a mobile phone for websurfingextracted from the 2013 CREDOC (Centre de Recherche pour lrsquoEtude etlrsquoObservation des Conditions de vie) report [CREDOC13] and data extracted from aMarch 2014 Ipsos survey entitled ldquoLes nouveaux usages des moins de 20 ansrdquo weevaluated the proportions of users and non-users of mobile phones for voicecommunications and data traffic per population category (see Table 6) For childrenunder 8 years old we make the assumption that they are not wireless device users
Mobile phoneusage
Children(under8 yo)
Children(8-12yo)
Children(12-15
yo)
Youngpeople(15-29
yo)
Adults(30-59
yo)
Seniors(over 60
yo)
Voicecommunication
Non-users
100 60 10 4 5 30
Users 0 40 90 96 95 70
Data traffic Non-users
100 90 45 33 59 90
Users 0 10 55 67 41 10
Table 6 Proportions of users and non-users of mobile phones per population category
Using data on the equipment rates of tablets 3G dongles and laptops from[CREDOC] and the March 2014 Ipsos survey we deduced the proportions of usersand non-users of tablets 3G dongles and laptops per population category (see Table7)
Document ID D28 Global Wireless Exposure Metric DefinitionFP7 Contract ndeg318273
Version V1 21Dissemination level PU
Children(under8 yo)
Children(8-12yo)
Children(12-15yo)
Youngpeople(15-29yo)
Adults(30-59yo)
Seniors(over 60yo)
TabletsNon-users
92 81 7877 79 94
Users 8 19 22 23 21 6
3G donglesNon-users
100 100 9290 90 93
Users 0 0 8 10 10 7
LaptopsNon-users
100 100 2122 34 67
Users 0 0 79 78 66 33Table 7 Proportions of users and non-users of tablets 3G dongles and laptops per population
category
324 Tablets and laptops usage data
From [CISCO14] in 2013 the average worldwide mobile data traffic per tablet (from3G and 4G tablets) was 137 GB per month and 24 GB per month for a 4G tabletFrom subscribers billing data collected in January 2014 in Serbia we could derive anaverage monthly traffic per tablet of 083 GBFigure 8 extracted from [CISCO14] gives cellular vs WiFi only tablets ratios
Figure 8 Cellular vs WiFi tablets ratio
From [CISCO14] in 2013 the average mobile data traffic per laptop was 245 GB permonthFrom subscribers billing data collected in January 2014 in Serbia we could derive anaverage monthly traffic per laptop of 34 GB in Serbia
Finally we took the hypothesis that the UL traffic for tablets and laptops represents 15 of the total mobile data traffic
Document ID D28 Global Wireless Exposure Metric DefinitionFP7 Contract ndeg318273
Version V1 22Dissemination level PU
325 Mobile phone usage data
3251 3G data from Orange
Mobile phone usage data were collected through an access network probe localizedat the RNC (Radio Network Controller) level in the 3G Orange France network Threeareas have been monitored one urban area in a district of Paris one suburban areain the region of Clermont-Ferrand and one rural area in the region of Nancy
Extracted data gives per-user and per-hour measurements during one weekbull total duration of voice callsbull number of voice callsbull total duration of UL data sessionsbull number of UL data sessionsbull total volume of UL data sessionsbull total duration of DL data sessionsbull number of DL data sessionsbull total volume of DL data sessions
Averaged daily profiles have been extracted for voice and data services (Figure 9)
Document ID D28 Global Wireless Exposure Metric DefinitionFP7 Contract ndeg318273
Version V1 23Dissemination level PU
Figure 9 Illustration on time variation of mean voice (top figure) and data (bottom figure)usage per user over a day Data have been collected in urban suburban and rural areas during
a week in November 2013 on the 3G Orange France network
The usage is also completely unbalanced among all the users A small number ofusers are consuming a large part of traffic whatever the type of area as illustrated onFigure 10
0 8 12 18 230
01
02
03
04
05
06
07
08
09
1
Hour
Min
ute
Mean Voice Usage in Munites per User During Daily Hours
Urban
Suburban
Rural
Aggregated
0 8 12 18 230
100
200
300
400
500
600
700
Hour
KB
Mean Volume of Data Exchanged in KB per User During Daily Hours
Urban
Suburban
Rural
Aggregated
Document ID D28 Global Wireless Exposure Metric DefinitionFP7 Contract ndeg318273
Version V1Dissemination level PU
Figure 10 Distribution of the voice (toline) suburban (green line) and rura
Three types of profiles were definedbull heavy users top users cobull moderate users users cobull light users users consum
Based on the data recorded in theAs expected there are not sosuburban and urban All the data hTable 9 Table 10 and Table 11 dvoice communication durations ansummarizes the repartition of user p
0 01 02 03 04 05 06 07 08 09 10
01
02
03
04
05
06
07
08
09
1
of users
o
fto
talv
oic
eca
llsd
ura
tion
aggregation
urban
suburban
rural
0 01 02 030
01
02
03
04
05
06
07
08
09
1
o
fto
talv
olu
me
ofd
ata
tra
ffic intermediate
light
heavy
intermediate
light
p figure) al (black lineareas (blue
for voicensumingnsuminging 5 of
networkmuch difave beenetail for dd data trarofiles fo
04 05 of u
heavy
nd data (bottom) areas and aggrline)
and data serv80 of the tota15 of the totathe total data
the user profileferences quanpooled to definifferent geograffic volumes p
r Orange 3G vo
06 07 08sers
aggr
urba
subu
rural
24
figure) traffic for urban (redegated over the 3 types of
icel datal data
s are defined in Table 8titatively between rurale the mean user profilesphical areas the averageer user profile Table 12ice and data usages
09 1
egation
n
rban
Document ID D28 Global Wireless Exposure Metric DefinitionFP7 Contract ndeg318273
Version V1 25Dissemination level PU
3G network
Rural Suburban Urban Global
tcom
[s]voldata
[kB]tcom
[s]voldata
[kB]tcom [s] voldata
[kB]tcom [s] voldata [kB]
Heavyusers
1972 103635 1899 70711 1610 67875 1762 73065
Moderateusers
249 9210 361 7915 233 5242 305 6940
Lightusers
42 492 71 753 41 345 53 504
Table 8 User profiles defined in rural suburban and urban areas
3G (Orangenetwork)
Voice Data (82 DL 18 UL)
Urban tcom (s) volULdata [kB] volDLdata [kB]
Heavy user
Day 841 4948 25124
Night 689 5879 31922
Moderate user
Day 147 464 2390
Night 86 387 2001
Light user
Day 26 35 158
Night 16 28 124
Table 9 Average voice communication durations and data traffic volumes per user profile for a3G Orange dense urban network
3G (Orangenetwork)
Voice Data (81 DL 19 UL)
Suburban tcom (s) volULdata [kB] volDLdata [kB]
Heavy user
Day 1081 5393 30199
Night 743 5175 29941
Moderate user
Day 242 739 3930
Night 119 505 2740
Light user
Day 49 90 382
Night 22 55 226
Table 10 Average voice communication durations and data traffic volumes per user profile for a3G Orange suburban network
Document ID D28 Global Wireless Exposure Metric DefinitionFP7 Contract ndeg318273
Version V1 26Dissemination level PU
3G (Orangenetwork)
Voice Data (79 DL 21 UL)
Rural tcom (s) volULdata [kB] volDLdata [kB]
Heavy user
Day 928 7013 36925
Night 723 9379 50314
Moderate user
Day 164 735 3716
Night 85 754 4005
Light user
Day 28 54 208
Night 14 48 182
Table 11 Average voice communication durations and data traffic volumes per user profile for a3G Orange rural network
Heavy users Moderate users Light users
Voice 20 30 50
Data 10 20 70Table 12 Repartition of user profiles for Orange 3G voice and data usages
3252 2G and 3G data from Telekom Srbja
Telekom Srbja combined data coming from different sources mainlybull Customer analytics systembull Network management system
On one hand data that could be retrieved from the customer analytics system SAScontains personal information on subscriber as
bull agebull genderbull addressbull account type (voice andor data)bull device type (mobile dongle tablet)
Traffic statistics of these subscribers were also collected through the customeranalytics system
On the other hand cell statistics were obtained from the network managementsystem on an hourly basis as
bull number of voice callsbull duration in Erlangbull number of data sessionsbull duration of all data sessions (min)bull volume of UL DL data transfers (kB)
Analyzing data about customer personal information revealed that these datacorrespond mainly to those who pay the bills at the end Employees and children
Document ID D28 Global Wireless Exposure Metric DefinitionFP7 Contract ndeg318273
Version V1 27Dissemination level PU
have been usually hiding respectively behind companies and parents who pay thebills but do not use many of those subscriptions personally
Data used for LEXNET were collected from the customer analytics system SAS andwere based on usersrsquo billing data for the month of January 2014 A LEXNET test areaconsisted of a few representative cells of different types of environment UrbanSuburban and Rural Subscribers who were located in the test area and did generateat least voice or data traffic have been taken into account Traffic data consisted of2G and 3G networks usage all together
Telekom Srbja LEXNET test area (2G and 3G)
User profile Geographical area
Rural Suburban Urban Global
tcom (s) voldata
(kB)tcom (s) voldata
(kB)tcom (s) voldata
(kB)tcom (s) voldata
(kB)
Heavy user 1176 40072 1230 46410 1372 47315 1313 46777
Moderate user 107 4929 120 11208 187 11367 153 11214
Light user 11 735 15 1186 28 1120 21 1181Table 13 User profiles defined in rural suburban and urban areas from TKS usage data
Specific 2G and 3G data were extrapolated considering for voice communicationsthat 72 of communications were made through the 2G network and 28 throughthe 3G For data traffic 91 of the traffic was assigned to 3G and 9 to 2G UL andDL data traffic proportions were respectively assumed to be 17 and 83 Thoseratios were calculated based on cell statistics that were obtained from the networkmanagement system on an hourly basis for same period of time Cells were same asthose used for identifying subscribers Finally three types of user profiles weredefined for voice and data service (see Figure 11 and Figure 12)bull heavy users top users consuming 80 of the total databull moderate users users consuming 15 of the total databull light users users consuming 5 of the total data
Table 13 details for different geographical areas the average voice communicationdurations and data traffic volumes per user profile
Figure 11 Distribution of the voice traffic for urban (red line) suburban (green line) and rural(black line) areas and aggregated over the 3 types of areas (blue line)
Document ID D28 Global Wireless Exposure Metric DefinitionFP7 Contract ndeg318273
Version V1 28Dissemination level PU
Figure 12 Distribution of the data traffic for urban (red line) suburban (green line) and rural(black line) areas and aggregated over the 3 types of areas (blue line)
The repartition of voice communications and data traffic over the two periods dayand night was extracted from the type of call statistics over 24h (see Figure 13 andFigure 14)The voice hourly extrapolation was based on outgoing calls and data extrapolationwas based on prepaid traffic due to limitations on the customer analytics system
Figure 13 Mobile phone voice communications hourly distribution over 24h
Document ID D28 Global Wireless Exposure Metric DefinitionFP7 Contract ndeg318273
Version V1 29Dissemination level PU
Figure 14 Mobile phone data traffic hourly distribution over 24h
63 of mobile phone voice and 48 data traffic were made during the day period(8 AM ndash 6 PM) and 37 and 52 respectively during the night period (6 PM ndash 8AM)Finally we could extract the average communication times and data traffic volumesper user profile for different geographical areas for 2G and 3G Telekom Srbjanetworks (see tables from 13 to 18)
2G (Telekom Srbja) Voice Data (83 DL 17 UL)
Urban tcom (s) volULdata [kB] volDLdata [kB]
Heavy user
Day 619 342 1660
Night 368 373 1807
Moderate user
Day 84 82 399
Night 50 90 434
Light user
Day 12 9 43
Night 7 10 47
Table 14 Average voice communication durations and data traffic volumes per user profile for a2G Telekom Srbja dense urban network
Document ID D28 Global Wireless Exposure Metric DefinitionFP7 Contract ndeg318273
Version V1 30Dissemination level PU
2G (Telekom Srbja) Voice Data (83 DL 17 UL)
Suburban tcom (s) volULdata [kB] volDLdata [kB]
Heavy user
Day 554 336 1828
Night 330 365 1773
Moderate user
Day 54 81 393
Night 32 88 428
Light user
Day 7 9 42
Night 4 9 45
Table 15 Average voice communication durations and data traffic volumes per user profile for a2G Telekom Srbja suburban network
2G (Telekom Srbja) Voice Data (83 DL 17 UL)
Rural tcom (s) volULdata [kB] volDLdata [kB]
Heavy user
Day 530 290 1406
Night 316 316 1531
Moderate user
Day 48 36 173
Night 29 39 188
Light user
Day 5 5 26
Night 3 6 28
Table 16 Average voice communication durations and data traffic volumes per user profile for a2G Telekom Srbja rural network
3G (Telekom Srbja) Voice Data (83 DL 17 UL)
Urban tcom (s) volULdata [kB] volDLdata [kB]
Heavy user
Day 242 3529 17119
Night 144 3843 18642
Moderate user
Day 33 848 4113
Night 20 923 4479
Light user
Day 5 91 441
Night 3 99 481
Table 17 Average voice communication durations and data traffic volumes per user profile for a3G Telekom Srbja dense urban network
Document ID D28 Global Wireless Exposure Metric DefinitionFP7 Contract ndeg318273
Version V1 31Dissemination level PU
3G (Telekom Srbja) Voice Data (83 DL 17 UL)
Suburban tcom (s) volULdata [kB] volDLdata [kB]
Heavy user
Day 216 3461 16791
Night 129 3769 18286
Moderate user
Day 21 836 4055
Night 13 910 4416
Light user
Day 3 88 429
Night 2 96 467
Table 18 Average voice communication durations and data traffic volumes per user profile for a3G Telekom Srbja suburban network
3G (Telekom Srbja) Voice Data (83 DL 17 UL)
Rural tcom (s) volULdata [kB] volDLdata [kB]
Heavy user
Day 207 2989 14498
Night 123 3255 15789
Moderate user
Day 19 368 1783
Night 11 400 1942
Light user
Day 2 55 266
Night 1 60 290
Table 19 Average voice communication durations and data traffic volumes per user profile for a3G Telekom Srbja rural network
Heavy users Moderate users Light users
Voice 47 25 28
Data 24 18 58Table 20 Repartition of user profiles for Telekom Serbia 2G and 3G voice and data usages
We can see that majority of voice communications at the test area in Serbia is doneover 2G contrary to what has been observed in Orange network Due to that reasonvoice communication is significantly lower on 3G than in the test area in FranceAverage data traffic volumes per user in France are a bit different than average datatraffic volumes at the test area in Serbia depending on the considered geographicalarea The repartitions of user profiles are also very different for voice usagesbetween Orange data and Telekom Serbia data A larger percentage of users areheavy users at Telekom Srbja while at Orange France there are more light users inthe test areas
Document ID D28 Global Wireless Exposure Metric DefinitionFP7 Contract ndeg318273
Version V1 32Dissemination level PU
3253 Extrapolation of 3G data to LTE
LTE data were collected from Orange network probes installed in Orange LTEnetwork For different geographical areas (urban suburban and rural) in the North ofFrance we could collect for some time periods during June 2014 the number of LTEusers and the total volumes of DL and UL data traffic Proceeding like we did for 3Gdata we extracted average user profiles (see Figure 15)
Figure 15 Distribution of data traffic aggregated over the 3 types of geographical areas for LTEnetwork
Then we evaluated the average volumes of LTE data traffic per day and per userprofile (see Table 21)
LTE network voldata [KB]
Heavy users 160639
Moderate users 60396
Light users 31003
Table 21 Average volumes of LTE data traffic per day per user profile
Comparing these data with data in Table 8 in the Global column we extract thefollowing 3G to LTE extrapolation ratios
Heavy user 22 Moderate user 87 Light user 615
The repartition of user profiles for Orange LTE data usages based on Figure 15 issummarized in Table 22
Heavy users Moderate users Light users
60 15 25 Table 22 Repartition of user profiles for Orange LTE data usages
Document ID D28 Global Wireless Exposure Metric DefinitionFP7 Contract ndeg318273
Version V1 33Dissemination level PU
This repartition is completely different compared to the repartition of user profiles forOrange 3G data usages The ratio between heavy usage and moderate usage is only25 for LTE while it is a factor 10 for 3G
326 IP traffic through WiFi
From [CISCO14] in 2014 9739 PB per month of IP traffic were generated byWestern Europeans and 4416 PB per month by Central and Eastern Europeans22 of the IP traffic was generated by tablets 35 by smartphones and 672 by PCs And about 41 of the total IP traffic was transmitted from FixedWiFiaccess
Considering that in Western Europe tablets were accounting for 6 (566 M) of allnetworked devices smartphones for 14 (2239 M) and PCs for 17 (2718 M) wecan evaluate the average IP traffic through WiFi per user per month for WesternEurope The same calculation was performed for Central and Eastern Europe (Table23)
Device Western Europe Central and Eastern Europe
smartphone 623 MB 410 MB
tablet 155 GB 22 GB
PC 99 GB 96 GBTable 23 Average IP traffic volumes through WiFi per device per user per month for Western
Europe and Central and Eastern Europe
We took the hypothesis that the UL traffic for WiFi represents 17 of the total datatraffic
327 Usage differences between the population categories
ICT usages are different depending on the age category of people The numbers inthe previous sections were extracted without distinction of the age category of usersWe are able nevertheless to play with the user profiles repartition For exampleconsidering a high school survey performed in Portugal between 2010 and 2014[SBOC12] teenagers were reported to use their mobile phone for voicecommunication an average of 30 minutes per day which corresponds to a heavyuser profile (see Figure 16) We could then consider a higher heavy user profilepercentage among young peopleIn [BYUN13] they assessed mobile phone usages in terms of number of calls per dayand average duration per call amongst Korean children and teenagers They haveshown that Korean children are on average using less than 5 minutes per day theirmobile phones for calling which would correspond to the usage for voice calls of amoderate userBesides in absence of any known study on the topic we are making the hypothesisthat a large percentage of seniors are light users
Document ID D28 Global Wireless Exposure Metric DefinitionFP7 Contract ndeg318273
Version V1 34Dissemination level PU
Figure 16 Distribution of Daily talk time by teenagers in Portugal (2378 3320 and 597answers in 201011 201112 and 201314 respectively)
We were obliged in the LEXNET project to fix precise numbers in order that to build areference scenario for EI assessment technical workpackages As explained abovesome result from statistical studies some others have been defined from basicassumptions
2G3GTelekom Srbja
Heavy users Moderate users Light users
Children Voice 25 50 25
Data 60 20 20
Young people Voice 47 25 28
Data 60 20 20
Adults Voice 47 25 28
Data 24 18 58
Seniors Voice 47 25 28
Data 5 25 70 Table 24 Repartition of user profiles for Telekom Serbia 2G and 3G usages for each population
category
3G Orange Heavy users Moderate users Light users
Children Voice 20 30 50
Data 50 40 10
Young people Voice 50 30 20
Data 50 40 10
Adults Voice 20 30 50
Data 10 20 70
Seniors Voice 20 30 50
Data 5 25 70Table 25 Repartition of user profiles for Orange 3G usages for each population category
0
5
10
15
20
25
30
35
DNK 0 1-9 10-19 20-29 30-59 60-119 ge120
Daily Talk time [minutes]
201011
201112
201314
Document ID D28 Global Wireless Exposure Metric DefinitionFP7 Contract ndeg318273
Version V1 35Dissemination level PU
LTE Orange Heavy users Moderate users Light users
Children 30 40 30
Young people 80 10 10
Adults 60 15 25
Seniors 10 40 50 Table 26 Repartition of user profiles for Orange LTE usages for each population category
33 SAR data
Reference SAR data were computed using 3D electromagnetic simulation platformsbased on the Finite Difference Time Domain (FDTD) [TAFLOVE00] and FiniteIntegration Technique (FIT) [WEIL77] methods SAR values were calculated for far-field and near-field exposure for two anatomical human body models of the VirtualFamily [CHRIST10] Duke a 34-year-old male and Eartha an 8-year-old girl Twopostures (standing and sitting) and three usages (mobile phone close to the headmobile phone or tablet for data and laptop usage) were selected More details onnumerical simulations can be found in [LEXNET IR21 2013]
Table 27 shows reference Whole-body SAR (WBSAR) values calculated for far-fieldand near-field exposure of the adult and the child models at four different frequencybands (see deliverable D26 Appendix 1 for specifications of frequency bands) Table28 shows reference WBSAR values calculated for exposure of the adult and the childmodels at 2100 MHz relevant for a human model standing or sitting close to theaccess point (this access point can be a femtocell or a WLAN access point)
WBSAR Frequency band
400 MHz 900 MHz 1940 MHz 2600 MHz
Child - voicesitting
DOWN 00088 00082 00071 00066
UP X 0029 0011 0014
Adult - voicesitting
DOWN 00050 00056 00043 00039
UP X 0012 00052 00047
Child - voicestanding
DOWN 00082 00084 00077 00071
UP X 0029 001 0015
Adult - voicestanding
DOWN 00064 00052 00046 00042
UP X 0012 00052 00053
Child - datasitting
DOWN 00090 00088 00071 00065
UP 0011 0011 00135 00094
Adult - datasitting
DOWN 00054 00046 00043 00038
UP 00078 00056 00081 00037
Child - datastanding
DOWN 00088 00090 00077 00072
UP 0013 001 00109 00083
Adult - datastanding
DOWN 0006 00052 00047 00042
UP 00064 00049 00039 00029
Child ndash laptopon the lap
DOWN X X 00069 00066
UP X X 00035 00038
Adult ndash laptop DOWN X X 00053 00049
Document ID D28 Global Wireless Exposure Metric DefinitionFP7 Contract ndeg318273
Version V1 36Dissemination level PU
on the lap UP X X 00027 0003
Child ndash laptopon a desk
DOWN X X 00069 00066
UP X X 00025 00031
Adult ndash laptopon a desk
DOWN X X 00053 00049
UP X X 00035 00027Table 27 Whole-body SAR data in Wkg for child and adult models for different devices in
different postures at different frequencies
WBSAR Femtocell (2100 MHz)Child ndash voice sitting 0000190Adult ndash voice sitting 000014Child ndash voice standing 000023Adult ndash voice standing 000013
Table 28 Whole-body SAR data in Wkg for child and adult models for a femtocell for differentpostures (reference transmitted power of 1 W)
UP stands for Uplink exposure to device) Values are normalized to a referencetransmitted power of 1 WDOWN stands for Downlink exposure to base-stations Values are normalized to areference received power density of 1 Wm-2
For the future we could imagine performing new SAR simulations for new new typesof wireless device For instance Appendix 1 presents the results of dosimetricsimulations performed with Google glasses [GLAS15]
Document ID D28 Global Wireless Exposure Metric DefinitionFP7 Contract ndeg318273
Version V1 37Dissemination level PU
4 EI INTEGRATION METHODOLOGY ON A MACRO 3G DENSE URBAN
SCENARIO
41 Scenario
We are showing in this section the EI integration methodology over 24 hours for amacro urban Orange 3G scenario
TimePopulatio
nEnvironment RAT
CellType
UserProfile
Posture Usage
Day Children Indoor 3G Macro Heavy StandingData
mobile
NightYoungpeople
OutdoorModerat
eSitting
Voicemobile
Adults LightDatatablet
Seniors Non userData
laptopTable 29 Input parameters for the macro urban Orange 3G scenario
The considered urban area is located into a typical European urban area in thecentre of Lyon (3rd largest city in France) (see Figure 17)
Figure 17 Urban area in Lyon
42 Input data
Time period Two time periods are considered the day time period from 8 am to 6 pm (10 hours intotal) and the night time period from 6 pm to 8 am (14 hours in total)
Population categories
Document ID D28 Global Wireless Exposure Metric DefinitionFP7 Contract ndeg318273
Version V1 38Dissemination level PU
4 population categories are considered Children (below 15 years) young people(between 15 and 29 years) adults (between 30 and 59 years) and seniors (over 60years)
Figure 18 Repartition by age of the population in the first district of Lyon in 2007 (from httphttpwwwcartesfrancefr)
From Figure 18 we extracted the repartition of the four population categories in thefirst district of Lyon
Populationcategory
Percentage
Children 139 Young people 328 Adults 382 Seniors 151 Table 30 Repartition of the population in the centre of Lyon
Environment ா
Two environments are considered indoor and outdoor environments Table 31 isderived from Table 4 considering that the time spent commuting is spent outdoor inour scenario
Day (from 8am to 6pm) Night (from 6pm to 8am)
Indoor Outdoor Indoor Outdoor
Children 8h15 (825) 1h45 (175) 13h45 (982) 15 min (18)
Young people 8h20 (83) 1h40 (17) 13h10 (94) 50 min (6)
Adults 8h15 (825) 1h45 (175) 13h05 (935) 55 min (65)
Seniors 7h35 (70) 2h25(30) 13h05 (935) 55 min (65)
Table 31 Repartition of each category of population by environment and time period
Consequently we are considering that 70 of mobile phone usages happen indoorsand 30 outdoors 100 of tablet and laptop usages are indoor usages
Macro 3G network ோ
Document ID D28 Global Wireless Exposure Metric DefinitionFP7 Contract ndeg318273
Version V1 39Dissemination level PU
User Profiles
Three user profiles (heavy moderate and light profiles) are used for mobile phoneusers and one moderate user profile for tablet and laptop users
Posture ௦ and Usage
Two network usages for the mobile phone are considered voice and data trafficusage If the mobile phone is used in indoor environment we consider that the useris in a sitting posture And if the mobile phone is used in outdoor environment weconsider that the user is in a standing posture For each population category wederived from Table 6 and Table 7 the proportions of users and non-users of mobilephones 3G tablets and 3G dongles (Table 32) Table 33 and Table 34 giverespectively average voice communication durations and data traffic volumes permobile phone user profile and the repartition of user profiles per population category
Children(under15 yo)
Youngpeople(15-29
yo)
Adults(30-59
yo)
Seniors(over 60
yo)
Mobile phone usageVoice communication
Non-users 68 4 5 30
Users 32 96 95 70
Mobile phone usageData traffic
Non-users 84 33 59 90
Users 16 67 41 10
3G Tablet usageNon-users 95 92 93 98
Users 5 8 7 2
3G dongle usageNon-users 98 90 90 93
Users 2 10 10 7Table 32 Proportions of users and non-users of mobile phones 3G tablets and 3G dongles perpopulation category
3G Voice Data (82 DL 18 UL)
Urban tcom (s) volULdata [kB] volDLdata [kB]
Heavy user
Day 841 4948 25124
Night 689 5879 31922
Medium user
Day 147 464 2390
Night 86 387 2001
Light user
Day 26 35 158
Night 16 28 124
Table 33 Average voice communication durations and data traffic volumes per mobile phoneuser profile
Document ID D28 Global Wireless Exposure Metric DefinitionFP7 Contract ndeg318273
Version V1 40Dissemination level PU
3G Orange Heavy users Moderate users Light users
Children Voice 20 30 50
Data 50 40 10
Young people Voice 50 30 20
Data 50 40 10
Adults Voice 20 30 50
Data 10 20 70
Seniors Voice 20 30 50
Data 5 25 70Table 34 Repartition of mobile phone user profiles for Orange 3G usages for each populationcategory
For 3G tablet usage we consider an average data traffic volume of 457 MB per dayper user whatever the population category 20 (91 MB) during day time and 80 (366 MB) during night time We are making the assumption that 15 of this traffic ison UL
For 3G dongle usage we consider an average data traffic volume of 816 MB per dayper user whatever the population category 50 (408 MB) during day time and 50 during night time As for the tablet we are making the assumption that 15 of thistraffic is on UL
Reference SAR values
SAR values are those extracted from Table 27 for the 1940 MHz frequency band Weuse adult values for young people adult and senior population categories and childvalues for child category
Received ோ transmittedത powers and UL data throughputs
Received ோ transmittedത powers and UL data throughputs can be derived fromnetwork simulation or from drive-test measurements in Lyon eg dosimetermeasurements for the DL power and TRACE mobile measurements for the ULpowerMean values indoor outdoor during the day and during the night are needed
43 EI integration
Considering Figure 7 we made the hypothesis that in 2016 48 of the population ofthe 1st district of Lyon is using a 3G network And considering the existence of fourtelecom operators in France we assumed that only 25 of these 48 3G users aresubscribers of the Orange 3G network
=ܫܧ 0139 lowast ௗܫܧ + 0328 lowast ௬௨ܫܧ + 0382 lowast +ௗ௨௧௦ܫܧ 0151 lowast ௦௦ܫܧ (4)
We propose to detail the calculation for one population category ie the adult oneTable 35 details the different macro urban 3G input parameters
Document ID D28 Global Wireless Exposure Metric DefinitionFP7 Contract ndeg318273
Version V1 41Dissemination level PU
Variable Abbreviation value
Time spent indoor during the day ௗ௬ௗݐ 29700 s
Time spent outdoor during the day ௗ௬௨௧ௗݐ 6300 s
Time spent indoor during the night ௧ௗݐ 47100 s
Time spent outdoor during the night ௧௨௧ௗݐ 3300 s
Mobile phone usage
Percentage of 3G connections ݎ ݐ ଷೞ 048
Percentage of mobile phone users for voicecalls
ݎ ݐ ௨௦௩ 095
Percentage of mobile phone users for datatraffic
ݎ ݐ ௨௦ௗ௧ 041
Average duration of mobile phone use indoorfor voice calls during the day
ௗ௬ௗ௩ݐ 15771 s
Average duration of mobile phone useoutdoor for voice calls during the day
ௗ௬௨௧ௗ௩ݐ 6759 s
Average duration of mobile phone use indoorfor voice calls during the night
௧ௗ௩ݐ 12012 s
Average duration of mobile phone useoutdoor for voice calls during the night
௧௨௧ௗ௩ݐ 5148 s
Average UL volume of mobile phone datatraffic indoor during the day
ݒ ௗ௧ௗ௬ௗ 42847 kB
Average UL volume of mobile phone datatraffic during the day
ݒ ௗ௧ௗ௬௨௧ௗ 18363 kB
Average UL volume of mobile phone datatraffic indoor during the night
ݒ ௗ௧௧ௗ 47943 kB
Average UL volume of mobile phone datatraffic during the night
ݒ ௗ௧௧௨௧ௗ 20547 kB
3G Tablet usage
Percentage of 3G tablet users ݎ ݐ ௨௦ଷ௧௧ 007
Average UL volume of tablet data trafficduring the day
ݒ ௧௧ௗ௬ 1365 kB
Average UL volume of tablet data trafficduring the night
ݒ ௧௧௧ 5490 kB
3G dongle usage
Percentage of 3G dongle users ݎ ݐ ௨௦ଷௗ 010
Average UL volume of laptop data trafficduring the day
ݒ ௧ௗ௬ 6120 kB
Average UL volume of laptop data trafficduring the night
ݒ ௧௧ 6120 kB
Reference SAR values
UL WBSAR for a phone call in voice modeindoor
ܤ ௩ܣ 00052 Wkg
UL WBSAR for a phone call in voice modeoutdoor
ܤ ௩௨௧ܣ 00052 Wkg
UL WBSAR for a phone call in data mode ܤ ௗ௧ܣ 00081 Wkg
Document ID D28 Global Wireless Exposure Metric DefinitionFP7 Contract ndeg318273
Version V1 42Dissemination level PU
indoor
UL WBSAR for a phone call in data modeoutdoor
ܤ ௗ௧௨௧ܣ 00039 Wkg
UL WBSAR for a laptop usage ܤ ௧ܣ 00035 Wkg
DL WBSAR indoor ܤ ܣ 00043 Wkg
DL WBSAR outdoor ܤ ௨௧ܣ 00047 WkgTable 35 Macro urban 3G scenario input data
ௗ௨௧௦ܫܧ = ܫܧ + ௨௧ܫܧ + ܫܧ + ௨௧ܫܧ (5)
ௗ௨௧௦ܫܧ = ଵ lowast തௗௗ௬௩ + ଶ lowast ത
௨௧ௗௗ௬௩ + ଷ lowast തௗ௧௩ + ସ lowast
ത௨௧ௗ௧௩ + ହ lowast
ത
+ lowast
തೠ
ೠ+ lowast
ത
+ lowast
തೠ
ೠ+ ଽ lowast RXindoorday + ଵ lowast RXoutdoorday + ଵଵ lowast RXindoornight + ଵଶ lowast
RXoutdoornight (6)
Whereത RXTh represent respectively mean transmitted power values mean
received power density values and average UL throughputs
ଵ to ସ are constant coefficients characterizing UL exposure for voice call usage
ଵ =ଶହlowast௧యಸೞ
ଶସlowastଷlowast ௗ௬ௗ௩ݐ] lowast ܤ ௩ܣ lowast ݎ ݐ ௨௦௩]
ଶ =ଶହlowast௧యಸೞ
ଶସlowastଷlowast ௗ௬௨௧ௗ௩ݐ] lowast ܤ lowast௩௨௧ܣ ݎ ݐ ௨௦௩]
ଷ =ଶହlowast௧యಸೞ
ଶସlowastଷlowast ௧ௗ௩ݐ] lowast ܤ ௩ܣ lowast ݎ ݐ ௨௦௩]
ଵ =ଶହlowast௧యಸೞ
ଶସlowastଷlowast ௧௨௧ௗ௩ݐ] lowast ܤ lowast௩௨௧ܣ ݎ ݐ ௨௦௩]
ହ to are constant coefficients characterizing UL exposure for data usage
ହ =025
24 lowast 3600lowast ൫ ݎ ݐ ଷೞ lowast ݎ ݐ ௨௦ௗ௧ lowast ݒ ௗ௧ௗ௬ௗ
+ ݎ ݐ ௨௦ଷ௧௧lowast ݒ ௧௧ௗ௬൯lowast ܤ ௗ௧ܣ+ ݎ ݐ ௨௦ଷௗ lowast ݒ ௧ௗ௬ lowast ௧൧ܤ
=025 lowast ݎ ݐ ଷೞ
24 lowast 3600lowast ݎ ݐ ௨௦ௗ௧ lowast ݒ ௗ௧ௗ௬௨௧ௗ lowast ܤ ௗ௧௨௧ܣ
=025
24 lowast 3600lowast ൫ ݎ ݐ ଷೞ lowast ݎ ݐ ௨௦ௗ௧ lowast ݒ ௗ௧௧ௗ
+ ݎ ݐ ௨௦ଷ௧௧lowast ݒ ௧௧௧൯lowast ܤ ௗ௧ܣ+ ݎ ݐ ௨௦ଷௗ lowast ݒ ௧௧lowast ௧൧ܤ
Document ID D28 Global Wireless Exposure Metric DefinitionFP7 Contract ndeg318273
Version V1 43Dissemination level PU
=025 lowast ݎ ݐ ଷೞ
24 lowast 3600lowast ݎ ݐ ௨௦ௗ௧ lowast ݒ ௗ௧௧௨௧ௗ
lowast ܤ ௗ௧௨௧ܣ
ଽ to ଵଶ are constant coefficients characterizing DL exposure
ଽ =ௗ௬ௗݐ lowast ܤ ܣ
24 lowast 3600
ଵ =ௗ௬௨௧ௗݐ lowast ܤ ௨௧ܣ
24 lowast 3600
ଵଵ =௧ௗݐ lowast ܤ ܣ
24 lowast 3600
ଵଶ =௧௨௧ௗݐ lowast ܤ ௨௧ܣ
24 lowast 3600
5 VARIABILITY AND UNCERTAINTIES
The EI is the output of an analytical model expressed by the equation (1) with anumber of uncertain input variables To propagate the uncertainty associated to theinput variables in the model the first step consists in characterizing the distribution ofinput variables Each uncertain variable input has to be described by a statisticaldistributionAverage DL power density and UL transmitted power are estimated using specificconfigurations environments and usages The downlink power absorbed by the userand the uplink power emitted by the device (and so partially absorbed by the user)depend on these configurations environments and usages Their statisticaldistributions have to be characterized in order to be incorporated in the total EIstatistical uncertaintyThe uncertainties of ICT usage data have been analyzed and modelled usingcomputable functions such as Gamma Gaussian or uniform distributions and asensitivity analysis has been carried out in order to determine the most importantparameters in the EI equation and how we could simplify the EI formula
51 Variability of the power transmitted by wireless personaldevices
In this subsection a methodology dedicated to characterize the variability of the
power radiated by wireless personal devices under specific propagation assumptions
is introduced
Studies focusing on SAR variability induced by sources generally did not take intoconsideration the impact of the propagation channel especially for an uplinktransmission In the framework of numerical dosimetric simulations for the LEXNETproject we analyzed the variability of the power radiated by wireless personal devicesunder specific propagation assumptions Interactions between the human body and
Document ID D28 Global Wireless Exposure Metric DefinitionFP7 Contract ndeg318273
Version V1 44Dissemination level PU
the antenna remain a complicated subject due to the high variability of theseparameters such as the type of antenna and the body shape These interactionshave been often investigated toward two disjoint objectives One is dedicated toanalyze the effect of the antenna radiation on the human body whereas the second isdevoted to study the effects of human body on the antenna performance In wirelesscommunications devices are usually placed close to the human body and as aconsequence part of the energy is necessarily absorbed The averaged SAR overthe whole body depends on many parameters such as the design of the antennaand its position with respect to the human body In our study we focused on both thequantification of the SAR and the statistical characterization of the variability of theradiated power We analyzed the influence of the positioning of the personal deviceagainst the human body on the SAR and the variability of the power radiated in bothLOS and NLOS (Non-line of Sight) scenariosDuring the communication the power radiated by the transmitter system dependsfundamentally on the gain in the LOS direction Since an antenna radiation pattern isusually anisotropic this parameter varies after each change in the transmitterorientation with respect to the base station For interference limitation reasons thetransmitted power is commonly adjusted to a minimum level consistent with apredetermined link quality Then the power radiated P
rmust be simultaneously
changed with the gain Ge (ϕLOS θLOS) in order to meet the requirements of receiver interms of signal to noise ratio (SNR) In practice assuming a constant noise powerthe received power (at the base station) must be such that the same SNR ismaintained in order to ensure a successful decoding This means that the product ofthe power radiated by the transmitting antenna (P
r) and of its power gain (Ge) in the
LOS direction should be constant
PrGe (ϕLOS θLOS) = α (7)
At first the personal device was assumed to be placed in a fixed position with respectto the userrsquos body Thus the userrsquos body and the personal device compose aninvariant transmitter system S The sphere surrounding the system S represents thesphere on which the various parts of a radiation pattern are calculated It is assumedto be fixed with respect to the base station while the system S can rotate alongazimuth and elevation angles The orientation of the system S with respect to the
base station axes is given by a random variable Ωs(S
S) where
Sand
Sare
respectively the angles of rotation of S around the vertical axis zrsquoOz and thehorizontal plane xOy (Figure 19)
Document ID D28 Global Wireless Exposure Metric DefinitionFP7 Contract ndeg318273
Version V1 45Dissemination level PU
Figure 19 Design concept
Figure 20 Comparison of radiation patterns of the laptop in free space and in the presence ofhuman body
Document ID D28 Global Wireless Exposure Metric DefinitionFP7 Contract ndeg318273
Version V1 46Dissemination level PU
Figure 21 Comparison of radiation patterns of the mobile phone in free space and in thepresence of human body
In the case of the laptop (Figure 20) the gain variation is smaller than the oneobtained in the mobile phone case (Figure 21) This can be explained by the fartherdistance between the 3G USB dongle and the human body The gain pattern isactually almost identical to the free space pattern as shown in the two planes Thesmall difference between both stems is due to reflection of waves by the body In thexz plane the effect of the left leg is observable around the direction θ = 270deg Since the exposure is proportional to the power radiated by the device whichdepends on many parameters a statistical analysis of this physical quantity isrequired in the modeling of the exposure Based on relationship (7) the powerradiated can be written in the following form
Pr =
ୋ ሺஐೞǡథಽೀೄǡಽೀೄ)(8)
where α is arbitrarily chosen equal to 1mW The gain Ge (Ω௦ǡைௌ θைௌ) depends on
the relative orientation (Ωs(S
S)) of the transmitter system with respect to the base
station To simplify computations S
and S
are assumed to follow a discrete uniform
distribution over [0deg 360deg] and [-45deg +45deg] respectively
Voice posture case
Figure 22 and Figure 23 show that the radiated power depends strongly on the localattenuation caused by the body shadowing effects It is very clear that it increaseslogarithmically with the attenuation level In this respect the quasi lognormalcharacter of the distribution is not surprising This statistical behavior remains typicalof Body Area Networks
Document ID D28 Global Wireless Exposure Metric DefinitionFP7 Contract ndeg318273
Version V1 47Dissemination level PU
Figure 22 Comparison between the empirical and the analytical distribution function obtainedwith the standing voice communication posture at 900 MHz
Figure 23 Comparison between the empirical and the analytical distributions function obtainedwith the sitting voice communication posture at 900 MHz
Between the two voice postures (standing and sitting) a small variation in theparameters of the distributions is noticed This is due to the fact that the antenna gainis mainly affected by the upper body portion The latter is not perfectly identical inboth postures in spite of the identical positions of the hand and the hand + head withrespect to the mobile phone This is due to a few constraints in building thecomputerized body models
Laptop posture case
In the case of laptop the variability of the radiated power is not very large The highpeaks of radiated power are up to 20mW which is smaller than those noticed withthe mobile phone These results can be explained by the fact that the 3G USBdongle is localized away from the human body (Figure 24)
Document ID D28 Global Wireless Exposure Metric DefinitionFP7 Contract ndeg318273
Version V1 48Dissemination level PU
Figure 24 Comparison between the empirical and the analytical distribution functions obtainedwith the laptop posture at 1940 MHz
During the post-processing a particular attention was given to the limitation of themaximum power that can be radiated by the mobile phone Particularly in the case ofGSM 900 MHz the average power radiated by the mobile antenna is always limitedto a threshold power of 250 mW
The results show that the performance of the antenna is significantly affected interms of radiation efficiency as well as shape of the radiation patterns especially inthe case of a mobile phone use for voice calls This observation is reflected by theabsorption of a huge amount of radiated power by the head and the hand and also bythe partial reflection of the waves by the body Furthermore the degradation of theradiation efficiency and the level of exposure level showed a (moderate) sensitivity tothe change in the position of the personal device with respect to the human bodyparticularly in the case of the laptopIn a wireless network context the exposure has been found to be strongly dependenton the local propagation environment owing to the power control enforced by mostwireless communications standards This was addressed by combining the Whole-body SAR value (calculated for a constant power) with a statistical distribution of theradiated power for various user positions expressing the dependence on theposition of the device with respect to the body and the impact of the propagationchannel (eg the number of paths their attenuation and the departure angles)
52 EI variability
The assessment of the EI is based on input parameters collected from surveyssimulations and measurements These input parameters can be divided into severalgroups as presented in section 3 ICT usage data have a great and direct impact onthe exposure duration And due to the complexity variability as well as confidentialityICT usage data are not easy to obtain and therefore to characterize Using the datacollected in the framework of LEXNET project a statistical analysis was performed inorder to characterize this variability Then a random sampling from probability
Document ID D28 Global Wireless Exposure Metric DefinitionFP7 Contract ndeg318273
Version V1 49Dissemination level PU
distributions of ICT usage data was realized in order to characterize the EI variabilityand uncertainty with respect to ICT usage data (we considered other groups of dataas constant values) by using Monte Carlo method
521 Statistical analysis of ICT usage data
We considered ICT usage data as twelve different input parameters summarized inTable 36 Based on daily traffic consumption recorded on the 3G network of Orangeeach parameter was well defined in order to characterize its statistical distribution
Input parameter Description
Htday Total voice call duration during the day for heavyusers
Mtday Total voice call duration during the day for moderateusers
Ltday Total voice call duration during the day for light users
Htnight Total voice call duration during the night for heavyusers
Mtnight Total voice call duration during the night formoderate users
Ltnight Total voice call duration during the night for lightusers
Hvolday Data traffic volume during the day for heavy users
Mvolday Data traffic volume during the day for moderate users
Lvolday Data traffic volume during the day for light users
Hvolnight Data traffic volume during the night for heavy users
Mvolnight Data traffic volume during the night for moderateusers
Lvolnight Data traffic volume during the night for light usersTable 36 ICT usage data represented by twelve different input parameters
In our study we used Akaike Information Criterion (AIC) in order to determinate thedistributions followed by the different input parameters This measurement isdeveloped using information theory for model selection It offers an estimation of therelative quality among some given statistical models for a set of data by evaluatingAIC value of each model From the equation below we can see that AIC depends onL (value of likelihood function for the model) and k (number of estimated parametersin the model) Great L will offer us a more accurate model but at the same time greatk may lead to overfitting
AIC=2k-2log(L) (9)
Hence AIC encourages the advantage of fitting (by maximizing L) while trying toavoid overfitting (by minimizing k) The preferred model is the one with the minimumAIC value In our study we tried to find the preferred model among a group ofcommon statistical models (Normal Lognormal Rayleigh Weibull ExponentialGamma Rician and Generalized Extreme Value) for our ICT usage data Thedistribution results for urban suburban and rural scenarios are shown in the followingtables
Document ID D28 Global Wireless Exposure Metric DefinitionFP7 Contract ndeg318273
Version V1 50Dissemination level PU
Input Parameter Distribution Param1 Param2 Param3
Htday GEV 3562696e-1 4532385e2 5123877e2
Mtday GEV -155576e-1 8922579e1 1566470e2
Ltday Weibull 4120504e1 1210874
Htnight Weibull 9040221e2 8753780e-1
Mtnight Weibull 1915478e2 1548896
Ltnight Weibull 3779658e1 1159748
Hvolday Weibull 3789408e3 6381982e-1
Mvolday Weibull 5900637e2 9674856e-1
Lvolday Lognormal 3137842 1304834e
Hvolnight Weibull 4513852e3 6264050e-1
Mvolnight Weibull 5412720e2 9230518e-1
Lvolnight Lognormal 3134336e 1306830Table 37 Distribution selection for usage data group of urban scenario
InputParameter
Distribution Param1 Param2 Param3
Htday Gamma 1199636 9934028e2
Mtday GEV -2085134e-1 1413730e2 2283643e2
Ltday Weibull 6628165e1 1126797
Htnight Weibull 8617700e2 8500429e-1
Mtnight Weibull 2164593e2 1176168
Ltnight Weibull 5217715e1 1032256
Hvolday Weibull 4215846e3 6954090e-1
Mvolday Gamma 1125814 7233229e2
Lvolday Lognormal 3793228 1459122
Hvolnight Gamma 7897441e-1 7881916e2
Mvolnight Lognomal 5680914 1529319
Lvolnight Lognormal 3567057 1434982Table 38 Distribution selection for usage data group of suburban scenario
InputParameter
Distribution Param1 Param2 Param3
Htday GEV 3992009e-1 4499851e2 5001061e2
Mtday GEV 5338537e-2 9253486e1 1497340e2
Ltday Weibull 4033680e1 1105567
Htnight Weibull 9138381e2 8435146e-1
Mtnight Weibull 1967658e2 1303428
Ltnight Gamma 110623 3172726e1
Hvolday Weibull 6086792e3 6560783e-1
Mvolday Weibull 9412760e+2 9226993e-1
Lvolday GEV 1329584 1645838e1 1283718e1
Hvolnight Weibull 7731316e+3 6842199e-1
Mvolnight Gamma 9888754e-1 1002908e3
Lvolnight Lognormal 3434330 1494722Table 39 Distribution selection for usage data group of rural scenario
Document ID D28 Global Wireless Exposure Metric DefinitionFP7 Contract ndeg318273
Version V1 51Dissemination level PU
For the 3G urban scenario as shown in Table 40 highest Sobolrsquo indices were foundfor the average time spent on voice call for heavy users during the day period andnight period and average data traffic volumes for heavy users during the day periodand the night period which means that for this specific scenario most influentparameters are data concerning heavy users
Parameter Sobolrsquo Indices
Htday
05874
Mtday
00077
Ltday
00046
Htnight
01812
Mtnight
00055
Ltnight
00044
Hvolday
01625
Mvolday
00054
Lvolday
00043
Hvolnight
01359
Mvolnight
00043
Lvolnight
00042
Table 40 Evaluated Sobolrsquo indices for each ICT usage parameter for the urban scenario
522 EI sensitivity analysis
Several input parameters are needed for EI calculation life segmentation datareference exposure data received (Rx) emitted (Tx) power data and personalwireless devices usage data So in order to integrate the real exposure of thepopulation in different considered scenarios these main parameters should beconsidered one after another In our study we aim to characterize the variability of EIwith respect to ICT usage data group (represented by the twelve parametersdescribed in Table 36) by using Monte Carlo method To this end a random samplingfrom probability distributions of usage data was realized and all the factors in otherthree data groups (life segmentation reference exposure and received (Rx) emitted(Tx) power data group) were considered as constant values and derived fromsurveys and simulations in order to launch Monte Carlo simulations
100000 sample sets data were considered to guaranty the large size simulationsneeded by Monte Carlo method However from our observation the results wereconverging after 25000 simulations The average global exposure (EI) was finallyconverging to 286e-7 Wkg for urban scenario 131e-7 Wkg for suburban scenarioand 143e-7 Wkg for rural scenario The mean estimated central tendency (blackline) and 95 confidence interval (grey zone) as functions of simulation iterationnumber for the three scenarios are shown in Figure 25 The standard deviation (σ)
Document ID D28 Global Wireless Exposure Metric DefinitionFP7 Contract ndeg318273
Version V1 52Dissemination level PU
for the three scenarios is also given in the same figure We obtain the averagevariation coefficients of 53 (urban) 43 (suburban) and 56 (rural) by dividing themean by the corresponding σ The important variation coefficients show that the global exposure is very sensitive due to the high complexity as well as high variabilityof ICT usage data
(a) Urban scenario
(b) Suburban scenario
(c) Rural scenarioFigure 25 Mean estimated central tendency (black line) and 95 confidence interval standard
deviation as a function of simulation iterations for urban (a) suburban (b) and rural (c)scenario
0 05 1 15 2 25 3 35 4 45 5
x 104
14
15
16
17
18
19
2
21
22x 10
-7
Iterations
EI
[Wk
g]
Standard deviation
0 05 1 15 2 25 3 35 4 45 5
x 104
4
45
5
55
6
65
7
75
8x 10
-8
Iterations
[Wk
g]
Standard deviation
0 05 1 15 2 25 3 35 4 45 5
x 104
7
75
8
85
9
95
x 10-8
Iterations
[Wk
g]
Standard deviation
Document ID D28 Global Wireless Exposure Metric DefinitionFP7 Contract ndeg318273
Version V1 53Dissemination level PU
6 CONCLUSION
In this final deliverable of WP2 concerning the global exposure metric the built metrichas been definedThe proposed metric called Exposure Index (EI) has the advantage to overpass thelimitations of the actual metrics that in fact are managing separately the exposureinduced by personal devices and the one induced by the network equipment (basestations and access points) But devices base station antennas and access pointsare definitely parts of the same wireless environment and the global wirelessexposure is induced by all of them
The EI is described with an analytical model with input variables describing thecoverage area of interest the accessible networks the population and the habits interms of location and of wireless devices usage The output is the EI covering theday-to-day averaged exposure of population in a given area incurred by an entirewireless network from base stations and access points to individual devices
The analytical model of the EI has been first detailed and the input variables definedThen we presented the EI integration methodology on a concrete example a macrodense urban 3G scenario We have shown that using all the input data collectedmeasured and simulated during the LEXNET project we are able to integrate themetric we built on a comprehensive scenario
First sensitivity analyses have shown that the EI is highly variable and depending onthe considered scenario is driven by some more influent input parameters
Finally a new human exposure index to EMF is available integrating peoplersquos lifesegmentation and ICT usages and combining both exposure from mobile devicesand exposure from base stations and access pointsThe EI as it is at the end of the LEXNET project is usable but could make a good useof simplification depending on the considered scenario
This new metric might in the future benefit different user groups such as telecomoperators as a Key Performance Indicator for network optimization nationalregulators as such a metric reflects the real global exposure of a population to RF-EMF We can expect also it would be used to feed health risk epidemiologicalstudies
Document ID D28 Global Wireless Exposure Metric DefinitionFP7 Contract ndeg318273
Version V1 54Dissemination level PU
7 REFERENCES
[BYUN13] Byun Y-H et al ldquoEpidemiological Characteristics of
Mobile Phone Ownership and Use in Korean Children and
Adolescentsrdquo Env Health and Toxicology vol 28
published online 2013
[Carte09] httpwwwcartesfrancefr
[CISCO14] Cisco Visual Networking Index Global Mobile Data Traffic
Forecast Update 2013-2018 February 2014 Last update
of the document can be found here
httpwwwciscocomcenussolutionscollateralservice-
providervisual-networking-index-vniwhite_paper_c11-
520862html
[CHLWW08] ConilE Hadjem A Lacroux F Wong M F and Wiart J
ldquoVariability analysis of SAR from 20 MHz to 24 GHz for
different adult and child models using finite-difference
time-domainrdquo Phys Med Biol vol 53 pp 1511-1525
2008
[CHRIST10] Christ A Kainz W Hahn E G Honegger K Zefferer
M Neufeld E Rascher W Janka R Bautz W Chen
J Kiefer B Schmitt P Hollenbach H-P Shen J
Oberle M Szczerba D Kam A Guag J W amp Kuster
N ldquoThe Virtual Family--development of surface-based
anatomical models of two adults and two children for
dosimetric simulationsrdquo Phys Med Biol vol 55 pp 23-
38 2010
[COOPER10] Cooper A R et al ldquoPatterns of GPS measured time
outdoors after school and objective physical activity in
English children the PEACH projectrdquo International Journal
of Behavioral Nutrition and Physical Activity Vol 7 Ndeg 31
2010
[CREDOC13] R Bigot P Croutte and E Daudey laquo La diffusion des
technologies de lrsquoinformation et de la communication dans
la socieacuteteacute franccedilaise (2013) raquo Dec 2013
[CSTM15] CST [Online] Available httpwwwcstcom [Accessed
Sep 2015]
[GCWW10] Gati A Conil E Wong MF Wiart J ldquoDuality between
uplink local and downlink whole body exposures in
Document ID D28 Global Wireless Exposure Metric DefinitionFP7 Contract ndeg318273
Version V1 55Dissemination level PU
operating Networksrdquo IEEE Transactions on EMC Vol 52
ndeg4 Nov 2010
[GLAS15] Google Glass [Online] Available wwwgooglecomglass
[Accessed July 2015]
[GRAB15] GrabCAD [Online] Available wwwgrabcadcom
[Accessed July 2015]
[HETUS06] C Aliaga ldquoHow is the time of women and men distributed
in Europe Statistics in focus population and social
conditionsrdquo Apr 2006
[HOFFERTH01] S L Hofferth et al ldquoHow american children spend their
timerdquo Journal of Marriage and the Family vol 63 Ndeg2
May 2001
[ICNI98] International Commission for Non Ionizing Radiation
Protection (ICNIRP) ldquoGuidelines for limiting exposure to
time-varying electric magnetic and electromagnetic fields
(up to 300 GHz)rdquo Health Physics Vol 74 nordm 4 Apr
1998 pp 494-522
[IEEE02] TC95_SC1 - Techniques Procedures Instrumentation
and Computation Working Group C953-2002 - IEEE
Recommended Practice for Measurements and
Computations of Radio Frequency Electromagnetic Fields
With Respect to Human Exposure to Such Fields 100
kHz-300 GHz IEEE 2002
[INSEE11] L Ricroch and B Roumier Enquecircte Emploi du
temps 2009-2010 laquo Depuis 11 ans moins de tacircches
meacutenagegraveres plus drsquoInternetraquo Insee Premiere Ndeg 1377
Nov 2011
[LARSON01] LarsonR W ldquoHow US Children and Adolescents SpendTime What It Does (and Doesnrsquot) Tell Us About TheirDevelopmentrdquo Current Directions in PsychologicalScience Vol 10 Ndeg 5 Oct 2001
[LARSON11] Larson L R et al ldquoChildrenrsquos Time Outdoors Resultsand Implications of the National Kids Surveyrdquo Journal ofPark and Recreation Administration Vol 29 Ndeg 2 2011
[LEXNET D21 2013] Vermeeren G Thielens A Aerts S Joseph W
Martens L Oliveira C Mackowiak M Correia LM
Pejanovic-Djurisic M Veljovic Z Nešković A
Koprivica M Gati A Varsier N Hadjem A Wiart J
Document ID D28 Global Wireless Exposure Metric DefinitionFP7 Contract ndeg318273
Version V1 56Dissemination level PU
ConilE ldquoD21 Current metrics for EMF exposure
evaluationrdquo LEXNET project April 2013
[LEXNET D22 2013] Wiedemann P M Freudenstein F ldquoD22 Risk and
exposure perceptionrdquo LEXNET project July 2013
[LEXNET D23 2013] Vermeeren G Plets D Joseph W Martens L Conil E
Varsier N Wiart J Corre Y Oliveira C Sebastiatildeo D
Correia LM Aguumlero R Diez L Rodriacuteguez L Koprivica
M Nešković A Popović M Milinković J Nikšić S ldquoD23
Scenariosrdquo LEXNET project November 2013
[LEXNET IR21 2013] ldquoNumerical toolsrdquo LEXNET project July 2013
[LEXNET D25 2014] Wiedemann P M Freudenstein F ldquoD25 Risk and
exposure perceptionrdquo LEXNET project November 2014
[NAGAOKA08] Nagaoka T and Watanabe S ldquoPostured voxel-based
human models for electromagnetic dosimetryrdquo Physics in
medicine and biology vol 53 pp 7047-7061 2008
[PLETS15] Plets D Joseph W Aerts S Vanhecke K
Vermeeren G Varsier N Wiart J and Martens L
ldquoAssessment of contribution of other users to own total
whole-body RF absorption in train environmentrdquo
Bioelectromagnetics (accepted)
[SBOC12] Sebastiao D Branco M Oliveira C and Correia L
MldquoUsage of mobile phones and concerns on
electromagnetic radiations of Portuguese youngstersrdquo
ICNIRP 7th International NIR Workshop 2012
[TAFLOVE00] Taflove A and Hagness S C 2000 Computational
Electrodynamics The Finite-Difference Time-Domain
Method 2nd edn (Boston MA Artech House Publishers)
[TNS10] TNS Sofres survey Observatoire Socieacutetal du teacuteleacutephone
mobile Dec 2010
[TVPO15] T V Population [Online] Available
httpwwwitisethzch [Accessed Sep 2015]
[WEIL77] WeilandT ldquoA discretization model for the solution of
Maxwells equations for six-component fieldsrdquo Electronics
and Communication Vol 31 Mar 1977 pp 116-120
[WIART08] Wiart J Hadjem A Wong M F and Bloch I Analysis of
RF exposure in the head tissues of children and adults
Document ID D28 Global Wireless Exposure Metric DefinitionFP7 Contract ndeg318273
Version V1 57Dissemination level PU
Physics in medicine and biology vol 53 pp 3681-3695
2008
Document ID D28 Global Wireless Exposure Metric DefinitionFP7 Contract ndeg318273
Version V1 58Dissemination level PU
8 MAIN PUBLICATIONS
Hadjem A Varsier N Conil E et al ldquoCharacterization of far-field and near-fieldexposure of the population for RF-EMF in realistic configurations of ICT usagesrdquoBEMS 2014
Plets D Joseph W Aerts S Vanhecke K et al ldquoPrediction and comparison ofdownlink electric-field and uplink localised SAR values for realistic indoor wirelessplanningrdquo Radiat Prot Dosimetry (2014) 162 (4) 487-498 doi 101093rpdncu019
Huang Y Krayni A Hadjem A Wiart J Person C and Varsier N ldquoComparison ofthe average global exposure of a population induced by a macro 3G network inurban suburban and rural areasrdquo URSI AT-RASC 2015
Krayni A ldquoCharacterization of the exposure induced by a wireless networkrdquo URSIAT-RASC 2015
Plets D Joseph W Vanhecke K et al ldquoJoint Minimization of Uplink and DownlinkWhole-Body Exposure Dose in Indoor Wireless Networksrdquo BioMed ResearchInternational vol 2015 Article ID 943415 9 pages 2015 doi1011552015943415
Varsier N Plets D Corre Y Vermeeren G Joseph W Aerts S Martens L andWiart J ldquoA novel method to assess the human population exposure induced by awireless cellular networkrdquo Bioelectromagnetics vol 36 ndeg6 pp 451-463 Sept 2015
Plets D Joseph W Aerts S Vanhecke K Vermeeren G Varsier N Wiart Jand Martens L ldquoAssessment of contribution of other users to own total whole-bodyRF absorption in train environmentrdquo Bioelectromagnetics (accepted)
Document ID D28 Global Wireless Exposure Metric DefinitionFP7 Contract ndeg318273
Version V1 59Dissemination level PU
APPENDIX 1 NUMERICAL DOSIMETRIC SIMULATIONS FOR GOOGLE
GLASSES
This appendix describes the results of SAR simulations for Google glasses[GLAS15] using a numerical simulation tool (CST Microwave Studio [CSTM15]) TheGlass is a pair of augmented reality glasses whose connectivity is assured by twowireless technologies Wi-Fi and Bluetooth in the 24 GHz band No cellular modulewas implemented on the prototype
These simulations have the aim of assessing the user exposure in the potentialscenario of using cellular technologies in the Glass prototype Accordingly SARvalues were evaluated for 900 MHz (GSM) 1940 MHz (UMTS) and 2600 MHz (LTE)
The Google glasses [GLAS15] were modelled using a CAD model [GRAB15] whichwas directly imported into CST Microwave Studio Figure A1
Figure A1 Google glasses CAD model [GRAB15]
As it can be seen from Figure A2 the Google glasses use a monopole whipantenna which was modelled in CST as a wire and a ground plane both made ofPerfect Electric Conductor (PEC) Figure A3 A small vacuum gap was introducedbetween them to insert a discrete port as the feeding point
Document ID D28 Global Wireless Exposure Metric DefinitionFP7 Contract ndeg318273
Version V1 60Dissemination level PU
Figure A2 Google Glass antenna [5]
Figure A3 ndash Google glasses modelled antenna
The antenna length was set using the Time Domain Solver Optimizer of CST tuned tominimise the S11 value at 2436 MHz The antenna optimisation process used theGoogle glass CAD model the modulated antenna and a head voxel model
The value of the S11 parameter is presented in Figure A4 Table A1 shows theGoogle glasses and the antenna main characteristics after optimisation
Document ID D28 Global Wireless Exposure Metric DefinitionFP7 Contract ndeg318273
Version V1 61Dissemination level PU
Figure A4 S11 for Google glasses antenna
Table A1 ndash Google glasses and antenna main characteristics at 2436 MHz
AntennaGoogleGlasses
Ground plane Wire GapS11[dB]
MaterialLength[mm]
MaterialLength[mm]
MaterialLength[mm]
Material
2519 PEC 2519 PEC 200 Vacuum -354Teflon(PTFE)
The computer used for the simulations contains a GPU NVIDIA TESLA C2050 thatsignificantly reduces the simulation time for scenarios with a maximum of 50 millionmesh cells Nevertheless the use of a full body voxel model would exceed this limitTherefore a voxel simulating only the head of a 26 years old woman [TVPO15] wasused Figure A5 It should be noted that the SAR values are only relevant in thehead regions near the antenna therefore validating this approach
Document ID D28 Global Wireless Exposure Metric DefinitionFP7 Contract ndeg318273
Version V1 62Dissemination level PU
Figure A5 ndash 26 years old woman voxel model (head) [TVPO15]
Simulations have been performed using the time domain solver and the automaticmesh generation of CST To achieve an accurate meshing a maximum mesh step of02 mm was defined for the antenna gap This implies that the automatic meshgenerator will not exceed this step width at the bounding box of the antenna gapFigure A6 shows the higher density mesh lines near the antenna gap (in blue)
Figure A6 ndash Mesh lines on the antenna gap
Document ID D28 Global Wireless Exposure Metric DefinitionFP7 Contract ndeg318273
Version V1 63Dissemination level PU
Figure A7 shows the mesh lines for the upper frequency of 3000 MHz whichresulted in 1086 million mesh cells
Figure A7 ndash Model mesh lines for the upper frequency of 3000 MHz
SAR calculations were performed using the averaging method according to the IEEEC953 standard [IEEE02] and the reference (radiated) power was set to thenormalised value of 1 W The SAR calculation at the different frequencies assumesthat there are no reflection lossesTable A2 presents the main parameters used in each simulation scenario Thesimulation frequency range setting is important for the meshing process and theresulting number of mesh cells and simulation time The use of a GPU results in asignificant reduced simulation time eg for the 900 MHz scenario the simulationtime was reduced around 5 times compared to the case when no GPU is usedThe MLW (Maximum number of Lines per Wavelength) value defines the upper limitof lines per wavelength of maximum frequency Increasing this number leads to ahigher accuracy but also increases the total calculation time The value was chosento achieve a trade-off between simulation accuracy and simulation time
Frequency[MHz]
FrequencyRange[MHz]
Mesh cells
AccelerationSimulation
TimeMLWSmallest
[mm]Largest
[mm]Number
[106]
900 500 ndash 1000 10 020 2890 116 2 Intel XeonE620240
GHz
GPU TeslaC2050
3 m 53 s
1940
1000ndash 3000 10 020 980 1086 1 h 0 m 58 s2600
Table A2 Simulation setup
Document ID D28 Global Wireless Exposure Metric DefinitionFP7 Contract ndeg318273
Version V1 64Dissemination level PU
The cutting planes presenting SAR values for the 900 and 2600 MHz are shown inFigure A8 and Figure A9 respectively One can observe the intuitive result thatmost of the energy is absorbed by the head region near to the antenna Moreover ahigher absorption of energy at the lowest frequency (09 GHz) is noticeable
Figure A8 Voxel cutting plane with SAR values for 900 MHz
Figure A9 Voxel cutting plane with SAR values for 2600 MHz
Table A3 shows the peak-spatial averaged SAR (psaSAR10g) and the whole headSAR values for each band
Frequency[MHz]
psaSAR10g[Wkg]
Whole head SAR[Wkg]
SAR CalculationTime
900 1314 0205 7 s
1940 1372 0128 10 m 51 s
2600 1051 0096 11 m 07 s
Table A3 SAR values
The values on Table A4 were evaluated for a radiated power of 1 W which wasused to normalise the results among the LEXNET partners but overestimates thereal typical exposure of 0125 W for UMTS and 01 W for LTE
Document ID D28 Global Wireless Exposure Metric DefinitionFP7 Contract ndeg318273
Version V1 65Dissemination level PU
The values of maximum radiated power (Pmax) to respect the maximumrecommended SAR value for the head (ie 2 Wkg [ICNI98]) are presented inTable A4 So one can see that for UMTS and LTE there are no problems ofexposure since the maximum radiated power that fulfils SAR requirements is abovethe maximum radiated by the devices in GSM the situation is different and in orderto respect the threshold the device will have to radiate a maximum quite below themaximum allowed for a device in general which can be implemented in the devicewithout problems
Frequency[MHz]
Pmax[W]
PeakMaximumEIRP Uplink [W]
GSM 900 0152 2000
UMTS 1940 0146 0125
LTE 2600 0190 0100
Table A4 Maximum radiated power for 2 Wkg SAR
Document ID D28 Global Wireless Exposure Metric DefinitionFP7 Contract ndeg318273
Version V1 66Dissemination level PU
APPENDIX 2 INTERNAL REVIEW
Reviewer 1 Mick Wilson Reviewer 2 Yoann Corre
Answer Comments Type Answer Comments Type
1 Is the deliverable in accordance with
(i) the Descriptionof Work
Yes
No
M
m
a
Yes
No
M
m
a
(ii) the internationalState of theArt
Yes
No
M
m
a
Yes
No
M
m
a
2 Is the quality of the deliverable in a status
(i) that allows tosend it to EC
Yes
No
M
m
a
Yes
No
M
m
a
(ii) that needsimprovement ofthe writing bythe editor of thedeliverable
Yes
No
Minor editorials onlysuggested
M
m
a
Yes
No
Minor modificationssuggested (mostlyeditorial corrections)
M
m
a
(iii) that needsfurther work bythe partnersresponsible forthe deliverable
Yes
No
M
m
a
Yes
No
M
m
a

Document ID D28 Global Wireless Exposure Metric DefinitionFP7 Contract ndeg318273
Version V1 50Dissemination level PU
Input Parameter Distribution Param1 Param2 Param3
Htday GEV 3562696e-1 4532385e2 5123877e2
Mtday GEV -155576e-1 8922579e1 1566470e2
Ltday Weibull 4120504e1 1210874
Htnight Weibull 9040221e2 8753780e-1
Mtnight Weibull 1915478e2 1548896
Ltnight Weibull 3779658e1 1159748
Hvolday Weibull 3789408e3 6381982e-1
Mvolday Weibull 5900637e2 9674856e-1
Lvolday Lognormal 3137842 1304834e
Hvolnight Weibull 4513852e3 6264050e-1
Mvolnight Weibull 5412720e2 9230518e-1
Lvolnight Lognormal 3134336e 1306830Table 37 Distribution selection for usage data group of urban scenario
InputParameter
Distribution Param1 Param2 Param3
Htday Gamma 1199636 9934028e2
Mtday GEV -2085134e-1 1413730e2 2283643e2
Ltday Weibull 6628165e1 1126797
Htnight Weibull 8617700e2 8500429e-1
Mtnight Weibull 2164593e2 1176168
Ltnight Weibull 5217715e1 1032256
Hvolday Weibull 4215846e3 6954090e-1
Mvolday Gamma 1125814 7233229e2
Lvolday Lognormal 3793228 1459122
Hvolnight Gamma 7897441e-1 7881916e2
Mvolnight Lognomal 5680914 1529319
Lvolnight Lognormal 3567057 1434982Table 38 Distribution selection for usage data group of suburban scenario
InputParameter
Distribution Param1 Param2 Param3
Htday GEV 3992009e-1 4499851e2 5001061e2
Mtday GEV 5338537e-2 9253486e1 1497340e2
Ltday Weibull 4033680e1 1105567
Htnight Weibull 9138381e2 8435146e-1
Mtnight Weibull 1967658e2 1303428
Ltnight Gamma 110623 3172726e1
Hvolday Weibull 6086792e3 6560783e-1
Mvolday Weibull 9412760e+2 9226993e-1
Lvolday GEV 1329584 1645838e1 1283718e1
Hvolnight Weibull 7731316e+3 6842199e-1
Mvolnight Gamma 9888754e-1 1002908e3
Lvolnight Lognormal 3434330 1494722Table 39 Distribution selection for usage data group of rural scenario
Document ID D28 Global Wireless Exposure Metric DefinitionFP7 Contract ndeg318273
Version V1 51Dissemination level PU
For the 3G urban scenario as shown in Table 40 highest Sobolrsquo indices were foundfor the average time spent on voice call for heavy users during the day period andnight period and average data traffic volumes for heavy users during the day periodand the night period which means that for this specific scenario most influentparameters are data concerning heavy users
Parameter Sobolrsquo Indices
Htday
05874
Mtday
00077
Ltday
00046
Htnight
01812
Mtnight
00055
Ltnight
00044
Hvolday
01625
Mvolday
00054
Lvolday
00043
Hvolnight
01359
Mvolnight
00043
Lvolnight
00042
Table 40 Evaluated Sobolrsquo indices for each ICT usage parameter for the urban scenario
522 EI sensitivity analysis
Several input parameters are needed for EI calculation life segmentation datareference exposure data received (Rx) emitted (Tx) power data and personalwireless devices usage data So in order to integrate the real exposure of thepopulation in different considered scenarios these main parameters should beconsidered one after another In our study we aim to characterize the variability of EIwith respect to ICT usage data group (represented by the twelve parametersdescribed in Table 36) by using Monte Carlo method To this end a random samplingfrom probability distributions of usage data was realized and all the factors in otherthree data groups (life segmentation reference exposure and received (Rx) emitted(Tx) power data group) were considered as constant values and derived fromsurveys and simulations in order to launch Monte Carlo simulations
100000 sample sets data were considered to guaranty the large size simulationsneeded by Monte Carlo method However from our observation the results wereconverging after 25000 simulations The average global exposure (EI) was finallyconverging to 286e-7 Wkg for urban scenario 131e-7 Wkg for suburban scenarioand 143e-7 Wkg for rural scenario The mean estimated central tendency (blackline) and 95 confidence interval (grey zone) as functions of simulation iterationnumber for the three scenarios are shown in Figure 25 The standard deviation (σ)
Document ID D28 Global Wireless Exposure Metric DefinitionFP7 Contract ndeg318273
Version V1 52Dissemination level PU
for the three scenarios is also given in the same figure We obtain the averagevariation coefficients of 53 (urban) 43 (suburban) and 56 (rural) by dividing themean by the corresponding σ The important variation coefficients show that the global exposure is very sensitive due to the high complexity as well as high variabilityof ICT usage data
(a) Urban scenario
(b) Suburban scenario
(c) Rural scenarioFigure 25 Mean estimated central tendency (black line) and 95 confidence interval standard
deviation as a function of simulation iterations for urban (a) suburban (b) and rural (c)scenario
0 05 1 15 2 25 3 35 4 45 5
x 104
14
15
16
17
18
19
2
21
22x 10
-7
Iterations
EI
[Wk
g]
Standard deviation
0 05 1 15 2 25 3 35 4 45 5
x 104
4
45
5
55
6
65
7
75
8x 10
-8
Iterations
[Wk
g]
Standard deviation
0 05 1 15 2 25 3 35 4 45 5
x 104
7
75
8
85
9
95
x 10-8
Iterations
[Wk
g]
Standard deviation
Document ID D28 Global Wireless Exposure Metric DefinitionFP7 Contract ndeg318273
Version V1 53Dissemination level PU
6 CONCLUSION
In this final deliverable of WP2 concerning the global exposure metric the built metrichas been definedThe proposed metric called Exposure Index (EI) has the advantage to overpass thelimitations of the actual metrics that in fact are managing separately the exposureinduced by personal devices and the one induced by the network equipment (basestations and access points) But devices base station antennas and access pointsare definitely parts of the same wireless environment and the global wirelessexposure is induced by all of them
The EI is described with an analytical model with input variables describing thecoverage area of interest the accessible networks the population and the habits interms of location and of wireless devices usage The output is the EI covering theday-to-day averaged exposure of population in a given area incurred by an entirewireless network from base stations and access points to individual devices
The analytical model of the EI has been first detailed and the input variables definedThen we presented the EI integration methodology on a concrete example a macrodense urban 3G scenario We have shown that using all the input data collectedmeasured and simulated during the LEXNET project we are able to integrate themetric we built on a comprehensive scenario
First sensitivity analyses have shown that the EI is highly variable and depending onthe considered scenario is driven by some more influent input parameters
Finally a new human exposure index to EMF is available integrating peoplersquos lifesegmentation and ICT usages and combining both exposure from mobile devicesand exposure from base stations and access pointsThe EI as it is at the end of the LEXNET project is usable but could make a good useof simplification depending on the considered scenario
This new metric might in the future benefit different user groups such as telecomoperators as a Key Performance Indicator for network optimization nationalregulators as such a metric reflects the real global exposure of a population to RF-EMF We can expect also it would be used to feed health risk epidemiologicalstudies
Document ID D28 Global Wireless Exposure Metric DefinitionFP7 Contract ndeg318273
Version V1 54Dissemination level PU
7 REFERENCES
[BYUN13] Byun Y-H et al ldquoEpidemiological Characteristics of
Mobile Phone Ownership and Use in Korean Children and
Adolescentsrdquo Env Health and Toxicology vol 28
published online 2013
[Carte09] httpwwwcartesfrancefr
[CISCO14] Cisco Visual Networking Index Global Mobile Data Traffic
Forecast Update 2013-2018 February 2014 Last update
of the document can be found here
httpwwwciscocomcenussolutionscollateralservice-
providervisual-networking-index-vniwhite_paper_c11-
520862html
[CHLWW08] ConilE Hadjem A Lacroux F Wong M F and Wiart J
ldquoVariability analysis of SAR from 20 MHz to 24 GHz for
different adult and child models using finite-difference
time-domainrdquo Phys Med Biol vol 53 pp 1511-1525
2008
[CHRIST10] Christ A Kainz W Hahn E G Honegger K Zefferer
M Neufeld E Rascher W Janka R Bautz W Chen
J Kiefer B Schmitt P Hollenbach H-P Shen J
Oberle M Szczerba D Kam A Guag J W amp Kuster
N ldquoThe Virtual Family--development of surface-based
anatomical models of two adults and two children for
dosimetric simulationsrdquo Phys Med Biol vol 55 pp 23-
38 2010
[COOPER10] Cooper A R et al ldquoPatterns of GPS measured time
outdoors after school and objective physical activity in
English children the PEACH projectrdquo International Journal
of Behavioral Nutrition and Physical Activity Vol 7 Ndeg 31
2010
[CREDOC13] R Bigot P Croutte and E Daudey laquo La diffusion des
technologies de lrsquoinformation et de la communication dans
la socieacuteteacute franccedilaise (2013) raquo Dec 2013
[CSTM15] CST [Online] Available httpwwwcstcom [Accessed
Sep 2015]
[GCWW10] Gati A Conil E Wong MF Wiart J ldquoDuality between
uplink local and downlink whole body exposures in
Document ID D28 Global Wireless Exposure Metric DefinitionFP7 Contract ndeg318273
Version V1 55Dissemination level PU
operating Networksrdquo IEEE Transactions on EMC Vol 52
ndeg4 Nov 2010
[GLAS15] Google Glass [Online] Available wwwgooglecomglass
[Accessed July 2015]
[GRAB15] GrabCAD [Online] Available wwwgrabcadcom
[Accessed July 2015]
[HETUS06] C Aliaga ldquoHow is the time of women and men distributed
in Europe Statistics in focus population and social
conditionsrdquo Apr 2006
[HOFFERTH01] S L Hofferth et al ldquoHow american children spend their
timerdquo Journal of Marriage and the Family vol 63 Ndeg2
May 2001
[ICNI98] International Commission for Non Ionizing Radiation
Protection (ICNIRP) ldquoGuidelines for limiting exposure to
time-varying electric magnetic and electromagnetic fields
(up to 300 GHz)rdquo Health Physics Vol 74 nordm 4 Apr
1998 pp 494-522
[IEEE02] TC95_SC1 - Techniques Procedures Instrumentation
and Computation Working Group C953-2002 - IEEE
Recommended Practice for Measurements and
Computations of Radio Frequency Electromagnetic Fields
With Respect to Human Exposure to Such Fields 100
kHz-300 GHz IEEE 2002
[INSEE11] L Ricroch and B Roumier Enquecircte Emploi du
temps 2009-2010 laquo Depuis 11 ans moins de tacircches
meacutenagegraveres plus drsquoInternetraquo Insee Premiere Ndeg 1377
Nov 2011
[LARSON01] LarsonR W ldquoHow US Children and Adolescents SpendTime What It Does (and Doesnrsquot) Tell Us About TheirDevelopmentrdquo Current Directions in PsychologicalScience Vol 10 Ndeg 5 Oct 2001
[LARSON11] Larson L R et al ldquoChildrenrsquos Time Outdoors Resultsand Implications of the National Kids Surveyrdquo Journal ofPark and Recreation Administration Vol 29 Ndeg 2 2011
[LEXNET D21 2013] Vermeeren G Thielens A Aerts S Joseph W
Martens L Oliveira C Mackowiak M Correia LM
Pejanovic-Djurisic M Veljovic Z Nešković A
Koprivica M Gati A Varsier N Hadjem A Wiart J
Document ID D28 Global Wireless Exposure Metric DefinitionFP7 Contract ndeg318273
Version V1 56Dissemination level PU
ConilE ldquoD21 Current metrics for EMF exposure
evaluationrdquo LEXNET project April 2013
[LEXNET D22 2013] Wiedemann P M Freudenstein F ldquoD22 Risk and
exposure perceptionrdquo LEXNET project July 2013
[LEXNET D23 2013] Vermeeren G Plets D Joseph W Martens L Conil E
Varsier N Wiart J Corre Y Oliveira C Sebastiatildeo D
Correia LM Aguumlero R Diez L Rodriacuteguez L Koprivica
M Nešković A Popović M Milinković J Nikšić S ldquoD23
Scenariosrdquo LEXNET project November 2013
[LEXNET IR21 2013] ldquoNumerical toolsrdquo LEXNET project July 2013
[LEXNET D25 2014] Wiedemann P M Freudenstein F ldquoD25 Risk and
exposure perceptionrdquo LEXNET project November 2014
[NAGAOKA08] Nagaoka T and Watanabe S ldquoPostured voxel-based
human models for electromagnetic dosimetryrdquo Physics in
medicine and biology vol 53 pp 7047-7061 2008
[PLETS15] Plets D Joseph W Aerts S Vanhecke K
Vermeeren G Varsier N Wiart J and Martens L
ldquoAssessment of contribution of other users to own total
whole-body RF absorption in train environmentrdquo
Bioelectromagnetics (accepted)
[SBOC12] Sebastiao D Branco M Oliveira C and Correia L
MldquoUsage of mobile phones and concerns on
electromagnetic radiations of Portuguese youngstersrdquo
ICNIRP 7th International NIR Workshop 2012
[TAFLOVE00] Taflove A and Hagness S C 2000 Computational
Electrodynamics The Finite-Difference Time-Domain
Method 2nd edn (Boston MA Artech House Publishers)
[TNS10] TNS Sofres survey Observatoire Socieacutetal du teacuteleacutephone
mobile Dec 2010
[TVPO15] T V Population [Online] Available
httpwwwitisethzch [Accessed Sep 2015]
[WEIL77] WeilandT ldquoA discretization model for the solution of
Maxwells equations for six-component fieldsrdquo Electronics
and Communication Vol 31 Mar 1977 pp 116-120
[WIART08] Wiart J Hadjem A Wong M F and Bloch I Analysis of
RF exposure in the head tissues of children and adults
Document ID D28 Global Wireless Exposure Metric DefinitionFP7 Contract ndeg318273
Version V1 57Dissemination level PU
Physics in medicine and biology vol 53 pp 3681-3695
2008
Document ID D28 Global Wireless Exposure Metric DefinitionFP7 Contract ndeg318273
Version V1 58Dissemination level PU
8 MAIN PUBLICATIONS
Hadjem A Varsier N Conil E et al ldquoCharacterization of far-field and near-fieldexposure of the population for RF-EMF in realistic configurations of ICT usagesrdquoBEMS 2014
Plets D Joseph W Aerts S Vanhecke K et al ldquoPrediction and comparison ofdownlink electric-field and uplink localised SAR values for realistic indoor wirelessplanningrdquo Radiat Prot Dosimetry (2014) 162 (4) 487-498 doi 101093rpdncu019
Huang Y Krayni A Hadjem A Wiart J Person C and Varsier N ldquoComparison ofthe average global exposure of a population induced by a macro 3G network inurban suburban and rural areasrdquo URSI AT-RASC 2015
Krayni A ldquoCharacterization of the exposure induced by a wireless networkrdquo URSIAT-RASC 2015
Plets D Joseph W Vanhecke K et al ldquoJoint Minimization of Uplink and DownlinkWhole-Body Exposure Dose in Indoor Wireless Networksrdquo BioMed ResearchInternational vol 2015 Article ID 943415 9 pages 2015 doi1011552015943415
Varsier N Plets D Corre Y Vermeeren G Joseph W Aerts S Martens L andWiart J ldquoA novel method to assess the human population exposure induced by awireless cellular networkrdquo Bioelectromagnetics vol 36 ndeg6 pp 451-463 Sept 2015
Plets D Joseph W Aerts S Vanhecke K Vermeeren G Varsier N Wiart Jand Martens L ldquoAssessment of contribution of other users to own total whole-bodyRF absorption in train environmentrdquo Bioelectromagnetics (accepted)
Document ID D28 Global Wireless Exposure Metric DefinitionFP7 Contract ndeg318273
Version V1 59Dissemination level PU
APPENDIX 1 NUMERICAL DOSIMETRIC SIMULATIONS FOR GOOGLE
GLASSES
This appendix describes the results of SAR simulations for Google glasses[GLAS15] using a numerical simulation tool (CST Microwave Studio [CSTM15]) TheGlass is a pair of augmented reality glasses whose connectivity is assured by twowireless technologies Wi-Fi and Bluetooth in the 24 GHz band No cellular modulewas implemented on the prototype
These simulations have the aim of assessing the user exposure in the potentialscenario of using cellular technologies in the Glass prototype Accordingly SARvalues were evaluated for 900 MHz (GSM) 1940 MHz (UMTS) and 2600 MHz (LTE)
The Google glasses [GLAS15] were modelled using a CAD model [GRAB15] whichwas directly imported into CST Microwave Studio Figure A1
Figure A1 Google glasses CAD model [GRAB15]
As it can be seen from Figure A2 the Google glasses use a monopole whipantenna which was modelled in CST as a wire and a ground plane both made ofPerfect Electric Conductor (PEC) Figure A3 A small vacuum gap was introducedbetween them to insert a discrete port as the feeding point
Document ID D28 Global Wireless Exposure Metric DefinitionFP7 Contract ndeg318273
Version V1 60Dissemination level PU
Figure A2 Google Glass antenna [5]
Figure A3 ndash Google glasses modelled antenna
The antenna length was set using the Time Domain Solver Optimizer of CST tuned tominimise the S11 value at 2436 MHz The antenna optimisation process used theGoogle glass CAD model the modulated antenna and a head voxel model
The value of the S11 parameter is presented in Figure A4 Table A1 shows theGoogle glasses and the antenna main characteristics after optimisation
Document ID D28 Global Wireless Exposure Metric DefinitionFP7 Contract ndeg318273
Version V1 61Dissemination level PU
Figure A4 S11 for Google glasses antenna
Table A1 ndash Google glasses and antenna main characteristics at 2436 MHz
AntennaGoogleGlasses
Ground plane Wire GapS11[dB]
MaterialLength[mm]
MaterialLength[mm]
MaterialLength[mm]
Material
2519 PEC 2519 PEC 200 Vacuum -354Teflon(PTFE)
The computer used for the simulations contains a GPU NVIDIA TESLA C2050 thatsignificantly reduces the simulation time for scenarios with a maximum of 50 millionmesh cells Nevertheless the use of a full body voxel model would exceed this limitTherefore a voxel simulating only the head of a 26 years old woman [TVPO15] wasused Figure A5 It should be noted that the SAR values are only relevant in thehead regions near the antenna therefore validating this approach
Document ID D28 Global Wireless Exposure Metric DefinitionFP7 Contract ndeg318273
Version V1 62Dissemination level PU
Figure A5 ndash 26 years old woman voxel model (head) [TVPO15]
Simulations have been performed using the time domain solver and the automaticmesh generation of CST To achieve an accurate meshing a maximum mesh step of02 mm was defined for the antenna gap This implies that the automatic meshgenerator will not exceed this step width at the bounding box of the antenna gapFigure A6 shows the higher density mesh lines near the antenna gap (in blue)
Figure A6 ndash Mesh lines on the antenna gap
Document ID D28 Global Wireless Exposure Metric DefinitionFP7 Contract ndeg318273
Version V1 63Dissemination level PU
Figure A7 shows the mesh lines for the upper frequency of 3000 MHz whichresulted in 1086 million mesh cells
Figure A7 ndash Model mesh lines for the upper frequency of 3000 MHz
SAR calculations were performed using the averaging method according to the IEEEC953 standard [IEEE02] and the reference (radiated) power was set to thenormalised value of 1 W The SAR calculation at the different frequencies assumesthat there are no reflection lossesTable A2 presents the main parameters used in each simulation scenario Thesimulation frequency range setting is important for the meshing process and theresulting number of mesh cells and simulation time The use of a GPU results in asignificant reduced simulation time eg for the 900 MHz scenario the simulationtime was reduced around 5 times compared to the case when no GPU is usedThe MLW (Maximum number of Lines per Wavelength) value defines the upper limitof lines per wavelength of maximum frequency Increasing this number leads to ahigher accuracy but also increases the total calculation time The value was chosento achieve a trade-off between simulation accuracy and simulation time
Frequency[MHz]
FrequencyRange[MHz]
Mesh cells
AccelerationSimulation
TimeMLWSmallest
[mm]Largest
[mm]Number
[106]
900 500 ndash 1000 10 020 2890 116 2 Intel XeonE620240
GHz
GPU TeslaC2050
3 m 53 s
1940
1000ndash 3000 10 020 980 1086 1 h 0 m 58 s2600
Table A2 Simulation setup
Document ID D28 Global Wireless Exposure Metric DefinitionFP7 Contract ndeg318273
Version V1 64Dissemination level PU
The cutting planes presenting SAR values for the 900 and 2600 MHz are shown inFigure A8 and Figure A9 respectively One can observe the intuitive result thatmost of the energy is absorbed by the head region near to the antenna Moreover ahigher absorption of energy at the lowest frequency (09 GHz) is noticeable
Figure A8 Voxel cutting plane with SAR values for 900 MHz
Figure A9 Voxel cutting plane with SAR values for 2600 MHz
Table A3 shows the peak-spatial averaged SAR (psaSAR10g) and the whole headSAR values for each band
Frequency[MHz]
psaSAR10g[Wkg]
Whole head SAR[Wkg]
SAR CalculationTime
900 1314 0205 7 s
1940 1372 0128 10 m 51 s
2600 1051 0096 11 m 07 s
Table A3 SAR values
The values on Table A4 were evaluated for a radiated power of 1 W which wasused to normalise the results among the LEXNET partners but overestimates thereal typical exposure of 0125 W for UMTS and 01 W for LTE
Document ID D28 Global Wireless Exposure Metric DefinitionFP7 Contract ndeg318273
Version V1 65Dissemination level PU
The values of maximum radiated power (Pmax) to respect the maximumrecommended SAR value for the head (ie 2 Wkg [ICNI98]) are presented inTable A4 So one can see that for UMTS and LTE there are no problems ofexposure since the maximum radiated power that fulfils SAR requirements is abovethe maximum radiated by the devices in GSM the situation is different and in orderto respect the threshold the device will have to radiate a maximum quite below themaximum allowed for a device in general which can be implemented in the devicewithout problems
Frequency[MHz]
Pmax[W]
PeakMaximumEIRP Uplink [W]
GSM 900 0152 2000
UMTS 1940 0146 0125
LTE 2600 0190 0100
Table A4 Maximum radiated power for 2 Wkg SAR
Document ID D28 Global Wireless Exposure Metric DefinitionFP7 Contract ndeg318273
Version V1 66Dissemination level PU
APPENDIX 2 INTERNAL REVIEW
Reviewer 1 Mick Wilson Reviewer 2 Yoann Corre
Answer Comments Type Answer Comments Type
1 Is the deliverable in accordance with
(i) the Descriptionof Work
Yes
No
M
m
a
Yes
No
M
m
a
(ii) the internationalState of theArt
Yes
No
M
m
a
Yes
No
M
m
a
2 Is the quality of the deliverable in a status
(i) that allows tosend it to EC
Yes
No
M
m
a
Yes
No
M
m
a
(ii) that needsimprovement ofthe writing bythe editor of thedeliverable
Yes
No
Minor editorials onlysuggested
M
m
a
Yes
No
Minor modificationssuggested (mostlyeditorial corrections)
M
m
a
(iii) that needsfurther work bythe partnersresponsible forthe deliverable
Yes
No
M
m
a
Yes
No
M
m
a
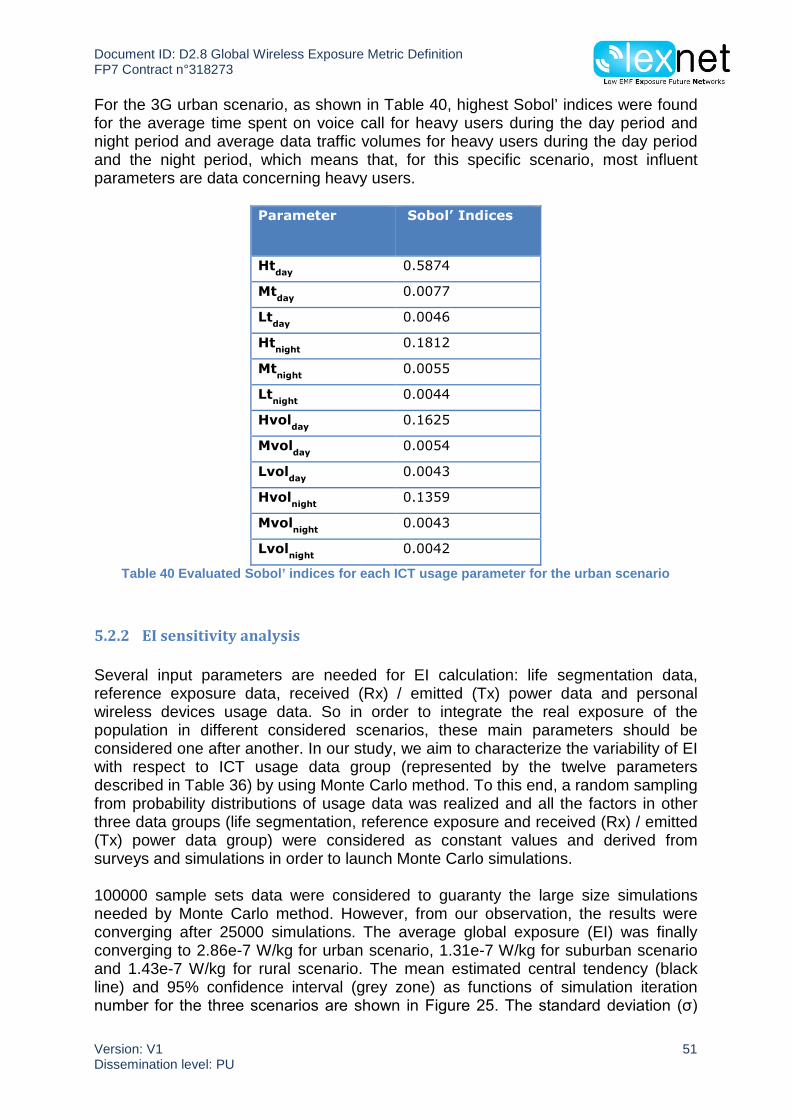
Document ID D28 Global Wireless Exposure Metric DefinitionFP7 Contract ndeg318273
Version V1 66Dissemination level PU
APPENDIX 2 INTERNAL REVIEW
Reviewer 1 Mick Wilson Reviewer 2 Yoann Corre
Answer Comments Type Answer Comments Type
1 Is the deliverable in accordance with
(i) the Descriptionof Work
Yes
No
M
m
a
Yes
No
M
m
a
(ii) the internationalState of theArt
Yes
No
M
m
a
Yes
No
M
m
a
2 Is the quality of the deliverable in a status
(i) that allows tosend it to EC
Yes
No
M
m
a
Yes
No
M
m
a
(ii) that needsimprovement ofthe writing bythe editor of thedeliverable
Yes
No
Minor editorials onlysuggested
M
m
a
Yes
No
Minor modificationssuggested (mostlyeditorial corrections)
M
m
a
(iii) that needsfurther work bythe partnersresponsible forthe deliverable
Yes
No
M
m
a
Yes
No
M
m
a