LEXNET WP2 D26 Global wireless exposure metric def … · The EI is an average of the population...
50
Document ID: D2.6 Global Wireless Exposure Metric Definition FP7 Contract n°318273 PROPRIETARY RIGHTS STATEMENT This document contains information, which is proprietary to the LEXNET Consortium. Neither this document nor the information contained herein shall be used, duplicated or communicated by any means to any third party, in whole or in parts, except with prior written consent of the LEXNET consortium. LEXNET Low EMF Exposure Future Networks D2.6 Global Wireless Exposure Metric Definition Contractual delivery date: M24 Actual delivery date: M24 Document Information Version V4 Dissemination level PU Editor Nadège Varsier (Orange) Other authors Yuanyuan Huang, Anis Krayni, Abdelhamid Hadjem, Joe Wiart (Orange) Günter Vermeeren, David Plets, Wout Joseph, Luc Martens (iMinds) Yoann Corre (SIR) Carla Oliveira, Daniel Sebastião, Luis Correia (INOV) Mladen Koprivica, Milica Popović (TKS) Enis Kocan, Milica Pejanovic-Djurisic (University of Montenegro) Peter Wiedemann, Frederik Freudenstein (KIT)
Transcript of LEXNET WP2 D26 Global wireless exposure metric def … · The EI is an average of the population...

Document ID D26 Global Wireless Exposure Metric DefinitionFP7 Contract ndeg318273
PROPRIETARY RIGHTS STATEMENTThis document contains information which is proprietary to the LEXNET Consortium Neither thisdocument nor the information contained herein shall be used duplicated or communicated by any
means to any third party in whole or in parts except with prior written consent of the LEXNETconsortium
LEXNETLow EMF Exposure Future Networks
D26 Global Wireless Exposure MetricDefinition
Contractual delivery date M24Actual delivery date M24
Document Information
Version V4 Dissemination level PU
Editor Nadegravege Varsier (Orange)
Other authors Yuanyuan Huang Anis Krayni Abdelhamid Hadjem Joe Wiart
(Orange)
Guumlnter Vermeeren David Plets Wout Joseph Luc Martens
(iMinds)
Yoann Corre (SIR)
Carla Oliveira Daniel Sebastiatildeo Luis Correia (INOV)
Mladen Koprivica Milica Popović (TKS)
Enis Kocan Milica Pejanovic-Djurisic (University of Montenegro)
Peter Wiedemann Frederik Freudenstein (KIT)
Document ID D26 Global Wireless Exposure Metric DefinitionFP7 Contract ndeg318273
Version V4 2Dissemination level PU
Milos Tesanovic (FLE)
Serge Bories (CEA)
Abstract In this deliverable a global wireless exposure metric is defined inorder to evaluate the averaged exposure of a population in a givenarea induced by a wireless communication network including basestations access points but also the personal devices of thepopulationFirst the concept of a new metric called Exposure Index (EI) isdetailed The EI is an average of the population exposure itconsequently results from the aggregation of all exposure sourcesand exposure situations met in the exposed area The computationof EI is based on a chain of exposure where each branchrepresents a specific exposure source and situation The index is aweighted sum of the individual exposures from all the branches inthis chainThen the concept is formalized through an analytical model withmultiple uncertain input variables The uncertainties and thevariability of all the input variables will be propagated into theanalytical modelSolutions that are explored to reduce the EI with constant Quality ofService (QoS) are introduced as a link to the work packages 4 and5 of the project dedicated to low EMF radio and low EMFarchitectureFinally the process to compute an exposure index is illustrated withthree examples
Key words Metric exposure index
Project Information
Grant Agreement ndeg 318273
Dates 1st November 2012 ndash 31th October 2015
Document approval
Name Position inproject Organisation Date Visa
Joe Wiart Coordinator Orange 19112014 OK
Document history
Version Date Modifications Authors
V0 15102014 First draft version N Varsier (Orange)
V1 29102014Added contributions of KIT and WPs4 and 5 respectively to section 1 andsection 32
N Varsier (Orange)
V2 31102014 Added INOV contribution to section 4 N Varsier (Orange)
V3 05112014 Final version before review N Varsier (Orange)
V4 19112014 Took internal reviewer commentsinto account N Varsier (Orange)
Document ID D26 Global Wireless Exposure Metric DefinitionFP7 Contract ndeg318273
Version V4 3Dissemination level PU
TABLE OF CONTENTS
TABLE OF CONTENTS 3
1 INTRODUCTION 7
2 THE EXPOSURE INDEX 11
21 KEY CONCEPT 1122 MATHEMATICAL FORMALIZATION 1223 VARIABILITY AND UNCERTAINTY 19
3 HOW TO USE THE INDEX OF EXPOSURE 21
31 REFERENCE SCENARIO 2132 REDUCING THE EMF EXPOSURE USING THE EI 23
4 EXAMPLES OF APPLICATION 29
41 COMPUTING CHAIN 2942 INDOOR EXPOSURE FROM 3G MACRO AND FEMTO-CELLS 3043 DATA LTE MACRO URBAN SCENARIO 3244 USING DOSIMETERS FOR THE EI EVALUATION 37
5 CONCLUSION 43
6 REFERENCES 45
APPENDIX 1 NUMERICAL DOSIMETRIC SIMULATIONS 49
APPENDIX 2 INTERNAL REVIEW 50
Document ID D26 Global Wireless Exposure Metric DefinitionFP7 Contract ndeg318273
Version V4 4Dissemination level PU
Executive Summary
This deliverable is focused on a global wireless exposure metric defined in order toevaluate the averaged exposure of a population in a given area induced by a givennetwork including base stations access points of the network but also the personaldevices of the population The project LEXNET aims at reducing this averagedexposureThe concept of this new metric is to take into account the global EMF exposure of apopulation to a given wireless telecommunication network (or a set of networks)It covers the exposure of a population during a given time frame in a given areaincurred by a wireless telecommunication network as a whole combining thedownlink exposure induced all day long by base stations and access points and theuplink exposure incurred by individual wireless communication devicesThe way to build the new metric called Exposure Index (EI) is based on a chain ofexposure covering all the configurations of exposure we are dealing with Some burstnodes are related to the communication network infrastructure as the type of radioaccess technology (GSM UMTShellip) or the layer (macro-cells micro-cells femto-cells) And other burst nodes are related to the network usage as the type of useddevices (mobile tablethellip) the usage of these devices (voice calls or data sessions)the profile of users (heavy users non-usershellip) Finally the EI is a weighted sum ofall the branches of the chain of exposure
The first chapter of the deliverable provides a reminder of the need to define a newmetric The second chapter details the new concept of EI and its formalizationthrough an analytical model with multiple uncertain input variables The uncertaintiesand the variability of all the input variables will be propagated into the analyticalmodelThe third chapter introduces solutions that are explored to reduce this index ofexposure in link with the work packages 4 and 5 of the project dedicated to low EMFradio and low EMF architectureFinally the way to produce a complete calculation of EI is illustrated on threesimplified deterministic examples The first example compares the indoor exposurefrom 3G macro-cells and from femto-cells The second example is computing theexposure of an adult population in a LTE macro urban environment consideringrealistic data usage Both examples are based on a real environment representationand network simulation tools have been used to simulate the up and down links Thethird example illustrates how dosimeter measurements can be used to assess the EI
Document ID D26 Global Wireless Exposure Metric DefinitionFP7 Contract ndeg318273
Version V4 5Dissemination level PU
List of Acronyms and Abbreviations
ANR Agence Nationale de la Recherche (French National Agency of Research)
BS Base Station
GSM Global System for Mobile
DL Down-Link
EI Exposure Index
EM ElectroMagnetic
EMF ElectroMagnetic Field
EPRE Energy Per Resource Element
ISD Inter Site Distance
FDD Frequency Division Duplexing
FP7 7th Framework Program of the European Commission
ICT Information and Communication Technology
KPI Key Performance Indicator
LOS Line Of Sight
LTE Long Term Evolution
NLOS Non Line Of Sight
SINR Signal to Interference plus Noise Ratio
QoS Quality of Service
RAT Radio Access Technology
RX Received
RF Radio-frequency
SAR Specific Absorption Rate
TX Transmitted
UE User Equipment
UL Up-Link
Document ID D26 Global Wireless Exposure Metric DefinitionFP7 Contract ndeg318273
Version V4 6Dissemination level PU
UMTSUniversal Mobile Telecommunication System
WiFi Wireless Fidelity
Document ID D26 Global Wireless Exposure Metric DefinitionFP7 Contract ndeg318273
Version V4 7Dissemination level PU
1 INTRODUCTION
Wireless communications are being used in almost every aspect of daily life Theextremely rapid technological evolution results in dramatic changes in the usage ofthe wireless devices but not in the perception of the exposure induced by thesenetworks
On the one hand new devices and new generations of wireless networks have madea multitude of new applications popular These applications (used mainly withsmartphones) are consuming more and more data as illustrated in Figure 1[CISCO13]
Figure 1 global mobile data per month traffic forecast by type of deviceSource Cisco VPN Mobile Forecast 2013
To support this increasing demand traditional macro-cellular networks are not welldimensioned anymore and new types of networks based on heterogeneoustopologies (including small cells) must be used to offload the data trafficThe deployment of new frequency bands and new technologies as LTE as well asthe growth of WiFi usage will help to support this demandAs illustrated on Figure 2 a massive small-cells deployment is forecast in the nextfew years [INFORMA12]
Document ID D26 Global Wireless Exposure Metric DefinitionFP7 Contract ndeg318273
Version V4 8Dissemination level PU
Figure 2 Worldwide small cells deployment forecast - Source Informa Telecom amp Media
But paradoxically as the role of wireless communications in the daily life quicklyexpanded the public concern around EMF health risk grows just as much An in-depth survey has been conducted in the framework of LEXNET Data was collectedfrom April to June 2013 in France Germany Portugal Spain Romania Montenegroand Serbia using an online survey tool A total of 2392 respondents participated inthis survey (mean age 3482 years gender distribution 40 female and 60 male)The first part of the survey focused on the perceived sources of daily RF-EMFexposure of the respondents Additionally we were interested in the factors whichdetermine in their view the degree of EMF exposure Another part of the surveyregarded risk perception and health concernsOnly key findings are reported here but detailed description of the survey and of theresults is in the deliverable entitled ldquoD22 Risk and exposure perceptionrdquo [LEXNETD22 2013]
Regarding the perceived health hazards of various usage scenarios our respondentsevaluated base stations on a school roof as the most dangerous Using mobile phonefor calls is perceived as less dangerous a somewhat lower score characterizes thelaptop used on the lap The results of this survey indicate that risk perceptions of thegeneral public and the underlying health concerns are guided by subjective models ofEMF impact which underestimate near-field exposure and overestimate far-fieldexposure People are more concerned about base stations than about all other RF-EMF sources
Currently different metrics are used to deal with exposure induced by sources closeto the users as mobile phones and with exposure induced by far away sources asbase station antennasThe current state of existing metrics to evaluate the exposure induced by RF-EMFsources has been reviewed in the deliverable ldquoD21 Current metrics for EMFexposure evaluationrdquo [LEXNET D21 2013]
Document ID D26 Global Wireless Exposure Metric DefinitionFP7 Contract ndeg318273
Version V4 9Dissemination level PU
Basically two types of metrics are distinguished the ones dedicated to the exposureinduced by sources close to the users as personal devices and expressed in termsof Specific Absorption Rate (SAR) and the ones focusing on the exposure induced byfar field sources as access points or base station antennas and currently expressedin ElectricMagnetic fields or Power DensityPersonal devices and base stations are too often represented as two separate worldswhen dealing with exposure issue But the connection between exposure induced bypersonal devices and base stations is indisputable Measurements on real networksillustrate a strong correlation (Figure 3) between the power emitted by personaldevices and the power received by personal devices from the base station antennas[GCWW10]
Figure 3 Duality between mobile phones emitted and received powers measured duringvoice calls on the 3G Orange France network - source [GCWW10]
The project LEXNET aims at filling the gap between these two separate ways ofdealing with exposure by proposing a new exposure metric named Exposure Index(EI) The EI is assessing the average exposure of a population induced by bothpersonal devices and base stations (or access points) The concept is to average thisglobal exposure over space by assessing the EI in a given area and average it overtime by considering a given time frame Therefore an important question that theproject must absolutely address is about the understandability and acceptability ofthis new exposure metric by the general publicA second survey has been therefore conducted in the framework of LEXNET Datawere collected from July to September 2014 in France Germany United KingdomPortugal Spain Romania and Serbia among a representative sample of the generalpopulation A total of 1809 respondents participated in this second surveyAn important part of the survey focused on how people are considering strategiesproposed in the framework of the LEXNET project to define and minimize thepopulationrsquos exposure to electromagnetic fieldsOnly key findings are reported here but detailed description of the survey and of theresults is in the deliverable entitled ldquoD25 Risk and exposure perceptionrdquo [LEXNETD25 2014]
-60 -40 -20 0 20 40
-120
-100
-80
-60
-40
Emitted power by devices (dBm)
Rec
eive
dpo
wer
by
devi
ces
(dB
m)
GSM 900
GSM 1800
UMTS 2100
Document ID D26 Global Wireless Exposure Metric DefinitionFP7 Contract ndeg318273
Version V4 10Dissemination level PU
When asked about adding up the exposure from personal wireless devices and theexposure from base stations when evaluating the exposure of people to EMF morethan 90 of respondents agreed on the fact that both downlink and uplink exposuresshould be considered when evaluating the population exposure to EMFA large percentage of respondents also agreed when asked if it makes sense tocharacterize the day-to-day exposure to EMF by averaging it over time or if they thinkthat an individual exposure to EMF can be approximated by measuring the exposureover a large population
The next chapter of this deliverable describes the Exposure Index proposed by theproject LEXNET
Document ID D26 Global Wireless Exposure Metric DefinitionFP7 Contract ndeg318273
Version V4 11Dissemination level PU
2 THE EXPOSURE INDEX
21 Key concept
The Exposure Index (EI) takes into account the global EMF exposure of apopulation to a given wireless telecommunication network (or a set of networks)The EI does not take into account the exposure induced by other RF sourcessuch as Frequency Modulation (FM) radio or digital terrestrial televisiontransmittersIt covers the exposure of a population during a given time frame in a given areaincurred by a wireless telecommunication network as a whole aggregating thedownlink exposure induced all day long by base stations and access points andthe uplink exposure incurred by individual wireless communication devices Theuplink exposure can be subdivided in exposure due to the uplink of the userrsquos owndevice and the uplink of devices operated by other users nearbyIn order to assess the realistic exposure of a population many parametersinfluencing the exposure need to be taken into account in the Exposure Indexage (adult and child exposure are different [CHLWW08] [WIART08]) posture[NAGAOKA08] usage technology environment etchellip
In a nutshell the LEXNET Exposure Index is a function transforming a highlycomplex set of data into a single parameter which has two key benefits it isunderstandable acceptable and usable for all the stakeholders from generalpublic to regulatory bodies and it is linked in a tangible way to the networkoperating parameters
The EI is built from the aggregation of individual exposure contributions generatedby a specific exposure source in specific exposure situations For instance anaveraged individual exposure generated by WiFi 24 GHz can be calculated atday time for an adult heavy-user located indoors sitting and with a tablet Thesame kind of individual exposure is estimated for other time periods RATspopulations environments usages and postures to get complete elements thatcompose the EI The individual exposure contributions are weighted according totheir representativeness before aggregationThe individual exposure is the sum of a down-link (DL) and up-link (UL)components as explained with more details in section 221
The EI is computed in a given area from the aggregation of individual exposurecontributions in a chain of exposure (see Figure 4) The nodes in this chain arerelated to different exposure sources or exposure situationsbull the time periods as the configuration of the network and type of usage depend
on the time of day (low-load night-time vs heavily loaded peak-hour)bull the population as different population categories will have different life
segmentations and different usages of wireless devicesbull the user profilebull the different locations as the exposure configurations will be different in
different environments
Document ID D26 Global Wireless Exposure Metric DefinitionFP7 Contract ndeg318273
Version V4 12Dissemination level PU
bull the radio access technologies RATs (GSM UMTS LTE WiFi etc)frequency bands and deployment layers (macro micro and femto cells) thatusers connect to
bull the posture as different body postures will lead to different absorption rates inthe human body
bull the device usage (making a phone call does not lead to the same exposure asdownloading data)
Figure 4 the LEXNET chain of exposure
Different exposure scenarios [LEXNET D23 2013] are considered and aggregatedby putting weights on each configuration thereby determining the EI A partial EI canbe for example computed for a scenario that considers only a subset of RATspopulation environment etc Then several partial EI can be aggregated with aweight related to their representativenessEI takes into account all these parameters coming both from the telecom world todescribe the accessible network environment and from data on how people segmenttheir life to describe how people are using this network
22 Mathematical formalization
221 Exposure Index Equation
The Exposure Index is calculated for a finite geographical area which can be ofurban suburban or rural type for instanceThe general formulation of the Exposure Index contains a set of technicalparameters as described below The number of values classes or settings ofeach parameter depends on the level of detail of the available data and on thelevel of achievable complexity in terms of calculation For a given geographicalarea the EI takes the following into account (see also Table 1)
the time period (t) eg day and night
Document ID D26 Global Wireless Exposure Metric DefinitionFP7 Contract ndeg318273
Version V4 13Dissemination level PU
the population (p) segmented into different categories eg children (under15 yo) young people (15-29 yo) adults (30-59 yo) and seniors (60 yoand over)
the user load profiles (l) eg heavy medium light or non-users the environment (e) eg indoor (office home) outdoor and in commuting
(bus car subway etchellip) the different available Radio Access Technologies (RATs) (r) eg 2G (900
MHz and 1800 MHz) 3G 4G WiFi the number of RATs depends on thescenario
the different cell types (c) eg macro micro pico and femto cells theaccessibility to the different cell types depends on the scenario
the posture (pos) eg sitting standing the usage (u) is described by the device (eg mobile PC laptop) and the
usage (eg voice call data)
Time PopulationUser
ProfileEnvironment RAT Cell Type Posture Usage
Day Children Heavy Indoor 2G Macro Standing Voice mobile
Night Youngpeople
Medium Outdoor 3G Micro Sitting Data mobile
Adults Light Commuting 4G Pico Data Tablet
Seniors Nonuser
WiFi Femto Data Laptopon the laps
Data Laptopon the desk
Table 1 input variables in the modelling of the EI
The individual exposure contributions rely on the SAR expressed in Wkg The SARwill depend on the device the frequency band the morphology and the posture ofthe user as well as on the position and distance of the source with respect to theuser As part of LEXNET a set of numerical dosimetric simulations are performed inorder to fill out a comprehensive matrix of raw normalized SAR values These SARvalues can be whole-body or localized SAR values Whole-body SAR values areevaluated by averaging SAR over the whole-body whereas localized SAR values arevalues focusing on a body volume specific organ or tissue Different EI can beevaluated depending on the value of interest (whole-body or localized value)Network simulation tools will provide transmitted and received power average valuesto apply to the raw SAR matrixInformation and Communication Technologies (ICT) usage data obtained throughsensors inside the network and segmentation life data will finally provide the levels toapply for the evaluation of the EI
Document ID D26 Global Wireless Exposure Metric DefinitionFP7 Contract ndeg318273
Version V4 14Dissemination level PU
SARܫܧ =1
T
tperlcpos ൫ ത
൯
ே
௨
ேೞ
௦
ேಽ
ே
ேೃ
ேಶ
ேು
ே
௧
+ RXinc + ௦ௗ௩௦ோ௦ௗ௩௦
൨
(1)
where EISAR is the Exposure Index value the average exposure of the population of
the considered geographical area over the considered time frame T SARrefers to whole-body SAR organ-specific SAR or localized SAR
N is the number of considered periods within the considered time frame (egsingle day)
N is the number of considered Population categories N is the number of considered Environments N is the number of considered Radio Access Technologies Nେ is the number of considered Cell types N is the number of considered user Load profiles N୮୭ୱ is the number of considered Postures
N is the number of considered Usages with devices Pഥଡ଼ is the mean TX power transmitted by the usersrsquo devices during the period
t in usage mode u connected to RAT r in environment e For example whenEI is computed from simulation tools the TX power can be predicted over amap that covers the whole considered geographical area and the averagevalue is extracted for the EI evaluation See details in section 223
Sത ଡ଼୧୬ୡis the mean incident power density on the human body during the periodt induced by RAT r in environment e A distribution of the incident powerdensity for the whole considered geographical area is considered and theaverage value over this area is taken into account for the EI evaluation
ோ௦ௗ௩௦ is the incident power density on the human body during the
period t induced by a wireless device connected to RAT r of a user in theproximity in environment e This term is important when the exposed personis the user itself it can also be significant for persons in the proximity of usersof a wireless device for instance in a crowded meeting room in publictransportation etc In the applications discussed in this paper this term is
neglected We also remark that ோ௦ௗ௩௦ depends on the orientation of
the user of the wireless device with respect to the body of the people in itsproximity See details in section 223
d (ௐ ௦
) ௦ௗ௩௦ (
ௐ ௦
ௐ
మ) and dୈ (ௐ ௦
ௐ
మ ) are the normalised
raw dose values for UL the DL from the user in the proximity and DL frombase stations and access points respectively all multiplied by the time spentin the configuration See details in section 222
Document ID D26 Global Wireless Exposure Metric DefinitionFP7 Contract ndeg318273
Version V4 15Dissemination level PU
f୲୮ ୪ୡ୮୭ୱ is the fraction of the total population that corresponds to population
category p user load profile l in posture pos connected to RAT r for a celltype c in environment e during the time period t
In the following we explain the different terms used in the EI formula in more detail
222 Coefficients and
The coefficient is associated to the exposure induced by the uplink andexpressed as an absorbed dose normalised to a transmitted power of 1 W
[ୱ୩
]
=௧௨௦[ୱ]ܦ
௨௦[ܣ ୩]
[ ]
Ws
kgW൨ (2)
where ௧௨௦ܦ
is the time duration of usage ݑ and a user profile load when
connected to the RAT ݎ operating in cell type in the environment for thepopulation category in the posture pos during the time period of the day ݐ
ௌோೠೞ
ಽ
can be the whole body or an organ-specific or tissue-specific
valueܣ for the usage ݑ and the posture pos in the frequency band of theRAT ݎ and the population category calculated for an incident emitted power
of
and normalized to this power
The coefficient is associated to the exposure induced by the downlink and alsoexpressed as an absorbed dose normalised to an incident power density of 1 Wm2
[ୱ୩
]
=௧௦[ୱ]ܦ
௦[ܣ ୩]
RX[W]inc
ݏ
ଶ ൨ (3)
where ௧௦ܦ
is the time duration of posture ݏ when connected to the RAT ݎ
operating in cell type in the environment for the population during thetime period of the day ݐ
ௌோೞ
ವಽ
ௌೃ can be the whole body or an organ-specific or tissue-specific
valueܣ induced by the base station or access points of the RAT ݎ in thepopulation for the posture ݏ normalized to the received power density
ோ
223 Transmitted power ഥ and received power density ത ܖ
ത is the average power transmitted by the device in busy mode (in active
communication) It should be noted that even in idle mode (not for activecommunication) the devices transmit from time to time some power (to stay
Document ID D26 Global Wireless Exposure Metric DefinitionFP7 Contract ndeg318273
Version V4 16Dissemination level PU
synchronized with the network for example) but the exposure induced by the devicein idle mode is negligible as it is based on rare eventsSത୧୬ୡ is the average power density incident on the human body from the base stationsor access points of the RAT The incident power density is assessed not only forusers of mobile devices but also for non-users It is assumed that the usage patternof the user considered in the EI formula does not influence the average incidentpower density From a theoretical point of view Sത୧୬ୡ is the average incident powerdensity integrated over all the frequency bands of the RAT and cell type consideredFrom a practical point of view Sത୧୬ୡ can be assessed directly from spectrum analyzer(SA) measurements dosimeters simulations and indirectly from the received poweron a user device or in a drive test measurementത and Sത୧୬ୡ average out the instantaneous variations of the transmitted power and
incident power density that arise during a communication These variations occurwhen the user is static or moving over a very small distance and are caused bydifferent phenomenas (power regulation small-scale fading resource allocation usertraffic variations etc) Values that will be used in the EI evaluation are averagedvalues over the whole considered geographical area
For both the evaluation of the DL incident power density and UL transmitted powerthe ressource allocation or duty cycle of the system has to be taken into account TheEI computation does not rely on maximum allowed power values (as in existing EMFexposure procedures) but on the incident and transmitted powers that respectivelydepend on the DL network and UL user resource load This definition leads to anestimate of the UL transmitted power that necessarily depend on the type of usertraffic (eg voice web browsing file upload etc) the higher is the instantaneous ULthroughput during the communication the higher is generally the UL transmittedpower
224 Index computation data sources
The EI evaluation relies on the collection of a wide range of data from simulationtools literature models and measurement equipments that will be demonstrated inthe LEXNET technical work-packages All the input data that were collected and areused in the framework of the project will be stored in an internal document
For life segmentation data in particular up-to-date life segmentation surveyscollected in the different participated countries were used to extract information onhow different categories of population segment their daily lifes (see Table 2)[INSEE11] [ALIAGA06]
Populationcategory
Day (8 AM-6 PM) Night (6 PM- 8AM)
Indoor(office-school-home)
Outdoor
Transportation (bus car
subwayetchellip)
Indoor(home)
Outdoor
Transportation (bus car
subwayetchellip)
Adults8h15
(825)1h10
(115)35 min
(6)13h05 min
(935)20 min(25)
35 min(4)
Document ID D26 Global Wireless Exposure Metric DefinitionFP7 Contract ndeg318273
Version V4 17Dissemination level PU
Youngpeople
8h20(83)
1h10(115)
30 min(55)
13h10 min(94)
20 min(25)
30 min(35)
Children8h15
(825)1h30 (15
)
15 min(25)
13h45 min(985)
0 min
(0 )
15 min(15)
Seniors7h35(70)
2h10(275)
15 min(25)
13h05 min(935)
40 min(5)
15 min(15)
Table 2 Life segmentation inputs for evaluation of the Exposure Index
ICT Usage data (usage of mobile phones for voice call or data usage of tabletsPChellip) are obtained through measurements of Key Performance Indicators (KPIs) bysensors inside the network KPIs of interest for evaluating the EI are for each userthe uplink and downlink data traffic volumes the number of voice calls the durationof each voice call etchellip The network operators involved in the LEXNET project ieOrange (France) and Telekom Serbia (Serbia) as well as the operators fromMontenegro being partners of University of Montenegro provided such data
3G denseurban
Voice Data (82 DL 18 UL)
tcom (s) volULdata [kB] volDLdata [kB]
Heavy user
Day 841 4948 25124
Night 689 5879 31922
Medium user
Day 147 464 2390
Night 86 387 2001
Light user
Day 26 35 158
Night 16 28 124
Table 3 shows usage data that could be derived from KPIs obtained throughmeasurements in a 3G network
3G denseurban
Voice Data (82 DL 18 UL)
tcom (s) volULdata [kB] volDLdata [kB]
Heavy user
Day 841 4948 25124
Night 689 5879 31922
Medium user
Day 147 464 2390
Night 86 387 2001
Light user
Day 26 35 158
Document ID D26 Global Wireless Exposure Metric DefinitionFP7 Contract ndeg318273
Version V4 18Dissemination level PU
Night 16 28 124Table 3 Average communication durations and data traffic volumes per user profile for a 3G
dense urban network
Reference SAR data were computed using 3D electromagnetic simulation platformsbased on the Finite Difference Time Domain (FDTD) method [TAFLOVE00] SARvalues were calculated for far-field and near-field exposure for two anatomical humanbody models of the Virtual Family [CHRIST10] Duke a 34-year-old male and Earthaan 8-year-old girl Two postures (standing and sitting) and three usages (mobilephone close to the head mobile phone or tablet for data and laptop usage) wereselected More details on numerical simulations can be found in [LEXNET IR212013]Table 4 shows the matrix of raw whole body averaged ௨௦ܣ
values induced in
an adult for a mobile phone usage the same table exists for other usages and forchild exposure
p=adult u=MOBILES
r=Frequency Band
Usage u400MHz
band (LTE)900MHz band(GSM UMTS
LTE)
1800-1940MHzband
(GSM 3G LTE)
24-26GHz(WiFi LTE)
Sitting Data 00078 00056 00016 73E-04Voice X 0012 00052 00047
Standing Data 0003 00049 319E-04 21E-05Voice X 0012 00052 00053
Table 4 Values of normalized whole-body ܛܗܘܝܚܘۯۺ induced in an adult by near sources
(mobiles laptops tablets) in different postures (all the values are given in Wkg and were
normalized to ] ]
= )
Table 5 shows the matrix of raw whole body averaged ௦ܣ values induced in an
adult by far field sources the same table exists for child exposure
p=adult r=Base station antennas (plane waves)
u=usage 400MHz band(LTE)
900MHz band(GSM UMTS
LTE)
1800-1940MHzband
(GSM UMTSLTE)
26GHz band(LTE)
Sitting 00050 00056 00043 00039Standing 00064 00052 00046 00042
Table 5 Values of normalized whole body ܛܗܘܚܘۯۺ۲ induced in adult by far and intermediate
sources (base stations and access points) (all the values are given in Wkg and were
normalized to RX[W]inc
= 1 Wm-2
)
It is worth pointing out that the aforementioned exposure index EI is defined on thebasis of the whole body averaged SAR But a local EI could be also derived fromlocal or tissue-specific SAR values
Document ID D26 Global Wireless Exposure Metric DefinitionFP7 Contract ndeg318273
Version V4 19Dissemination level PU
Last main data required to evaluate the EI are the average DL power density and ULtransmitted power They can be predicted from wireless network planning tools network monitoring tools or dosimeter The predictions or measurements collect awide range data at different locations within the study area for different periods oftime and possibly for different usages in order to derive relevant average valuesTwo types of dosimeters are designed in LEXNET wearable and fixed dosimeterslsquoIn sitursquo measurements were executed close to the end-user body thanks to thewearable version of the dosimeter Fixed dosimeters are being deployed in a densesensors network of a lsquosmartrsquo city More information on the LEXNET measurementtools is available in [LEXNET D61] and on the related assessment methodologies in[LEXNET D33]
23 Variability and uncertainty
The exposure index is the output of an analytical model expressed by the equation(1) with a number of uncertain input variables To propagate the uncertaintyassociated to the input variables in the model the first step consists in characterizingthe distribution of input variables Each uncertain variable input will be described by astatistical distributionThe uncertainties of the life segmentation data will be analyzed and modelled usingcomputable functions such as Gamma Gaussian or uniform distributionsUncertainties on the time use structure on an average day the usage segmentationand the average durations of usage will be characterizedAverage DL power density and UL transmitted power are estimated using specificconfigurations environments and usages The downlink power absorbed by the userand the uplink power emitted by the device (and so partially absorbed by the user)depend on these configurations environments and usages Their statisticaldistributions have to be characterized in order to be incorporated in the total EIstatistical uncertaintyA sensitivity analysis is ongoing in order to determine the most important parametersin the EI equation and how we could simplify the EI formula We are using Polynomialchaos and copulas for modelling of dependant parameters All the results onvariability and uncertainties will be available at the end of the LEXNET project indeliverable D28
The uplink exposure characterization requires a precise modeling of the poweremitted by the device Usually this exposure will depend on two parameters theposition of the personal device relative to the user body and the variation in spatialdistribution of the antenna gain due to the induced coupling effects The impact of thepositioning of the wireless device has been investigated by varying the position ofpersonal device with respect to the body Results have shown that the whole-bodySAR is not very sensitive to the device positionTo investigate the impact of the antenna gain on the variability of the emitted powerwe have used a statistical model of propagation channel [IST]Two propagation scenarios have been tested line of sight (LOS) and non-line ofsight (NLOS) For both scenarios we considered a lognormal distribution for theemitted power with a coefficient of variation up to 120 in the case of LOS and up to57 in the case of NLOS when studying the case of mobile phone emitting at 900MHz frequency This lognormal distribution characterizes the variability of the power
Document ID D26 Global Wireless Exposure Metric DefinitionFP7 Contract ndeg318273
Version V4 20Dissemination level PU
emitted versus the antenna gain Firstly we are assuming that the communication ismade via a single path namely LOS Assuming that the user can change randomlyits orientation with respect to the receiver antenna (eg base station) the antennagain in the LOS direction will also change depending on the user orientation Tomaintain a same control power (assumed fixed by the base station to ensure asuccessful decoding) the product of the emitted power to the antenna gain in LOSdirection should be a constant namely 1 mW in our analysis In the same spirit wehave analyzed the NLOS scenario by adding secondary paths The characterizationof the power emitted allows estimating the related exposure using the proportionalrelationship Figure 5 presents the cumulative distribution function of the poweremitted by the mobile phone when the average power required by the base stationoutside the small sphere surrounding the transmitter system (user + mobile phone) iskept to 1 mW
Figure 5 Cumulative distribution function (CDF) of the power emitted by the mobile phone (at 900MHz) obtained with both propagation scenarios (LOS and NLOS)
We could notice that the power emitted is very sensitive to the spatial distribution ofthe antenna gain especially in the case of LOS
The downlink exposure is very sensitive to the propagation environment[KALLIOLA02] [KIENTEGA11] Many physical obstacles (such as tunnels andbuildings) between the transmitter and receiver can affect the characteristics of theambient electric field This latter depends on many parameters such as the number ofwave components (due to the reflections and diffractions undergone by the originalwave radio) the fluctuations of the wave amplitude its phases and arrival angles Inthe literature several studies focused on the modeling of the electromagneticenvironment in realistic conditions by giving the statistics distributions of all of theseparameters [KALLIOLA02] [ZHAO02] [WINNER D112 2007] Based on the modelsproposed by these studies we simulated a downlink exposure induced by a realisticpropagation environment Figure 6 shows the variations of the whole body SARinduced by a single plane wave at 900 MHz
Document ID D26 Global Wireless Exposure Metric DefinitionFP7 Contract ndeg318273
Version V4 21Dissemination level PU
Figure 6 Variation of the exposure induced by a single plane wave (LOS) at 900 MHz for differentpolarization (horizontalH verticalV)
Other sources of uncertainties exist as the information on the network wirelessinfrastructure (eg the base station antenna location and orientation) the userequipment performance the Prediction errors (propagation UL power control modeletchellip) some being discussed in [D33 section 231] or measurement discretization(eg with a limited number of fixed dosimeters [D33 section 26])
3 HOW TO USE THE INDEX OF EXPOSURE
The synthetic index which is presented above aims at gathering all contributions tothe population EMF exposure induced by wireless communication networks By itselfbuilding such an index is already a challenging goal but LEXNET goes beyond thedefinition of the EI since it seeks reducing the exposure by exploring innovativetechniques at the lower (mainly PHY level) or upper layers (network level andresource management)
However a general formulation of the EI is given in this document the EI needs to beslightly adapted to the particular characteristics of each technique evaluationscenario The basic idea is that each of the proposed techniques would probablyfocus on a particular parameter and most likely on a single scenario Proposedtechniques could therefore be evaluated by using a partial EI Hence their benefitswould be specific to the characteristics of the selected use case and their impact overthe overall EI would need to be adjusted accordingly A reference scenario detailedbelow has been defined in order for all the proposed reducing solutions to be testedon one unique global scenario
31 Reference scenario
One reference global scenario will be used as a starting point scenario by LEXNETtechnical work-packages (WP 4 5 and 6) to evaluate the EI ldquobeforerdquo implementationof LEXNET exposure-minimization techniques
Document ID D26 Global Wireless Exposure Metric DefinitionFP7 Contract ndeg318273
Version V4 22Dissemination level PU
Parameter Value
Time periods Day Night
Population Adult children
Load profiles Heavy moderate light and non user
Environments Outdoor indoor commuting
RATsCellTypes
Type 2G 3G 4G WiFi
Cell size Variable (mainly depends on theenvironment)
Cell type Macro
User
Usage Voice data
Equipment Smartphone tablet Laptop (dongle)
Posture Standing sitting
The EI will be evaluated for this specific scenario using life segmentation usage andSAR data introduced in the previous chapterThen each partner will be free to test their minimizing solutions on this scenario andto calculate an EI ldquoafterrdquo LEXNETScenarios for each RAT can be simulated separately and percentages of mobiletraffic per RAT can be afterwards used as input for the EI (see Figure 7) It can beenvisaged that modifying these percentages could be one network managementsolution for reducing the EI assuming in a first approximation that the traffic per RAThas no strong influence on the RAT exposure metrics which is not completely right
Figure 7 Connections by RAT [CISCO13]
Document ID D26 Global Wireless Exposure Metric DefinitionFP7 Contract ndeg318273
Version V4 23Dissemination level PU
32 Reducing the EMF exposure using the EI
321 Lower layer solutions a common methodology to use the EI
The EI is a relevant global metric for evaluation of radio technologies performances interm of exposure reduction However WP4 has identified some difficulties to directlyaddress the global calculation To reach this global evaluation target WP4 hasadopted a specific and indirect methodology described in [LEXNET D42 2014]deliverable and synthesised in the following Despite a large diversity of technicaldomains whatever the scenario or the Radio Access Technologies (RAT) a singlestrategy to organize and align the different WP4 exposure evaluations is proposed Afive steps methodology has been established in order to evaluate and harmonize theoverall exposure improvement for each technology These steps also attempt toprovide the basis for future global exposure reduction evaluation in order todetermine the most promising WP4 techniques based on fair and relevantcomparisons
The first step is to identify how the individual WP4 techniques contribute towards theoverall LEXNET use case scenarios from WP2 Specifically for WP4 evaluations foursub-scenarios have been introduced (Macro-Cell Small-Cell Rural and WSN ampWiFi) (Step-1a) This sub-scenario categorization highlights which solutions arecomplementary and which will require further analysis to determine potential conflictsIn order to harmonize the evaluations from the studies of different solutions it iscrucial to describe properly and extensively each assumption and the inputparameters values related to the context study (Step-1b)
A limited numbers of Key Performances Indicators (KPI) for the exposure and for theQoS are used in the evaluation of each WP4 technique The step-2 has to clearlyidentify the KPIs being addressed by individual technique exploration It is taken asmore convenient to work with one of the following three simpler metrics or KPIsderived from the EI formula and addressing UL exposure
The first metric is the Specific Absorption Rate (SAR l mTx ) which describes the
amount of EM energy absorbed into the userrsquos body via the spatial distributionof the EM field from the source Thus SAR is particularly relevant for antennasolutions
The second metric is the mean duration of exposure (UL
kjit ) which indicatesthe amount of time the user is exposed It impacts the EI which is defined as adose For example the duration is impacted by the amount of transmitted dataReduced retransmission improved interference management and signalingreduction strategies are all ways of decreasing this metric The duration usedto calculate the mean is selected regarding the time constant of the studiedtechnique
The third metric is the mean transmitted power ( TxP ) during the considered
mean exposure duration As an example a 1 dB improvement on the receivingsensitivity at the Base Station (BS) could be converted in a 1 dB reduction ofthe transmit power at the User Equipment (UE) Again the duration used tocalculate the mean is selected regarding the time constant of the studiedtechnique
Document ID D26 Global Wireless Exposure Metric DefinitionFP7 Contract ndeg318273
Version V4 24Dissemination level PU
Notice that an equivalent set of three metrics adresses the DL
The step-3 concerns the evaluation itself of a partial EI ratio in comparison with abaseline scenario that is to say without implementing the studied solution Theexposure reduction is evaluated through the calculation of an EI ratio by comparingthe lsquoafter LEXNETrsquo versus the lsquobefore LEXNETrsquo (ie SotA or standard) baselineconfigurations (Eq 4) The main advantage of the proposed approach is that in mostof the presented solutions the three KPIs are independent from each other Byconsidering a given sub-scenario and depending whether the UL or the DL is studiedthis means that if a solution succeeds in decreasing the selected single KPI the twoothers will stay constant when the solution is implemented or not Thus in thatspecific sub-scenario the EI ratio is equal to the selected KPI ratio (Eq 5) Thisexposure metric is easily matched with a typical RF front-end or PHY layer evaluationstudies
(4)
This formula is simplified when a specific sub-scenario is considered
(5)
Where
partialEI is the Exposure Index for a specific sub-scenario
partialKPI is the identified metric among the three detailed in step 2
the subscript lsquow LEXrsquo correspond to the Lexnet solution implementationthe subscript lsquowo LEXrsquo correspond to the SotA or baseline (without the solutionimplementation)
Meanwhile the selected QoS metric is also evaluated with and without LEXNETsolution
The step-4 aims to ensure that capacity or QoS improvements are converted intoexposure reduction It is worth reminding that the objective of LEXNET studies is toreduce exposure without impacting QoS
At last the step-5 estimates the absolute global EI reduction from the previous stepsrsquopartial EI results throught the 24 hours LEXNET reference scenario The so-calleddilution factor [LEXNET D41 2013] is taken into account during this step-5 Theusage statistics from WP2 are used to weight the calculated partial EI reduction inorder to assess the global EI reduction for a given solution
To conclude a scheme summarizes the WP4 common EI evaluation methodology inFigure 8 This process is sufficiently generic to be applied by any of the WP4proposed solutions and examples of its step by step application can be found in[LEXNET D42 2014]
100LEXwoEI
LEXwoEI-LEXwEI()Ratio
partial
partialpartial
EI
100LEXwoKPI
LEXwoKPI-LEXwKPI()Ratio
partial
partialpartial
EI
Document ID D26 Global Wireless Exposure Metric DefinitionFP7 Contract ndeg318273
Version V4 25Dissemination level PU
Figure 8 Common EI evaluation methodology for WP4 techniques
322 Upper layer and resource management techniques
By introducing and promoting the EI as a new planning metric LEXNET intendsamong other objectives to help reduce local town planning objections to applicationsfor installing new base stations Work carried out by LEXNET WP5 so far hasdemonstrated that real-time EMF-aware network management strategies depend oncurrent traffic load radio conditions mobility application used and the duration ofuse available networks and UE capabilities Since EI calculations take into accountlong-term network statistics distributions of user profiles and habits (services usedetc) times of day period of year etc EI itself may therefore be better suited for initialnetwork design and AP placement while other metrics may be better suited for real-
Document ID D26 Global Wireless Exposure Metric DefinitionFP7 Contract ndeg318273
Version V4 26Dissemination level PU
time EMF management Clearly a link between these proxy-metrics and long-term EIvalues is needed The underlying assumption is that if we try to reduce the level ofEMF by applying correct general policies and additionally control it on a smaller time-scale (eg seconds or minutes) with fast-loop control then the overall exposure andthe EI (defined on daily level) will decreaseFast-loop (event-based) EMF control would be a response to a temporary change ofconditions This kind of control requires triggers ie thresholds that can be assessedon near-real-time scale ndash this time scale may not be as granular as for power controlFor fast-loop control offload techniques may be used as for general strategy butalso other strategies such as changing codecs delaying transmission etc Fast-loopcontrol without using triggers would be periodic optimization on a smaller time-scaleProxy metrics to be used for fast-loop control involve data that may be collected fromthe network and include
bull Measurements (UL Tx power RSSI RSCPhellip)
bull User context velocity services used profile
bull Statistics cell statistics (traffic load) etc
Some preliminary results using various proxy metrics which illustrate the pointsabove are shown hereFigure 9 shows live network measurements illustrating that available cellulartechnologies and current traffic conditions are two of the main points to be taken intoaccount when designing low-EMF solutions The metric used here is the UL Txpower The same metric is used in Figure 10 and Figure 11 which show that the typeof service could increase the exposure (based on UL Tx power) meaning thatdifferent strategies should be used to identify the best connectivity according to theservice flow requested The actual UL Tx power values can then be used in EIcalculations
Figure 9 Comparison of different 2G3G cells in high load hours by UE Tx power
Document ID D26 Global Wireless Exposure Metric DefinitionFP7 Contract ndeg318273
Version V4 27Dissemination level PU
Figure 10 Comparison of UL FTP and voice services over 2G3G cells in high load hours by UE Txpower
Figure 11 Comparison of voice service over 3G and voice service using Skype over 3G network
Another common proxy with direct link to EI is the DL power density Figure 12 showshow DL power density and UL transmit power vary for different ISD values in an LTEnetwork Based on these simulations it can be seen that small-cell densification inurban areas allows for significant exposure reduction which now needs to betranslated into the EI using various assumptions on user distributions and type ofusage
Document ID D26 Global Wireless Exposure Metric DefinitionFP7 Contract ndeg318273
Version V4 28Dissemination level PU
Figure 12 DL power density and UL transmit power for different ISD values
Whole-body SAR is another proxy metric whose statistical processing can leaddirectly to EI calculations As an example of SAR values obtained by a tooldeveloped for the prediction of whole-body and localized SARs and absorbed dosesfor indoor wireless network deployments in Figure 13 we show distributions for thetraditional deployment (top) and for the WP5 exposure-optimized deployment
Figure 13 Whole-body SAR_DL (distribution for the traditional deployment (top) and for the exposure-optimized deployment (bottom)
Document ID D26 Global Wireless Exposure Metric DefinitionFP7 Contract ndeg318273
Version V4 29Dissemination level PU
4 EXAMPLES OF APPLICATION
41 Computing chain
In this section three simplified examples of EI computation are detailed In no casethese examples are representing the completeness of the possibilities that can becover by the EI but they illustrate the process of computation
The first two examples illustrate the use of network planning tools in the evaluation ofthe EIThe first example detailed in the section 42 consists in comparing two indoor officescenarios first with wireless communication offered by only 3G outdoor macro basestations scenario and secondly with an additional 3G femtocell (Table 6)
Scenario 1
Time PopulationUser
ProfileEnvironment RAT Cell Type Posture Usage
1h inthe
afternoon
Adults Heavy Indoor 3G Macro Standing Voice mobile
Medium Datamobile
Light Data Tablet
Nonuser
Data Laptop
Scenario 2
Time PopulationUser
ProfileEnvironment RAT Cell Type Posture Usage
1h inthe
afternoon
Adults Heavy Indoor 3G Femto Standing Voice mobile
Medium Datamobile
Light Data Tablet
Nonuser
Data Laptop
Table 6 input variables for the 3G indoor sub-scenarios described in section 42
The second example detailed in section 43 is considering a data LTE macro urbanscenario (Table 7)
Time PopulationUser
ProfileEnvironment RAT Cell Type Posture Usage
Day Youngpeople
Moderate Indoor 4G Macro Standing Data mobile
Document ID D26 Global Wireless Exposure Metric DefinitionFP7 Contract ndeg318273
Version V4 30Dissemination level PU
Night Adults Non user Outdoor Sitting Data mobile
Seniors Data Tablet
Table 7 input variables for the LTE scenario described in section 43
The last example detailed in section 44 illustrates the use of dosimetermeasurements in the EI evaluation It is considering a macro outdoor LTE scenariowhere one user is wearing a dosimeter
42 Indoor exposure from 3G macro and femto-cells
The EI was evaluated for two scenarios considering the exposure of people locatedindoor The population consisted of adults making UMTS (phone calls with thephone on the right side of the head The scenario 1 is considering a macrocellconnection and the scenario 2 an indoor small cell connection Different user profilesare considered
10 heavy users 30 s usage 50 moderate users 10 s usage 25 light users 3 s usage 15 no usage 0 s usage
For the calculation of the EI several input parameters are needed reference SARvalues averaged transmitted power valuesത and averaged incident power densityvalues inc (see Table 8)The power (density) values that were used for the indoor macrocell scenario arederived from measurements in an office building (Zuiderpoort building GhentBelgium) [PLETS14] Figure 14 shows the considered buildingFor the indoor femtocell scenario accurate power (density) values from the WHIPPtool a heuristic indoor network calculator and planner [PLETS12] were used In theconsidered building a femtocell with an Equivalent Isotropically Radiated Power(EIRP) of 7 dBm is installed A different femtocell EIRP can lead to a largely differentEI Reference SAR values were taken from [LAUER13] and applied to the scenariosfor an adult standing using the phone on the right side of the head Since the
measured macrocell values (RXinc and Pഥଡ଼) were not recorded in the smaller andmore enclosed central areas of the building floor (toilets kitchen shedhellip) femtocellpredictions were limited to the non-shaded areas around the center in Figure 14 Forthe femtocell values locations within 50 cm of the base station are discardedassuming that people stay at least half a meter away from base stations For thesimulations a sub-scenario is also considered for which a 20 dB worse macrocellconnection is assumed for the same building floor This could correspond to abuilding with a penetration loss that is 20 dB higher than before or a building which islocated further from the macrocell base station (path loss increase of 20 dB) Table 8
shows that the assumed Pഥଡ଼ RXinc values in case of a lsquoworse connectionrsquo areindeed 20 dB higher lower
Document ID D26 Global Wireless Exposure Metric DefinitionFP7 Contract ndeg318273
Version V4 31Dissemination level PU
Figure 14 Ground plan of the considered floor (90 m x 17 m) of the office building that is simulatedFemtocell base station location is indicated with purple hexagon
Scenario 1Macro indoor
Scenario 2Femto indoor
௨ܣ 0003 Wkg 0003 Wkg
௨ܣ 000495 Wkg 000495 Wkg
ത 26610-5 W 28510-7 W
ത(worse connection) 26610-3 W 28510-7 W
RXinc81510-8 Wmsup2 51810-6 Wmsup2
RXinc(worse connection) 81510-10 Wmsup2 51810-6 Wmsup2
Table 8 Reference SAR values and average transmitted power and observed power densityvalues
In the following the results for the different indoor scenarios are discussedFigure 15 (a) compares the EI for scenarios 1 and 2 for the indoor office buildingFrom an exposure-point-of-view the indoor femtocell scenario (scenario 2 EI =158E-8 Wkg) is a factor 28 worse than the indoor macrocell scenario (scenario 1 EI= 564E-10 Wkg) The main EI contribution in scenario 2 is the high DL exposureoriginating from the femtocell (155E-8 Wkg) The scale in Figure 15 (a) has beenadjusted the bar that represents the DL femto indoor contribution is in reality 44times the length of the Y-scaleThere are several reasons why the installation of a femtocell is not beneficial in thiscaseA first reason is that the EI contributions of the macrocell are almost equal for UL andDL which is optimalA second reason is that the femtocell EIRP is chosen quite high (7 dBm) despite thegood macrocell connection (average value of -6925 dBm) still 77 of the DL fieldsare higher in the femtocell caseA third reason is that a femtocell installation has the disadvantage that observedpower densities on a building floor due to a femtocell base station are lesshomogeneously distributed than fields due to a (more distant) macrocell base stationAs people are assumed to ndash on average- reside an equal time at each location on thebuilding floor (except shaded areas and locations closer than 50 cm from the BS)locations close to the femtocell contribute a lot to the EI When people approach afemtocell the absorbed exposure dose increases in a more-than-linear wayMacrocell base stations have the advantage that ULDL fields are morehomogeneously distributed over the building floor It should also be noted that thehigher the UL usage the more the femtocell scenario will benefit compared to themacrocell scenario (lower EI) However in the considered case the UL usage timeswould have to increase by a factor 48 to yield a total EI (macrocell scenario 1) that isequal to the EI of scenario 2 (femtocell scenario EI = 158E-8 Wkg)
Document ID D26 Global Wireless Exposure Metric DefinitionFP7 Contract ndeg318273
Version V4 32Dissemination level PU
We also studied a second case where a less favourable macrocell case isconsidered (lsquoworse connectionrdquo) It is assumed that the connection with the macrocellbase station is now 20 dB worse than in the previous case Figure 15 (b) comparesthe EI for the macrocell and femtocell deployments Due to the worse connection(average received macrocell DL power of -8925 dBm) the macrocell EI is nowcompletely determined by the UL contribution (320E-8 Wkg) and the femtocellscenario (scenario 2 EI = 155E-8 Wkg) has an EI that is 48 of the macrocell EIwhich makes it preferable over the macrocell deployment Moreover the observedpower densities due to the femtocell are higher than the macrocell power densities atall locations (better QoS)It can be concluded that the installation of femtocell is not always recommended forshorter UL usage times andor better macrocell connection qualities it could beadvised to rely on the existing macrocell infrastructure Also when installing afemtocell its EIRP should be adjusted to the size and physical properties of thebuilding and should not be set at a needlessly high value
(a) (b)Figure 15 Comparison of the contributions to the whole-body EI for (a) indoor scenarios 1 and 2 in theconsidered building (b) indoor scenarios 1 and 2 in this building with 20 dB worse connection qualityTotal EI levels for each scenario are indicated with the horizontal line EI values are shown in Wkg
43 Data LTE macro urban scenario
431 Input variables linked to the network
The EI is evaluated from a macro-cellular LTE network in a real geographical area ndashpart of the 7th district of Paris (see Figure 16) The proposed scenario was previouslydefined in frame of the French ANR project ECOSCells [BCL12] and the EuropeanFP7 project FREEDOM (httpwwwict-freedomeu) for the simulation and analysis ofheterogeneous network topologies (hetNet) It is based on a real environment usingHigh Resolution (HR) map data realistic BSUE deployments and deterministicpropagation models
The macro layout is organized as three rings around a central three-sector sitemacro base stations being deployed with an inter-site distance of about 450 m in ahexagonal manner as shown in Figure 16
Document ID D26 Global Wireless Exposure Metric DefinitionFP7 Contract ndeg318273
Version V4 33Dissemination level PU
Figure 16 View of the macro-cell hexagonal deployment in the area
The study area (ie area where network performance is evaluated) is limited to thesurface covered by the three co-located central macro-cells and the first ring (Figure17) Thus the study area is equivalent to 12 macro-cells The base stations outsidethis study area are included in simulations to generate an accurate interferencepattern
Figure 17 Study area composed of 12 macro sites localised in the 7th
district of Paris France
Document ID D26 Global Wireless Exposure Metric DefinitionFP7 Contract ndeg318273
Version V4 34Dissemination level PU
The positions and heights of the base stations have been selected in realisticapproach sites are placed on slightly dominant rooftops and sector antennas aredistributed at the rooftop edges Directive antennas are used (with 3GPP radiationpattern) Each site is composed of three sectors oriented in azimuth directions 0deg120deg and 240deg with down-tilt 6degUsers are assumed to be uniformly distributed in the study area an indoor ratio setsthe percentage of users located inside buildings at the ground floorThe specifications of input parameters are summed up in Table 9
Environment Typical European Dense Urban environment (Paris VII district France)
System
Downlink (DL) and Uplink (UL)
LTE FDD 2 x 10 MHz
Central frequency 2600 MHz
Macro layout
Hexagonal sitedeployment
37 sites corresponding to 83 macro cellsincluding 12 sites in the center of the studyarea Inter-site distance (ISD) of 450 m
Nominal transmitpowerEPRE
40 W 228 dBm
AntennaDirectional with 14 dBi gain 6deg electric down-tilt 2 antennassector Average antennaheight 30 m above ground
Noise figure 25 dB
UL power control (openloop)
Path loss compensation factor 1SINR target 208 dB
UserEquipment
MaxMin transmit power 23 dBm -40 dBm
AntennaOmni-directional with 0 dBi gain 2antennasuser device Antenna height 15 mabove ground
Noise figure 9 dB
User traffic
Average active userdensity
Depends on daynight
DistributionUniform spatial distribution within thesimulation area Single floor (at 15 m height)No user mobility
Table 9 Inputs in SIRADEL simulator
432 Input variables linked to the population
Category of population
The population density of the 7th District of Paris was estimated at 14 36050
inhabitants per kmsup2 in 2009 [Carte09]
We are considering the population above 15 years old
Given the population distribution by age (Figure 18) it was decided to divide the adult
population into 3 categories young people (between 15 and 29 years) adults
Document ID D26 Global Wireless Exposure Metric DefinitionFP7 Contract ndeg318273
Version V4 35Dissemination level PU
(between 30 and 59 years) and seniors (over 60 years) Table 10 shows the
percentages of people in each category
Figure 18 Population distribution by age in Paris 7th district in 2007
Population category Pourcentage(prop)
Adults (30-59 yo) 45
Young people (15-29 yo) 26
Seniors (+60 yo) 29
Table 10 Number of people in each population category
Time periods
A 24-hour day is divided into two periods the day from 8 am to 6 pm (10 hours in
total) and the night from 6 pm to 8 am (14 hours in total)
Environment
Time spent indoor or outdoor on an average day for each category is extracted from
Table 2
Usage
Only data traffic is considered The device is assumed to be a mobile phone whilethe user is in a standing posture Considering the existence of 4 telecom operators inFrance only 25 of the 7th district population is assumed to be using this LTE macronetwork In this example we consider two user profiles moderate user and non-userFor each population category we derived from [Bigot et al 2013] the proportions ofusers and non-users of mobile phones for data traffic (see Table 11)
User profileYoung people (15-29
yo)Adults (30-59 yo) Seniors (over 60 yo)
non-users 33 57 91
Document ID D26 Global Wireless Exposure Metric DefinitionFP7 Contract ndeg318273
Version V4 36Dissemination level PU
users 67 43 9Table 11 Repartition of users and non-users for each population category
For simplicity the parameters for the moderate user profile are applied to all userswe assume a daily data traffic per active user of 66 MB [CISCO13] a DLUL ratio of9010 (this ratio was evaluated from data collected through measurements ofKPIs by sensors inside the French Orange network) and a daynight ratio of4357 From [CISCO13] only 29 of connections in 2013 were on 4GReference SAR values were extracted from Table 4 and Table 5
433 Transmitted power ഥ and received power density ത calculationܖ
Incident ோpower densities and transmittedത powers were calculated by usingthe network planner simulation tool Volcano Suite (Siradel France)Figure 19 andFigure 20 illustrate respectively the average UE Tx power calculated over the 7thParis district during the day and the average incident power density evaluated duringthe day or the night (values during the day or the night time were quasi identical)
Figure 19 Map of the average UL Tx power (dBm) calculated indoor at ground floor and outdoorduring the day (on the left) and map of daily average transmission duration (s) (on the right)
Figure 20 Map of the average DL incident power density (dBμVm) calculated indoor at ground floor and outdoor during the day or the night
Because the average active LTE user density is very low (41 userskm2consequence of the 29 LTE connections assumption) the DL user traffic utilises
Document ID D26 Global Wireless Exposure Metric DefinitionFP7 Contract ndeg318273
Version V4 37Dissemination level PU
less than 1 of available resources which strongly impact the predicted DL incidentpower density We can see in Figure 19 (left figure) that the calculated average Txpower is minimum in outdoor areas in the vicinity of the base stations or in Line ofSight (LOS) while it is at a maximum indoors and outdoors far away from the basestations The right map in Figure 19 gives the average communication durationwhich directly impacts the calculation of the UL exposure contribution The better thelink performance is the higher the throughput and thus the longer thecommunication duration That is why the longest durations are observed indoors andparticularly in the building parts that suffer from the strongest propagation lossesFigure 20 shows that the strongest DL incident power density levels are predicted inLOS areas while much lower levels are observed inside the buildings where mostpopulation is located
434 Exposure index calculation
Aggregating everything we obtain the following value for the EI (based on the Whole-body SAR) of the over 15 years old population of the 7th district of Paris consideringa macrocell LTE network EIWBSAR = 31910 -7 Wkg
44 Using dosimeters for the EI evaluation
This section provides an evaluation of the downlink and uplink exposure indexes fora subject wearing a reference isotropic dosimeter on the head together with fivedosimeters at different locations of the body as well as two mobile terminals Thesubject is moving in a multipath environment including a 3-sector LTE base station
When modelling the radio link between the user devices and the base station oneconsiders the influence of the body (ie body coupling [MaOC12] and bodymovements (using realistic body motion capture tools [MaCo13]) and accounts forthe propagation environment using a geometrically based statistical channel (GBSC)model (ie multipath propagation) Therefore the modelling of the radio channel hasbeen separated into several steps as described in [Mack13] Figure 21
Document ID D26 Global Wireless Exposure Metric DefinitionFP7 Contract ndeg318273
Version V4 38Dissemination level PU
Figure 21 Model for EMF assessment from dosimeter data
The simulated scenario Figure 22 considers a reference isotropic dosimeter on thehead of the user (simulating the real body exposure) together with five wearabledosimeters These dosimeters allow the downlink exposure assessment The user isalso carrying two mobile terminals allowing to assess the uplink exposure
Figure 22 Placement of wearable dosimeters and mobile terminals on the body
For the downlink the received (Rx) power ோ௫ at the mobile terminal (ordosimeter) is calculated from
ோ௫[ౚ ]= ௌ[ౚ ]
minus ௧௧[ౚ]ܮ (6)
where ௌ base station (BS) transmitted (Tx) power ௧௧ܮ total path loss including gains of mobile terminal (or
dosimeter) and BS
The received power density ோ௫ at the mobile terminal (or dosimeter) iscalculated from
ோ௫ ୫ మ൧=
ோ௫[ ]
ܣ మ൧
(7)
where ܣ is the mobile terminal antenna effective area
ܣ ୫ మ൧=ଶ[ߣ ]
ߨ4ோ௫[ౚഠ]ܩതതതതതതതതത (8)
where wavelength ோ௫തതതതതܩ average gain of the receiving antenna (ie dosimeter probe) in
off body direction (eg half-hemisphere of the gain pattern ieߠ isin [minus9090]deg and isin [minus9090]deg)
ோ௫[ౚഠ]ܩതതതതതതതതത=
1
ఏఝ ோ௫[ౚ]ܩ
ߠ) )
ேക
ୀଵ
ேഇ
ୀଵ
(9)
where ఏ and number of elevation (ߠ) and azimuth () directions
The exposure index for the DL ܫܧ can be determined from [LEXNET D24 2013]
Document ID D26 Global Wireless Exposure Metric DefinitionFP7 Contract ndeg318273
Version V4 39Dissemination level PU
[୩]ܫܧ = ௪ܣ
|ଵ ୫ మ[୫ మ୩]
times ோ௫[ ୫ మ]times [ୱ]ݐ (10)
where ௪ܣ
|ଵ ୫ మ normalised whole body averaged SAR coefficient per
1 Wm2 of Rx power density as indicated in [LEXNET D24 2013] ݐ time of the exposure from BS
ோ௫ average Rx power density during period ݐ
For the uplink the required Tx power from the mobile terminal is determined from ௫[୫ ]
= ௌ[୫ ]+ ܫ ௧௧[]
+ ܯ [] + ௧௧[]ܮ (11)
where ௌ noise and interference level at the BS ܫ ௧௧ target SINR at the BS
ܯ fading margin for a dynamic usage ௧௧ܮ total path loss including gain of MT and BS
ௌ is calculated asௌ[୫ ]
= minus174[୫ ] + 10logଵ(ܤ[ୌ]) + ி[]+ []ܫ (12)
where ܤ bandwidth ி noise figure ܫ interference
The EI for the UL ܫܧ can be determined from [LEXNET D24 2013]
[୩]ܫܧ = ௪ܣ
|ଵ [ଵ୩]times ௫[ ]
times [ୱ]ݐ (13)
where ௪ܣ
|ଵ whole body averaged SAR coefficient per 1 W of Tx poweras indicated in [LEXNET D24 2013]
ݐ time of the exposure ( duration of the mobile terminal usage)
௫ average Tx power during period ݐ
A macro cell outdoor street scenario has been considered including a set of 10clusters of 3 scatterers each with a Uniform Distribution in the half space of anellipsoid A 3-sector base station antenna is located in the middle of the street atx=100 m The user is moving on a straight line in the middle of the street (ie y=10m xisin[50 150] m) Figure 23
Document ID D26 Global Wireless Exposure Metric DefinitionFP7 Contract ndeg318273
Version V4 40Dissemination level PU
Figure 23 Scenario
The parameters of the scenario are presented in Table 12 being worthwhile to noticethat the values of ௪ܣ
and ௪ܣ are taken from preliminary SAR simulations The
calculated noise and interference level at the BS is ௌ= -12774 dBm
System
Frequency [MHz] 2600
[HoTo11]ܤ
Resource Block [kHz] 15
Full [MHz] 20
Full LTE-A [MHz] 100
Downlink
EIRP BS Tx power [dBm] 46 [LEXNET D23 2013]
ோ௫ܩ [dBi] 122 [LEXNET D32 2014]
ݓܣ|ܮܦ
1Wm2[m2kg] 300
Uplink
ܫ ௧௧[dB] 208 [HoTo11]
ி [dB] 25 [LEXNET D23 2013]
[dB]ܫ 8 [HoTo11]
ܯ [dB] 30 [Mack13]
ݓܣ|ܮ
1W[1kg] 495
Table 12 Scenario overview
Figure 24 illustrates the considered macro cell base station antenna and thedosimeter realised gain patterns
(a) BS with 3 sectors (b) Dosimeter on the bodyFigure 24 Realised gain pattern
Document ID D26 Global Wireless Exposure Metric DefinitionFP7 Contract ndeg318273
Version V4 41Dissemination level PU
441 EI for downlink
The average Rx power density obtained from the isotropic reference probe and thedosimeter located at WA_L and WA_R is presented in Figure 25 The received powerdensity at WA_L dosimeter is very similar to the one gathered at the isotropic probewhich mainly comes from the similar Line-Of-Sight (LOS) propagation conditions Thepower received in WA_R dosimeter is much lower due to the body shadowing
Figure 25 Rx power density at selected positions
The distribution of the Rx power density is presented in Figure 26 In spite of thebody shadowing the distribution of the Rx power density at the WA_R dosimeter ismuch similar to the ones for the reference and the WA_L dosimeters All of themfollow an exponential decay which should be subject to further investigation
(a) isotropic (b) WA_L (c) WA_R
Figure 26 Rx power density histograms
The received power density and the downlink exposure index calculated based onthe measurement of the dosimeters located in the various locations on the body arepresented in Table 13
ோ௫ [mWm2] ܫܧ [mJkg]
isotropic 35868 2690
WA_F 18357 1377
WA_B 29538 2215
Document ID D26 Global Wireless Exposure Metric DefinitionFP7 Contract ndeg318273
Version V4 42Dissemination level PU
WA_L 28516 2138
WA_R 9060 680
TO_F 18436 1383
Table 13 Downlink Exposure
The WA_L dosimeter and the isotropic probe exposure indexes are very similarbecause of the LOS propagation conditions The same is valid for the WA_Bdosimeter which is also in LOS with the base station For the other dosimeters theexposure index is naturally lower due to the body shadowing In this scenario theuse of a wearable dosimeter in the front or in the right side of the body displays anexposure index reading about 4 times lower than the real user exposure
442 EI for uplink
The average Tx power from the mobile phone hold near HE_L and HE_R ispresented in Figure 27 The uplink power control is clearly noticeable by the highertransmitted power in HE_R as the mobile terminal adjusts the Tx power tocompensate for the higher channel fading
Figure 27 Tx power for straight6min scenario at 2600 MHz for LTE-A
The distribution of the Tx power at HE_L and HE_R is presented in Figure 28 Inspite of the different intensities HE_L and HE_R Tx powers present a similardistribution
Document ID D26 Global Wireless Exposure Metric DefinitionFP7 Contract ndeg318273
Version V4 43Dissemination level PU
(a) HE_L (b) HE_R
Figure 28 Tx power histograms
The average transmitted power and the uplink exposure index from the mobileterminals located near left and right side of the head ( e HE_L and HE_R) arepresented in Table 14
௫ [mW] ܫܧ [mJkg]
RB FULL FULL_A RB FULL FULL_A
HE_L mobile 002 165 827 003 295 1474
HE_R mobile 008 838 4191 014 1493 7468
Table 14 Uplink Exposure
These results show the importance of the propagation conditions in the EMFexposure Due to the non LOS conditions the exposure index in the right side of thehead is 5 times higher than the one on the left side
5 CONCLUSION
In this deliverable a global metric is defined to test and optimize wirelesstelecommunication networks in terms of EMF exposureThe proposed metric called Exposure Index (EI) has the advantage to overpass thelimitations of the actual metrics that in fact are managing separately the exposureinduced by personal devices and the one induced by the network equipment (basestations and access points) But devices base station antennas and access pointsare definitely parts of the same wireless environment and the global wirelessexposure is induced by all of them
The EI is described with an analytical model with input variables describing thecoverage area of interest the accessible networks the population and the habits interms of location and of wireless devices usage The output is the EI covering theday-to-day averaged exposure of population in a given area incurred by an entirewireless network from base stations and access points to individual devices
In this deliverable the analytical model of EI has been detailed and the inputvariables defined Then the use of the EI to minimize the EMF exposure in wirelesscommunication networks is presented in connection with work-package 4 dedicated
Document ID D26 Global Wireless Exposure Metric DefinitionFP7 Contract ndeg318273
Version V4 44Dissemination level PU
to innovative radio components and work-package 5 focused on networks topologiesand technologies
The way to process a complete calculation of EI is illustrated on three deterministicexamples The first example considers comparison of indoor 3G macro and femtoscenarios The second example is taking into account an adult population in a LTEmacro urban environment with their data usage specifications Both examples arebased on a real environment representation and network simulation tools have beenused to simulate the up and down links The third example illustrates how dosimetermeasurements can be used to assess the EI
In our further work the statistical description of input variables will enable topropagate the variability and the uncertainty in the EI model making it more accurateand reliable Results will be made available in the future deliverable D28 DeliverableD33 will detail the used methodology to assess the EI and for the last year of theproject the work of partners involved in WP6 will be enhanced as they will be incharge of the implementation and evaluation of the EI
Document ID D26 Global Wireless Exposure Metric DefinitionFP7 Contract ndeg318273
Version V4 45Dissemination level PU
6 REFERENCES
[ALIAGA06] Aliaga C How is the time of women and men distributed
in Europe Statistics in focus population and social
conditions April 2006
[APVJM13] Aerts S Plets D Verloock L Joseph W and MartensL Assessment and comparison of RF-EMF exposure infemtocell and macrocell scenarios Radiat Protec Dosim2013
[BCL12] Brau M Corre Y Lostanlen Y Assessment of 3D
network coverage performance from dense small-cell LTE
Communications (ICC) 2012 IEEE International
Conference on
[Carte09] httpwwwcartesfrancefr
[CISCO13] Cisco Visual Networking Index Global Mobile Data Traffic
Forecast Update 2012-2017 February 2013
[CHLWW08] ConilE Hadjem A Lacroux F Wong M F and Wiart J
Variability analysis of SAR from 20 MHz to 24 GHz for
different adult and child models using finite-difference
time-domain Phys Med Biol vol 53 pp 1511-1525
2008
[CHRIST10] Christ A Kainz W Hahn E G Honegger K Zefferer
M Neufeld E Rascher W Janka R Bautz W Chen
J Kiefer B Schmitt P Hollenbach H-P Shen J
Oberle M Szczerba D Kam A Guag J W amp Kuster
N The Virtual Family--development of surface-based
anatomical models of two adults and two children for
dosimetric simulations Phys Med Biol vol 55 pp 23-38
2010
[CMKB06] Cooper TG Mann SM Khalid M and Blackwell RP
Public exposure to radio waves near GSM microcell and
picocell base stations Journal of the Society for
Radiological Protection Vol 26 No 2 pp 199-211 June
2006
[GCWW10] Gati A Conil E Wong MF Wiart J Duality between
uplink local and downlink whole body exposures in
operating Networks IEEE Transactions on EMC Vol 52
ndeg4 Nov 2010
Document ID D26 Global Wireless Exposure Metric DefinitionFP7 Contract ndeg318273
Version V4 46Dissemination level PU
[HoTo11] Hola HG And Toskala A LTE for UMTS Evolution to
LTE-Advanced Wiley UK 2011
[INFORMA12] Informa telecom amp Media Small Cell Market Update June
2012
[INSEE11] Insee enquecircte Emploi du temps 2009-2010 Insee
Premiere Ndeg 1377 November 2011
[IST] httpwwwist-winnerorg
[KALLIOLA02] Kalliola K Sulonen K Laitinen H Kiveks O Krogerus J
Vainikainen P Angular power distribution and mean
effective gain of mobile antenna in different propagation
environments IEEE Trans Veh Technol vol 51 pp 823ndash
838 2002
[KIENTEGA11] Thierry Kientega EConil A Gati A Hadjem ERichalot M-F Wong OPicon Joe Wiart Analysis of thedistribution of specific absorption rate induced by fiveplane waves with a fast and new method in VisibleHuman URSI conference 2011
[LAUER13] Lauer O Frei P Gosselin M C Joseph W Roumloumlsli M
and Froumlhlich J Combining near- and far-field exposure for
an organ-specific and whole-body RF-EMF proxy for
epidemiological research a reference case
Bioelectromagnetics vol 34(5) pp 366-74 2013
[LEXNET D21 2013] Vermeeren G Thielens A Aerts S Joseph W
Martens L Oliveira C Mackowiak M Correia LM
Pejanovic-Djurisic M Veljovic Z Nešković A
Koprivica M Gati A Varsier N Hadjem A Wiart J
ConilE ldquoD21 Current metrics for EMF exposure
evaluationrdquo LEXNET project April 2013
[LEXNET D22 2013] Wiedemann P M Freudenstein F ldquoD22 Risk and
exposure perceptionrdquo LEXNET project July 2013
[LEXNET D23 2013] Vermeeren G Plets D Joseph W Martens L Conil E
Varsier N Wiart J Corre Y Oliveira C Sebastiatildeo D
Correia LM Aguumlero R Diez L Rodriacuteguez L Koprivica
M Nešković A Popović M Milinković J Nikšić S ldquoD23
Scenariosrdquo LEXNET project November 2013
[LEXNET D24 2013] Conil E ldquoD24 Global Wireless Exposure Metric
Definitionrdquo LEXNET project October 2013
Document ID D26 Global Wireless Exposure Metric DefinitionFP7 Contract ndeg318273
Version V4 47Dissemination level PU
[LEXNET D32 2014] BoriesS (ed) ldquoD32 Wideband dosimeter design study amp
performances characterizationrdquo LEXNET project July
2014
[LEXNET D41 2013] Bories S Fang Y Brown TBegaud X Pinto Y Ciblat P
Ksairi N De Domenico A Clemente A Fernandez Y
Lalam M Masera E Wilson M Tesanovic M Kocan E
Pejanovic-Djurisic M Veljovic Z Milatović B Popović M
Nešković A Koprivica M Voinescu A Dragomir D
Slusanschi E laquo D41 Promising Low Exposure Index
Solutions for Components and Transmission
Techniques raquo LEXNET project November 2013
[LEXNET IR21 2013] ldquoNumerical toolsrdquo LEXNET project July 2013
[LEXNET IR51 2013] ldquoSmart low-EMF architectures state of the art and way
forwardrdquo LEXNET project May 2013
[LEXNET D25 2014] Wiedemann P M Freudenstein F ldquoD25 Risk and
exposure perceptionrdquo LEXNET project November 2014
[LEXNET D42 2014] Bories S Fang Y Brown TBegaud X Pinto Y Ciblat P
Ksairi N De Domenico A Clemente A Fernandez Y
Lalam M Masera E Wilson M Tesanovic M Kocan E
Pejanovic-Djurisic M Veljovic Z Milatović B Popović M
Nešković A Koprivica M Voinescu A Dragomir D
Slusanschi E laquo D42 Performance Evaluation of Low
Exposure index solutions for components and
Transmission Techniques raquo LEXNET project November
2014
[MaOC12] Mackowiak M Oliveira C and Correia L M RadiationPattern of Wearable Antennas A Statistical Analysis of theInfluence of the Human Body International Journal ofWireless Information Networks Vol 19 No 3 pp 209-218 2012
[MaCo13] Mackowiak M and Correia L M Statistical Model of theInfluence of Body Dynamics on the Radiation Pattern ofWearable Antennas in Off-Body Radio ChannelsWireless Personal Communications 101007s11277-013-1193-x May 2013
[Mack13] Mackowiak M Modelling MIMO Systems in Body AreaNetworks in Outdoors PhD Thesis IST - University ofLisbon Lisbon Portugal 2013
Document ID D26 Global Wireless Exposure Metric DefinitionFP7 Contract ndeg318273
Version V4 48Dissemination level PU
[NAGAOKA08] Nagaoka T and Watanabe S Postured voxel-based
human models for electromagnetic dosimetry Physics in
medicine and biology vol 53 pp 7047-7061 2008
[PLETS12] Plets D Joseph W Vanhecke K Tanghe E and Martens
L 2012 Coverage Prediction and Optimization Algorithms
for Indoor Environments EURASIP 2012123
[PLETS14] Plets D Joseph W Aerts S Vanhecke K and Martens L
accepted 2014 Prediction and comparison of downlink
electric-field and uplink localized SAR values for realistic
indoor wireless planning Radiation Protection Dosimetry
[SaNC10] SaloJ Nur-AlamM and ChangK Practical Introduction
to LTE Radio Planning white paper European
Communications Engineering (ECE) Ltd Espoo Finland
Nov 2010 (wwweceltdcom)
[TAFLOVE00] Taflove A and Hagness S C 2000 Computational
Electrodynamics The Finite-Difference Time-Domain
Method 2nd edn (Boston MA Artech House Publishers)
[TNS10] TNS Sofres survey Observatoire Socieacutetal du teacuteleacutephone
mobile Dec 2010
[VAJM13] Vermeeren G Aerts S Plets D Joseph W Martens
LConil E Varsier N Wiart J Core YOliveira C Sebastiatildeo
DCorreia L Aguumlero R Diez L Rodriacuteguez L Koprivica M
Nešković A Popović M Milinković J Nikšić S D23
Scenarios LEXNET project Novembre 2013
[WIART08] Wiart J Hadjem A Wong M F and Bloch I Analysis of
RF exposure in the head tissues of children and adults
Physics in medicine and biology vol 53 pp 3681-3695
2008
[WINNER D112 2007] Kyoumlsti P et al D112 WINNER II Channel models
WINNER project September 2007
[ZHAO02] Zhao X Kivinen J Vainikainen P Skog K Propagation
characteristics for wideband outdoor mobile
communications at 53 GHz IEEE J Sel Areas Commun
vol 20 pp 507ndash514 2002
Document ID D26 Global Wireless Exposure Metric DefinitionFP7 Contract ndeg318273
Version V4 49Dissemination level PU
APPENDIX 1 NUMERICAL DOSIMETRIC SIMULATIONS
This appendix describes the main assumptions concerning the frequency bands used
in the numerical dosimetric simulations
Table A1 gives the frequency bands used for SAR simulations as well as theservices and DLUL frequencies considered in each of those frequency bands forLEXNET studies Note that at these frequencies (especially at the higher ones) nolarge differences are expected between SAR results [CHLWW08] Accordingly forthe sake of simplicity it is assumed that
the same frequency band is assumed for both up- and down-link each frequency band may cover more than one system (eg simulation at
1940 MHz covers both GSM1800 and UMTS2000)
Table A1 Technical specifications for LEXNET selected services
SAR
simulation
frequency
band [MHz]
RAT
RAT frequency band [MHz]
DL UL
400 LTE 400 380 - 470
900
LTE 800 875- 885 830 - 840
GSM 900 935 - 960 890 - 915
UMTS 900 925 ndash 960 880 ndash 915
1940
GSM 1800 1805 - 1880 1710 - 1785
UMTS 2000 2110 - 2170 1900 - 1980
2600WiFi bgn 2400 - 2484
LTE 2600 2620 - 2690 2500 - 2570
For the WiFi an between 5470 and 5725 MHz frequency bands no SAR simulation
was performed yet
Document ID D26 Global Wireless Exposure Metric DefinitionFP7 Contract ndeg318273
Version V4 50Dissemination level PU
APPENDIX 2 INTERNAL REVIEW
Reviewer 1 Yoann Corre Reviewer 2 Mick Wilson
Answer Comments Type Answer Comments Type
1 Is the deliverable in accordance with
(i) the Descriptionof Work
Yes
No
M
m
a
Yes
No
M
m
a
(ii) the internationalState of theArt
Yes
No
M
m
a
Yes
No
M
m
a
2 Is the quality of the deliverable in a status
(i) that allows tosend it to EC
Yes
No
M
m
a
Yes
No
M
m
a
(ii) that needsimprovement ofthe writing bythe editor of thedeliverable
Yes
No
See proposedenhancements
In particular thepresentation of the basic EIconcept could be improvedin the Abstract Introductionsection 21 and Conclusion
M
m
a
Yes
No
See comments onSection 3
M
m
a
(iii) that needsfurther work bythe partnersresponsible forthe deliverable
Yes
No
Mostly minor changes Seethe proposedenhancements
Section 44 is a copy-pastof a whole section in D33Either D26 or D33 must bechanged to avoidredundancy (replacing thewhole description by asummary adapted to theintegrated deliverable)
It must be made more clearwhere the reader will findthe missing SAR data andthe announced uncertaintystudy results
M
m
a
Yes
No
M
m
a
Type of comments M = Major comment m = minor comment a = advice

Document ID D26 Global Wireless Exposure Metric DefinitionFP7 Contract ndeg318273
Version V4 7Dissemination level PU
1 INTRODUCTION
Wireless communications are being used in almost every aspect of daily life Theextremely rapid technological evolution results in dramatic changes in the usage ofthe wireless devices but not in the perception of the exposure induced by thesenetworks
On the one hand new devices and new generations of wireless networks have madea multitude of new applications popular These applications (used mainly withsmartphones) are consuming more and more data as illustrated in Figure 1[CISCO13]
Figure 1 global mobile data per month traffic forecast by type of deviceSource Cisco VPN Mobile Forecast 2013
To support this increasing demand traditional macro-cellular networks are not welldimensioned anymore and new types of networks based on heterogeneoustopologies (including small cells) must be used to offload the data trafficThe deployment of new frequency bands and new technologies as LTE as well asthe growth of WiFi usage will help to support this demandAs illustrated on Figure 2 a massive small-cells deployment is forecast in the nextfew years [INFORMA12]
Document ID D26 Global Wireless Exposure Metric DefinitionFP7 Contract ndeg318273
Version V4 8Dissemination level PU
Figure 2 Worldwide small cells deployment forecast - Source Informa Telecom amp Media
But paradoxically as the role of wireless communications in the daily life quicklyexpanded the public concern around EMF health risk grows just as much An in-depth survey has been conducted in the framework of LEXNET Data was collectedfrom April to June 2013 in France Germany Portugal Spain Romania Montenegroand Serbia using an online survey tool A total of 2392 respondents participated inthis survey (mean age 3482 years gender distribution 40 female and 60 male)The first part of the survey focused on the perceived sources of daily RF-EMFexposure of the respondents Additionally we were interested in the factors whichdetermine in their view the degree of EMF exposure Another part of the surveyregarded risk perception and health concernsOnly key findings are reported here but detailed description of the survey and of theresults is in the deliverable entitled ldquoD22 Risk and exposure perceptionrdquo [LEXNETD22 2013]
Regarding the perceived health hazards of various usage scenarios our respondentsevaluated base stations on a school roof as the most dangerous Using mobile phonefor calls is perceived as less dangerous a somewhat lower score characterizes thelaptop used on the lap The results of this survey indicate that risk perceptions of thegeneral public and the underlying health concerns are guided by subjective models ofEMF impact which underestimate near-field exposure and overestimate far-fieldexposure People are more concerned about base stations than about all other RF-EMF sources
Currently different metrics are used to deal with exposure induced by sources closeto the users as mobile phones and with exposure induced by far away sources asbase station antennasThe current state of existing metrics to evaluate the exposure induced by RF-EMFsources has been reviewed in the deliverable ldquoD21 Current metrics for EMFexposure evaluationrdquo [LEXNET D21 2013]
Document ID D26 Global Wireless Exposure Metric DefinitionFP7 Contract ndeg318273
Version V4 9Dissemination level PU
Basically two types of metrics are distinguished the ones dedicated to the exposureinduced by sources close to the users as personal devices and expressed in termsof Specific Absorption Rate (SAR) and the ones focusing on the exposure induced byfar field sources as access points or base station antennas and currently expressedin ElectricMagnetic fields or Power DensityPersonal devices and base stations are too often represented as two separate worldswhen dealing with exposure issue But the connection between exposure induced bypersonal devices and base stations is indisputable Measurements on real networksillustrate a strong correlation (Figure 3) between the power emitted by personaldevices and the power received by personal devices from the base station antennas[GCWW10]
Figure 3 Duality between mobile phones emitted and received powers measured duringvoice calls on the 3G Orange France network - source [GCWW10]
The project LEXNET aims at filling the gap between these two separate ways ofdealing with exposure by proposing a new exposure metric named Exposure Index(EI) The EI is assessing the average exposure of a population induced by bothpersonal devices and base stations (or access points) The concept is to average thisglobal exposure over space by assessing the EI in a given area and average it overtime by considering a given time frame Therefore an important question that theproject must absolutely address is about the understandability and acceptability ofthis new exposure metric by the general publicA second survey has been therefore conducted in the framework of LEXNET Datawere collected from July to September 2014 in France Germany United KingdomPortugal Spain Romania and Serbia among a representative sample of the generalpopulation A total of 1809 respondents participated in this second surveyAn important part of the survey focused on how people are considering strategiesproposed in the framework of the LEXNET project to define and minimize thepopulationrsquos exposure to electromagnetic fieldsOnly key findings are reported here but detailed description of the survey and of theresults is in the deliverable entitled ldquoD25 Risk and exposure perceptionrdquo [LEXNETD25 2014]
-60 -40 -20 0 20 40
-120
-100
-80
-60
-40
Emitted power by devices (dBm)
Rec
eive
dpo
wer
by
devi
ces
(dB
m)
GSM 900
GSM 1800
UMTS 2100
Document ID D26 Global Wireless Exposure Metric DefinitionFP7 Contract ndeg318273
Version V4 10Dissemination level PU
When asked about adding up the exposure from personal wireless devices and theexposure from base stations when evaluating the exposure of people to EMF morethan 90 of respondents agreed on the fact that both downlink and uplink exposuresshould be considered when evaluating the population exposure to EMFA large percentage of respondents also agreed when asked if it makes sense tocharacterize the day-to-day exposure to EMF by averaging it over time or if they thinkthat an individual exposure to EMF can be approximated by measuring the exposureover a large population
The next chapter of this deliverable describes the Exposure Index proposed by theproject LEXNET
Document ID D26 Global Wireless Exposure Metric DefinitionFP7 Contract ndeg318273
Version V4 11Dissemination level PU
2 THE EXPOSURE INDEX
21 Key concept
The Exposure Index (EI) takes into account the global EMF exposure of apopulation to a given wireless telecommunication network (or a set of networks)The EI does not take into account the exposure induced by other RF sourcessuch as Frequency Modulation (FM) radio or digital terrestrial televisiontransmittersIt covers the exposure of a population during a given time frame in a given areaincurred by a wireless telecommunication network as a whole aggregating thedownlink exposure induced all day long by base stations and access points andthe uplink exposure incurred by individual wireless communication devices Theuplink exposure can be subdivided in exposure due to the uplink of the userrsquos owndevice and the uplink of devices operated by other users nearbyIn order to assess the realistic exposure of a population many parametersinfluencing the exposure need to be taken into account in the Exposure Indexage (adult and child exposure are different [CHLWW08] [WIART08]) posture[NAGAOKA08] usage technology environment etchellip
In a nutshell the LEXNET Exposure Index is a function transforming a highlycomplex set of data into a single parameter which has two key benefits it isunderstandable acceptable and usable for all the stakeholders from generalpublic to regulatory bodies and it is linked in a tangible way to the networkoperating parameters
The EI is built from the aggregation of individual exposure contributions generatedby a specific exposure source in specific exposure situations For instance anaveraged individual exposure generated by WiFi 24 GHz can be calculated atday time for an adult heavy-user located indoors sitting and with a tablet Thesame kind of individual exposure is estimated for other time periods RATspopulations environments usages and postures to get complete elements thatcompose the EI The individual exposure contributions are weighted according totheir representativeness before aggregationThe individual exposure is the sum of a down-link (DL) and up-link (UL)components as explained with more details in section 221
The EI is computed in a given area from the aggregation of individual exposurecontributions in a chain of exposure (see Figure 4) The nodes in this chain arerelated to different exposure sources or exposure situationsbull the time periods as the configuration of the network and type of usage depend
on the time of day (low-load night-time vs heavily loaded peak-hour)bull the population as different population categories will have different life
segmentations and different usages of wireless devicesbull the user profilebull the different locations as the exposure configurations will be different in
different environments
Document ID D26 Global Wireless Exposure Metric DefinitionFP7 Contract ndeg318273
Version V4 12Dissemination level PU
bull the radio access technologies RATs (GSM UMTS LTE WiFi etc)frequency bands and deployment layers (macro micro and femto cells) thatusers connect to
bull the posture as different body postures will lead to different absorption rates inthe human body
bull the device usage (making a phone call does not lead to the same exposure asdownloading data)
Figure 4 the LEXNET chain of exposure
Different exposure scenarios [LEXNET D23 2013] are considered and aggregatedby putting weights on each configuration thereby determining the EI A partial EI canbe for example computed for a scenario that considers only a subset of RATspopulation environment etc Then several partial EI can be aggregated with aweight related to their representativenessEI takes into account all these parameters coming both from the telecom world todescribe the accessible network environment and from data on how people segmenttheir life to describe how people are using this network
22 Mathematical formalization
221 Exposure Index Equation
The Exposure Index is calculated for a finite geographical area which can be ofurban suburban or rural type for instanceThe general formulation of the Exposure Index contains a set of technicalparameters as described below The number of values classes or settings ofeach parameter depends on the level of detail of the available data and on thelevel of achievable complexity in terms of calculation For a given geographicalarea the EI takes the following into account (see also Table 1)
the time period (t) eg day and night
Document ID D26 Global Wireless Exposure Metric DefinitionFP7 Contract ndeg318273
Version V4 13Dissemination level PU
the population (p) segmented into different categories eg children (under15 yo) young people (15-29 yo) adults (30-59 yo) and seniors (60 yoand over)
the user load profiles (l) eg heavy medium light or non-users the environment (e) eg indoor (office home) outdoor and in commuting
(bus car subway etchellip) the different available Radio Access Technologies (RATs) (r) eg 2G (900
MHz and 1800 MHz) 3G 4G WiFi the number of RATs depends on thescenario
the different cell types (c) eg macro micro pico and femto cells theaccessibility to the different cell types depends on the scenario
the posture (pos) eg sitting standing the usage (u) is described by the device (eg mobile PC laptop) and the
usage (eg voice call data)
Time PopulationUser
ProfileEnvironment RAT Cell Type Posture Usage
Day Children Heavy Indoor 2G Macro Standing Voice mobile
Night Youngpeople
Medium Outdoor 3G Micro Sitting Data mobile
Adults Light Commuting 4G Pico Data Tablet
Seniors Nonuser
WiFi Femto Data Laptopon the laps
Data Laptopon the desk
Table 1 input variables in the modelling of the EI
The individual exposure contributions rely on the SAR expressed in Wkg The SARwill depend on the device the frequency band the morphology and the posture ofthe user as well as on the position and distance of the source with respect to theuser As part of LEXNET a set of numerical dosimetric simulations are performed inorder to fill out a comprehensive matrix of raw normalized SAR values These SARvalues can be whole-body or localized SAR values Whole-body SAR values areevaluated by averaging SAR over the whole-body whereas localized SAR values arevalues focusing on a body volume specific organ or tissue Different EI can beevaluated depending on the value of interest (whole-body or localized value)Network simulation tools will provide transmitted and received power average valuesto apply to the raw SAR matrixInformation and Communication Technologies (ICT) usage data obtained throughsensors inside the network and segmentation life data will finally provide the levels toapply for the evaluation of the EI
Document ID D26 Global Wireless Exposure Metric DefinitionFP7 Contract ndeg318273
Version V4 14Dissemination level PU
SARܫܧ =1
T
tperlcpos ൫ ത
൯
ே
௨
ேೞ
௦
ேಽ
ே
ேೃ
ேಶ
ேು
ே
௧
+ RXinc + ௦ௗ௩௦ோ௦ௗ௩௦
൨
(1)
where EISAR is the Exposure Index value the average exposure of the population of
the considered geographical area over the considered time frame T SARrefers to whole-body SAR organ-specific SAR or localized SAR
N is the number of considered periods within the considered time frame (egsingle day)
N is the number of considered Population categories N is the number of considered Environments N is the number of considered Radio Access Technologies Nେ is the number of considered Cell types N is the number of considered user Load profiles N୮୭ୱ is the number of considered Postures
N is the number of considered Usages with devices Pഥଡ଼ is the mean TX power transmitted by the usersrsquo devices during the period
t in usage mode u connected to RAT r in environment e For example whenEI is computed from simulation tools the TX power can be predicted over amap that covers the whole considered geographical area and the averagevalue is extracted for the EI evaluation See details in section 223
Sത ଡ଼୧୬ୡis the mean incident power density on the human body during the periodt induced by RAT r in environment e A distribution of the incident powerdensity for the whole considered geographical area is considered and theaverage value over this area is taken into account for the EI evaluation
ோ௦ௗ௩௦ is the incident power density on the human body during the
period t induced by a wireless device connected to RAT r of a user in theproximity in environment e This term is important when the exposed personis the user itself it can also be significant for persons in the proximity of usersof a wireless device for instance in a crowded meeting room in publictransportation etc In the applications discussed in this paper this term is
neglected We also remark that ோ௦ௗ௩௦ depends on the orientation of
the user of the wireless device with respect to the body of the people in itsproximity See details in section 223
d (ௐ ௦
) ௦ௗ௩௦ (
ௐ ௦
ௐ
మ) and dୈ (ௐ ௦
ௐ
మ ) are the normalised
raw dose values for UL the DL from the user in the proximity and DL frombase stations and access points respectively all multiplied by the time spentin the configuration See details in section 222
Document ID D26 Global Wireless Exposure Metric DefinitionFP7 Contract ndeg318273
Version V4 15Dissemination level PU
f୲୮ ୪ୡ୮୭ୱ is the fraction of the total population that corresponds to population
category p user load profile l in posture pos connected to RAT r for a celltype c in environment e during the time period t
In the following we explain the different terms used in the EI formula in more detail
222 Coefficients and
The coefficient is associated to the exposure induced by the uplink andexpressed as an absorbed dose normalised to a transmitted power of 1 W
[ୱ୩
]
=௧௨௦[ୱ]ܦ
௨௦[ܣ ୩]
[ ]
Ws
kgW൨ (2)
where ௧௨௦ܦ
is the time duration of usage ݑ and a user profile load when
connected to the RAT ݎ operating in cell type in the environment for thepopulation category in the posture pos during the time period of the day ݐ
ௌோೠೞ
ಽ
can be the whole body or an organ-specific or tissue-specific
valueܣ for the usage ݑ and the posture pos in the frequency band of theRAT ݎ and the population category calculated for an incident emitted power
of
and normalized to this power
The coefficient is associated to the exposure induced by the downlink and alsoexpressed as an absorbed dose normalised to an incident power density of 1 Wm2
[ୱ୩
]
=௧௦[ୱ]ܦ
௦[ܣ ୩]
RX[W]inc
ݏ
ଶ ൨ (3)
where ௧௦ܦ
is the time duration of posture ݏ when connected to the RAT ݎ
operating in cell type in the environment for the population during thetime period of the day ݐ
ௌோೞ
ವಽ
ௌೃ can be the whole body or an organ-specific or tissue-specific
valueܣ induced by the base station or access points of the RAT ݎ in thepopulation for the posture ݏ normalized to the received power density
ோ
223 Transmitted power ഥ and received power density ത ܖ
ത is the average power transmitted by the device in busy mode (in active
communication) It should be noted that even in idle mode (not for activecommunication) the devices transmit from time to time some power (to stay
Document ID D26 Global Wireless Exposure Metric DefinitionFP7 Contract ndeg318273
Version V4 16Dissemination level PU
synchronized with the network for example) but the exposure induced by the devicein idle mode is negligible as it is based on rare eventsSത୧୬ୡ is the average power density incident on the human body from the base stationsor access points of the RAT The incident power density is assessed not only forusers of mobile devices but also for non-users It is assumed that the usage patternof the user considered in the EI formula does not influence the average incidentpower density From a theoretical point of view Sത୧୬ୡ is the average incident powerdensity integrated over all the frequency bands of the RAT and cell type consideredFrom a practical point of view Sത୧୬ୡ can be assessed directly from spectrum analyzer(SA) measurements dosimeters simulations and indirectly from the received poweron a user device or in a drive test measurementത and Sത୧୬ୡ average out the instantaneous variations of the transmitted power and
incident power density that arise during a communication These variations occurwhen the user is static or moving over a very small distance and are caused bydifferent phenomenas (power regulation small-scale fading resource allocation usertraffic variations etc) Values that will be used in the EI evaluation are averagedvalues over the whole considered geographical area
For both the evaluation of the DL incident power density and UL transmitted powerthe ressource allocation or duty cycle of the system has to be taken into account TheEI computation does not rely on maximum allowed power values (as in existing EMFexposure procedures) but on the incident and transmitted powers that respectivelydepend on the DL network and UL user resource load This definition leads to anestimate of the UL transmitted power that necessarily depend on the type of usertraffic (eg voice web browsing file upload etc) the higher is the instantaneous ULthroughput during the communication the higher is generally the UL transmittedpower
224 Index computation data sources
The EI evaluation relies on the collection of a wide range of data from simulationtools literature models and measurement equipments that will be demonstrated inthe LEXNET technical work-packages All the input data that were collected and areused in the framework of the project will be stored in an internal document
For life segmentation data in particular up-to-date life segmentation surveyscollected in the different participated countries were used to extract information onhow different categories of population segment their daily lifes (see Table 2)[INSEE11] [ALIAGA06]
Populationcategory
Day (8 AM-6 PM) Night (6 PM- 8AM)
Indoor(office-school-home)
Outdoor
Transportation (bus car
subwayetchellip)
Indoor(home)
Outdoor
Transportation (bus car
subwayetchellip)
Adults8h15
(825)1h10
(115)35 min
(6)13h05 min
(935)20 min(25)
35 min(4)
Document ID D26 Global Wireless Exposure Metric DefinitionFP7 Contract ndeg318273
Version V4 17Dissemination level PU
Youngpeople
8h20(83)
1h10(115)
30 min(55)
13h10 min(94)
20 min(25)
30 min(35)
Children8h15
(825)1h30 (15
)
15 min(25)
13h45 min(985)
0 min
(0 )
15 min(15)
Seniors7h35(70)
2h10(275)
15 min(25)
13h05 min(935)
40 min(5)
15 min(15)
Table 2 Life segmentation inputs for evaluation of the Exposure Index
ICT Usage data (usage of mobile phones for voice call or data usage of tabletsPChellip) are obtained through measurements of Key Performance Indicators (KPIs) bysensors inside the network KPIs of interest for evaluating the EI are for each userthe uplink and downlink data traffic volumes the number of voice calls the durationof each voice call etchellip The network operators involved in the LEXNET project ieOrange (France) and Telekom Serbia (Serbia) as well as the operators fromMontenegro being partners of University of Montenegro provided such data
3G denseurban
Voice Data (82 DL 18 UL)
tcom (s) volULdata [kB] volDLdata [kB]
Heavy user
Day 841 4948 25124
Night 689 5879 31922
Medium user
Day 147 464 2390
Night 86 387 2001
Light user
Day 26 35 158
Night 16 28 124
Table 3 shows usage data that could be derived from KPIs obtained throughmeasurements in a 3G network
3G denseurban
Voice Data (82 DL 18 UL)
tcom (s) volULdata [kB] volDLdata [kB]
Heavy user
Day 841 4948 25124
Night 689 5879 31922
Medium user
Day 147 464 2390
Night 86 387 2001
Light user
Day 26 35 158
Document ID D26 Global Wireless Exposure Metric DefinitionFP7 Contract ndeg318273
Version V4 18Dissemination level PU
Night 16 28 124Table 3 Average communication durations and data traffic volumes per user profile for a 3G
dense urban network
Reference SAR data were computed using 3D electromagnetic simulation platformsbased on the Finite Difference Time Domain (FDTD) method [TAFLOVE00] SARvalues were calculated for far-field and near-field exposure for two anatomical humanbody models of the Virtual Family [CHRIST10] Duke a 34-year-old male and Earthaan 8-year-old girl Two postures (standing and sitting) and three usages (mobilephone close to the head mobile phone or tablet for data and laptop usage) wereselected More details on numerical simulations can be found in [LEXNET IR212013]Table 4 shows the matrix of raw whole body averaged ௨௦ܣ
values induced in
an adult for a mobile phone usage the same table exists for other usages and forchild exposure
p=adult u=MOBILES
r=Frequency Band
Usage u400MHz
band (LTE)900MHz band(GSM UMTS
LTE)
1800-1940MHzband
(GSM 3G LTE)
24-26GHz(WiFi LTE)
Sitting Data 00078 00056 00016 73E-04Voice X 0012 00052 00047
Standing Data 0003 00049 319E-04 21E-05Voice X 0012 00052 00053
Table 4 Values of normalized whole-body ܛܗܘܝܚܘۯۺ induced in an adult by near sources
(mobiles laptops tablets) in different postures (all the values are given in Wkg and were
normalized to ] ]
= )
Table 5 shows the matrix of raw whole body averaged ௦ܣ values induced in an
adult by far field sources the same table exists for child exposure
p=adult r=Base station antennas (plane waves)
u=usage 400MHz band(LTE)
900MHz band(GSM UMTS
LTE)
1800-1940MHzband
(GSM UMTSLTE)
26GHz band(LTE)
Sitting 00050 00056 00043 00039Standing 00064 00052 00046 00042
Table 5 Values of normalized whole body ܛܗܘܚܘۯۺ۲ induced in adult by far and intermediate
sources (base stations and access points) (all the values are given in Wkg and were
normalized to RX[W]inc
= 1 Wm-2
)
It is worth pointing out that the aforementioned exposure index EI is defined on thebasis of the whole body averaged SAR But a local EI could be also derived fromlocal or tissue-specific SAR values
Document ID D26 Global Wireless Exposure Metric DefinitionFP7 Contract ndeg318273
Version V4 19Dissemination level PU
Last main data required to evaluate the EI are the average DL power density and ULtransmitted power They can be predicted from wireless network planning tools network monitoring tools or dosimeter The predictions or measurements collect awide range data at different locations within the study area for different periods oftime and possibly for different usages in order to derive relevant average valuesTwo types of dosimeters are designed in LEXNET wearable and fixed dosimeterslsquoIn sitursquo measurements were executed close to the end-user body thanks to thewearable version of the dosimeter Fixed dosimeters are being deployed in a densesensors network of a lsquosmartrsquo city More information on the LEXNET measurementtools is available in [LEXNET D61] and on the related assessment methodologies in[LEXNET D33]
23 Variability and uncertainty
The exposure index is the output of an analytical model expressed by the equation(1) with a number of uncertain input variables To propagate the uncertaintyassociated to the input variables in the model the first step consists in characterizingthe distribution of input variables Each uncertain variable input will be described by astatistical distributionThe uncertainties of the life segmentation data will be analyzed and modelled usingcomputable functions such as Gamma Gaussian or uniform distributionsUncertainties on the time use structure on an average day the usage segmentationand the average durations of usage will be characterizedAverage DL power density and UL transmitted power are estimated using specificconfigurations environments and usages The downlink power absorbed by the userand the uplink power emitted by the device (and so partially absorbed by the user)depend on these configurations environments and usages Their statisticaldistributions have to be characterized in order to be incorporated in the total EIstatistical uncertaintyA sensitivity analysis is ongoing in order to determine the most important parametersin the EI equation and how we could simplify the EI formula We are using Polynomialchaos and copulas for modelling of dependant parameters All the results onvariability and uncertainties will be available at the end of the LEXNET project indeliverable D28
The uplink exposure characterization requires a precise modeling of the poweremitted by the device Usually this exposure will depend on two parameters theposition of the personal device relative to the user body and the variation in spatialdistribution of the antenna gain due to the induced coupling effects The impact of thepositioning of the wireless device has been investigated by varying the position ofpersonal device with respect to the body Results have shown that the whole-bodySAR is not very sensitive to the device positionTo investigate the impact of the antenna gain on the variability of the emitted powerwe have used a statistical model of propagation channel [IST]Two propagation scenarios have been tested line of sight (LOS) and non-line ofsight (NLOS) For both scenarios we considered a lognormal distribution for theemitted power with a coefficient of variation up to 120 in the case of LOS and up to57 in the case of NLOS when studying the case of mobile phone emitting at 900MHz frequency This lognormal distribution characterizes the variability of the power
Document ID D26 Global Wireless Exposure Metric DefinitionFP7 Contract ndeg318273
Version V4 20Dissemination level PU
emitted versus the antenna gain Firstly we are assuming that the communication ismade via a single path namely LOS Assuming that the user can change randomlyits orientation with respect to the receiver antenna (eg base station) the antennagain in the LOS direction will also change depending on the user orientation Tomaintain a same control power (assumed fixed by the base station to ensure asuccessful decoding) the product of the emitted power to the antenna gain in LOSdirection should be a constant namely 1 mW in our analysis In the same spirit wehave analyzed the NLOS scenario by adding secondary paths The characterizationof the power emitted allows estimating the related exposure using the proportionalrelationship Figure 5 presents the cumulative distribution function of the poweremitted by the mobile phone when the average power required by the base stationoutside the small sphere surrounding the transmitter system (user + mobile phone) iskept to 1 mW
Figure 5 Cumulative distribution function (CDF) of the power emitted by the mobile phone (at 900MHz) obtained with both propagation scenarios (LOS and NLOS)
We could notice that the power emitted is very sensitive to the spatial distribution ofthe antenna gain especially in the case of LOS
The downlink exposure is very sensitive to the propagation environment[KALLIOLA02] [KIENTEGA11] Many physical obstacles (such as tunnels andbuildings) between the transmitter and receiver can affect the characteristics of theambient electric field This latter depends on many parameters such as the number ofwave components (due to the reflections and diffractions undergone by the originalwave radio) the fluctuations of the wave amplitude its phases and arrival angles Inthe literature several studies focused on the modeling of the electromagneticenvironment in realistic conditions by giving the statistics distributions of all of theseparameters [KALLIOLA02] [ZHAO02] [WINNER D112 2007] Based on the modelsproposed by these studies we simulated a downlink exposure induced by a realisticpropagation environment Figure 6 shows the variations of the whole body SARinduced by a single plane wave at 900 MHz
Document ID D26 Global Wireless Exposure Metric DefinitionFP7 Contract ndeg318273
Version V4 21Dissemination level PU
Figure 6 Variation of the exposure induced by a single plane wave (LOS) at 900 MHz for differentpolarization (horizontalH verticalV)
Other sources of uncertainties exist as the information on the network wirelessinfrastructure (eg the base station antenna location and orientation) the userequipment performance the Prediction errors (propagation UL power control modeletchellip) some being discussed in [D33 section 231] or measurement discretization(eg with a limited number of fixed dosimeters [D33 section 26])
3 HOW TO USE THE INDEX OF EXPOSURE
The synthetic index which is presented above aims at gathering all contributions tothe population EMF exposure induced by wireless communication networks By itselfbuilding such an index is already a challenging goal but LEXNET goes beyond thedefinition of the EI since it seeks reducing the exposure by exploring innovativetechniques at the lower (mainly PHY level) or upper layers (network level andresource management)
However a general formulation of the EI is given in this document the EI needs to beslightly adapted to the particular characteristics of each technique evaluationscenario The basic idea is that each of the proposed techniques would probablyfocus on a particular parameter and most likely on a single scenario Proposedtechniques could therefore be evaluated by using a partial EI Hence their benefitswould be specific to the characteristics of the selected use case and their impact overthe overall EI would need to be adjusted accordingly A reference scenario detailedbelow has been defined in order for all the proposed reducing solutions to be testedon one unique global scenario
31 Reference scenario
One reference global scenario will be used as a starting point scenario by LEXNETtechnical work-packages (WP 4 5 and 6) to evaluate the EI ldquobeforerdquo implementationof LEXNET exposure-minimization techniques
Document ID D26 Global Wireless Exposure Metric DefinitionFP7 Contract ndeg318273
Version V4 22Dissemination level PU
Parameter Value
Time periods Day Night
Population Adult children
Load profiles Heavy moderate light and non user
Environments Outdoor indoor commuting
RATsCellTypes
Type 2G 3G 4G WiFi
Cell size Variable (mainly depends on theenvironment)
Cell type Macro
User
Usage Voice data
Equipment Smartphone tablet Laptop (dongle)
Posture Standing sitting
The EI will be evaluated for this specific scenario using life segmentation usage andSAR data introduced in the previous chapterThen each partner will be free to test their minimizing solutions on this scenario andto calculate an EI ldquoafterrdquo LEXNETScenarios for each RAT can be simulated separately and percentages of mobiletraffic per RAT can be afterwards used as input for the EI (see Figure 7) It can beenvisaged that modifying these percentages could be one network managementsolution for reducing the EI assuming in a first approximation that the traffic per RAThas no strong influence on the RAT exposure metrics which is not completely right
Figure 7 Connections by RAT [CISCO13]
Document ID D26 Global Wireless Exposure Metric DefinitionFP7 Contract ndeg318273
Version V4 23Dissemination level PU
32 Reducing the EMF exposure using the EI
321 Lower layer solutions a common methodology to use the EI
The EI is a relevant global metric for evaluation of radio technologies performances interm of exposure reduction However WP4 has identified some difficulties to directlyaddress the global calculation To reach this global evaluation target WP4 hasadopted a specific and indirect methodology described in [LEXNET D42 2014]deliverable and synthesised in the following Despite a large diversity of technicaldomains whatever the scenario or the Radio Access Technologies (RAT) a singlestrategy to organize and align the different WP4 exposure evaluations is proposed Afive steps methodology has been established in order to evaluate and harmonize theoverall exposure improvement for each technology These steps also attempt toprovide the basis for future global exposure reduction evaluation in order todetermine the most promising WP4 techniques based on fair and relevantcomparisons
The first step is to identify how the individual WP4 techniques contribute towards theoverall LEXNET use case scenarios from WP2 Specifically for WP4 evaluations foursub-scenarios have been introduced (Macro-Cell Small-Cell Rural and WSN ampWiFi) (Step-1a) This sub-scenario categorization highlights which solutions arecomplementary and which will require further analysis to determine potential conflictsIn order to harmonize the evaluations from the studies of different solutions it iscrucial to describe properly and extensively each assumption and the inputparameters values related to the context study (Step-1b)
A limited numbers of Key Performances Indicators (KPI) for the exposure and for theQoS are used in the evaluation of each WP4 technique The step-2 has to clearlyidentify the KPIs being addressed by individual technique exploration It is taken asmore convenient to work with one of the following three simpler metrics or KPIsderived from the EI formula and addressing UL exposure
The first metric is the Specific Absorption Rate (SAR l mTx ) which describes the
amount of EM energy absorbed into the userrsquos body via the spatial distributionof the EM field from the source Thus SAR is particularly relevant for antennasolutions
The second metric is the mean duration of exposure (UL
kjit ) which indicatesthe amount of time the user is exposed It impacts the EI which is defined as adose For example the duration is impacted by the amount of transmitted dataReduced retransmission improved interference management and signalingreduction strategies are all ways of decreasing this metric The duration usedto calculate the mean is selected regarding the time constant of the studiedtechnique
The third metric is the mean transmitted power ( TxP ) during the considered
mean exposure duration As an example a 1 dB improvement on the receivingsensitivity at the Base Station (BS) could be converted in a 1 dB reduction ofthe transmit power at the User Equipment (UE) Again the duration used tocalculate the mean is selected regarding the time constant of the studiedtechnique
Document ID D26 Global Wireless Exposure Metric DefinitionFP7 Contract ndeg318273
Version V4 24Dissemination level PU
Notice that an equivalent set of three metrics adresses the DL
The step-3 concerns the evaluation itself of a partial EI ratio in comparison with abaseline scenario that is to say without implementing the studied solution Theexposure reduction is evaluated through the calculation of an EI ratio by comparingthe lsquoafter LEXNETrsquo versus the lsquobefore LEXNETrsquo (ie SotA or standard) baselineconfigurations (Eq 4) The main advantage of the proposed approach is that in mostof the presented solutions the three KPIs are independent from each other Byconsidering a given sub-scenario and depending whether the UL or the DL is studiedthis means that if a solution succeeds in decreasing the selected single KPI the twoothers will stay constant when the solution is implemented or not Thus in thatspecific sub-scenario the EI ratio is equal to the selected KPI ratio (Eq 5) Thisexposure metric is easily matched with a typical RF front-end or PHY layer evaluationstudies
(4)
This formula is simplified when a specific sub-scenario is considered
(5)
Where
partialEI is the Exposure Index for a specific sub-scenario
partialKPI is the identified metric among the three detailed in step 2
the subscript lsquow LEXrsquo correspond to the Lexnet solution implementationthe subscript lsquowo LEXrsquo correspond to the SotA or baseline (without the solutionimplementation)
Meanwhile the selected QoS metric is also evaluated with and without LEXNETsolution
The step-4 aims to ensure that capacity or QoS improvements are converted intoexposure reduction It is worth reminding that the objective of LEXNET studies is toreduce exposure without impacting QoS
At last the step-5 estimates the absolute global EI reduction from the previous stepsrsquopartial EI results throught the 24 hours LEXNET reference scenario The so-calleddilution factor [LEXNET D41 2013] is taken into account during this step-5 Theusage statistics from WP2 are used to weight the calculated partial EI reduction inorder to assess the global EI reduction for a given solution
To conclude a scheme summarizes the WP4 common EI evaluation methodology inFigure 8 This process is sufficiently generic to be applied by any of the WP4proposed solutions and examples of its step by step application can be found in[LEXNET D42 2014]
100LEXwoEI
LEXwoEI-LEXwEI()Ratio
partial
partialpartial
EI
100LEXwoKPI
LEXwoKPI-LEXwKPI()Ratio
partial
partialpartial
EI
Document ID D26 Global Wireless Exposure Metric DefinitionFP7 Contract ndeg318273
Version V4 25Dissemination level PU
Figure 8 Common EI evaluation methodology for WP4 techniques
322 Upper layer and resource management techniques
By introducing and promoting the EI as a new planning metric LEXNET intendsamong other objectives to help reduce local town planning objections to applicationsfor installing new base stations Work carried out by LEXNET WP5 so far hasdemonstrated that real-time EMF-aware network management strategies depend oncurrent traffic load radio conditions mobility application used and the duration ofuse available networks and UE capabilities Since EI calculations take into accountlong-term network statistics distributions of user profiles and habits (services usedetc) times of day period of year etc EI itself may therefore be better suited for initialnetwork design and AP placement while other metrics may be better suited for real-
Document ID D26 Global Wireless Exposure Metric DefinitionFP7 Contract ndeg318273
Version V4 26Dissemination level PU
time EMF management Clearly a link between these proxy-metrics and long-term EIvalues is needed The underlying assumption is that if we try to reduce the level ofEMF by applying correct general policies and additionally control it on a smaller time-scale (eg seconds or minutes) with fast-loop control then the overall exposure andthe EI (defined on daily level) will decreaseFast-loop (event-based) EMF control would be a response to a temporary change ofconditions This kind of control requires triggers ie thresholds that can be assessedon near-real-time scale ndash this time scale may not be as granular as for power controlFor fast-loop control offload techniques may be used as for general strategy butalso other strategies such as changing codecs delaying transmission etc Fast-loopcontrol without using triggers would be periodic optimization on a smaller time-scaleProxy metrics to be used for fast-loop control involve data that may be collected fromthe network and include
bull Measurements (UL Tx power RSSI RSCPhellip)
bull User context velocity services used profile
bull Statistics cell statistics (traffic load) etc
Some preliminary results using various proxy metrics which illustrate the pointsabove are shown hereFigure 9 shows live network measurements illustrating that available cellulartechnologies and current traffic conditions are two of the main points to be taken intoaccount when designing low-EMF solutions The metric used here is the UL Txpower The same metric is used in Figure 10 and Figure 11 which show that the typeof service could increase the exposure (based on UL Tx power) meaning thatdifferent strategies should be used to identify the best connectivity according to theservice flow requested The actual UL Tx power values can then be used in EIcalculations
Figure 9 Comparison of different 2G3G cells in high load hours by UE Tx power
Document ID D26 Global Wireless Exposure Metric DefinitionFP7 Contract ndeg318273
Version V4 27Dissemination level PU
Figure 10 Comparison of UL FTP and voice services over 2G3G cells in high load hours by UE Txpower
Figure 11 Comparison of voice service over 3G and voice service using Skype over 3G network
Another common proxy with direct link to EI is the DL power density Figure 12 showshow DL power density and UL transmit power vary for different ISD values in an LTEnetwork Based on these simulations it can be seen that small-cell densification inurban areas allows for significant exposure reduction which now needs to betranslated into the EI using various assumptions on user distributions and type ofusage
Document ID D26 Global Wireless Exposure Metric DefinitionFP7 Contract ndeg318273
Version V4 28Dissemination level PU
Figure 12 DL power density and UL transmit power for different ISD values
Whole-body SAR is another proxy metric whose statistical processing can leaddirectly to EI calculations As an example of SAR values obtained by a tooldeveloped for the prediction of whole-body and localized SARs and absorbed dosesfor indoor wireless network deployments in Figure 13 we show distributions for thetraditional deployment (top) and for the WP5 exposure-optimized deployment
Figure 13 Whole-body SAR_DL (distribution for the traditional deployment (top) and for the exposure-optimized deployment (bottom)
Document ID D26 Global Wireless Exposure Metric DefinitionFP7 Contract ndeg318273
Version V4 29Dissemination level PU
4 EXAMPLES OF APPLICATION
41 Computing chain
In this section three simplified examples of EI computation are detailed In no casethese examples are representing the completeness of the possibilities that can becover by the EI but they illustrate the process of computation
The first two examples illustrate the use of network planning tools in the evaluation ofthe EIThe first example detailed in the section 42 consists in comparing two indoor officescenarios first with wireless communication offered by only 3G outdoor macro basestations scenario and secondly with an additional 3G femtocell (Table 6)
Scenario 1
Time PopulationUser
ProfileEnvironment RAT Cell Type Posture Usage
1h inthe
afternoon
Adults Heavy Indoor 3G Macro Standing Voice mobile
Medium Datamobile
Light Data Tablet
Nonuser
Data Laptop
Scenario 2
Time PopulationUser
ProfileEnvironment RAT Cell Type Posture Usage
1h inthe
afternoon
Adults Heavy Indoor 3G Femto Standing Voice mobile
Medium Datamobile
Light Data Tablet
Nonuser
Data Laptop
Table 6 input variables for the 3G indoor sub-scenarios described in section 42
The second example detailed in section 43 is considering a data LTE macro urbanscenario (Table 7)
Time PopulationUser
ProfileEnvironment RAT Cell Type Posture Usage
Day Youngpeople
Moderate Indoor 4G Macro Standing Data mobile
Document ID D26 Global Wireless Exposure Metric DefinitionFP7 Contract ndeg318273
Version V4 30Dissemination level PU
Night Adults Non user Outdoor Sitting Data mobile
Seniors Data Tablet
Table 7 input variables for the LTE scenario described in section 43
The last example detailed in section 44 illustrates the use of dosimetermeasurements in the EI evaluation It is considering a macro outdoor LTE scenariowhere one user is wearing a dosimeter
42 Indoor exposure from 3G macro and femto-cells
The EI was evaluated for two scenarios considering the exposure of people locatedindoor The population consisted of adults making UMTS (phone calls with thephone on the right side of the head The scenario 1 is considering a macrocellconnection and the scenario 2 an indoor small cell connection Different user profilesare considered
10 heavy users 30 s usage 50 moderate users 10 s usage 25 light users 3 s usage 15 no usage 0 s usage
For the calculation of the EI several input parameters are needed reference SARvalues averaged transmitted power valuesത and averaged incident power densityvalues inc (see Table 8)The power (density) values that were used for the indoor macrocell scenario arederived from measurements in an office building (Zuiderpoort building GhentBelgium) [PLETS14] Figure 14 shows the considered buildingFor the indoor femtocell scenario accurate power (density) values from the WHIPPtool a heuristic indoor network calculator and planner [PLETS12] were used In theconsidered building a femtocell with an Equivalent Isotropically Radiated Power(EIRP) of 7 dBm is installed A different femtocell EIRP can lead to a largely differentEI Reference SAR values were taken from [LAUER13] and applied to the scenariosfor an adult standing using the phone on the right side of the head Since the
measured macrocell values (RXinc and Pഥଡ଼) were not recorded in the smaller andmore enclosed central areas of the building floor (toilets kitchen shedhellip) femtocellpredictions were limited to the non-shaded areas around the center in Figure 14 Forthe femtocell values locations within 50 cm of the base station are discardedassuming that people stay at least half a meter away from base stations For thesimulations a sub-scenario is also considered for which a 20 dB worse macrocellconnection is assumed for the same building floor This could correspond to abuilding with a penetration loss that is 20 dB higher than before or a building which islocated further from the macrocell base station (path loss increase of 20 dB) Table 8
shows that the assumed Pഥଡ଼ RXinc values in case of a lsquoworse connectionrsquo areindeed 20 dB higher lower
Document ID D26 Global Wireless Exposure Metric DefinitionFP7 Contract ndeg318273
Version V4 31Dissemination level PU
Figure 14 Ground plan of the considered floor (90 m x 17 m) of the office building that is simulatedFemtocell base station location is indicated with purple hexagon
Scenario 1Macro indoor
Scenario 2Femto indoor
௨ܣ 0003 Wkg 0003 Wkg
௨ܣ 000495 Wkg 000495 Wkg
ത 26610-5 W 28510-7 W
ത(worse connection) 26610-3 W 28510-7 W
RXinc81510-8 Wmsup2 51810-6 Wmsup2
RXinc(worse connection) 81510-10 Wmsup2 51810-6 Wmsup2
Table 8 Reference SAR values and average transmitted power and observed power densityvalues
In the following the results for the different indoor scenarios are discussedFigure 15 (a) compares the EI for scenarios 1 and 2 for the indoor office buildingFrom an exposure-point-of-view the indoor femtocell scenario (scenario 2 EI =158E-8 Wkg) is a factor 28 worse than the indoor macrocell scenario (scenario 1 EI= 564E-10 Wkg) The main EI contribution in scenario 2 is the high DL exposureoriginating from the femtocell (155E-8 Wkg) The scale in Figure 15 (a) has beenadjusted the bar that represents the DL femto indoor contribution is in reality 44times the length of the Y-scaleThere are several reasons why the installation of a femtocell is not beneficial in thiscaseA first reason is that the EI contributions of the macrocell are almost equal for UL andDL which is optimalA second reason is that the femtocell EIRP is chosen quite high (7 dBm) despite thegood macrocell connection (average value of -6925 dBm) still 77 of the DL fieldsare higher in the femtocell caseA third reason is that a femtocell installation has the disadvantage that observedpower densities on a building floor due to a femtocell base station are lesshomogeneously distributed than fields due to a (more distant) macrocell base stationAs people are assumed to ndash on average- reside an equal time at each location on thebuilding floor (except shaded areas and locations closer than 50 cm from the BS)locations close to the femtocell contribute a lot to the EI When people approach afemtocell the absorbed exposure dose increases in a more-than-linear wayMacrocell base stations have the advantage that ULDL fields are morehomogeneously distributed over the building floor It should also be noted that thehigher the UL usage the more the femtocell scenario will benefit compared to themacrocell scenario (lower EI) However in the considered case the UL usage timeswould have to increase by a factor 48 to yield a total EI (macrocell scenario 1) that isequal to the EI of scenario 2 (femtocell scenario EI = 158E-8 Wkg)
Document ID D26 Global Wireless Exposure Metric DefinitionFP7 Contract ndeg318273
Version V4 32Dissemination level PU
We also studied a second case where a less favourable macrocell case isconsidered (lsquoworse connectionrdquo) It is assumed that the connection with the macrocellbase station is now 20 dB worse than in the previous case Figure 15 (b) comparesthe EI for the macrocell and femtocell deployments Due to the worse connection(average received macrocell DL power of -8925 dBm) the macrocell EI is nowcompletely determined by the UL contribution (320E-8 Wkg) and the femtocellscenario (scenario 2 EI = 155E-8 Wkg) has an EI that is 48 of the macrocell EIwhich makes it preferable over the macrocell deployment Moreover the observedpower densities due to the femtocell are higher than the macrocell power densities atall locations (better QoS)It can be concluded that the installation of femtocell is not always recommended forshorter UL usage times andor better macrocell connection qualities it could beadvised to rely on the existing macrocell infrastructure Also when installing afemtocell its EIRP should be adjusted to the size and physical properties of thebuilding and should not be set at a needlessly high value
(a) (b)Figure 15 Comparison of the contributions to the whole-body EI for (a) indoor scenarios 1 and 2 in theconsidered building (b) indoor scenarios 1 and 2 in this building with 20 dB worse connection qualityTotal EI levels for each scenario are indicated with the horizontal line EI values are shown in Wkg
43 Data LTE macro urban scenario
431 Input variables linked to the network
The EI is evaluated from a macro-cellular LTE network in a real geographical area ndashpart of the 7th district of Paris (see Figure 16) The proposed scenario was previouslydefined in frame of the French ANR project ECOSCells [BCL12] and the EuropeanFP7 project FREEDOM (httpwwwict-freedomeu) for the simulation and analysis ofheterogeneous network topologies (hetNet) It is based on a real environment usingHigh Resolution (HR) map data realistic BSUE deployments and deterministicpropagation models
The macro layout is organized as three rings around a central three-sector sitemacro base stations being deployed with an inter-site distance of about 450 m in ahexagonal manner as shown in Figure 16
Document ID D26 Global Wireless Exposure Metric DefinitionFP7 Contract ndeg318273
Version V4 33Dissemination level PU
Figure 16 View of the macro-cell hexagonal deployment in the area
The study area (ie area where network performance is evaluated) is limited to thesurface covered by the three co-located central macro-cells and the first ring (Figure17) Thus the study area is equivalent to 12 macro-cells The base stations outsidethis study area are included in simulations to generate an accurate interferencepattern
Figure 17 Study area composed of 12 macro sites localised in the 7th
district of Paris France
Document ID D26 Global Wireless Exposure Metric DefinitionFP7 Contract ndeg318273
Version V4 34Dissemination level PU
The positions and heights of the base stations have been selected in realisticapproach sites are placed on slightly dominant rooftops and sector antennas aredistributed at the rooftop edges Directive antennas are used (with 3GPP radiationpattern) Each site is composed of three sectors oriented in azimuth directions 0deg120deg and 240deg with down-tilt 6degUsers are assumed to be uniformly distributed in the study area an indoor ratio setsthe percentage of users located inside buildings at the ground floorThe specifications of input parameters are summed up in Table 9
Environment Typical European Dense Urban environment (Paris VII district France)
System
Downlink (DL) and Uplink (UL)
LTE FDD 2 x 10 MHz
Central frequency 2600 MHz
Macro layout
Hexagonal sitedeployment
37 sites corresponding to 83 macro cellsincluding 12 sites in the center of the studyarea Inter-site distance (ISD) of 450 m
Nominal transmitpowerEPRE
40 W 228 dBm
AntennaDirectional with 14 dBi gain 6deg electric down-tilt 2 antennassector Average antennaheight 30 m above ground
Noise figure 25 dB
UL power control (openloop)
Path loss compensation factor 1SINR target 208 dB
UserEquipment
MaxMin transmit power 23 dBm -40 dBm
AntennaOmni-directional with 0 dBi gain 2antennasuser device Antenna height 15 mabove ground
Noise figure 9 dB
User traffic
Average active userdensity
Depends on daynight
DistributionUniform spatial distribution within thesimulation area Single floor (at 15 m height)No user mobility
Table 9 Inputs in SIRADEL simulator
432 Input variables linked to the population
Category of population
The population density of the 7th District of Paris was estimated at 14 36050
inhabitants per kmsup2 in 2009 [Carte09]
We are considering the population above 15 years old
Given the population distribution by age (Figure 18) it was decided to divide the adult
population into 3 categories young people (between 15 and 29 years) adults
Document ID D26 Global Wireless Exposure Metric DefinitionFP7 Contract ndeg318273
Version V4 35Dissemination level PU
(between 30 and 59 years) and seniors (over 60 years) Table 10 shows the
percentages of people in each category
Figure 18 Population distribution by age in Paris 7th district in 2007
Population category Pourcentage(prop)
Adults (30-59 yo) 45
Young people (15-29 yo) 26
Seniors (+60 yo) 29
Table 10 Number of people in each population category
Time periods
A 24-hour day is divided into two periods the day from 8 am to 6 pm (10 hours in
total) and the night from 6 pm to 8 am (14 hours in total)
Environment
Time spent indoor or outdoor on an average day for each category is extracted from
Table 2
Usage
Only data traffic is considered The device is assumed to be a mobile phone whilethe user is in a standing posture Considering the existence of 4 telecom operators inFrance only 25 of the 7th district population is assumed to be using this LTE macronetwork In this example we consider two user profiles moderate user and non-userFor each population category we derived from [Bigot et al 2013] the proportions ofusers and non-users of mobile phones for data traffic (see Table 11)
User profileYoung people (15-29
yo)Adults (30-59 yo) Seniors (over 60 yo)
non-users 33 57 91
Document ID D26 Global Wireless Exposure Metric DefinitionFP7 Contract ndeg318273
Version V4 36Dissemination level PU
users 67 43 9Table 11 Repartition of users and non-users for each population category
For simplicity the parameters for the moderate user profile are applied to all userswe assume a daily data traffic per active user of 66 MB [CISCO13] a DLUL ratio of9010 (this ratio was evaluated from data collected through measurements ofKPIs by sensors inside the French Orange network) and a daynight ratio of4357 From [CISCO13] only 29 of connections in 2013 were on 4GReference SAR values were extracted from Table 4 and Table 5
433 Transmitted power ഥ and received power density ത calculationܖ
Incident ோpower densities and transmittedത powers were calculated by usingthe network planner simulation tool Volcano Suite (Siradel France)Figure 19 andFigure 20 illustrate respectively the average UE Tx power calculated over the 7thParis district during the day and the average incident power density evaluated duringthe day or the night (values during the day or the night time were quasi identical)
Figure 19 Map of the average UL Tx power (dBm) calculated indoor at ground floor and outdoorduring the day (on the left) and map of daily average transmission duration (s) (on the right)
Figure 20 Map of the average DL incident power density (dBμVm) calculated indoor at ground floor and outdoor during the day or the night
Because the average active LTE user density is very low (41 userskm2consequence of the 29 LTE connections assumption) the DL user traffic utilises
Document ID D26 Global Wireless Exposure Metric DefinitionFP7 Contract ndeg318273
Version V4 37Dissemination level PU
less than 1 of available resources which strongly impact the predicted DL incidentpower density We can see in Figure 19 (left figure) that the calculated average Txpower is minimum in outdoor areas in the vicinity of the base stations or in Line ofSight (LOS) while it is at a maximum indoors and outdoors far away from the basestations The right map in Figure 19 gives the average communication durationwhich directly impacts the calculation of the UL exposure contribution The better thelink performance is the higher the throughput and thus the longer thecommunication duration That is why the longest durations are observed indoors andparticularly in the building parts that suffer from the strongest propagation lossesFigure 20 shows that the strongest DL incident power density levels are predicted inLOS areas while much lower levels are observed inside the buildings where mostpopulation is located
434 Exposure index calculation
Aggregating everything we obtain the following value for the EI (based on the Whole-body SAR) of the over 15 years old population of the 7th district of Paris consideringa macrocell LTE network EIWBSAR = 31910 -7 Wkg
44 Using dosimeters for the EI evaluation
This section provides an evaluation of the downlink and uplink exposure indexes fora subject wearing a reference isotropic dosimeter on the head together with fivedosimeters at different locations of the body as well as two mobile terminals Thesubject is moving in a multipath environment including a 3-sector LTE base station
When modelling the radio link between the user devices and the base station oneconsiders the influence of the body (ie body coupling [MaOC12] and bodymovements (using realistic body motion capture tools [MaCo13]) and accounts forthe propagation environment using a geometrically based statistical channel (GBSC)model (ie multipath propagation) Therefore the modelling of the radio channel hasbeen separated into several steps as described in [Mack13] Figure 21
Document ID D26 Global Wireless Exposure Metric DefinitionFP7 Contract ndeg318273
Version V4 38Dissemination level PU
Figure 21 Model for EMF assessment from dosimeter data
The simulated scenario Figure 22 considers a reference isotropic dosimeter on thehead of the user (simulating the real body exposure) together with five wearabledosimeters These dosimeters allow the downlink exposure assessment The user isalso carrying two mobile terminals allowing to assess the uplink exposure
Figure 22 Placement of wearable dosimeters and mobile terminals on the body
For the downlink the received (Rx) power ோ௫ at the mobile terminal (ordosimeter) is calculated from
ோ௫[ౚ ]= ௌ[ౚ ]
minus ௧௧[ౚ]ܮ (6)
where ௌ base station (BS) transmitted (Tx) power ௧௧ܮ total path loss including gains of mobile terminal (or
dosimeter) and BS
The received power density ோ௫ at the mobile terminal (or dosimeter) iscalculated from
ோ௫ ୫ మ൧=
ோ௫[ ]
ܣ మ൧
(7)
where ܣ is the mobile terminal antenna effective area
ܣ ୫ మ൧=ଶ[ߣ ]
ߨ4ோ௫[ౚഠ]ܩതതതതതതതതത (8)
where wavelength ோ௫തതതതതܩ average gain of the receiving antenna (ie dosimeter probe) in
off body direction (eg half-hemisphere of the gain pattern ieߠ isin [minus9090]deg and isin [minus9090]deg)
ோ௫[ౚഠ]ܩതതതതതതതതത=
1
ఏఝ ோ௫[ౚ]ܩ
ߠ) )
ேക
ୀଵ
ேഇ
ୀଵ
(9)
where ఏ and number of elevation (ߠ) and azimuth () directions
The exposure index for the DL ܫܧ can be determined from [LEXNET D24 2013]
Document ID D26 Global Wireless Exposure Metric DefinitionFP7 Contract ndeg318273
Version V4 39Dissemination level PU
[୩]ܫܧ = ௪ܣ
|ଵ ୫ మ[୫ మ୩]
times ோ௫[ ୫ మ]times [ୱ]ݐ (10)
where ௪ܣ
|ଵ ୫ మ normalised whole body averaged SAR coefficient per
1 Wm2 of Rx power density as indicated in [LEXNET D24 2013] ݐ time of the exposure from BS
ோ௫ average Rx power density during period ݐ
For the uplink the required Tx power from the mobile terminal is determined from ௫[୫ ]
= ௌ[୫ ]+ ܫ ௧௧[]
+ ܯ [] + ௧௧[]ܮ (11)
where ௌ noise and interference level at the BS ܫ ௧௧ target SINR at the BS
ܯ fading margin for a dynamic usage ௧௧ܮ total path loss including gain of MT and BS
ௌ is calculated asௌ[୫ ]
= minus174[୫ ] + 10logଵ(ܤ[ୌ]) + ி[]+ []ܫ (12)
where ܤ bandwidth ி noise figure ܫ interference
The EI for the UL ܫܧ can be determined from [LEXNET D24 2013]
[୩]ܫܧ = ௪ܣ
|ଵ [ଵ୩]times ௫[ ]
times [ୱ]ݐ (13)
where ௪ܣ
|ଵ whole body averaged SAR coefficient per 1 W of Tx poweras indicated in [LEXNET D24 2013]
ݐ time of the exposure ( duration of the mobile terminal usage)
௫ average Tx power during period ݐ
A macro cell outdoor street scenario has been considered including a set of 10clusters of 3 scatterers each with a Uniform Distribution in the half space of anellipsoid A 3-sector base station antenna is located in the middle of the street atx=100 m The user is moving on a straight line in the middle of the street (ie y=10m xisin[50 150] m) Figure 23
Document ID D26 Global Wireless Exposure Metric DefinitionFP7 Contract ndeg318273
Version V4 40Dissemination level PU
Figure 23 Scenario
The parameters of the scenario are presented in Table 12 being worthwhile to noticethat the values of ௪ܣ
and ௪ܣ are taken from preliminary SAR simulations The
calculated noise and interference level at the BS is ௌ= -12774 dBm
System
Frequency [MHz] 2600
[HoTo11]ܤ
Resource Block [kHz] 15
Full [MHz] 20
Full LTE-A [MHz] 100
Downlink
EIRP BS Tx power [dBm] 46 [LEXNET D23 2013]
ோ௫ܩ [dBi] 122 [LEXNET D32 2014]
ݓܣ|ܮܦ
1Wm2[m2kg] 300
Uplink
ܫ ௧௧[dB] 208 [HoTo11]
ி [dB] 25 [LEXNET D23 2013]
[dB]ܫ 8 [HoTo11]
ܯ [dB] 30 [Mack13]
ݓܣ|ܮ
1W[1kg] 495
Table 12 Scenario overview
Figure 24 illustrates the considered macro cell base station antenna and thedosimeter realised gain patterns
(a) BS with 3 sectors (b) Dosimeter on the bodyFigure 24 Realised gain pattern
Document ID D26 Global Wireless Exposure Metric DefinitionFP7 Contract ndeg318273
Version V4 41Dissemination level PU
441 EI for downlink
The average Rx power density obtained from the isotropic reference probe and thedosimeter located at WA_L and WA_R is presented in Figure 25 The received powerdensity at WA_L dosimeter is very similar to the one gathered at the isotropic probewhich mainly comes from the similar Line-Of-Sight (LOS) propagation conditions Thepower received in WA_R dosimeter is much lower due to the body shadowing
Figure 25 Rx power density at selected positions
The distribution of the Rx power density is presented in Figure 26 In spite of thebody shadowing the distribution of the Rx power density at the WA_R dosimeter ismuch similar to the ones for the reference and the WA_L dosimeters All of themfollow an exponential decay which should be subject to further investigation
(a) isotropic (b) WA_L (c) WA_R
Figure 26 Rx power density histograms
The received power density and the downlink exposure index calculated based onthe measurement of the dosimeters located in the various locations on the body arepresented in Table 13
ோ௫ [mWm2] ܫܧ [mJkg]
isotropic 35868 2690
WA_F 18357 1377
WA_B 29538 2215
Document ID D26 Global Wireless Exposure Metric DefinitionFP7 Contract ndeg318273
Version V4 42Dissemination level PU
WA_L 28516 2138
WA_R 9060 680
TO_F 18436 1383
Table 13 Downlink Exposure
The WA_L dosimeter and the isotropic probe exposure indexes are very similarbecause of the LOS propagation conditions The same is valid for the WA_Bdosimeter which is also in LOS with the base station For the other dosimeters theexposure index is naturally lower due to the body shadowing In this scenario theuse of a wearable dosimeter in the front or in the right side of the body displays anexposure index reading about 4 times lower than the real user exposure
442 EI for uplink
The average Tx power from the mobile phone hold near HE_L and HE_R ispresented in Figure 27 The uplink power control is clearly noticeable by the highertransmitted power in HE_R as the mobile terminal adjusts the Tx power tocompensate for the higher channel fading
Figure 27 Tx power for straight6min scenario at 2600 MHz for LTE-A
The distribution of the Tx power at HE_L and HE_R is presented in Figure 28 Inspite of the different intensities HE_L and HE_R Tx powers present a similardistribution
Document ID D26 Global Wireless Exposure Metric DefinitionFP7 Contract ndeg318273
Version V4 43Dissemination level PU
(a) HE_L (b) HE_R
Figure 28 Tx power histograms
The average transmitted power and the uplink exposure index from the mobileterminals located near left and right side of the head ( e HE_L and HE_R) arepresented in Table 14
௫ [mW] ܫܧ [mJkg]
RB FULL FULL_A RB FULL FULL_A
HE_L mobile 002 165 827 003 295 1474
HE_R mobile 008 838 4191 014 1493 7468
Table 14 Uplink Exposure
These results show the importance of the propagation conditions in the EMFexposure Due to the non LOS conditions the exposure index in the right side of thehead is 5 times higher than the one on the left side
5 CONCLUSION
In this deliverable a global metric is defined to test and optimize wirelesstelecommunication networks in terms of EMF exposureThe proposed metric called Exposure Index (EI) has the advantage to overpass thelimitations of the actual metrics that in fact are managing separately the exposureinduced by personal devices and the one induced by the network equipment (basestations and access points) But devices base station antennas and access pointsare definitely parts of the same wireless environment and the global wirelessexposure is induced by all of them
The EI is described with an analytical model with input variables describing thecoverage area of interest the accessible networks the population and the habits interms of location and of wireless devices usage The output is the EI covering theday-to-day averaged exposure of population in a given area incurred by an entirewireless network from base stations and access points to individual devices
In this deliverable the analytical model of EI has been detailed and the inputvariables defined Then the use of the EI to minimize the EMF exposure in wirelesscommunication networks is presented in connection with work-package 4 dedicated
Document ID D26 Global Wireless Exposure Metric DefinitionFP7 Contract ndeg318273
Version V4 44Dissemination level PU
to innovative radio components and work-package 5 focused on networks topologiesand technologies
The way to process a complete calculation of EI is illustrated on three deterministicexamples The first example considers comparison of indoor 3G macro and femtoscenarios The second example is taking into account an adult population in a LTEmacro urban environment with their data usage specifications Both examples arebased on a real environment representation and network simulation tools have beenused to simulate the up and down links The third example illustrates how dosimetermeasurements can be used to assess the EI
In our further work the statistical description of input variables will enable topropagate the variability and the uncertainty in the EI model making it more accurateand reliable Results will be made available in the future deliverable D28 DeliverableD33 will detail the used methodology to assess the EI and for the last year of theproject the work of partners involved in WP6 will be enhanced as they will be incharge of the implementation and evaluation of the EI
Document ID D26 Global Wireless Exposure Metric DefinitionFP7 Contract ndeg318273
Version V4 45Dissemination level PU
6 REFERENCES
[ALIAGA06] Aliaga C How is the time of women and men distributed
in Europe Statistics in focus population and social
conditions April 2006
[APVJM13] Aerts S Plets D Verloock L Joseph W and MartensL Assessment and comparison of RF-EMF exposure infemtocell and macrocell scenarios Radiat Protec Dosim2013
[BCL12] Brau M Corre Y Lostanlen Y Assessment of 3D
network coverage performance from dense small-cell LTE
Communications (ICC) 2012 IEEE International
Conference on
[Carte09] httpwwwcartesfrancefr
[CISCO13] Cisco Visual Networking Index Global Mobile Data Traffic
Forecast Update 2012-2017 February 2013
[CHLWW08] ConilE Hadjem A Lacroux F Wong M F and Wiart J
Variability analysis of SAR from 20 MHz to 24 GHz for
different adult and child models using finite-difference
time-domain Phys Med Biol vol 53 pp 1511-1525
2008
[CHRIST10] Christ A Kainz W Hahn E G Honegger K Zefferer
M Neufeld E Rascher W Janka R Bautz W Chen
J Kiefer B Schmitt P Hollenbach H-P Shen J
Oberle M Szczerba D Kam A Guag J W amp Kuster
N The Virtual Family--development of surface-based
anatomical models of two adults and two children for
dosimetric simulations Phys Med Biol vol 55 pp 23-38
2010
[CMKB06] Cooper TG Mann SM Khalid M and Blackwell RP
Public exposure to radio waves near GSM microcell and
picocell base stations Journal of the Society for
Radiological Protection Vol 26 No 2 pp 199-211 June
2006
[GCWW10] Gati A Conil E Wong MF Wiart J Duality between
uplink local and downlink whole body exposures in
operating Networks IEEE Transactions on EMC Vol 52
ndeg4 Nov 2010
Document ID D26 Global Wireless Exposure Metric DefinitionFP7 Contract ndeg318273
Version V4 46Dissemination level PU
[HoTo11] Hola HG And Toskala A LTE for UMTS Evolution to
LTE-Advanced Wiley UK 2011
[INFORMA12] Informa telecom amp Media Small Cell Market Update June
2012
[INSEE11] Insee enquecircte Emploi du temps 2009-2010 Insee
Premiere Ndeg 1377 November 2011
[IST] httpwwwist-winnerorg
[KALLIOLA02] Kalliola K Sulonen K Laitinen H Kiveks O Krogerus J
Vainikainen P Angular power distribution and mean
effective gain of mobile antenna in different propagation
environments IEEE Trans Veh Technol vol 51 pp 823ndash
838 2002
[KIENTEGA11] Thierry Kientega EConil A Gati A Hadjem ERichalot M-F Wong OPicon Joe Wiart Analysis of thedistribution of specific absorption rate induced by fiveplane waves with a fast and new method in VisibleHuman URSI conference 2011
[LAUER13] Lauer O Frei P Gosselin M C Joseph W Roumloumlsli M
and Froumlhlich J Combining near- and far-field exposure for
an organ-specific and whole-body RF-EMF proxy for
epidemiological research a reference case
Bioelectromagnetics vol 34(5) pp 366-74 2013
[LEXNET D21 2013] Vermeeren G Thielens A Aerts S Joseph W
Martens L Oliveira C Mackowiak M Correia LM
Pejanovic-Djurisic M Veljovic Z Nešković A
Koprivica M Gati A Varsier N Hadjem A Wiart J
ConilE ldquoD21 Current metrics for EMF exposure
evaluationrdquo LEXNET project April 2013
[LEXNET D22 2013] Wiedemann P M Freudenstein F ldquoD22 Risk and
exposure perceptionrdquo LEXNET project July 2013
[LEXNET D23 2013] Vermeeren G Plets D Joseph W Martens L Conil E
Varsier N Wiart J Corre Y Oliveira C Sebastiatildeo D
Correia LM Aguumlero R Diez L Rodriacuteguez L Koprivica
M Nešković A Popović M Milinković J Nikšić S ldquoD23
Scenariosrdquo LEXNET project November 2013
[LEXNET D24 2013] Conil E ldquoD24 Global Wireless Exposure Metric
Definitionrdquo LEXNET project October 2013
Document ID D26 Global Wireless Exposure Metric DefinitionFP7 Contract ndeg318273
Version V4 47Dissemination level PU
[LEXNET D32 2014] BoriesS (ed) ldquoD32 Wideband dosimeter design study amp
performances characterizationrdquo LEXNET project July
2014
[LEXNET D41 2013] Bories S Fang Y Brown TBegaud X Pinto Y Ciblat P
Ksairi N De Domenico A Clemente A Fernandez Y
Lalam M Masera E Wilson M Tesanovic M Kocan E
Pejanovic-Djurisic M Veljovic Z Milatović B Popović M
Nešković A Koprivica M Voinescu A Dragomir D
Slusanschi E laquo D41 Promising Low Exposure Index
Solutions for Components and Transmission
Techniques raquo LEXNET project November 2013
[LEXNET IR21 2013] ldquoNumerical toolsrdquo LEXNET project July 2013
[LEXNET IR51 2013] ldquoSmart low-EMF architectures state of the art and way
forwardrdquo LEXNET project May 2013
[LEXNET D25 2014] Wiedemann P M Freudenstein F ldquoD25 Risk and
exposure perceptionrdquo LEXNET project November 2014
[LEXNET D42 2014] Bories S Fang Y Brown TBegaud X Pinto Y Ciblat P
Ksairi N De Domenico A Clemente A Fernandez Y
Lalam M Masera E Wilson M Tesanovic M Kocan E
Pejanovic-Djurisic M Veljovic Z Milatović B Popović M
Nešković A Koprivica M Voinescu A Dragomir D
Slusanschi E laquo D42 Performance Evaluation of Low
Exposure index solutions for components and
Transmission Techniques raquo LEXNET project November
2014
[MaOC12] Mackowiak M Oliveira C and Correia L M RadiationPattern of Wearable Antennas A Statistical Analysis of theInfluence of the Human Body International Journal ofWireless Information Networks Vol 19 No 3 pp 209-218 2012
[MaCo13] Mackowiak M and Correia L M Statistical Model of theInfluence of Body Dynamics on the Radiation Pattern ofWearable Antennas in Off-Body Radio ChannelsWireless Personal Communications 101007s11277-013-1193-x May 2013
[Mack13] Mackowiak M Modelling MIMO Systems in Body AreaNetworks in Outdoors PhD Thesis IST - University ofLisbon Lisbon Portugal 2013
Document ID D26 Global Wireless Exposure Metric DefinitionFP7 Contract ndeg318273
Version V4 48Dissemination level PU
[NAGAOKA08] Nagaoka T and Watanabe S Postured voxel-based
human models for electromagnetic dosimetry Physics in
medicine and biology vol 53 pp 7047-7061 2008
[PLETS12] Plets D Joseph W Vanhecke K Tanghe E and Martens
L 2012 Coverage Prediction and Optimization Algorithms
for Indoor Environments EURASIP 2012123
[PLETS14] Plets D Joseph W Aerts S Vanhecke K and Martens L
accepted 2014 Prediction and comparison of downlink
electric-field and uplink localized SAR values for realistic
indoor wireless planning Radiation Protection Dosimetry
[SaNC10] SaloJ Nur-AlamM and ChangK Practical Introduction
to LTE Radio Planning white paper European
Communications Engineering (ECE) Ltd Espoo Finland
Nov 2010 (wwweceltdcom)
[TAFLOVE00] Taflove A and Hagness S C 2000 Computational
Electrodynamics The Finite-Difference Time-Domain
Method 2nd edn (Boston MA Artech House Publishers)
[TNS10] TNS Sofres survey Observatoire Socieacutetal du teacuteleacutephone
mobile Dec 2010
[VAJM13] Vermeeren G Aerts S Plets D Joseph W Martens
LConil E Varsier N Wiart J Core YOliveira C Sebastiatildeo
DCorreia L Aguumlero R Diez L Rodriacuteguez L Koprivica M
Nešković A Popović M Milinković J Nikšić S D23
Scenarios LEXNET project Novembre 2013
[WIART08] Wiart J Hadjem A Wong M F and Bloch I Analysis of
RF exposure in the head tissues of children and adults
Physics in medicine and biology vol 53 pp 3681-3695
2008
[WINNER D112 2007] Kyoumlsti P et al D112 WINNER II Channel models
WINNER project September 2007
[ZHAO02] Zhao X Kivinen J Vainikainen P Skog K Propagation
characteristics for wideband outdoor mobile
communications at 53 GHz IEEE J Sel Areas Commun
vol 20 pp 507ndash514 2002
Document ID D26 Global Wireless Exposure Metric DefinitionFP7 Contract ndeg318273
Version V4 49Dissemination level PU
APPENDIX 1 NUMERICAL DOSIMETRIC SIMULATIONS
This appendix describes the main assumptions concerning the frequency bands used
in the numerical dosimetric simulations
Table A1 gives the frequency bands used for SAR simulations as well as theservices and DLUL frequencies considered in each of those frequency bands forLEXNET studies Note that at these frequencies (especially at the higher ones) nolarge differences are expected between SAR results [CHLWW08] Accordingly forthe sake of simplicity it is assumed that
the same frequency band is assumed for both up- and down-link each frequency band may cover more than one system (eg simulation at
1940 MHz covers both GSM1800 and UMTS2000)
Table A1 Technical specifications for LEXNET selected services
SAR
simulation
frequency
band [MHz]
RAT
RAT frequency band [MHz]
DL UL
400 LTE 400 380 - 470
900
LTE 800 875- 885 830 - 840
GSM 900 935 - 960 890 - 915
UMTS 900 925 ndash 960 880 ndash 915
1940
GSM 1800 1805 - 1880 1710 - 1785
UMTS 2000 2110 - 2170 1900 - 1980
2600WiFi bgn 2400 - 2484
LTE 2600 2620 - 2690 2500 - 2570
For the WiFi an between 5470 and 5725 MHz frequency bands no SAR simulation
was performed yet
Document ID D26 Global Wireless Exposure Metric DefinitionFP7 Contract ndeg318273
Version V4 50Dissemination level PU
APPENDIX 2 INTERNAL REVIEW
Reviewer 1 Yoann Corre Reviewer 2 Mick Wilson
Answer Comments Type Answer Comments Type
1 Is the deliverable in accordance with
(i) the Descriptionof Work
Yes
No
M
m
a
Yes
No
M
m
a
(ii) the internationalState of theArt
Yes
No
M
m
a
Yes
No
M
m
a
2 Is the quality of the deliverable in a status
(i) that allows tosend it to EC
Yes
No
M
m
a
Yes
No
M
m
a
(ii) that needsimprovement ofthe writing bythe editor of thedeliverable
Yes
No
See proposedenhancements
In particular thepresentation of the basic EIconcept could be improvedin the Abstract Introductionsection 21 and Conclusion
M
m
a
Yes
No
See comments onSection 3
M
m
a
(iii) that needsfurther work bythe partnersresponsible forthe deliverable
Yes
No
Mostly minor changes Seethe proposedenhancements
Section 44 is a copy-pastof a whole section in D33Either D26 or D33 must bechanged to avoidredundancy (replacing thewhole description by asummary adapted to theintegrated deliverable)
It must be made more clearwhere the reader will findthe missing SAR data andthe announced uncertaintystudy results
M
m
a
Yes
No
M
m
a
Type of comments M = Major comment m = minor comment a = advice
Document ID D26 Global Wireless Exposure Metric DefinitionFP7 Contract ndeg318273
Version V4 8Dissemination level PU
Figure 2 Worldwide small cells deployment forecast - Source Informa Telecom amp Media
But paradoxically as the role of wireless communications in the daily life quicklyexpanded the public concern around EMF health risk grows just as much An in-depth survey has been conducted in the framework of LEXNET Data was collectedfrom April to June 2013 in France Germany Portugal Spain Romania Montenegroand Serbia using an online survey tool A total of 2392 respondents participated inthis survey (mean age 3482 years gender distribution 40 female and 60 male)The first part of the survey focused on the perceived sources of daily RF-EMFexposure of the respondents Additionally we were interested in the factors whichdetermine in their view the degree of EMF exposure Another part of the surveyregarded risk perception and health concernsOnly key findings are reported here but detailed description of the survey and of theresults is in the deliverable entitled ldquoD22 Risk and exposure perceptionrdquo [LEXNETD22 2013]
Regarding the perceived health hazards of various usage scenarios our respondentsevaluated base stations on a school roof as the most dangerous Using mobile phonefor calls is perceived as less dangerous a somewhat lower score characterizes thelaptop used on the lap The results of this survey indicate that risk perceptions of thegeneral public and the underlying health concerns are guided by subjective models ofEMF impact which underestimate near-field exposure and overestimate far-fieldexposure People are more concerned about base stations than about all other RF-EMF sources
Currently different metrics are used to deal with exposure induced by sources closeto the users as mobile phones and with exposure induced by far away sources asbase station antennasThe current state of existing metrics to evaluate the exposure induced by RF-EMFsources has been reviewed in the deliverable ldquoD21 Current metrics for EMFexposure evaluationrdquo [LEXNET D21 2013]
Document ID D26 Global Wireless Exposure Metric DefinitionFP7 Contract ndeg318273
Version V4 9Dissemination level PU
Basically two types of metrics are distinguished the ones dedicated to the exposureinduced by sources close to the users as personal devices and expressed in termsof Specific Absorption Rate (SAR) and the ones focusing on the exposure induced byfar field sources as access points or base station antennas and currently expressedin ElectricMagnetic fields or Power DensityPersonal devices and base stations are too often represented as two separate worldswhen dealing with exposure issue But the connection between exposure induced bypersonal devices and base stations is indisputable Measurements on real networksillustrate a strong correlation (Figure 3) between the power emitted by personaldevices and the power received by personal devices from the base station antennas[GCWW10]
Figure 3 Duality between mobile phones emitted and received powers measured duringvoice calls on the 3G Orange France network - source [GCWW10]
The project LEXNET aims at filling the gap between these two separate ways ofdealing with exposure by proposing a new exposure metric named Exposure Index(EI) The EI is assessing the average exposure of a population induced by bothpersonal devices and base stations (or access points) The concept is to average thisglobal exposure over space by assessing the EI in a given area and average it overtime by considering a given time frame Therefore an important question that theproject must absolutely address is about the understandability and acceptability ofthis new exposure metric by the general publicA second survey has been therefore conducted in the framework of LEXNET Datawere collected from July to September 2014 in France Germany United KingdomPortugal Spain Romania and Serbia among a representative sample of the generalpopulation A total of 1809 respondents participated in this second surveyAn important part of the survey focused on how people are considering strategiesproposed in the framework of the LEXNET project to define and minimize thepopulationrsquos exposure to electromagnetic fieldsOnly key findings are reported here but detailed description of the survey and of theresults is in the deliverable entitled ldquoD25 Risk and exposure perceptionrdquo [LEXNETD25 2014]
-60 -40 -20 0 20 40
-120
-100
-80
-60
-40
Emitted power by devices (dBm)
Rec
eive
dpo
wer
by
devi
ces
(dB
m)
GSM 900
GSM 1800
UMTS 2100
Document ID D26 Global Wireless Exposure Metric DefinitionFP7 Contract ndeg318273
Version V4 10Dissemination level PU
When asked about adding up the exposure from personal wireless devices and theexposure from base stations when evaluating the exposure of people to EMF morethan 90 of respondents agreed on the fact that both downlink and uplink exposuresshould be considered when evaluating the population exposure to EMFA large percentage of respondents also agreed when asked if it makes sense tocharacterize the day-to-day exposure to EMF by averaging it over time or if they thinkthat an individual exposure to EMF can be approximated by measuring the exposureover a large population
The next chapter of this deliverable describes the Exposure Index proposed by theproject LEXNET
Document ID D26 Global Wireless Exposure Metric DefinitionFP7 Contract ndeg318273
Version V4 11Dissemination level PU
2 THE EXPOSURE INDEX
21 Key concept
The Exposure Index (EI) takes into account the global EMF exposure of apopulation to a given wireless telecommunication network (or a set of networks)The EI does not take into account the exposure induced by other RF sourcessuch as Frequency Modulation (FM) radio or digital terrestrial televisiontransmittersIt covers the exposure of a population during a given time frame in a given areaincurred by a wireless telecommunication network as a whole aggregating thedownlink exposure induced all day long by base stations and access points andthe uplink exposure incurred by individual wireless communication devices Theuplink exposure can be subdivided in exposure due to the uplink of the userrsquos owndevice and the uplink of devices operated by other users nearbyIn order to assess the realistic exposure of a population many parametersinfluencing the exposure need to be taken into account in the Exposure Indexage (adult and child exposure are different [CHLWW08] [WIART08]) posture[NAGAOKA08] usage technology environment etchellip
In a nutshell the LEXNET Exposure Index is a function transforming a highlycomplex set of data into a single parameter which has two key benefits it isunderstandable acceptable and usable for all the stakeholders from generalpublic to regulatory bodies and it is linked in a tangible way to the networkoperating parameters
The EI is built from the aggregation of individual exposure contributions generatedby a specific exposure source in specific exposure situations For instance anaveraged individual exposure generated by WiFi 24 GHz can be calculated atday time for an adult heavy-user located indoors sitting and with a tablet Thesame kind of individual exposure is estimated for other time periods RATspopulations environments usages and postures to get complete elements thatcompose the EI The individual exposure contributions are weighted according totheir representativeness before aggregationThe individual exposure is the sum of a down-link (DL) and up-link (UL)components as explained with more details in section 221
The EI is computed in a given area from the aggregation of individual exposurecontributions in a chain of exposure (see Figure 4) The nodes in this chain arerelated to different exposure sources or exposure situationsbull the time periods as the configuration of the network and type of usage depend
on the time of day (low-load night-time vs heavily loaded peak-hour)bull the population as different population categories will have different life
segmentations and different usages of wireless devicesbull the user profilebull the different locations as the exposure configurations will be different in
different environments
Document ID D26 Global Wireless Exposure Metric DefinitionFP7 Contract ndeg318273
Version V4 12Dissemination level PU
bull the radio access technologies RATs (GSM UMTS LTE WiFi etc)frequency bands and deployment layers (macro micro and femto cells) thatusers connect to
bull the posture as different body postures will lead to different absorption rates inthe human body
bull the device usage (making a phone call does not lead to the same exposure asdownloading data)
Figure 4 the LEXNET chain of exposure
Different exposure scenarios [LEXNET D23 2013] are considered and aggregatedby putting weights on each configuration thereby determining the EI A partial EI canbe for example computed for a scenario that considers only a subset of RATspopulation environment etc Then several partial EI can be aggregated with aweight related to their representativenessEI takes into account all these parameters coming both from the telecom world todescribe the accessible network environment and from data on how people segmenttheir life to describe how people are using this network
22 Mathematical formalization
221 Exposure Index Equation
The Exposure Index is calculated for a finite geographical area which can be ofurban suburban or rural type for instanceThe general formulation of the Exposure Index contains a set of technicalparameters as described below The number of values classes or settings ofeach parameter depends on the level of detail of the available data and on thelevel of achievable complexity in terms of calculation For a given geographicalarea the EI takes the following into account (see also Table 1)
the time period (t) eg day and night
Document ID D26 Global Wireless Exposure Metric DefinitionFP7 Contract ndeg318273
Version V4 13Dissemination level PU
the population (p) segmented into different categories eg children (under15 yo) young people (15-29 yo) adults (30-59 yo) and seniors (60 yoand over)
the user load profiles (l) eg heavy medium light or non-users the environment (e) eg indoor (office home) outdoor and in commuting
(bus car subway etchellip) the different available Radio Access Technologies (RATs) (r) eg 2G (900
MHz and 1800 MHz) 3G 4G WiFi the number of RATs depends on thescenario
the different cell types (c) eg macro micro pico and femto cells theaccessibility to the different cell types depends on the scenario
the posture (pos) eg sitting standing the usage (u) is described by the device (eg mobile PC laptop) and the
usage (eg voice call data)
Time PopulationUser
ProfileEnvironment RAT Cell Type Posture Usage
Day Children Heavy Indoor 2G Macro Standing Voice mobile
Night Youngpeople
Medium Outdoor 3G Micro Sitting Data mobile
Adults Light Commuting 4G Pico Data Tablet
Seniors Nonuser
WiFi Femto Data Laptopon the laps
Data Laptopon the desk
Table 1 input variables in the modelling of the EI
The individual exposure contributions rely on the SAR expressed in Wkg The SARwill depend on the device the frequency band the morphology and the posture ofthe user as well as on the position and distance of the source with respect to theuser As part of LEXNET a set of numerical dosimetric simulations are performed inorder to fill out a comprehensive matrix of raw normalized SAR values These SARvalues can be whole-body or localized SAR values Whole-body SAR values areevaluated by averaging SAR over the whole-body whereas localized SAR values arevalues focusing on a body volume specific organ or tissue Different EI can beevaluated depending on the value of interest (whole-body or localized value)Network simulation tools will provide transmitted and received power average valuesto apply to the raw SAR matrixInformation and Communication Technologies (ICT) usage data obtained throughsensors inside the network and segmentation life data will finally provide the levels toapply for the evaluation of the EI
Document ID D26 Global Wireless Exposure Metric DefinitionFP7 Contract ndeg318273
Version V4 14Dissemination level PU
SARܫܧ =1
T
tperlcpos ൫ ത
൯
ே
௨
ேೞ
௦
ேಽ
ே
ேೃ
ேಶ
ேು
ே
௧
+ RXinc + ௦ௗ௩௦ோ௦ௗ௩௦
൨
(1)
where EISAR is the Exposure Index value the average exposure of the population of
the considered geographical area over the considered time frame T SARrefers to whole-body SAR organ-specific SAR or localized SAR
N is the number of considered periods within the considered time frame (egsingle day)
N is the number of considered Population categories N is the number of considered Environments N is the number of considered Radio Access Technologies Nେ is the number of considered Cell types N is the number of considered user Load profiles N୮୭ୱ is the number of considered Postures
N is the number of considered Usages with devices Pഥଡ଼ is the mean TX power transmitted by the usersrsquo devices during the period
t in usage mode u connected to RAT r in environment e For example whenEI is computed from simulation tools the TX power can be predicted over amap that covers the whole considered geographical area and the averagevalue is extracted for the EI evaluation See details in section 223
Sത ଡ଼୧୬ୡis the mean incident power density on the human body during the periodt induced by RAT r in environment e A distribution of the incident powerdensity for the whole considered geographical area is considered and theaverage value over this area is taken into account for the EI evaluation
ோ௦ௗ௩௦ is the incident power density on the human body during the
period t induced by a wireless device connected to RAT r of a user in theproximity in environment e This term is important when the exposed personis the user itself it can also be significant for persons in the proximity of usersof a wireless device for instance in a crowded meeting room in publictransportation etc In the applications discussed in this paper this term is
neglected We also remark that ோ௦ௗ௩௦ depends on the orientation of
the user of the wireless device with respect to the body of the people in itsproximity See details in section 223
d (ௐ ௦
) ௦ௗ௩௦ (
ௐ ௦
ௐ
మ) and dୈ (ௐ ௦
ௐ
మ ) are the normalised
raw dose values for UL the DL from the user in the proximity and DL frombase stations and access points respectively all multiplied by the time spentin the configuration See details in section 222
Document ID D26 Global Wireless Exposure Metric DefinitionFP7 Contract ndeg318273
Version V4 15Dissemination level PU
f୲୮ ୪ୡ୮୭ୱ is the fraction of the total population that corresponds to population
category p user load profile l in posture pos connected to RAT r for a celltype c in environment e during the time period t
In the following we explain the different terms used in the EI formula in more detail
222 Coefficients and
The coefficient is associated to the exposure induced by the uplink andexpressed as an absorbed dose normalised to a transmitted power of 1 W
[ୱ୩
]
=௧௨௦[ୱ]ܦ
௨௦[ܣ ୩]
[ ]
Ws
kgW൨ (2)
where ௧௨௦ܦ
is the time duration of usage ݑ and a user profile load when
connected to the RAT ݎ operating in cell type in the environment for thepopulation category in the posture pos during the time period of the day ݐ
ௌோೠೞ
ಽ
can be the whole body or an organ-specific or tissue-specific
valueܣ for the usage ݑ and the posture pos in the frequency band of theRAT ݎ and the population category calculated for an incident emitted power
of
and normalized to this power
The coefficient is associated to the exposure induced by the downlink and alsoexpressed as an absorbed dose normalised to an incident power density of 1 Wm2
[ୱ୩
]
=௧௦[ୱ]ܦ
௦[ܣ ୩]
RX[W]inc
ݏ
ଶ ൨ (3)
where ௧௦ܦ
is the time duration of posture ݏ when connected to the RAT ݎ
operating in cell type in the environment for the population during thetime period of the day ݐ
ௌோೞ
ವಽ
ௌೃ can be the whole body or an organ-specific or tissue-specific
valueܣ induced by the base station or access points of the RAT ݎ in thepopulation for the posture ݏ normalized to the received power density
ோ
223 Transmitted power ഥ and received power density ത ܖ
ത is the average power transmitted by the device in busy mode (in active
communication) It should be noted that even in idle mode (not for activecommunication) the devices transmit from time to time some power (to stay
Document ID D26 Global Wireless Exposure Metric DefinitionFP7 Contract ndeg318273
Version V4 16Dissemination level PU
synchronized with the network for example) but the exposure induced by the devicein idle mode is negligible as it is based on rare eventsSത୧୬ୡ is the average power density incident on the human body from the base stationsor access points of the RAT The incident power density is assessed not only forusers of mobile devices but also for non-users It is assumed that the usage patternof the user considered in the EI formula does not influence the average incidentpower density From a theoretical point of view Sത୧୬ୡ is the average incident powerdensity integrated over all the frequency bands of the RAT and cell type consideredFrom a practical point of view Sത୧୬ୡ can be assessed directly from spectrum analyzer(SA) measurements dosimeters simulations and indirectly from the received poweron a user device or in a drive test measurementത and Sത୧୬ୡ average out the instantaneous variations of the transmitted power and
incident power density that arise during a communication These variations occurwhen the user is static or moving over a very small distance and are caused bydifferent phenomenas (power regulation small-scale fading resource allocation usertraffic variations etc) Values that will be used in the EI evaluation are averagedvalues over the whole considered geographical area
For both the evaluation of the DL incident power density and UL transmitted powerthe ressource allocation or duty cycle of the system has to be taken into account TheEI computation does not rely on maximum allowed power values (as in existing EMFexposure procedures) but on the incident and transmitted powers that respectivelydepend on the DL network and UL user resource load This definition leads to anestimate of the UL transmitted power that necessarily depend on the type of usertraffic (eg voice web browsing file upload etc) the higher is the instantaneous ULthroughput during the communication the higher is generally the UL transmittedpower
224 Index computation data sources
The EI evaluation relies on the collection of a wide range of data from simulationtools literature models and measurement equipments that will be demonstrated inthe LEXNET technical work-packages All the input data that were collected and areused in the framework of the project will be stored in an internal document
For life segmentation data in particular up-to-date life segmentation surveyscollected in the different participated countries were used to extract information onhow different categories of population segment their daily lifes (see Table 2)[INSEE11] [ALIAGA06]
Populationcategory
Day (8 AM-6 PM) Night (6 PM- 8AM)
Indoor(office-school-home)
Outdoor
Transportation (bus car
subwayetchellip)
Indoor(home)
Outdoor
Transportation (bus car
subwayetchellip)
Adults8h15
(825)1h10
(115)35 min
(6)13h05 min
(935)20 min(25)
35 min(4)
Document ID D26 Global Wireless Exposure Metric DefinitionFP7 Contract ndeg318273
Version V4 17Dissemination level PU
Youngpeople
8h20(83)
1h10(115)
30 min(55)
13h10 min(94)
20 min(25)
30 min(35)
Children8h15
(825)1h30 (15
)
15 min(25)
13h45 min(985)
0 min
(0 )
15 min(15)
Seniors7h35(70)
2h10(275)
15 min(25)
13h05 min(935)
40 min(5)
15 min(15)
Table 2 Life segmentation inputs for evaluation of the Exposure Index
ICT Usage data (usage of mobile phones for voice call or data usage of tabletsPChellip) are obtained through measurements of Key Performance Indicators (KPIs) bysensors inside the network KPIs of interest for evaluating the EI are for each userthe uplink and downlink data traffic volumes the number of voice calls the durationof each voice call etchellip The network operators involved in the LEXNET project ieOrange (France) and Telekom Serbia (Serbia) as well as the operators fromMontenegro being partners of University of Montenegro provided such data
3G denseurban
Voice Data (82 DL 18 UL)
tcom (s) volULdata [kB] volDLdata [kB]
Heavy user
Day 841 4948 25124
Night 689 5879 31922
Medium user
Day 147 464 2390
Night 86 387 2001
Light user
Day 26 35 158
Night 16 28 124
Table 3 shows usage data that could be derived from KPIs obtained throughmeasurements in a 3G network
3G denseurban
Voice Data (82 DL 18 UL)
tcom (s) volULdata [kB] volDLdata [kB]
Heavy user
Day 841 4948 25124
Night 689 5879 31922
Medium user
Day 147 464 2390
Night 86 387 2001
Light user
Day 26 35 158
Document ID D26 Global Wireless Exposure Metric DefinitionFP7 Contract ndeg318273
Version V4 18Dissemination level PU
Night 16 28 124Table 3 Average communication durations and data traffic volumes per user profile for a 3G
dense urban network
Reference SAR data were computed using 3D electromagnetic simulation platformsbased on the Finite Difference Time Domain (FDTD) method [TAFLOVE00] SARvalues were calculated for far-field and near-field exposure for two anatomical humanbody models of the Virtual Family [CHRIST10] Duke a 34-year-old male and Earthaan 8-year-old girl Two postures (standing and sitting) and three usages (mobilephone close to the head mobile phone or tablet for data and laptop usage) wereselected More details on numerical simulations can be found in [LEXNET IR212013]Table 4 shows the matrix of raw whole body averaged ௨௦ܣ
values induced in
an adult for a mobile phone usage the same table exists for other usages and forchild exposure
p=adult u=MOBILES
r=Frequency Band
Usage u400MHz
band (LTE)900MHz band(GSM UMTS
LTE)
1800-1940MHzband
(GSM 3G LTE)
24-26GHz(WiFi LTE)
Sitting Data 00078 00056 00016 73E-04Voice X 0012 00052 00047
Standing Data 0003 00049 319E-04 21E-05Voice X 0012 00052 00053
Table 4 Values of normalized whole-body ܛܗܘܝܚܘۯۺ induced in an adult by near sources
(mobiles laptops tablets) in different postures (all the values are given in Wkg and were
normalized to ] ]
= )
Table 5 shows the matrix of raw whole body averaged ௦ܣ values induced in an
adult by far field sources the same table exists for child exposure
p=adult r=Base station antennas (plane waves)
u=usage 400MHz band(LTE)
900MHz band(GSM UMTS
LTE)
1800-1940MHzband
(GSM UMTSLTE)
26GHz band(LTE)
Sitting 00050 00056 00043 00039Standing 00064 00052 00046 00042
Table 5 Values of normalized whole body ܛܗܘܚܘۯۺ۲ induced in adult by far and intermediate
sources (base stations and access points) (all the values are given in Wkg and were
normalized to RX[W]inc
= 1 Wm-2
)
It is worth pointing out that the aforementioned exposure index EI is defined on thebasis of the whole body averaged SAR But a local EI could be also derived fromlocal or tissue-specific SAR values
Document ID D26 Global Wireless Exposure Metric DefinitionFP7 Contract ndeg318273
Version V4 19Dissemination level PU
Last main data required to evaluate the EI are the average DL power density and ULtransmitted power They can be predicted from wireless network planning tools network monitoring tools or dosimeter The predictions or measurements collect awide range data at different locations within the study area for different periods oftime and possibly for different usages in order to derive relevant average valuesTwo types of dosimeters are designed in LEXNET wearable and fixed dosimeterslsquoIn sitursquo measurements were executed close to the end-user body thanks to thewearable version of the dosimeter Fixed dosimeters are being deployed in a densesensors network of a lsquosmartrsquo city More information on the LEXNET measurementtools is available in [LEXNET D61] and on the related assessment methodologies in[LEXNET D33]
23 Variability and uncertainty
The exposure index is the output of an analytical model expressed by the equation(1) with a number of uncertain input variables To propagate the uncertaintyassociated to the input variables in the model the first step consists in characterizingthe distribution of input variables Each uncertain variable input will be described by astatistical distributionThe uncertainties of the life segmentation data will be analyzed and modelled usingcomputable functions such as Gamma Gaussian or uniform distributionsUncertainties on the time use structure on an average day the usage segmentationand the average durations of usage will be characterizedAverage DL power density and UL transmitted power are estimated using specificconfigurations environments and usages The downlink power absorbed by the userand the uplink power emitted by the device (and so partially absorbed by the user)depend on these configurations environments and usages Their statisticaldistributions have to be characterized in order to be incorporated in the total EIstatistical uncertaintyA sensitivity analysis is ongoing in order to determine the most important parametersin the EI equation and how we could simplify the EI formula We are using Polynomialchaos and copulas for modelling of dependant parameters All the results onvariability and uncertainties will be available at the end of the LEXNET project indeliverable D28
The uplink exposure characterization requires a precise modeling of the poweremitted by the device Usually this exposure will depend on two parameters theposition of the personal device relative to the user body and the variation in spatialdistribution of the antenna gain due to the induced coupling effects The impact of thepositioning of the wireless device has been investigated by varying the position ofpersonal device with respect to the body Results have shown that the whole-bodySAR is not very sensitive to the device positionTo investigate the impact of the antenna gain on the variability of the emitted powerwe have used a statistical model of propagation channel [IST]Two propagation scenarios have been tested line of sight (LOS) and non-line ofsight (NLOS) For both scenarios we considered a lognormal distribution for theemitted power with a coefficient of variation up to 120 in the case of LOS and up to57 in the case of NLOS when studying the case of mobile phone emitting at 900MHz frequency This lognormal distribution characterizes the variability of the power
Document ID D26 Global Wireless Exposure Metric DefinitionFP7 Contract ndeg318273
Version V4 20Dissemination level PU
emitted versus the antenna gain Firstly we are assuming that the communication ismade via a single path namely LOS Assuming that the user can change randomlyits orientation with respect to the receiver antenna (eg base station) the antennagain in the LOS direction will also change depending on the user orientation Tomaintain a same control power (assumed fixed by the base station to ensure asuccessful decoding) the product of the emitted power to the antenna gain in LOSdirection should be a constant namely 1 mW in our analysis In the same spirit wehave analyzed the NLOS scenario by adding secondary paths The characterizationof the power emitted allows estimating the related exposure using the proportionalrelationship Figure 5 presents the cumulative distribution function of the poweremitted by the mobile phone when the average power required by the base stationoutside the small sphere surrounding the transmitter system (user + mobile phone) iskept to 1 mW
Figure 5 Cumulative distribution function (CDF) of the power emitted by the mobile phone (at 900MHz) obtained with both propagation scenarios (LOS and NLOS)
We could notice that the power emitted is very sensitive to the spatial distribution ofthe antenna gain especially in the case of LOS
The downlink exposure is very sensitive to the propagation environment[KALLIOLA02] [KIENTEGA11] Many physical obstacles (such as tunnels andbuildings) between the transmitter and receiver can affect the characteristics of theambient electric field This latter depends on many parameters such as the number ofwave components (due to the reflections and diffractions undergone by the originalwave radio) the fluctuations of the wave amplitude its phases and arrival angles Inthe literature several studies focused on the modeling of the electromagneticenvironment in realistic conditions by giving the statistics distributions of all of theseparameters [KALLIOLA02] [ZHAO02] [WINNER D112 2007] Based on the modelsproposed by these studies we simulated a downlink exposure induced by a realisticpropagation environment Figure 6 shows the variations of the whole body SARinduced by a single plane wave at 900 MHz
Document ID D26 Global Wireless Exposure Metric DefinitionFP7 Contract ndeg318273
Version V4 21Dissemination level PU
Figure 6 Variation of the exposure induced by a single plane wave (LOS) at 900 MHz for differentpolarization (horizontalH verticalV)
Other sources of uncertainties exist as the information on the network wirelessinfrastructure (eg the base station antenna location and orientation) the userequipment performance the Prediction errors (propagation UL power control modeletchellip) some being discussed in [D33 section 231] or measurement discretization(eg with a limited number of fixed dosimeters [D33 section 26])
3 HOW TO USE THE INDEX OF EXPOSURE
The synthetic index which is presented above aims at gathering all contributions tothe population EMF exposure induced by wireless communication networks By itselfbuilding such an index is already a challenging goal but LEXNET goes beyond thedefinition of the EI since it seeks reducing the exposure by exploring innovativetechniques at the lower (mainly PHY level) or upper layers (network level andresource management)
However a general formulation of the EI is given in this document the EI needs to beslightly adapted to the particular characteristics of each technique evaluationscenario The basic idea is that each of the proposed techniques would probablyfocus on a particular parameter and most likely on a single scenario Proposedtechniques could therefore be evaluated by using a partial EI Hence their benefitswould be specific to the characteristics of the selected use case and their impact overthe overall EI would need to be adjusted accordingly A reference scenario detailedbelow has been defined in order for all the proposed reducing solutions to be testedon one unique global scenario
31 Reference scenario
One reference global scenario will be used as a starting point scenario by LEXNETtechnical work-packages (WP 4 5 and 6) to evaluate the EI ldquobeforerdquo implementationof LEXNET exposure-minimization techniques
Document ID D26 Global Wireless Exposure Metric DefinitionFP7 Contract ndeg318273
Version V4 22Dissemination level PU
Parameter Value
Time periods Day Night
Population Adult children
Load profiles Heavy moderate light and non user
Environments Outdoor indoor commuting
RATsCellTypes
Type 2G 3G 4G WiFi
Cell size Variable (mainly depends on theenvironment)
Cell type Macro
User
Usage Voice data
Equipment Smartphone tablet Laptop (dongle)
Posture Standing sitting
The EI will be evaluated for this specific scenario using life segmentation usage andSAR data introduced in the previous chapterThen each partner will be free to test their minimizing solutions on this scenario andto calculate an EI ldquoafterrdquo LEXNETScenarios for each RAT can be simulated separately and percentages of mobiletraffic per RAT can be afterwards used as input for the EI (see Figure 7) It can beenvisaged that modifying these percentages could be one network managementsolution for reducing the EI assuming in a first approximation that the traffic per RAThas no strong influence on the RAT exposure metrics which is not completely right
Figure 7 Connections by RAT [CISCO13]
Document ID D26 Global Wireless Exposure Metric DefinitionFP7 Contract ndeg318273
Version V4 23Dissemination level PU
32 Reducing the EMF exposure using the EI
321 Lower layer solutions a common methodology to use the EI
The EI is a relevant global metric for evaluation of radio technologies performances interm of exposure reduction However WP4 has identified some difficulties to directlyaddress the global calculation To reach this global evaluation target WP4 hasadopted a specific and indirect methodology described in [LEXNET D42 2014]deliverable and synthesised in the following Despite a large diversity of technicaldomains whatever the scenario or the Radio Access Technologies (RAT) a singlestrategy to organize and align the different WP4 exposure evaluations is proposed Afive steps methodology has been established in order to evaluate and harmonize theoverall exposure improvement for each technology These steps also attempt toprovide the basis for future global exposure reduction evaluation in order todetermine the most promising WP4 techniques based on fair and relevantcomparisons
The first step is to identify how the individual WP4 techniques contribute towards theoverall LEXNET use case scenarios from WP2 Specifically for WP4 evaluations foursub-scenarios have been introduced (Macro-Cell Small-Cell Rural and WSN ampWiFi) (Step-1a) This sub-scenario categorization highlights which solutions arecomplementary and which will require further analysis to determine potential conflictsIn order to harmonize the evaluations from the studies of different solutions it iscrucial to describe properly and extensively each assumption and the inputparameters values related to the context study (Step-1b)
A limited numbers of Key Performances Indicators (KPI) for the exposure and for theQoS are used in the evaluation of each WP4 technique The step-2 has to clearlyidentify the KPIs being addressed by individual technique exploration It is taken asmore convenient to work with one of the following three simpler metrics or KPIsderived from the EI formula and addressing UL exposure
The first metric is the Specific Absorption Rate (SAR l mTx ) which describes the
amount of EM energy absorbed into the userrsquos body via the spatial distributionof the EM field from the source Thus SAR is particularly relevant for antennasolutions
The second metric is the mean duration of exposure (UL
kjit ) which indicatesthe amount of time the user is exposed It impacts the EI which is defined as adose For example the duration is impacted by the amount of transmitted dataReduced retransmission improved interference management and signalingreduction strategies are all ways of decreasing this metric The duration usedto calculate the mean is selected regarding the time constant of the studiedtechnique
The third metric is the mean transmitted power ( TxP ) during the considered
mean exposure duration As an example a 1 dB improvement on the receivingsensitivity at the Base Station (BS) could be converted in a 1 dB reduction ofthe transmit power at the User Equipment (UE) Again the duration used tocalculate the mean is selected regarding the time constant of the studiedtechnique
Document ID D26 Global Wireless Exposure Metric DefinitionFP7 Contract ndeg318273
Version V4 24Dissemination level PU
Notice that an equivalent set of three metrics adresses the DL
The step-3 concerns the evaluation itself of a partial EI ratio in comparison with abaseline scenario that is to say without implementing the studied solution Theexposure reduction is evaluated through the calculation of an EI ratio by comparingthe lsquoafter LEXNETrsquo versus the lsquobefore LEXNETrsquo (ie SotA or standard) baselineconfigurations (Eq 4) The main advantage of the proposed approach is that in mostof the presented solutions the three KPIs are independent from each other Byconsidering a given sub-scenario and depending whether the UL or the DL is studiedthis means that if a solution succeeds in decreasing the selected single KPI the twoothers will stay constant when the solution is implemented or not Thus in thatspecific sub-scenario the EI ratio is equal to the selected KPI ratio (Eq 5) Thisexposure metric is easily matched with a typical RF front-end or PHY layer evaluationstudies
(4)
This formula is simplified when a specific sub-scenario is considered
(5)
Where
partialEI is the Exposure Index for a specific sub-scenario
partialKPI is the identified metric among the three detailed in step 2
the subscript lsquow LEXrsquo correspond to the Lexnet solution implementationthe subscript lsquowo LEXrsquo correspond to the SotA or baseline (without the solutionimplementation)
Meanwhile the selected QoS metric is also evaluated with and without LEXNETsolution
The step-4 aims to ensure that capacity or QoS improvements are converted intoexposure reduction It is worth reminding that the objective of LEXNET studies is toreduce exposure without impacting QoS
At last the step-5 estimates the absolute global EI reduction from the previous stepsrsquopartial EI results throught the 24 hours LEXNET reference scenario The so-calleddilution factor [LEXNET D41 2013] is taken into account during this step-5 Theusage statistics from WP2 are used to weight the calculated partial EI reduction inorder to assess the global EI reduction for a given solution
To conclude a scheme summarizes the WP4 common EI evaluation methodology inFigure 8 This process is sufficiently generic to be applied by any of the WP4proposed solutions and examples of its step by step application can be found in[LEXNET D42 2014]
100LEXwoEI
LEXwoEI-LEXwEI()Ratio
partial
partialpartial
EI
100LEXwoKPI
LEXwoKPI-LEXwKPI()Ratio
partial
partialpartial
EI
Document ID D26 Global Wireless Exposure Metric DefinitionFP7 Contract ndeg318273
Version V4 25Dissemination level PU
Figure 8 Common EI evaluation methodology for WP4 techniques
322 Upper layer and resource management techniques
By introducing and promoting the EI as a new planning metric LEXNET intendsamong other objectives to help reduce local town planning objections to applicationsfor installing new base stations Work carried out by LEXNET WP5 so far hasdemonstrated that real-time EMF-aware network management strategies depend oncurrent traffic load radio conditions mobility application used and the duration ofuse available networks and UE capabilities Since EI calculations take into accountlong-term network statistics distributions of user profiles and habits (services usedetc) times of day period of year etc EI itself may therefore be better suited for initialnetwork design and AP placement while other metrics may be better suited for real-
Document ID D26 Global Wireless Exposure Metric DefinitionFP7 Contract ndeg318273
Version V4 26Dissemination level PU
time EMF management Clearly a link between these proxy-metrics and long-term EIvalues is needed The underlying assumption is that if we try to reduce the level ofEMF by applying correct general policies and additionally control it on a smaller time-scale (eg seconds or minutes) with fast-loop control then the overall exposure andthe EI (defined on daily level) will decreaseFast-loop (event-based) EMF control would be a response to a temporary change ofconditions This kind of control requires triggers ie thresholds that can be assessedon near-real-time scale ndash this time scale may not be as granular as for power controlFor fast-loop control offload techniques may be used as for general strategy butalso other strategies such as changing codecs delaying transmission etc Fast-loopcontrol without using triggers would be periodic optimization on a smaller time-scaleProxy metrics to be used for fast-loop control involve data that may be collected fromthe network and include
bull Measurements (UL Tx power RSSI RSCPhellip)
bull User context velocity services used profile
bull Statistics cell statistics (traffic load) etc
Some preliminary results using various proxy metrics which illustrate the pointsabove are shown hereFigure 9 shows live network measurements illustrating that available cellulartechnologies and current traffic conditions are two of the main points to be taken intoaccount when designing low-EMF solutions The metric used here is the UL Txpower The same metric is used in Figure 10 and Figure 11 which show that the typeof service could increase the exposure (based on UL Tx power) meaning thatdifferent strategies should be used to identify the best connectivity according to theservice flow requested The actual UL Tx power values can then be used in EIcalculations
Figure 9 Comparison of different 2G3G cells in high load hours by UE Tx power
Document ID D26 Global Wireless Exposure Metric DefinitionFP7 Contract ndeg318273
Version V4 27Dissemination level PU
Figure 10 Comparison of UL FTP and voice services over 2G3G cells in high load hours by UE Txpower
Figure 11 Comparison of voice service over 3G and voice service using Skype over 3G network
Another common proxy with direct link to EI is the DL power density Figure 12 showshow DL power density and UL transmit power vary for different ISD values in an LTEnetwork Based on these simulations it can be seen that small-cell densification inurban areas allows for significant exposure reduction which now needs to betranslated into the EI using various assumptions on user distributions and type ofusage
Document ID D26 Global Wireless Exposure Metric DefinitionFP7 Contract ndeg318273
Version V4 28Dissemination level PU
Figure 12 DL power density and UL transmit power for different ISD values
Whole-body SAR is another proxy metric whose statistical processing can leaddirectly to EI calculations As an example of SAR values obtained by a tooldeveloped for the prediction of whole-body and localized SARs and absorbed dosesfor indoor wireless network deployments in Figure 13 we show distributions for thetraditional deployment (top) and for the WP5 exposure-optimized deployment
Figure 13 Whole-body SAR_DL (distribution for the traditional deployment (top) and for the exposure-optimized deployment (bottom)
Document ID D26 Global Wireless Exposure Metric DefinitionFP7 Contract ndeg318273
Version V4 29Dissemination level PU
4 EXAMPLES OF APPLICATION
41 Computing chain
In this section three simplified examples of EI computation are detailed In no casethese examples are representing the completeness of the possibilities that can becover by the EI but they illustrate the process of computation
The first two examples illustrate the use of network planning tools in the evaluation ofthe EIThe first example detailed in the section 42 consists in comparing two indoor officescenarios first with wireless communication offered by only 3G outdoor macro basestations scenario and secondly with an additional 3G femtocell (Table 6)
Scenario 1
Time PopulationUser
ProfileEnvironment RAT Cell Type Posture Usage
1h inthe
afternoon
Adults Heavy Indoor 3G Macro Standing Voice mobile
Medium Datamobile
Light Data Tablet
Nonuser
Data Laptop
Scenario 2
Time PopulationUser
ProfileEnvironment RAT Cell Type Posture Usage
1h inthe
afternoon
Adults Heavy Indoor 3G Femto Standing Voice mobile
Medium Datamobile
Light Data Tablet
Nonuser
Data Laptop
Table 6 input variables for the 3G indoor sub-scenarios described in section 42
The second example detailed in section 43 is considering a data LTE macro urbanscenario (Table 7)
Time PopulationUser
ProfileEnvironment RAT Cell Type Posture Usage
Day Youngpeople
Moderate Indoor 4G Macro Standing Data mobile
Document ID D26 Global Wireless Exposure Metric DefinitionFP7 Contract ndeg318273
Version V4 30Dissemination level PU
Night Adults Non user Outdoor Sitting Data mobile
Seniors Data Tablet
Table 7 input variables for the LTE scenario described in section 43
The last example detailed in section 44 illustrates the use of dosimetermeasurements in the EI evaluation It is considering a macro outdoor LTE scenariowhere one user is wearing a dosimeter
42 Indoor exposure from 3G macro and femto-cells
The EI was evaluated for two scenarios considering the exposure of people locatedindoor The population consisted of adults making UMTS (phone calls with thephone on the right side of the head The scenario 1 is considering a macrocellconnection and the scenario 2 an indoor small cell connection Different user profilesare considered
10 heavy users 30 s usage 50 moderate users 10 s usage 25 light users 3 s usage 15 no usage 0 s usage
For the calculation of the EI several input parameters are needed reference SARvalues averaged transmitted power valuesത and averaged incident power densityvalues inc (see Table 8)The power (density) values that were used for the indoor macrocell scenario arederived from measurements in an office building (Zuiderpoort building GhentBelgium) [PLETS14] Figure 14 shows the considered buildingFor the indoor femtocell scenario accurate power (density) values from the WHIPPtool a heuristic indoor network calculator and planner [PLETS12] were used In theconsidered building a femtocell with an Equivalent Isotropically Radiated Power(EIRP) of 7 dBm is installed A different femtocell EIRP can lead to a largely differentEI Reference SAR values were taken from [LAUER13] and applied to the scenariosfor an adult standing using the phone on the right side of the head Since the
measured macrocell values (RXinc and Pഥଡ଼) were not recorded in the smaller andmore enclosed central areas of the building floor (toilets kitchen shedhellip) femtocellpredictions were limited to the non-shaded areas around the center in Figure 14 Forthe femtocell values locations within 50 cm of the base station are discardedassuming that people stay at least half a meter away from base stations For thesimulations a sub-scenario is also considered for which a 20 dB worse macrocellconnection is assumed for the same building floor This could correspond to abuilding with a penetration loss that is 20 dB higher than before or a building which islocated further from the macrocell base station (path loss increase of 20 dB) Table 8
shows that the assumed Pഥଡ଼ RXinc values in case of a lsquoworse connectionrsquo areindeed 20 dB higher lower
Document ID D26 Global Wireless Exposure Metric DefinitionFP7 Contract ndeg318273
Version V4 31Dissemination level PU
Figure 14 Ground plan of the considered floor (90 m x 17 m) of the office building that is simulatedFemtocell base station location is indicated with purple hexagon
Scenario 1Macro indoor
Scenario 2Femto indoor
௨ܣ 0003 Wkg 0003 Wkg
௨ܣ 000495 Wkg 000495 Wkg
ത 26610-5 W 28510-7 W
ത(worse connection) 26610-3 W 28510-7 W
RXinc81510-8 Wmsup2 51810-6 Wmsup2
RXinc(worse connection) 81510-10 Wmsup2 51810-6 Wmsup2
Table 8 Reference SAR values and average transmitted power and observed power densityvalues
In the following the results for the different indoor scenarios are discussedFigure 15 (a) compares the EI for scenarios 1 and 2 for the indoor office buildingFrom an exposure-point-of-view the indoor femtocell scenario (scenario 2 EI =158E-8 Wkg) is a factor 28 worse than the indoor macrocell scenario (scenario 1 EI= 564E-10 Wkg) The main EI contribution in scenario 2 is the high DL exposureoriginating from the femtocell (155E-8 Wkg) The scale in Figure 15 (a) has beenadjusted the bar that represents the DL femto indoor contribution is in reality 44times the length of the Y-scaleThere are several reasons why the installation of a femtocell is not beneficial in thiscaseA first reason is that the EI contributions of the macrocell are almost equal for UL andDL which is optimalA second reason is that the femtocell EIRP is chosen quite high (7 dBm) despite thegood macrocell connection (average value of -6925 dBm) still 77 of the DL fieldsare higher in the femtocell caseA third reason is that a femtocell installation has the disadvantage that observedpower densities on a building floor due to a femtocell base station are lesshomogeneously distributed than fields due to a (more distant) macrocell base stationAs people are assumed to ndash on average- reside an equal time at each location on thebuilding floor (except shaded areas and locations closer than 50 cm from the BS)locations close to the femtocell contribute a lot to the EI When people approach afemtocell the absorbed exposure dose increases in a more-than-linear wayMacrocell base stations have the advantage that ULDL fields are morehomogeneously distributed over the building floor It should also be noted that thehigher the UL usage the more the femtocell scenario will benefit compared to themacrocell scenario (lower EI) However in the considered case the UL usage timeswould have to increase by a factor 48 to yield a total EI (macrocell scenario 1) that isequal to the EI of scenario 2 (femtocell scenario EI = 158E-8 Wkg)
Document ID D26 Global Wireless Exposure Metric DefinitionFP7 Contract ndeg318273
Version V4 32Dissemination level PU
We also studied a second case where a less favourable macrocell case isconsidered (lsquoworse connectionrdquo) It is assumed that the connection with the macrocellbase station is now 20 dB worse than in the previous case Figure 15 (b) comparesthe EI for the macrocell and femtocell deployments Due to the worse connection(average received macrocell DL power of -8925 dBm) the macrocell EI is nowcompletely determined by the UL contribution (320E-8 Wkg) and the femtocellscenario (scenario 2 EI = 155E-8 Wkg) has an EI that is 48 of the macrocell EIwhich makes it preferable over the macrocell deployment Moreover the observedpower densities due to the femtocell are higher than the macrocell power densities atall locations (better QoS)It can be concluded that the installation of femtocell is not always recommended forshorter UL usage times andor better macrocell connection qualities it could beadvised to rely on the existing macrocell infrastructure Also when installing afemtocell its EIRP should be adjusted to the size and physical properties of thebuilding and should not be set at a needlessly high value
(a) (b)Figure 15 Comparison of the contributions to the whole-body EI for (a) indoor scenarios 1 and 2 in theconsidered building (b) indoor scenarios 1 and 2 in this building with 20 dB worse connection qualityTotal EI levels for each scenario are indicated with the horizontal line EI values are shown in Wkg
43 Data LTE macro urban scenario
431 Input variables linked to the network
The EI is evaluated from a macro-cellular LTE network in a real geographical area ndashpart of the 7th district of Paris (see Figure 16) The proposed scenario was previouslydefined in frame of the French ANR project ECOSCells [BCL12] and the EuropeanFP7 project FREEDOM (httpwwwict-freedomeu) for the simulation and analysis ofheterogeneous network topologies (hetNet) It is based on a real environment usingHigh Resolution (HR) map data realistic BSUE deployments and deterministicpropagation models
The macro layout is organized as three rings around a central three-sector sitemacro base stations being deployed with an inter-site distance of about 450 m in ahexagonal manner as shown in Figure 16
Document ID D26 Global Wireless Exposure Metric DefinitionFP7 Contract ndeg318273
Version V4 33Dissemination level PU
Figure 16 View of the macro-cell hexagonal deployment in the area
The study area (ie area where network performance is evaluated) is limited to thesurface covered by the three co-located central macro-cells and the first ring (Figure17) Thus the study area is equivalent to 12 macro-cells The base stations outsidethis study area are included in simulations to generate an accurate interferencepattern
Figure 17 Study area composed of 12 macro sites localised in the 7th
district of Paris France
Document ID D26 Global Wireless Exposure Metric DefinitionFP7 Contract ndeg318273
Version V4 34Dissemination level PU
The positions and heights of the base stations have been selected in realisticapproach sites are placed on slightly dominant rooftops and sector antennas aredistributed at the rooftop edges Directive antennas are used (with 3GPP radiationpattern) Each site is composed of three sectors oriented in azimuth directions 0deg120deg and 240deg with down-tilt 6degUsers are assumed to be uniformly distributed in the study area an indoor ratio setsthe percentage of users located inside buildings at the ground floorThe specifications of input parameters are summed up in Table 9
Environment Typical European Dense Urban environment (Paris VII district France)
System
Downlink (DL) and Uplink (UL)
LTE FDD 2 x 10 MHz
Central frequency 2600 MHz
Macro layout
Hexagonal sitedeployment
37 sites corresponding to 83 macro cellsincluding 12 sites in the center of the studyarea Inter-site distance (ISD) of 450 m
Nominal transmitpowerEPRE
40 W 228 dBm
AntennaDirectional with 14 dBi gain 6deg electric down-tilt 2 antennassector Average antennaheight 30 m above ground
Noise figure 25 dB
UL power control (openloop)
Path loss compensation factor 1SINR target 208 dB
UserEquipment
MaxMin transmit power 23 dBm -40 dBm
AntennaOmni-directional with 0 dBi gain 2antennasuser device Antenna height 15 mabove ground
Noise figure 9 dB
User traffic
Average active userdensity
Depends on daynight
DistributionUniform spatial distribution within thesimulation area Single floor (at 15 m height)No user mobility
Table 9 Inputs in SIRADEL simulator
432 Input variables linked to the population
Category of population
The population density of the 7th District of Paris was estimated at 14 36050
inhabitants per kmsup2 in 2009 [Carte09]
We are considering the population above 15 years old
Given the population distribution by age (Figure 18) it was decided to divide the adult
population into 3 categories young people (between 15 and 29 years) adults
Document ID D26 Global Wireless Exposure Metric DefinitionFP7 Contract ndeg318273
Version V4 35Dissemination level PU
(between 30 and 59 years) and seniors (over 60 years) Table 10 shows the
percentages of people in each category
Figure 18 Population distribution by age in Paris 7th district in 2007
Population category Pourcentage(prop)
Adults (30-59 yo) 45
Young people (15-29 yo) 26
Seniors (+60 yo) 29
Table 10 Number of people in each population category
Time periods
A 24-hour day is divided into two periods the day from 8 am to 6 pm (10 hours in
total) and the night from 6 pm to 8 am (14 hours in total)
Environment
Time spent indoor or outdoor on an average day for each category is extracted from
Table 2
Usage
Only data traffic is considered The device is assumed to be a mobile phone whilethe user is in a standing posture Considering the existence of 4 telecom operators inFrance only 25 of the 7th district population is assumed to be using this LTE macronetwork In this example we consider two user profiles moderate user and non-userFor each population category we derived from [Bigot et al 2013] the proportions ofusers and non-users of mobile phones for data traffic (see Table 11)
User profileYoung people (15-29
yo)Adults (30-59 yo) Seniors (over 60 yo)
non-users 33 57 91
Document ID D26 Global Wireless Exposure Metric DefinitionFP7 Contract ndeg318273
Version V4 36Dissemination level PU
users 67 43 9Table 11 Repartition of users and non-users for each population category
For simplicity the parameters for the moderate user profile are applied to all userswe assume a daily data traffic per active user of 66 MB [CISCO13] a DLUL ratio of9010 (this ratio was evaluated from data collected through measurements ofKPIs by sensors inside the French Orange network) and a daynight ratio of4357 From [CISCO13] only 29 of connections in 2013 were on 4GReference SAR values were extracted from Table 4 and Table 5
433 Transmitted power ഥ and received power density ത calculationܖ
Incident ோpower densities and transmittedത powers were calculated by usingthe network planner simulation tool Volcano Suite (Siradel France)Figure 19 andFigure 20 illustrate respectively the average UE Tx power calculated over the 7thParis district during the day and the average incident power density evaluated duringthe day or the night (values during the day or the night time were quasi identical)
Figure 19 Map of the average UL Tx power (dBm) calculated indoor at ground floor and outdoorduring the day (on the left) and map of daily average transmission duration (s) (on the right)
Figure 20 Map of the average DL incident power density (dBμVm) calculated indoor at ground floor and outdoor during the day or the night
Because the average active LTE user density is very low (41 userskm2consequence of the 29 LTE connections assumption) the DL user traffic utilises
Document ID D26 Global Wireless Exposure Metric DefinitionFP7 Contract ndeg318273
Version V4 37Dissemination level PU
less than 1 of available resources which strongly impact the predicted DL incidentpower density We can see in Figure 19 (left figure) that the calculated average Txpower is minimum in outdoor areas in the vicinity of the base stations or in Line ofSight (LOS) while it is at a maximum indoors and outdoors far away from the basestations The right map in Figure 19 gives the average communication durationwhich directly impacts the calculation of the UL exposure contribution The better thelink performance is the higher the throughput and thus the longer thecommunication duration That is why the longest durations are observed indoors andparticularly in the building parts that suffer from the strongest propagation lossesFigure 20 shows that the strongest DL incident power density levels are predicted inLOS areas while much lower levels are observed inside the buildings where mostpopulation is located
434 Exposure index calculation
Aggregating everything we obtain the following value for the EI (based on the Whole-body SAR) of the over 15 years old population of the 7th district of Paris consideringa macrocell LTE network EIWBSAR = 31910 -7 Wkg
44 Using dosimeters for the EI evaluation
This section provides an evaluation of the downlink and uplink exposure indexes fora subject wearing a reference isotropic dosimeter on the head together with fivedosimeters at different locations of the body as well as two mobile terminals Thesubject is moving in a multipath environment including a 3-sector LTE base station
When modelling the radio link between the user devices and the base station oneconsiders the influence of the body (ie body coupling [MaOC12] and bodymovements (using realistic body motion capture tools [MaCo13]) and accounts forthe propagation environment using a geometrically based statistical channel (GBSC)model (ie multipath propagation) Therefore the modelling of the radio channel hasbeen separated into several steps as described in [Mack13] Figure 21
Document ID D26 Global Wireless Exposure Metric DefinitionFP7 Contract ndeg318273
Version V4 38Dissemination level PU
Figure 21 Model for EMF assessment from dosimeter data
The simulated scenario Figure 22 considers a reference isotropic dosimeter on thehead of the user (simulating the real body exposure) together with five wearabledosimeters These dosimeters allow the downlink exposure assessment The user isalso carrying two mobile terminals allowing to assess the uplink exposure
Figure 22 Placement of wearable dosimeters and mobile terminals on the body
For the downlink the received (Rx) power ோ௫ at the mobile terminal (ordosimeter) is calculated from
ோ௫[ౚ ]= ௌ[ౚ ]
minus ௧௧[ౚ]ܮ (6)
where ௌ base station (BS) transmitted (Tx) power ௧௧ܮ total path loss including gains of mobile terminal (or
dosimeter) and BS
The received power density ோ௫ at the mobile terminal (or dosimeter) iscalculated from
ோ௫ ୫ మ൧=
ோ௫[ ]
ܣ మ൧
(7)
where ܣ is the mobile terminal antenna effective area
ܣ ୫ మ൧=ଶ[ߣ ]
ߨ4ோ௫[ౚഠ]ܩതതതതതതതതത (8)
where wavelength ோ௫തതതതതܩ average gain of the receiving antenna (ie dosimeter probe) in
off body direction (eg half-hemisphere of the gain pattern ieߠ isin [minus9090]deg and isin [minus9090]deg)
ோ௫[ౚഠ]ܩതതതതതതതതത=
1
ఏఝ ோ௫[ౚ]ܩ
ߠ) )
ேക
ୀଵ
ேഇ
ୀଵ
(9)
where ఏ and number of elevation (ߠ) and azimuth () directions
The exposure index for the DL ܫܧ can be determined from [LEXNET D24 2013]
Document ID D26 Global Wireless Exposure Metric DefinitionFP7 Contract ndeg318273
Version V4 39Dissemination level PU
[୩]ܫܧ = ௪ܣ
|ଵ ୫ మ[୫ మ୩]
times ோ௫[ ୫ మ]times [ୱ]ݐ (10)
where ௪ܣ
|ଵ ୫ మ normalised whole body averaged SAR coefficient per
1 Wm2 of Rx power density as indicated in [LEXNET D24 2013] ݐ time of the exposure from BS
ோ௫ average Rx power density during period ݐ
For the uplink the required Tx power from the mobile terminal is determined from ௫[୫ ]
= ௌ[୫ ]+ ܫ ௧௧[]
+ ܯ [] + ௧௧[]ܮ (11)
where ௌ noise and interference level at the BS ܫ ௧௧ target SINR at the BS
ܯ fading margin for a dynamic usage ௧௧ܮ total path loss including gain of MT and BS
ௌ is calculated asௌ[୫ ]
= minus174[୫ ] + 10logଵ(ܤ[ୌ]) + ி[]+ []ܫ (12)
where ܤ bandwidth ி noise figure ܫ interference
The EI for the UL ܫܧ can be determined from [LEXNET D24 2013]
[୩]ܫܧ = ௪ܣ
|ଵ [ଵ୩]times ௫[ ]
times [ୱ]ݐ (13)
where ௪ܣ
|ଵ whole body averaged SAR coefficient per 1 W of Tx poweras indicated in [LEXNET D24 2013]
ݐ time of the exposure ( duration of the mobile terminal usage)
௫ average Tx power during period ݐ
A macro cell outdoor street scenario has been considered including a set of 10clusters of 3 scatterers each with a Uniform Distribution in the half space of anellipsoid A 3-sector base station antenna is located in the middle of the street atx=100 m The user is moving on a straight line in the middle of the street (ie y=10m xisin[50 150] m) Figure 23
Document ID D26 Global Wireless Exposure Metric DefinitionFP7 Contract ndeg318273
Version V4 40Dissemination level PU
Figure 23 Scenario
The parameters of the scenario are presented in Table 12 being worthwhile to noticethat the values of ௪ܣ
and ௪ܣ are taken from preliminary SAR simulations The
calculated noise and interference level at the BS is ௌ= -12774 dBm
System
Frequency [MHz] 2600
[HoTo11]ܤ
Resource Block [kHz] 15
Full [MHz] 20
Full LTE-A [MHz] 100
Downlink
EIRP BS Tx power [dBm] 46 [LEXNET D23 2013]
ோ௫ܩ [dBi] 122 [LEXNET D32 2014]
ݓܣ|ܮܦ
1Wm2[m2kg] 300
Uplink
ܫ ௧௧[dB] 208 [HoTo11]
ி [dB] 25 [LEXNET D23 2013]
[dB]ܫ 8 [HoTo11]
ܯ [dB] 30 [Mack13]
ݓܣ|ܮ
1W[1kg] 495
Table 12 Scenario overview
Figure 24 illustrates the considered macro cell base station antenna and thedosimeter realised gain patterns
(a) BS with 3 sectors (b) Dosimeter on the bodyFigure 24 Realised gain pattern
Document ID D26 Global Wireless Exposure Metric DefinitionFP7 Contract ndeg318273
Version V4 41Dissemination level PU
441 EI for downlink
The average Rx power density obtained from the isotropic reference probe and thedosimeter located at WA_L and WA_R is presented in Figure 25 The received powerdensity at WA_L dosimeter is very similar to the one gathered at the isotropic probewhich mainly comes from the similar Line-Of-Sight (LOS) propagation conditions Thepower received in WA_R dosimeter is much lower due to the body shadowing
Figure 25 Rx power density at selected positions
The distribution of the Rx power density is presented in Figure 26 In spite of thebody shadowing the distribution of the Rx power density at the WA_R dosimeter ismuch similar to the ones for the reference and the WA_L dosimeters All of themfollow an exponential decay which should be subject to further investigation
(a) isotropic (b) WA_L (c) WA_R
Figure 26 Rx power density histograms
The received power density and the downlink exposure index calculated based onthe measurement of the dosimeters located in the various locations on the body arepresented in Table 13
ோ௫ [mWm2] ܫܧ [mJkg]
isotropic 35868 2690
WA_F 18357 1377
WA_B 29538 2215
Document ID D26 Global Wireless Exposure Metric DefinitionFP7 Contract ndeg318273
Version V4 42Dissemination level PU
WA_L 28516 2138
WA_R 9060 680
TO_F 18436 1383
Table 13 Downlink Exposure
The WA_L dosimeter and the isotropic probe exposure indexes are very similarbecause of the LOS propagation conditions The same is valid for the WA_Bdosimeter which is also in LOS with the base station For the other dosimeters theexposure index is naturally lower due to the body shadowing In this scenario theuse of a wearable dosimeter in the front or in the right side of the body displays anexposure index reading about 4 times lower than the real user exposure
442 EI for uplink
The average Tx power from the mobile phone hold near HE_L and HE_R ispresented in Figure 27 The uplink power control is clearly noticeable by the highertransmitted power in HE_R as the mobile terminal adjusts the Tx power tocompensate for the higher channel fading
Figure 27 Tx power for straight6min scenario at 2600 MHz for LTE-A
The distribution of the Tx power at HE_L and HE_R is presented in Figure 28 Inspite of the different intensities HE_L and HE_R Tx powers present a similardistribution
Document ID D26 Global Wireless Exposure Metric DefinitionFP7 Contract ndeg318273
Version V4 43Dissemination level PU
(a) HE_L (b) HE_R
Figure 28 Tx power histograms
The average transmitted power and the uplink exposure index from the mobileterminals located near left and right side of the head ( e HE_L and HE_R) arepresented in Table 14
௫ [mW] ܫܧ [mJkg]
RB FULL FULL_A RB FULL FULL_A
HE_L mobile 002 165 827 003 295 1474
HE_R mobile 008 838 4191 014 1493 7468
Table 14 Uplink Exposure
These results show the importance of the propagation conditions in the EMFexposure Due to the non LOS conditions the exposure index in the right side of thehead is 5 times higher than the one on the left side
5 CONCLUSION
In this deliverable a global metric is defined to test and optimize wirelesstelecommunication networks in terms of EMF exposureThe proposed metric called Exposure Index (EI) has the advantage to overpass thelimitations of the actual metrics that in fact are managing separately the exposureinduced by personal devices and the one induced by the network equipment (basestations and access points) But devices base station antennas and access pointsare definitely parts of the same wireless environment and the global wirelessexposure is induced by all of them
The EI is described with an analytical model with input variables describing thecoverage area of interest the accessible networks the population and the habits interms of location and of wireless devices usage The output is the EI covering theday-to-day averaged exposure of population in a given area incurred by an entirewireless network from base stations and access points to individual devices
In this deliverable the analytical model of EI has been detailed and the inputvariables defined Then the use of the EI to minimize the EMF exposure in wirelesscommunication networks is presented in connection with work-package 4 dedicated
Document ID D26 Global Wireless Exposure Metric DefinitionFP7 Contract ndeg318273
Version V4 44Dissemination level PU
to innovative radio components and work-package 5 focused on networks topologiesand technologies
The way to process a complete calculation of EI is illustrated on three deterministicexamples The first example considers comparison of indoor 3G macro and femtoscenarios The second example is taking into account an adult population in a LTEmacro urban environment with their data usage specifications Both examples arebased on a real environment representation and network simulation tools have beenused to simulate the up and down links The third example illustrates how dosimetermeasurements can be used to assess the EI
In our further work the statistical description of input variables will enable topropagate the variability and the uncertainty in the EI model making it more accurateand reliable Results will be made available in the future deliverable D28 DeliverableD33 will detail the used methodology to assess the EI and for the last year of theproject the work of partners involved in WP6 will be enhanced as they will be incharge of the implementation and evaluation of the EI
Document ID D26 Global Wireless Exposure Metric DefinitionFP7 Contract ndeg318273
Version V4 45Dissemination level PU
6 REFERENCES
[ALIAGA06] Aliaga C How is the time of women and men distributed
in Europe Statistics in focus population and social
conditions April 2006
[APVJM13] Aerts S Plets D Verloock L Joseph W and MartensL Assessment and comparison of RF-EMF exposure infemtocell and macrocell scenarios Radiat Protec Dosim2013
[BCL12] Brau M Corre Y Lostanlen Y Assessment of 3D
network coverage performance from dense small-cell LTE
Communications (ICC) 2012 IEEE International
Conference on
[Carte09] httpwwwcartesfrancefr
[CISCO13] Cisco Visual Networking Index Global Mobile Data Traffic
Forecast Update 2012-2017 February 2013
[CHLWW08] ConilE Hadjem A Lacroux F Wong M F and Wiart J
Variability analysis of SAR from 20 MHz to 24 GHz for
different adult and child models using finite-difference
time-domain Phys Med Biol vol 53 pp 1511-1525
2008
[CHRIST10] Christ A Kainz W Hahn E G Honegger K Zefferer
M Neufeld E Rascher W Janka R Bautz W Chen
J Kiefer B Schmitt P Hollenbach H-P Shen J
Oberle M Szczerba D Kam A Guag J W amp Kuster
N The Virtual Family--development of surface-based
anatomical models of two adults and two children for
dosimetric simulations Phys Med Biol vol 55 pp 23-38
2010
[CMKB06] Cooper TG Mann SM Khalid M and Blackwell RP
Public exposure to radio waves near GSM microcell and
picocell base stations Journal of the Society for
Radiological Protection Vol 26 No 2 pp 199-211 June
2006
[GCWW10] Gati A Conil E Wong MF Wiart J Duality between
uplink local and downlink whole body exposures in
operating Networks IEEE Transactions on EMC Vol 52
ndeg4 Nov 2010
Document ID D26 Global Wireless Exposure Metric DefinitionFP7 Contract ndeg318273
Version V4 46Dissemination level PU
[HoTo11] Hola HG And Toskala A LTE for UMTS Evolution to
LTE-Advanced Wiley UK 2011
[INFORMA12] Informa telecom amp Media Small Cell Market Update June
2012
[INSEE11] Insee enquecircte Emploi du temps 2009-2010 Insee
Premiere Ndeg 1377 November 2011
[IST] httpwwwist-winnerorg
[KALLIOLA02] Kalliola K Sulonen K Laitinen H Kiveks O Krogerus J
Vainikainen P Angular power distribution and mean
effective gain of mobile antenna in different propagation
environments IEEE Trans Veh Technol vol 51 pp 823ndash
838 2002
[KIENTEGA11] Thierry Kientega EConil A Gati A Hadjem ERichalot M-F Wong OPicon Joe Wiart Analysis of thedistribution of specific absorption rate induced by fiveplane waves with a fast and new method in VisibleHuman URSI conference 2011
[LAUER13] Lauer O Frei P Gosselin M C Joseph W Roumloumlsli M
and Froumlhlich J Combining near- and far-field exposure for
an organ-specific and whole-body RF-EMF proxy for
epidemiological research a reference case
Bioelectromagnetics vol 34(5) pp 366-74 2013
[LEXNET D21 2013] Vermeeren G Thielens A Aerts S Joseph W
Martens L Oliveira C Mackowiak M Correia LM
Pejanovic-Djurisic M Veljovic Z Nešković A
Koprivica M Gati A Varsier N Hadjem A Wiart J
ConilE ldquoD21 Current metrics for EMF exposure
evaluationrdquo LEXNET project April 2013
[LEXNET D22 2013] Wiedemann P M Freudenstein F ldquoD22 Risk and
exposure perceptionrdquo LEXNET project July 2013
[LEXNET D23 2013] Vermeeren G Plets D Joseph W Martens L Conil E
Varsier N Wiart J Corre Y Oliveira C Sebastiatildeo D
Correia LM Aguumlero R Diez L Rodriacuteguez L Koprivica
M Nešković A Popović M Milinković J Nikšić S ldquoD23
Scenariosrdquo LEXNET project November 2013
[LEXNET D24 2013] Conil E ldquoD24 Global Wireless Exposure Metric
Definitionrdquo LEXNET project October 2013
Document ID D26 Global Wireless Exposure Metric DefinitionFP7 Contract ndeg318273
Version V4 47Dissemination level PU
[LEXNET D32 2014] BoriesS (ed) ldquoD32 Wideband dosimeter design study amp
performances characterizationrdquo LEXNET project July
2014
[LEXNET D41 2013] Bories S Fang Y Brown TBegaud X Pinto Y Ciblat P
Ksairi N De Domenico A Clemente A Fernandez Y
Lalam M Masera E Wilson M Tesanovic M Kocan E
Pejanovic-Djurisic M Veljovic Z Milatović B Popović M
Nešković A Koprivica M Voinescu A Dragomir D
Slusanschi E laquo D41 Promising Low Exposure Index
Solutions for Components and Transmission
Techniques raquo LEXNET project November 2013
[LEXNET IR21 2013] ldquoNumerical toolsrdquo LEXNET project July 2013
[LEXNET IR51 2013] ldquoSmart low-EMF architectures state of the art and way
forwardrdquo LEXNET project May 2013
[LEXNET D25 2014] Wiedemann P M Freudenstein F ldquoD25 Risk and
exposure perceptionrdquo LEXNET project November 2014
[LEXNET D42 2014] Bories S Fang Y Brown TBegaud X Pinto Y Ciblat P
Ksairi N De Domenico A Clemente A Fernandez Y
Lalam M Masera E Wilson M Tesanovic M Kocan E
Pejanovic-Djurisic M Veljovic Z Milatović B Popović M
Nešković A Koprivica M Voinescu A Dragomir D
Slusanschi E laquo D42 Performance Evaluation of Low
Exposure index solutions for components and
Transmission Techniques raquo LEXNET project November
2014
[MaOC12] Mackowiak M Oliveira C and Correia L M RadiationPattern of Wearable Antennas A Statistical Analysis of theInfluence of the Human Body International Journal ofWireless Information Networks Vol 19 No 3 pp 209-218 2012
[MaCo13] Mackowiak M and Correia L M Statistical Model of theInfluence of Body Dynamics on the Radiation Pattern ofWearable Antennas in Off-Body Radio ChannelsWireless Personal Communications 101007s11277-013-1193-x May 2013
[Mack13] Mackowiak M Modelling MIMO Systems in Body AreaNetworks in Outdoors PhD Thesis IST - University ofLisbon Lisbon Portugal 2013
Document ID D26 Global Wireless Exposure Metric DefinitionFP7 Contract ndeg318273
Version V4 48Dissemination level PU
[NAGAOKA08] Nagaoka T and Watanabe S Postured voxel-based
human models for electromagnetic dosimetry Physics in
medicine and biology vol 53 pp 7047-7061 2008
[PLETS12] Plets D Joseph W Vanhecke K Tanghe E and Martens
L 2012 Coverage Prediction and Optimization Algorithms
for Indoor Environments EURASIP 2012123
[PLETS14] Plets D Joseph W Aerts S Vanhecke K and Martens L
accepted 2014 Prediction and comparison of downlink
electric-field and uplink localized SAR values for realistic
indoor wireless planning Radiation Protection Dosimetry
[SaNC10] SaloJ Nur-AlamM and ChangK Practical Introduction
to LTE Radio Planning white paper European
Communications Engineering (ECE) Ltd Espoo Finland
Nov 2010 (wwweceltdcom)
[TAFLOVE00] Taflove A and Hagness S C 2000 Computational
Electrodynamics The Finite-Difference Time-Domain
Method 2nd edn (Boston MA Artech House Publishers)
[TNS10] TNS Sofres survey Observatoire Socieacutetal du teacuteleacutephone
mobile Dec 2010
[VAJM13] Vermeeren G Aerts S Plets D Joseph W Martens
LConil E Varsier N Wiart J Core YOliveira C Sebastiatildeo
DCorreia L Aguumlero R Diez L Rodriacuteguez L Koprivica M
Nešković A Popović M Milinković J Nikšić S D23
Scenarios LEXNET project Novembre 2013
[WIART08] Wiart J Hadjem A Wong M F and Bloch I Analysis of
RF exposure in the head tissues of children and adults
Physics in medicine and biology vol 53 pp 3681-3695
2008
[WINNER D112 2007] Kyoumlsti P et al D112 WINNER II Channel models
WINNER project September 2007
[ZHAO02] Zhao X Kivinen J Vainikainen P Skog K Propagation
characteristics for wideband outdoor mobile
communications at 53 GHz IEEE J Sel Areas Commun
vol 20 pp 507ndash514 2002
Document ID D26 Global Wireless Exposure Metric DefinitionFP7 Contract ndeg318273
Version V4 49Dissemination level PU
APPENDIX 1 NUMERICAL DOSIMETRIC SIMULATIONS
This appendix describes the main assumptions concerning the frequency bands used
in the numerical dosimetric simulations
Table A1 gives the frequency bands used for SAR simulations as well as theservices and DLUL frequencies considered in each of those frequency bands forLEXNET studies Note that at these frequencies (especially at the higher ones) nolarge differences are expected between SAR results [CHLWW08] Accordingly forthe sake of simplicity it is assumed that
the same frequency band is assumed for both up- and down-link each frequency band may cover more than one system (eg simulation at
1940 MHz covers both GSM1800 and UMTS2000)
Table A1 Technical specifications for LEXNET selected services
SAR
simulation
frequency
band [MHz]
RAT
RAT frequency band [MHz]
DL UL
400 LTE 400 380 - 470
900
LTE 800 875- 885 830 - 840
GSM 900 935 - 960 890 - 915
UMTS 900 925 ndash 960 880 ndash 915
1940
GSM 1800 1805 - 1880 1710 - 1785
UMTS 2000 2110 - 2170 1900 - 1980
2600WiFi bgn 2400 - 2484
LTE 2600 2620 - 2690 2500 - 2570
For the WiFi an between 5470 and 5725 MHz frequency bands no SAR simulation
was performed yet
Document ID D26 Global Wireless Exposure Metric DefinitionFP7 Contract ndeg318273
Version V4 50Dissemination level PU
APPENDIX 2 INTERNAL REVIEW
Reviewer 1 Yoann Corre Reviewer 2 Mick Wilson
Answer Comments Type Answer Comments Type
1 Is the deliverable in accordance with
(i) the Descriptionof Work
Yes
No
M
m
a
Yes
No
M
m
a
(ii) the internationalState of theArt
Yes
No
M
m
a
Yes
No
M
m
a
2 Is the quality of the deliverable in a status
(i) that allows tosend it to EC
Yes
No
M
m
a
Yes
No
M
m
a
(ii) that needsimprovement ofthe writing bythe editor of thedeliverable
Yes
No
See proposedenhancements
In particular thepresentation of the basic EIconcept could be improvedin the Abstract Introductionsection 21 and Conclusion
M
m
a
Yes
No
See comments onSection 3
M
m
a
(iii) that needsfurther work bythe partnersresponsible forthe deliverable
Yes
No
Mostly minor changes Seethe proposedenhancements
Section 44 is a copy-pastof a whole section in D33Either D26 or D33 must bechanged to avoidredundancy (replacing thewhole description by asummary adapted to theintegrated deliverable)
It must be made more clearwhere the reader will findthe missing SAR data andthe announced uncertaintystudy results
M
m
a
Yes
No
M
m
a
Type of comments M = Major comment m = minor comment a = advice

Document ID D26 Global Wireless Exposure Metric DefinitionFP7 Contract ndeg318273
Version V4 9Dissemination level PU
Basically two types of metrics are distinguished the ones dedicated to the exposureinduced by sources close to the users as personal devices and expressed in termsof Specific Absorption Rate (SAR) and the ones focusing on the exposure induced byfar field sources as access points or base station antennas and currently expressedin ElectricMagnetic fields or Power DensityPersonal devices and base stations are too often represented as two separate worldswhen dealing with exposure issue But the connection between exposure induced bypersonal devices and base stations is indisputable Measurements on real networksillustrate a strong correlation (Figure 3) between the power emitted by personaldevices and the power received by personal devices from the base station antennas[GCWW10]
Figure 3 Duality between mobile phones emitted and received powers measured duringvoice calls on the 3G Orange France network - source [GCWW10]
The project LEXNET aims at filling the gap between these two separate ways ofdealing with exposure by proposing a new exposure metric named Exposure Index(EI) The EI is assessing the average exposure of a population induced by bothpersonal devices and base stations (or access points) The concept is to average thisglobal exposure over space by assessing the EI in a given area and average it overtime by considering a given time frame Therefore an important question that theproject must absolutely address is about the understandability and acceptability ofthis new exposure metric by the general publicA second survey has been therefore conducted in the framework of LEXNET Datawere collected from July to September 2014 in France Germany United KingdomPortugal Spain Romania and Serbia among a representative sample of the generalpopulation A total of 1809 respondents participated in this second surveyAn important part of the survey focused on how people are considering strategiesproposed in the framework of the LEXNET project to define and minimize thepopulationrsquos exposure to electromagnetic fieldsOnly key findings are reported here but detailed description of the survey and of theresults is in the deliverable entitled ldquoD25 Risk and exposure perceptionrdquo [LEXNETD25 2014]
-60 -40 -20 0 20 40
-120
-100
-80
-60
-40
Emitted power by devices (dBm)
Rec
eive
dpo
wer
by
devi
ces
(dB
m)
GSM 900
GSM 1800
UMTS 2100
Document ID D26 Global Wireless Exposure Metric DefinitionFP7 Contract ndeg318273
Version V4 10Dissemination level PU
When asked about adding up the exposure from personal wireless devices and theexposure from base stations when evaluating the exposure of people to EMF morethan 90 of respondents agreed on the fact that both downlink and uplink exposuresshould be considered when evaluating the population exposure to EMFA large percentage of respondents also agreed when asked if it makes sense tocharacterize the day-to-day exposure to EMF by averaging it over time or if they thinkthat an individual exposure to EMF can be approximated by measuring the exposureover a large population
The next chapter of this deliverable describes the Exposure Index proposed by theproject LEXNET
Document ID D26 Global Wireless Exposure Metric DefinitionFP7 Contract ndeg318273
Version V4 11Dissemination level PU
2 THE EXPOSURE INDEX
21 Key concept
The Exposure Index (EI) takes into account the global EMF exposure of apopulation to a given wireless telecommunication network (or a set of networks)The EI does not take into account the exposure induced by other RF sourcessuch as Frequency Modulation (FM) radio or digital terrestrial televisiontransmittersIt covers the exposure of a population during a given time frame in a given areaincurred by a wireless telecommunication network as a whole aggregating thedownlink exposure induced all day long by base stations and access points andthe uplink exposure incurred by individual wireless communication devices Theuplink exposure can be subdivided in exposure due to the uplink of the userrsquos owndevice and the uplink of devices operated by other users nearbyIn order to assess the realistic exposure of a population many parametersinfluencing the exposure need to be taken into account in the Exposure Indexage (adult and child exposure are different [CHLWW08] [WIART08]) posture[NAGAOKA08] usage technology environment etchellip
In a nutshell the LEXNET Exposure Index is a function transforming a highlycomplex set of data into a single parameter which has two key benefits it isunderstandable acceptable and usable for all the stakeholders from generalpublic to regulatory bodies and it is linked in a tangible way to the networkoperating parameters
The EI is built from the aggregation of individual exposure contributions generatedby a specific exposure source in specific exposure situations For instance anaveraged individual exposure generated by WiFi 24 GHz can be calculated atday time for an adult heavy-user located indoors sitting and with a tablet Thesame kind of individual exposure is estimated for other time periods RATspopulations environments usages and postures to get complete elements thatcompose the EI The individual exposure contributions are weighted according totheir representativeness before aggregationThe individual exposure is the sum of a down-link (DL) and up-link (UL)components as explained with more details in section 221
The EI is computed in a given area from the aggregation of individual exposurecontributions in a chain of exposure (see Figure 4) The nodes in this chain arerelated to different exposure sources or exposure situationsbull the time periods as the configuration of the network and type of usage depend
on the time of day (low-load night-time vs heavily loaded peak-hour)bull the population as different population categories will have different life
segmentations and different usages of wireless devicesbull the user profilebull the different locations as the exposure configurations will be different in
different environments
Document ID D26 Global Wireless Exposure Metric DefinitionFP7 Contract ndeg318273
Version V4 12Dissemination level PU
bull the radio access technologies RATs (GSM UMTS LTE WiFi etc)frequency bands and deployment layers (macro micro and femto cells) thatusers connect to
bull the posture as different body postures will lead to different absorption rates inthe human body
bull the device usage (making a phone call does not lead to the same exposure asdownloading data)
Figure 4 the LEXNET chain of exposure
Different exposure scenarios [LEXNET D23 2013] are considered and aggregatedby putting weights on each configuration thereby determining the EI A partial EI canbe for example computed for a scenario that considers only a subset of RATspopulation environment etc Then several partial EI can be aggregated with aweight related to their representativenessEI takes into account all these parameters coming both from the telecom world todescribe the accessible network environment and from data on how people segmenttheir life to describe how people are using this network
22 Mathematical formalization
221 Exposure Index Equation
The Exposure Index is calculated for a finite geographical area which can be ofurban suburban or rural type for instanceThe general formulation of the Exposure Index contains a set of technicalparameters as described below The number of values classes or settings ofeach parameter depends on the level of detail of the available data and on thelevel of achievable complexity in terms of calculation For a given geographicalarea the EI takes the following into account (see also Table 1)
the time period (t) eg day and night
Document ID D26 Global Wireless Exposure Metric DefinitionFP7 Contract ndeg318273
Version V4 13Dissemination level PU
the population (p) segmented into different categories eg children (under15 yo) young people (15-29 yo) adults (30-59 yo) and seniors (60 yoand over)
the user load profiles (l) eg heavy medium light or non-users the environment (e) eg indoor (office home) outdoor and in commuting
(bus car subway etchellip) the different available Radio Access Technologies (RATs) (r) eg 2G (900
MHz and 1800 MHz) 3G 4G WiFi the number of RATs depends on thescenario
the different cell types (c) eg macro micro pico and femto cells theaccessibility to the different cell types depends on the scenario
the posture (pos) eg sitting standing the usage (u) is described by the device (eg mobile PC laptop) and the
usage (eg voice call data)
Time PopulationUser
ProfileEnvironment RAT Cell Type Posture Usage
Day Children Heavy Indoor 2G Macro Standing Voice mobile
Night Youngpeople
Medium Outdoor 3G Micro Sitting Data mobile
Adults Light Commuting 4G Pico Data Tablet
Seniors Nonuser
WiFi Femto Data Laptopon the laps
Data Laptopon the desk
Table 1 input variables in the modelling of the EI
The individual exposure contributions rely on the SAR expressed in Wkg The SARwill depend on the device the frequency band the morphology and the posture ofthe user as well as on the position and distance of the source with respect to theuser As part of LEXNET a set of numerical dosimetric simulations are performed inorder to fill out a comprehensive matrix of raw normalized SAR values These SARvalues can be whole-body or localized SAR values Whole-body SAR values areevaluated by averaging SAR over the whole-body whereas localized SAR values arevalues focusing on a body volume specific organ or tissue Different EI can beevaluated depending on the value of interest (whole-body or localized value)Network simulation tools will provide transmitted and received power average valuesto apply to the raw SAR matrixInformation and Communication Technologies (ICT) usage data obtained throughsensors inside the network and segmentation life data will finally provide the levels toapply for the evaluation of the EI
Document ID D26 Global Wireless Exposure Metric DefinitionFP7 Contract ndeg318273
Version V4 14Dissemination level PU
SARܫܧ =1
T
tperlcpos ൫ ത
൯
ே
௨
ேೞ
௦
ேಽ
ே
ேೃ
ேಶ
ேು
ே
௧
+ RXinc + ௦ௗ௩௦ோ௦ௗ௩௦
൨
(1)
where EISAR is the Exposure Index value the average exposure of the population of
the considered geographical area over the considered time frame T SARrefers to whole-body SAR organ-specific SAR or localized SAR
N is the number of considered periods within the considered time frame (egsingle day)
N is the number of considered Population categories N is the number of considered Environments N is the number of considered Radio Access Technologies Nେ is the number of considered Cell types N is the number of considered user Load profiles N୮୭ୱ is the number of considered Postures
N is the number of considered Usages with devices Pഥଡ଼ is the mean TX power transmitted by the usersrsquo devices during the period
t in usage mode u connected to RAT r in environment e For example whenEI is computed from simulation tools the TX power can be predicted over amap that covers the whole considered geographical area and the averagevalue is extracted for the EI evaluation See details in section 223
Sത ଡ଼୧୬ୡis the mean incident power density on the human body during the periodt induced by RAT r in environment e A distribution of the incident powerdensity for the whole considered geographical area is considered and theaverage value over this area is taken into account for the EI evaluation
ோ௦ௗ௩௦ is the incident power density on the human body during the
period t induced by a wireless device connected to RAT r of a user in theproximity in environment e This term is important when the exposed personis the user itself it can also be significant for persons in the proximity of usersof a wireless device for instance in a crowded meeting room in publictransportation etc In the applications discussed in this paper this term is
neglected We also remark that ோ௦ௗ௩௦ depends on the orientation of
the user of the wireless device with respect to the body of the people in itsproximity See details in section 223
d (ௐ ௦
) ௦ௗ௩௦ (
ௐ ௦
ௐ
మ) and dୈ (ௐ ௦
ௐ
మ ) are the normalised
raw dose values for UL the DL from the user in the proximity and DL frombase stations and access points respectively all multiplied by the time spentin the configuration See details in section 222
Document ID D26 Global Wireless Exposure Metric DefinitionFP7 Contract ndeg318273
Version V4 15Dissemination level PU
f୲୮ ୪ୡ୮୭ୱ is the fraction of the total population that corresponds to population
category p user load profile l in posture pos connected to RAT r for a celltype c in environment e during the time period t
In the following we explain the different terms used in the EI formula in more detail
222 Coefficients and
The coefficient is associated to the exposure induced by the uplink andexpressed as an absorbed dose normalised to a transmitted power of 1 W
[ୱ୩
]
=௧௨௦[ୱ]ܦ
௨௦[ܣ ୩]
[ ]
Ws
kgW൨ (2)
where ௧௨௦ܦ
is the time duration of usage ݑ and a user profile load when
connected to the RAT ݎ operating in cell type in the environment for thepopulation category in the posture pos during the time period of the day ݐ
ௌோೠೞ
ಽ
can be the whole body or an organ-specific or tissue-specific
valueܣ for the usage ݑ and the posture pos in the frequency band of theRAT ݎ and the population category calculated for an incident emitted power
of
and normalized to this power
The coefficient is associated to the exposure induced by the downlink and alsoexpressed as an absorbed dose normalised to an incident power density of 1 Wm2
[ୱ୩
]
=௧௦[ୱ]ܦ
௦[ܣ ୩]
RX[W]inc
ݏ
ଶ ൨ (3)
where ௧௦ܦ
is the time duration of posture ݏ when connected to the RAT ݎ
operating in cell type in the environment for the population during thetime period of the day ݐ
ௌோೞ
ವಽ
ௌೃ can be the whole body or an organ-specific or tissue-specific
valueܣ induced by the base station or access points of the RAT ݎ in thepopulation for the posture ݏ normalized to the received power density
ோ
223 Transmitted power ഥ and received power density ത ܖ
ത is the average power transmitted by the device in busy mode (in active
communication) It should be noted that even in idle mode (not for activecommunication) the devices transmit from time to time some power (to stay
Document ID D26 Global Wireless Exposure Metric DefinitionFP7 Contract ndeg318273
Version V4 16Dissemination level PU
synchronized with the network for example) but the exposure induced by the devicein idle mode is negligible as it is based on rare eventsSത୧୬ୡ is the average power density incident on the human body from the base stationsor access points of the RAT The incident power density is assessed not only forusers of mobile devices but also for non-users It is assumed that the usage patternof the user considered in the EI formula does not influence the average incidentpower density From a theoretical point of view Sത୧୬ୡ is the average incident powerdensity integrated over all the frequency bands of the RAT and cell type consideredFrom a practical point of view Sത୧୬ୡ can be assessed directly from spectrum analyzer(SA) measurements dosimeters simulations and indirectly from the received poweron a user device or in a drive test measurementത and Sത୧୬ୡ average out the instantaneous variations of the transmitted power and
incident power density that arise during a communication These variations occurwhen the user is static or moving over a very small distance and are caused bydifferent phenomenas (power regulation small-scale fading resource allocation usertraffic variations etc) Values that will be used in the EI evaluation are averagedvalues over the whole considered geographical area
For both the evaluation of the DL incident power density and UL transmitted powerthe ressource allocation or duty cycle of the system has to be taken into account TheEI computation does not rely on maximum allowed power values (as in existing EMFexposure procedures) but on the incident and transmitted powers that respectivelydepend on the DL network and UL user resource load This definition leads to anestimate of the UL transmitted power that necessarily depend on the type of usertraffic (eg voice web browsing file upload etc) the higher is the instantaneous ULthroughput during the communication the higher is generally the UL transmittedpower
224 Index computation data sources
The EI evaluation relies on the collection of a wide range of data from simulationtools literature models and measurement equipments that will be demonstrated inthe LEXNET technical work-packages All the input data that were collected and areused in the framework of the project will be stored in an internal document
For life segmentation data in particular up-to-date life segmentation surveyscollected in the different participated countries were used to extract information onhow different categories of population segment their daily lifes (see Table 2)[INSEE11] [ALIAGA06]
Populationcategory
Day (8 AM-6 PM) Night (6 PM- 8AM)
Indoor(office-school-home)
Outdoor
Transportation (bus car
subwayetchellip)
Indoor(home)
Outdoor
Transportation (bus car
subwayetchellip)
Adults8h15
(825)1h10
(115)35 min
(6)13h05 min
(935)20 min(25)
35 min(4)
Document ID D26 Global Wireless Exposure Metric DefinitionFP7 Contract ndeg318273
Version V4 17Dissemination level PU
Youngpeople
8h20(83)
1h10(115)
30 min(55)
13h10 min(94)
20 min(25)
30 min(35)
Children8h15
(825)1h30 (15
)
15 min(25)
13h45 min(985)
0 min
(0 )
15 min(15)
Seniors7h35(70)
2h10(275)
15 min(25)
13h05 min(935)
40 min(5)
15 min(15)
Table 2 Life segmentation inputs for evaluation of the Exposure Index
ICT Usage data (usage of mobile phones for voice call or data usage of tabletsPChellip) are obtained through measurements of Key Performance Indicators (KPIs) bysensors inside the network KPIs of interest for evaluating the EI are for each userthe uplink and downlink data traffic volumes the number of voice calls the durationof each voice call etchellip The network operators involved in the LEXNET project ieOrange (France) and Telekom Serbia (Serbia) as well as the operators fromMontenegro being partners of University of Montenegro provided such data
3G denseurban
Voice Data (82 DL 18 UL)
tcom (s) volULdata [kB] volDLdata [kB]
Heavy user
Day 841 4948 25124
Night 689 5879 31922
Medium user
Day 147 464 2390
Night 86 387 2001
Light user
Day 26 35 158
Night 16 28 124
Table 3 shows usage data that could be derived from KPIs obtained throughmeasurements in a 3G network
3G denseurban
Voice Data (82 DL 18 UL)
tcom (s) volULdata [kB] volDLdata [kB]
Heavy user
Day 841 4948 25124
Night 689 5879 31922
Medium user
Day 147 464 2390
Night 86 387 2001
Light user
Day 26 35 158
Document ID D26 Global Wireless Exposure Metric DefinitionFP7 Contract ndeg318273
Version V4 18Dissemination level PU
Night 16 28 124Table 3 Average communication durations and data traffic volumes per user profile for a 3G
dense urban network
Reference SAR data were computed using 3D electromagnetic simulation platformsbased on the Finite Difference Time Domain (FDTD) method [TAFLOVE00] SARvalues were calculated for far-field and near-field exposure for two anatomical humanbody models of the Virtual Family [CHRIST10] Duke a 34-year-old male and Earthaan 8-year-old girl Two postures (standing and sitting) and three usages (mobilephone close to the head mobile phone or tablet for data and laptop usage) wereselected More details on numerical simulations can be found in [LEXNET IR212013]Table 4 shows the matrix of raw whole body averaged ௨௦ܣ
values induced in
an adult for a mobile phone usage the same table exists for other usages and forchild exposure
p=adult u=MOBILES
r=Frequency Band
Usage u400MHz
band (LTE)900MHz band(GSM UMTS
LTE)
1800-1940MHzband
(GSM 3G LTE)
24-26GHz(WiFi LTE)
Sitting Data 00078 00056 00016 73E-04Voice X 0012 00052 00047
Standing Data 0003 00049 319E-04 21E-05Voice X 0012 00052 00053
Table 4 Values of normalized whole-body ܛܗܘܝܚܘۯۺ induced in an adult by near sources
(mobiles laptops tablets) in different postures (all the values are given in Wkg and were
normalized to ] ]
= )
Table 5 shows the matrix of raw whole body averaged ௦ܣ values induced in an
adult by far field sources the same table exists for child exposure
p=adult r=Base station antennas (plane waves)
u=usage 400MHz band(LTE)
900MHz band(GSM UMTS
LTE)
1800-1940MHzband
(GSM UMTSLTE)
26GHz band(LTE)
Sitting 00050 00056 00043 00039Standing 00064 00052 00046 00042
Table 5 Values of normalized whole body ܛܗܘܚܘۯۺ۲ induced in adult by far and intermediate
sources (base stations and access points) (all the values are given in Wkg and were
normalized to RX[W]inc
= 1 Wm-2
)
It is worth pointing out that the aforementioned exposure index EI is defined on thebasis of the whole body averaged SAR But a local EI could be also derived fromlocal or tissue-specific SAR values
Document ID D26 Global Wireless Exposure Metric DefinitionFP7 Contract ndeg318273
Version V4 19Dissemination level PU
Last main data required to evaluate the EI are the average DL power density and ULtransmitted power They can be predicted from wireless network planning tools network monitoring tools or dosimeter The predictions or measurements collect awide range data at different locations within the study area for different periods oftime and possibly for different usages in order to derive relevant average valuesTwo types of dosimeters are designed in LEXNET wearable and fixed dosimeterslsquoIn sitursquo measurements were executed close to the end-user body thanks to thewearable version of the dosimeter Fixed dosimeters are being deployed in a densesensors network of a lsquosmartrsquo city More information on the LEXNET measurementtools is available in [LEXNET D61] and on the related assessment methodologies in[LEXNET D33]
23 Variability and uncertainty
The exposure index is the output of an analytical model expressed by the equation(1) with a number of uncertain input variables To propagate the uncertaintyassociated to the input variables in the model the first step consists in characterizingthe distribution of input variables Each uncertain variable input will be described by astatistical distributionThe uncertainties of the life segmentation data will be analyzed and modelled usingcomputable functions such as Gamma Gaussian or uniform distributionsUncertainties on the time use structure on an average day the usage segmentationand the average durations of usage will be characterizedAverage DL power density and UL transmitted power are estimated using specificconfigurations environments and usages The downlink power absorbed by the userand the uplink power emitted by the device (and so partially absorbed by the user)depend on these configurations environments and usages Their statisticaldistributions have to be characterized in order to be incorporated in the total EIstatistical uncertaintyA sensitivity analysis is ongoing in order to determine the most important parametersin the EI equation and how we could simplify the EI formula We are using Polynomialchaos and copulas for modelling of dependant parameters All the results onvariability and uncertainties will be available at the end of the LEXNET project indeliverable D28
The uplink exposure characterization requires a precise modeling of the poweremitted by the device Usually this exposure will depend on two parameters theposition of the personal device relative to the user body and the variation in spatialdistribution of the antenna gain due to the induced coupling effects The impact of thepositioning of the wireless device has been investigated by varying the position ofpersonal device with respect to the body Results have shown that the whole-bodySAR is not very sensitive to the device positionTo investigate the impact of the antenna gain on the variability of the emitted powerwe have used a statistical model of propagation channel [IST]Two propagation scenarios have been tested line of sight (LOS) and non-line ofsight (NLOS) For both scenarios we considered a lognormal distribution for theemitted power with a coefficient of variation up to 120 in the case of LOS and up to57 in the case of NLOS when studying the case of mobile phone emitting at 900MHz frequency This lognormal distribution characterizes the variability of the power
Document ID D26 Global Wireless Exposure Metric DefinitionFP7 Contract ndeg318273
Version V4 20Dissemination level PU
emitted versus the antenna gain Firstly we are assuming that the communication ismade via a single path namely LOS Assuming that the user can change randomlyits orientation with respect to the receiver antenna (eg base station) the antennagain in the LOS direction will also change depending on the user orientation Tomaintain a same control power (assumed fixed by the base station to ensure asuccessful decoding) the product of the emitted power to the antenna gain in LOSdirection should be a constant namely 1 mW in our analysis In the same spirit wehave analyzed the NLOS scenario by adding secondary paths The characterizationof the power emitted allows estimating the related exposure using the proportionalrelationship Figure 5 presents the cumulative distribution function of the poweremitted by the mobile phone when the average power required by the base stationoutside the small sphere surrounding the transmitter system (user + mobile phone) iskept to 1 mW
Figure 5 Cumulative distribution function (CDF) of the power emitted by the mobile phone (at 900MHz) obtained with both propagation scenarios (LOS and NLOS)
We could notice that the power emitted is very sensitive to the spatial distribution ofthe antenna gain especially in the case of LOS
The downlink exposure is very sensitive to the propagation environment[KALLIOLA02] [KIENTEGA11] Many physical obstacles (such as tunnels andbuildings) between the transmitter and receiver can affect the characteristics of theambient electric field This latter depends on many parameters such as the number ofwave components (due to the reflections and diffractions undergone by the originalwave radio) the fluctuations of the wave amplitude its phases and arrival angles Inthe literature several studies focused on the modeling of the electromagneticenvironment in realistic conditions by giving the statistics distributions of all of theseparameters [KALLIOLA02] [ZHAO02] [WINNER D112 2007] Based on the modelsproposed by these studies we simulated a downlink exposure induced by a realisticpropagation environment Figure 6 shows the variations of the whole body SARinduced by a single plane wave at 900 MHz
Document ID D26 Global Wireless Exposure Metric DefinitionFP7 Contract ndeg318273
Version V4 21Dissemination level PU
Figure 6 Variation of the exposure induced by a single plane wave (LOS) at 900 MHz for differentpolarization (horizontalH verticalV)
Other sources of uncertainties exist as the information on the network wirelessinfrastructure (eg the base station antenna location and orientation) the userequipment performance the Prediction errors (propagation UL power control modeletchellip) some being discussed in [D33 section 231] or measurement discretization(eg with a limited number of fixed dosimeters [D33 section 26])
3 HOW TO USE THE INDEX OF EXPOSURE
The synthetic index which is presented above aims at gathering all contributions tothe population EMF exposure induced by wireless communication networks By itselfbuilding such an index is already a challenging goal but LEXNET goes beyond thedefinition of the EI since it seeks reducing the exposure by exploring innovativetechniques at the lower (mainly PHY level) or upper layers (network level andresource management)
However a general formulation of the EI is given in this document the EI needs to beslightly adapted to the particular characteristics of each technique evaluationscenario The basic idea is that each of the proposed techniques would probablyfocus on a particular parameter and most likely on a single scenario Proposedtechniques could therefore be evaluated by using a partial EI Hence their benefitswould be specific to the characteristics of the selected use case and their impact overthe overall EI would need to be adjusted accordingly A reference scenario detailedbelow has been defined in order for all the proposed reducing solutions to be testedon one unique global scenario
31 Reference scenario
One reference global scenario will be used as a starting point scenario by LEXNETtechnical work-packages (WP 4 5 and 6) to evaluate the EI ldquobeforerdquo implementationof LEXNET exposure-minimization techniques
Document ID D26 Global Wireless Exposure Metric DefinitionFP7 Contract ndeg318273
Version V4 22Dissemination level PU
Parameter Value
Time periods Day Night
Population Adult children
Load profiles Heavy moderate light and non user
Environments Outdoor indoor commuting
RATsCellTypes
Type 2G 3G 4G WiFi
Cell size Variable (mainly depends on theenvironment)
Cell type Macro
User
Usage Voice data
Equipment Smartphone tablet Laptop (dongle)
Posture Standing sitting
The EI will be evaluated for this specific scenario using life segmentation usage andSAR data introduced in the previous chapterThen each partner will be free to test their minimizing solutions on this scenario andto calculate an EI ldquoafterrdquo LEXNETScenarios for each RAT can be simulated separately and percentages of mobiletraffic per RAT can be afterwards used as input for the EI (see Figure 7) It can beenvisaged that modifying these percentages could be one network managementsolution for reducing the EI assuming in a first approximation that the traffic per RAThas no strong influence on the RAT exposure metrics which is not completely right
Figure 7 Connections by RAT [CISCO13]
Document ID D26 Global Wireless Exposure Metric DefinitionFP7 Contract ndeg318273
Version V4 23Dissemination level PU
32 Reducing the EMF exposure using the EI
321 Lower layer solutions a common methodology to use the EI
The EI is a relevant global metric for evaluation of radio technologies performances interm of exposure reduction However WP4 has identified some difficulties to directlyaddress the global calculation To reach this global evaluation target WP4 hasadopted a specific and indirect methodology described in [LEXNET D42 2014]deliverable and synthesised in the following Despite a large diversity of technicaldomains whatever the scenario or the Radio Access Technologies (RAT) a singlestrategy to organize and align the different WP4 exposure evaluations is proposed Afive steps methodology has been established in order to evaluate and harmonize theoverall exposure improvement for each technology These steps also attempt toprovide the basis for future global exposure reduction evaluation in order todetermine the most promising WP4 techniques based on fair and relevantcomparisons
The first step is to identify how the individual WP4 techniques contribute towards theoverall LEXNET use case scenarios from WP2 Specifically for WP4 evaluations foursub-scenarios have been introduced (Macro-Cell Small-Cell Rural and WSN ampWiFi) (Step-1a) This sub-scenario categorization highlights which solutions arecomplementary and which will require further analysis to determine potential conflictsIn order to harmonize the evaluations from the studies of different solutions it iscrucial to describe properly and extensively each assumption and the inputparameters values related to the context study (Step-1b)
A limited numbers of Key Performances Indicators (KPI) for the exposure and for theQoS are used in the evaluation of each WP4 technique The step-2 has to clearlyidentify the KPIs being addressed by individual technique exploration It is taken asmore convenient to work with one of the following three simpler metrics or KPIsderived from the EI formula and addressing UL exposure
The first metric is the Specific Absorption Rate (SAR l mTx ) which describes the
amount of EM energy absorbed into the userrsquos body via the spatial distributionof the EM field from the source Thus SAR is particularly relevant for antennasolutions
The second metric is the mean duration of exposure (UL
kjit ) which indicatesthe amount of time the user is exposed It impacts the EI which is defined as adose For example the duration is impacted by the amount of transmitted dataReduced retransmission improved interference management and signalingreduction strategies are all ways of decreasing this metric The duration usedto calculate the mean is selected regarding the time constant of the studiedtechnique
The third metric is the mean transmitted power ( TxP ) during the considered
mean exposure duration As an example a 1 dB improvement on the receivingsensitivity at the Base Station (BS) could be converted in a 1 dB reduction ofthe transmit power at the User Equipment (UE) Again the duration used tocalculate the mean is selected regarding the time constant of the studiedtechnique
Document ID D26 Global Wireless Exposure Metric DefinitionFP7 Contract ndeg318273
Version V4 24Dissemination level PU
Notice that an equivalent set of three metrics adresses the DL
The step-3 concerns the evaluation itself of a partial EI ratio in comparison with abaseline scenario that is to say without implementing the studied solution Theexposure reduction is evaluated through the calculation of an EI ratio by comparingthe lsquoafter LEXNETrsquo versus the lsquobefore LEXNETrsquo (ie SotA or standard) baselineconfigurations (Eq 4) The main advantage of the proposed approach is that in mostof the presented solutions the three KPIs are independent from each other Byconsidering a given sub-scenario and depending whether the UL or the DL is studiedthis means that if a solution succeeds in decreasing the selected single KPI the twoothers will stay constant when the solution is implemented or not Thus in thatspecific sub-scenario the EI ratio is equal to the selected KPI ratio (Eq 5) Thisexposure metric is easily matched with a typical RF front-end or PHY layer evaluationstudies
(4)
This formula is simplified when a specific sub-scenario is considered
(5)
Where
partialEI is the Exposure Index for a specific sub-scenario
partialKPI is the identified metric among the three detailed in step 2
the subscript lsquow LEXrsquo correspond to the Lexnet solution implementationthe subscript lsquowo LEXrsquo correspond to the SotA or baseline (without the solutionimplementation)
Meanwhile the selected QoS metric is also evaluated with and without LEXNETsolution
The step-4 aims to ensure that capacity or QoS improvements are converted intoexposure reduction It is worth reminding that the objective of LEXNET studies is toreduce exposure without impacting QoS
At last the step-5 estimates the absolute global EI reduction from the previous stepsrsquopartial EI results throught the 24 hours LEXNET reference scenario The so-calleddilution factor [LEXNET D41 2013] is taken into account during this step-5 Theusage statistics from WP2 are used to weight the calculated partial EI reduction inorder to assess the global EI reduction for a given solution
To conclude a scheme summarizes the WP4 common EI evaluation methodology inFigure 8 This process is sufficiently generic to be applied by any of the WP4proposed solutions and examples of its step by step application can be found in[LEXNET D42 2014]
100LEXwoEI
LEXwoEI-LEXwEI()Ratio
partial
partialpartial
EI
100LEXwoKPI
LEXwoKPI-LEXwKPI()Ratio
partial
partialpartial
EI
Document ID D26 Global Wireless Exposure Metric DefinitionFP7 Contract ndeg318273
Version V4 25Dissemination level PU
Figure 8 Common EI evaluation methodology for WP4 techniques
322 Upper layer and resource management techniques
By introducing and promoting the EI as a new planning metric LEXNET intendsamong other objectives to help reduce local town planning objections to applicationsfor installing new base stations Work carried out by LEXNET WP5 so far hasdemonstrated that real-time EMF-aware network management strategies depend oncurrent traffic load radio conditions mobility application used and the duration ofuse available networks and UE capabilities Since EI calculations take into accountlong-term network statistics distributions of user profiles and habits (services usedetc) times of day period of year etc EI itself may therefore be better suited for initialnetwork design and AP placement while other metrics may be better suited for real-
Document ID D26 Global Wireless Exposure Metric DefinitionFP7 Contract ndeg318273
Version V4 26Dissemination level PU
time EMF management Clearly a link between these proxy-metrics and long-term EIvalues is needed The underlying assumption is that if we try to reduce the level ofEMF by applying correct general policies and additionally control it on a smaller time-scale (eg seconds or minutes) with fast-loop control then the overall exposure andthe EI (defined on daily level) will decreaseFast-loop (event-based) EMF control would be a response to a temporary change ofconditions This kind of control requires triggers ie thresholds that can be assessedon near-real-time scale ndash this time scale may not be as granular as for power controlFor fast-loop control offload techniques may be used as for general strategy butalso other strategies such as changing codecs delaying transmission etc Fast-loopcontrol without using triggers would be periodic optimization on a smaller time-scaleProxy metrics to be used for fast-loop control involve data that may be collected fromthe network and include
bull Measurements (UL Tx power RSSI RSCPhellip)
bull User context velocity services used profile
bull Statistics cell statistics (traffic load) etc
Some preliminary results using various proxy metrics which illustrate the pointsabove are shown hereFigure 9 shows live network measurements illustrating that available cellulartechnologies and current traffic conditions are two of the main points to be taken intoaccount when designing low-EMF solutions The metric used here is the UL Txpower The same metric is used in Figure 10 and Figure 11 which show that the typeof service could increase the exposure (based on UL Tx power) meaning thatdifferent strategies should be used to identify the best connectivity according to theservice flow requested The actual UL Tx power values can then be used in EIcalculations
Figure 9 Comparison of different 2G3G cells in high load hours by UE Tx power
Document ID D26 Global Wireless Exposure Metric DefinitionFP7 Contract ndeg318273
Version V4 27Dissemination level PU
Figure 10 Comparison of UL FTP and voice services over 2G3G cells in high load hours by UE Txpower
Figure 11 Comparison of voice service over 3G and voice service using Skype over 3G network
Another common proxy with direct link to EI is the DL power density Figure 12 showshow DL power density and UL transmit power vary for different ISD values in an LTEnetwork Based on these simulations it can be seen that small-cell densification inurban areas allows for significant exposure reduction which now needs to betranslated into the EI using various assumptions on user distributions and type ofusage
Document ID D26 Global Wireless Exposure Metric DefinitionFP7 Contract ndeg318273
Version V4 28Dissemination level PU
Figure 12 DL power density and UL transmit power for different ISD values
Whole-body SAR is another proxy metric whose statistical processing can leaddirectly to EI calculations As an example of SAR values obtained by a tooldeveloped for the prediction of whole-body and localized SARs and absorbed dosesfor indoor wireless network deployments in Figure 13 we show distributions for thetraditional deployment (top) and for the WP5 exposure-optimized deployment
Figure 13 Whole-body SAR_DL (distribution for the traditional deployment (top) and for the exposure-optimized deployment (bottom)
Document ID D26 Global Wireless Exposure Metric DefinitionFP7 Contract ndeg318273
Version V4 29Dissemination level PU
4 EXAMPLES OF APPLICATION
41 Computing chain
In this section three simplified examples of EI computation are detailed In no casethese examples are representing the completeness of the possibilities that can becover by the EI but they illustrate the process of computation
The first two examples illustrate the use of network planning tools in the evaluation ofthe EIThe first example detailed in the section 42 consists in comparing two indoor officescenarios first with wireless communication offered by only 3G outdoor macro basestations scenario and secondly with an additional 3G femtocell (Table 6)
Scenario 1
Time PopulationUser
ProfileEnvironment RAT Cell Type Posture Usage
1h inthe
afternoon
Adults Heavy Indoor 3G Macro Standing Voice mobile
Medium Datamobile
Light Data Tablet
Nonuser
Data Laptop
Scenario 2
Time PopulationUser
ProfileEnvironment RAT Cell Type Posture Usage
1h inthe
afternoon
Adults Heavy Indoor 3G Femto Standing Voice mobile
Medium Datamobile
Light Data Tablet
Nonuser
Data Laptop
Table 6 input variables for the 3G indoor sub-scenarios described in section 42
The second example detailed in section 43 is considering a data LTE macro urbanscenario (Table 7)
Time PopulationUser
ProfileEnvironment RAT Cell Type Posture Usage
Day Youngpeople
Moderate Indoor 4G Macro Standing Data mobile
Document ID D26 Global Wireless Exposure Metric DefinitionFP7 Contract ndeg318273
Version V4 30Dissemination level PU
Night Adults Non user Outdoor Sitting Data mobile
Seniors Data Tablet
Table 7 input variables for the LTE scenario described in section 43
The last example detailed in section 44 illustrates the use of dosimetermeasurements in the EI evaluation It is considering a macro outdoor LTE scenariowhere one user is wearing a dosimeter
42 Indoor exposure from 3G macro and femto-cells
The EI was evaluated for two scenarios considering the exposure of people locatedindoor The population consisted of adults making UMTS (phone calls with thephone on the right side of the head The scenario 1 is considering a macrocellconnection and the scenario 2 an indoor small cell connection Different user profilesare considered
10 heavy users 30 s usage 50 moderate users 10 s usage 25 light users 3 s usage 15 no usage 0 s usage
For the calculation of the EI several input parameters are needed reference SARvalues averaged transmitted power valuesത and averaged incident power densityvalues inc (see Table 8)The power (density) values that were used for the indoor macrocell scenario arederived from measurements in an office building (Zuiderpoort building GhentBelgium) [PLETS14] Figure 14 shows the considered buildingFor the indoor femtocell scenario accurate power (density) values from the WHIPPtool a heuristic indoor network calculator and planner [PLETS12] were used In theconsidered building a femtocell with an Equivalent Isotropically Radiated Power(EIRP) of 7 dBm is installed A different femtocell EIRP can lead to a largely differentEI Reference SAR values were taken from [LAUER13] and applied to the scenariosfor an adult standing using the phone on the right side of the head Since the
measured macrocell values (RXinc and Pഥଡ଼) were not recorded in the smaller andmore enclosed central areas of the building floor (toilets kitchen shedhellip) femtocellpredictions were limited to the non-shaded areas around the center in Figure 14 Forthe femtocell values locations within 50 cm of the base station are discardedassuming that people stay at least half a meter away from base stations For thesimulations a sub-scenario is also considered for which a 20 dB worse macrocellconnection is assumed for the same building floor This could correspond to abuilding with a penetration loss that is 20 dB higher than before or a building which islocated further from the macrocell base station (path loss increase of 20 dB) Table 8
shows that the assumed Pഥଡ଼ RXinc values in case of a lsquoworse connectionrsquo areindeed 20 dB higher lower
Document ID D26 Global Wireless Exposure Metric DefinitionFP7 Contract ndeg318273
Version V4 31Dissemination level PU
Figure 14 Ground plan of the considered floor (90 m x 17 m) of the office building that is simulatedFemtocell base station location is indicated with purple hexagon
Scenario 1Macro indoor
Scenario 2Femto indoor
௨ܣ 0003 Wkg 0003 Wkg
௨ܣ 000495 Wkg 000495 Wkg
ത 26610-5 W 28510-7 W
ത(worse connection) 26610-3 W 28510-7 W
RXinc81510-8 Wmsup2 51810-6 Wmsup2
RXinc(worse connection) 81510-10 Wmsup2 51810-6 Wmsup2
Table 8 Reference SAR values and average transmitted power and observed power densityvalues
In the following the results for the different indoor scenarios are discussedFigure 15 (a) compares the EI for scenarios 1 and 2 for the indoor office buildingFrom an exposure-point-of-view the indoor femtocell scenario (scenario 2 EI =158E-8 Wkg) is a factor 28 worse than the indoor macrocell scenario (scenario 1 EI= 564E-10 Wkg) The main EI contribution in scenario 2 is the high DL exposureoriginating from the femtocell (155E-8 Wkg) The scale in Figure 15 (a) has beenadjusted the bar that represents the DL femto indoor contribution is in reality 44times the length of the Y-scaleThere are several reasons why the installation of a femtocell is not beneficial in thiscaseA first reason is that the EI contributions of the macrocell are almost equal for UL andDL which is optimalA second reason is that the femtocell EIRP is chosen quite high (7 dBm) despite thegood macrocell connection (average value of -6925 dBm) still 77 of the DL fieldsare higher in the femtocell caseA third reason is that a femtocell installation has the disadvantage that observedpower densities on a building floor due to a femtocell base station are lesshomogeneously distributed than fields due to a (more distant) macrocell base stationAs people are assumed to ndash on average- reside an equal time at each location on thebuilding floor (except shaded areas and locations closer than 50 cm from the BS)locations close to the femtocell contribute a lot to the EI When people approach afemtocell the absorbed exposure dose increases in a more-than-linear wayMacrocell base stations have the advantage that ULDL fields are morehomogeneously distributed over the building floor It should also be noted that thehigher the UL usage the more the femtocell scenario will benefit compared to themacrocell scenario (lower EI) However in the considered case the UL usage timeswould have to increase by a factor 48 to yield a total EI (macrocell scenario 1) that isequal to the EI of scenario 2 (femtocell scenario EI = 158E-8 Wkg)
Document ID D26 Global Wireless Exposure Metric DefinitionFP7 Contract ndeg318273
Version V4 32Dissemination level PU
We also studied a second case where a less favourable macrocell case isconsidered (lsquoworse connectionrdquo) It is assumed that the connection with the macrocellbase station is now 20 dB worse than in the previous case Figure 15 (b) comparesthe EI for the macrocell and femtocell deployments Due to the worse connection(average received macrocell DL power of -8925 dBm) the macrocell EI is nowcompletely determined by the UL contribution (320E-8 Wkg) and the femtocellscenario (scenario 2 EI = 155E-8 Wkg) has an EI that is 48 of the macrocell EIwhich makes it preferable over the macrocell deployment Moreover the observedpower densities due to the femtocell are higher than the macrocell power densities atall locations (better QoS)It can be concluded that the installation of femtocell is not always recommended forshorter UL usage times andor better macrocell connection qualities it could beadvised to rely on the existing macrocell infrastructure Also when installing afemtocell its EIRP should be adjusted to the size and physical properties of thebuilding and should not be set at a needlessly high value
(a) (b)Figure 15 Comparison of the contributions to the whole-body EI for (a) indoor scenarios 1 and 2 in theconsidered building (b) indoor scenarios 1 and 2 in this building with 20 dB worse connection qualityTotal EI levels for each scenario are indicated with the horizontal line EI values are shown in Wkg
43 Data LTE macro urban scenario
431 Input variables linked to the network
The EI is evaluated from a macro-cellular LTE network in a real geographical area ndashpart of the 7th district of Paris (see Figure 16) The proposed scenario was previouslydefined in frame of the French ANR project ECOSCells [BCL12] and the EuropeanFP7 project FREEDOM (httpwwwict-freedomeu) for the simulation and analysis ofheterogeneous network topologies (hetNet) It is based on a real environment usingHigh Resolution (HR) map data realistic BSUE deployments and deterministicpropagation models
The macro layout is organized as three rings around a central three-sector sitemacro base stations being deployed with an inter-site distance of about 450 m in ahexagonal manner as shown in Figure 16
Document ID D26 Global Wireless Exposure Metric DefinitionFP7 Contract ndeg318273
Version V4 33Dissemination level PU
Figure 16 View of the macro-cell hexagonal deployment in the area
The study area (ie area where network performance is evaluated) is limited to thesurface covered by the three co-located central macro-cells and the first ring (Figure17) Thus the study area is equivalent to 12 macro-cells The base stations outsidethis study area are included in simulations to generate an accurate interferencepattern
Figure 17 Study area composed of 12 macro sites localised in the 7th
district of Paris France
Document ID D26 Global Wireless Exposure Metric DefinitionFP7 Contract ndeg318273
Version V4 34Dissemination level PU
The positions and heights of the base stations have been selected in realisticapproach sites are placed on slightly dominant rooftops and sector antennas aredistributed at the rooftop edges Directive antennas are used (with 3GPP radiationpattern) Each site is composed of three sectors oriented in azimuth directions 0deg120deg and 240deg with down-tilt 6degUsers are assumed to be uniformly distributed in the study area an indoor ratio setsthe percentage of users located inside buildings at the ground floorThe specifications of input parameters are summed up in Table 9
Environment Typical European Dense Urban environment (Paris VII district France)
System
Downlink (DL) and Uplink (UL)
LTE FDD 2 x 10 MHz
Central frequency 2600 MHz
Macro layout
Hexagonal sitedeployment
37 sites corresponding to 83 macro cellsincluding 12 sites in the center of the studyarea Inter-site distance (ISD) of 450 m
Nominal transmitpowerEPRE
40 W 228 dBm
AntennaDirectional with 14 dBi gain 6deg electric down-tilt 2 antennassector Average antennaheight 30 m above ground
Noise figure 25 dB
UL power control (openloop)
Path loss compensation factor 1SINR target 208 dB
UserEquipment
MaxMin transmit power 23 dBm -40 dBm
AntennaOmni-directional with 0 dBi gain 2antennasuser device Antenna height 15 mabove ground
Noise figure 9 dB
User traffic
Average active userdensity
Depends on daynight
DistributionUniform spatial distribution within thesimulation area Single floor (at 15 m height)No user mobility
Table 9 Inputs in SIRADEL simulator
432 Input variables linked to the population
Category of population
The population density of the 7th District of Paris was estimated at 14 36050
inhabitants per kmsup2 in 2009 [Carte09]
We are considering the population above 15 years old
Given the population distribution by age (Figure 18) it was decided to divide the adult
population into 3 categories young people (between 15 and 29 years) adults
Document ID D26 Global Wireless Exposure Metric DefinitionFP7 Contract ndeg318273
Version V4 35Dissemination level PU
(between 30 and 59 years) and seniors (over 60 years) Table 10 shows the
percentages of people in each category
Figure 18 Population distribution by age in Paris 7th district in 2007
Population category Pourcentage(prop)
Adults (30-59 yo) 45
Young people (15-29 yo) 26
Seniors (+60 yo) 29
Table 10 Number of people in each population category
Time periods
A 24-hour day is divided into two periods the day from 8 am to 6 pm (10 hours in
total) and the night from 6 pm to 8 am (14 hours in total)
Environment
Time spent indoor or outdoor on an average day for each category is extracted from
Table 2
Usage
Only data traffic is considered The device is assumed to be a mobile phone whilethe user is in a standing posture Considering the existence of 4 telecom operators inFrance only 25 of the 7th district population is assumed to be using this LTE macronetwork In this example we consider two user profiles moderate user and non-userFor each population category we derived from [Bigot et al 2013] the proportions ofusers and non-users of mobile phones for data traffic (see Table 11)
User profileYoung people (15-29
yo)Adults (30-59 yo) Seniors (over 60 yo)
non-users 33 57 91
Document ID D26 Global Wireless Exposure Metric DefinitionFP7 Contract ndeg318273
Version V4 36Dissemination level PU
users 67 43 9Table 11 Repartition of users and non-users for each population category
For simplicity the parameters for the moderate user profile are applied to all userswe assume a daily data traffic per active user of 66 MB [CISCO13] a DLUL ratio of9010 (this ratio was evaluated from data collected through measurements ofKPIs by sensors inside the French Orange network) and a daynight ratio of4357 From [CISCO13] only 29 of connections in 2013 were on 4GReference SAR values were extracted from Table 4 and Table 5
433 Transmitted power ഥ and received power density ത calculationܖ
Incident ோpower densities and transmittedത powers were calculated by usingthe network planner simulation tool Volcano Suite (Siradel France)Figure 19 andFigure 20 illustrate respectively the average UE Tx power calculated over the 7thParis district during the day and the average incident power density evaluated duringthe day or the night (values during the day or the night time were quasi identical)
Figure 19 Map of the average UL Tx power (dBm) calculated indoor at ground floor and outdoorduring the day (on the left) and map of daily average transmission duration (s) (on the right)
Figure 20 Map of the average DL incident power density (dBμVm) calculated indoor at ground floor and outdoor during the day or the night
Because the average active LTE user density is very low (41 userskm2consequence of the 29 LTE connections assumption) the DL user traffic utilises
Document ID D26 Global Wireless Exposure Metric DefinitionFP7 Contract ndeg318273
Version V4 37Dissemination level PU
less than 1 of available resources which strongly impact the predicted DL incidentpower density We can see in Figure 19 (left figure) that the calculated average Txpower is minimum in outdoor areas in the vicinity of the base stations or in Line ofSight (LOS) while it is at a maximum indoors and outdoors far away from the basestations The right map in Figure 19 gives the average communication durationwhich directly impacts the calculation of the UL exposure contribution The better thelink performance is the higher the throughput and thus the longer thecommunication duration That is why the longest durations are observed indoors andparticularly in the building parts that suffer from the strongest propagation lossesFigure 20 shows that the strongest DL incident power density levels are predicted inLOS areas while much lower levels are observed inside the buildings where mostpopulation is located
434 Exposure index calculation
Aggregating everything we obtain the following value for the EI (based on the Whole-body SAR) of the over 15 years old population of the 7th district of Paris consideringa macrocell LTE network EIWBSAR = 31910 -7 Wkg
44 Using dosimeters for the EI evaluation
This section provides an evaluation of the downlink and uplink exposure indexes fora subject wearing a reference isotropic dosimeter on the head together with fivedosimeters at different locations of the body as well as two mobile terminals Thesubject is moving in a multipath environment including a 3-sector LTE base station
When modelling the radio link between the user devices and the base station oneconsiders the influence of the body (ie body coupling [MaOC12] and bodymovements (using realistic body motion capture tools [MaCo13]) and accounts forthe propagation environment using a geometrically based statistical channel (GBSC)model (ie multipath propagation) Therefore the modelling of the radio channel hasbeen separated into several steps as described in [Mack13] Figure 21
Document ID D26 Global Wireless Exposure Metric DefinitionFP7 Contract ndeg318273
Version V4 38Dissemination level PU
Figure 21 Model for EMF assessment from dosimeter data
The simulated scenario Figure 22 considers a reference isotropic dosimeter on thehead of the user (simulating the real body exposure) together with five wearabledosimeters These dosimeters allow the downlink exposure assessment The user isalso carrying two mobile terminals allowing to assess the uplink exposure
Figure 22 Placement of wearable dosimeters and mobile terminals on the body
For the downlink the received (Rx) power ோ௫ at the mobile terminal (ordosimeter) is calculated from
ோ௫[ౚ ]= ௌ[ౚ ]
minus ௧௧[ౚ]ܮ (6)
where ௌ base station (BS) transmitted (Tx) power ௧௧ܮ total path loss including gains of mobile terminal (or
dosimeter) and BS
The received power density ோ௫ at the mobile terminal (or dosimeter) iscalculated from
ோ௫ ୫ మ൧=
ோ௫[ ]
ܣ మ൧
(7)
where ܣ is the mobile terminal antenna effective area
ܣ ୫ మ൧=ଶ[ߣ ]
ߨ4ோ௫[ౚഠ]ܩതതതതതതതതത (8)
where wavelength ோ௫തതതതതܩ average gain of the receiving antenna (ie dosimeter probe) in
off body direction (eg half-hemisphere of the gain pattern ieߠ isin [minus9090]deg and isin [minus9090]deg)
ோ௫[ౚഠ]ܩതതതതതതതതത=
1
ఏఝ ோ௫[ౚ]ܩ
ߠ) )
ேക
ୀଵ
ேഇ
ୀଵ
(9)
where ఏ and number of elevation (ߠ) and azimuth () directions
The exposure index for the DL ܫܧ can be determined from [LEXNET D24 2013]
Document ID D26 Global Wireless Exposure Metric DefinitionFP7 Contract ndeg318273
Version V4 39Dissemination level PU
[୩]ܫܧ = ௪ܣ
|ଵ ୫ మ[୫ మ୩]
times ோ௫[ ୫ మ]times [ୱ]ݐ (10)
where ௪ܣ
|ଵ ୫ మ normalised whole body averaged SAR coefficient per
1 Wm2 of Rx power density as indicated in [LEXNET D24 2013] ݐ time of the exposure from BS
ோ௫ average Rx power density during period ݐ
For the uplink the required Tx power from the mobile terminal is determined from ௫[୫ ]
= ௌ[୫ ]+ ܫ ௧௧[]
+ ܯ [] + ௧௧[]ܮ (11)
where ௌ noise and interference level at the BS ܫ ௧௧ target SINR at the BS
ܯ fading margin for a dynamic usage ௧௧ܮ total path loss including gain of MT and BS
ௌ is calculated asௌ[୫ ]
= minus174[୫ ] + 10logଵ(ܤ[ୌ]) + ி[]+ []ܫ (12)
where ܤ bandwidth ி noise figure ܫ interference
The EI for the UL ܫܧ can be determined from [LEXNET D24 2013]
[୩]ܫܧ = ௪ܣ
|ଵ [ଵ୩]times ௫[ ]
times [ୱ]ݐ (13)
where ௪ܣ
|ଵ whole body averaged SAR coefficient per 1 W of Tx poweras indicated in [LEXNET D24 2013]
ݐ time of the exposure ( duration of the mobile terminal usage)
௫ average Tx power during period ݐ
A macro cell outdoor street scenario has been considered including a set of 10clusters of 3 scatterers each with a Uniform Distribution in the half space of anellipsoid A 3-sector base station antenna is located in the middle of the street atx=100 m The user is moving on a straight line in the middle of the street (ie y=10m xisin[50 150] m) Figure 23
Document ID D26 Global Wireless Exposure Metric DefinitionFP7 Contract ndeg318273
Version V4 40Dissemination level PU
Figure 23 Scenario
The parameters of the scenario are presented in Table 12 being worthwhile to noticethat the values of ௪ܣ
and ௪ܣ are taken from preliminary SAR simulations The
calculated noise and interference level at the BS is ௌ= -12774 dBm
System
Frequency [MHz] 2600
[HoTo11]ܤ
Resource Block [kHz] 15
Full [MHz] 20
Full LTE-A [MHz] 100
Downlink
EIRP BS Tx power [dBm] 46 [LEXNET D23 2013]
ோ௫ܩ [dBi] 122 [LEXNET D32 2014]
ݓܣ|ܮܦ
1Wm2[m2kg] 300
Uplink
ܫ ௧௧[dB] 208 [HoTo11]
ி [dB] 25 [LEXNET D23 2013]
[dB]ܫ 8 [HoTo11]
ܯ [dB] 30 [Mack13]
ݓܣ|ܮ
1W[1kg] 495
Table 12 Scenario overview
Figure 24 illustrates the considered macro cell base station antenna and thedosimeter realised gain patterns
(a) BS with 3 sectors (b) Dosimeter on the bodyFigure 24 Realised gain pattern
Document ID D26 Global Wireless Exposure Metric DefinitionFP7 Contract ndeg318273
Version V4 41Dissemination level PU
441 EI for downlink
The average Rx power density obtained from the isotropic reference probe and thedosimeter located at WA_L and WA_R is presented in Figure 25 The received powerdensity at WA_L dosimeter is very similar to the one gathered at the isotropic probewhich mainly comes from the similar Line-Of-Sight (LOS) propagation conditions Thepower received in WA_R dosimeter is much lower due to the body shadowing
Figure 25 Rx power density at selected positions
The distribution of the Rx power density is presented in Figure 26 In spite of thebody shadowing the distribution of the Rx power density at the WA_R dosimeter ismuch similar to the ones for the reference and the WA_L dosimeters All of themfollow an exponential decay which should be subject to further investigation
(a) isotropic (b) WA_L (c) WA_R
Figure 26 Rx power density histograms
The received power density and the downlink exposure index calculated based onthe measurement of the dosimeters located in the various locations on the body arepresented in Table 13
ோ௫ [mWm2] ܫܧ [mJkg]
isotropic 35868 2690
WA_F 18357 1377
WA_B 29538 2215
Document ID D26 Global Wireless Exposure Metric DefinitionFP7 Contract ndeg318273
Version V4 42Dissemination level PU
WA_L 28516 2138
WA_R 9060 680
TO_F 18436 1383
Table 13 Downlink Exposure
The WA_L dosimeter and the isotropic probe exposure indexes are very similarbecause of the LOS propagation conditions The same is valid for the WA_Bdosimeter which is also in LOS with the base station For the other dosimeters theexposure index is naturally lower due to the body shadowing In this scenario theuse of a wearable dosimeter in the front or in the right side of the body displays anexposure index reading about 4 times lower than the real user exposure
442 EI for uplink
The average Tx power from the mobile phone hold near HE_L and HE_R ispresented in Figure 27 The uplink power control is clearly noticeable by the highertransmitted power in HE_R as the mobile terminal adjusts the Tx power tocompensate for the higher channel fading
Figure 27 Tx power for straight6min scenario at 2600 MHz for LTE-A
The distribution of the Tx power at HE_L and HE_R is presented in Figure 28 Inspite of the different intensities HE_L and HE_R Tx powers present a similardistribution
Document ID D26 Global Wireless Exposure Metric DefinitionFP7 Contract ndeg318273
Version V4 43Dissemination level PU
(a) HE_L (b) HE_R
Figure 28 Tx power histograms
The average transmitted power and the uplink exposure index from the mobileterminals located near left and right side of the head ( e HE_L and HE_R) arepresented in Table 14
௫ [mW] ܫܧ [mJkg]
RB FULL FULL_A RB FULL FULL_A
HE_L mobile 002 165 827 003 295 1474
HE_R mobile 008 838 4191 014 1493 7468
Table 14 Uplink Exposure
These results show the importance of the propagation conditions in the EMFexposure Due to the non LOS conditions the exposure index in the right side of thehead is 5 times higher than the one on the left side
5 CONCLUSION
In this deliverable a global metric is defined to test and optimize wirelesstelecommunication networks in terms of EMF exposureThe proposed metric called Exposure Index (EI) has the advantage to overpass thelimitations of the actual metrics that in fact are managing separately the exposureinduced by personal devices and the one induced by the network equipment (basestations and access points) But devices base station antennas and access pointsare definitely parts of the same wireless environment and the global wirelessexposure is induced by all of them
The EI is described with an analytical model with input variables describing thecoverage area of interest the accessible networks the population and the habits interms of location and of wireless devices usage The output is the EI covering theday-to-day averaged exposure of population in a given area incurred by an entirewireless network from base stations and access points to individual devices
In this deliverable the analytical model of EI has been detailed and the inputvariables defined Then the use of the EI to minimize the EMF exposure in wirelesscommunication networks is presented in connection with work-package 4 dedicated
Document ID D26 Global Wireless Exposure Metric DefinitionFP7 Contract ndeg318273
Version V4 44Dissemination level PU
to innovative radio components and work-package 5 focused on networks topologiesand technologies
The way to process a complete calculation of EI is illustrated on three deterministicexamples The first example considers comparison of indoor 3G macro and femtoscenarios The second example is taking into account an adult population in a LTEmacro urban environment with their data usage specifications Both examples arebased on a real environment representation and network simulation tools have beenused to simulate the up and down links The third example illustrates how dosimetermeasurements can be used to assess the EI
In our further work the statistical description of input variables will enable topropagate the variability and the uncertainty in the EI model making it more accurateand reliable Results will be made available in the future deliverable D28 DeliverableD33 will detail the used methodology to assess the EI and for the last year of theproject the work of partners involved in WP6 will be enhanced as they will be incharge of the implementation and evaluation of the EI
Document ID D26 Global Wireless Exposure Metric DefinitionFP7 Contract ndeg318273
Version V4 45Dissemination level PU
6 REFERENCES
[ALIAGA06] Aliaga C How is the time of women and men distributed
in Europe Statistics in focus population and social
conditions April 2006
[APVJM13] Aerts S Plets D Verloock L Joseph W and MartensL Assessment and comparison of RF-EMF exposure infemtocell and macrocell scenarios Radiat Protec Dosim2013
[BCL12] Brau M Corre Y Lostanlen Y Assessment of 3D
network coverage performance from dense small-cell LTE
Communications (ICC) 2012 IEEE International
Conference on
[Carte09] httpwwwcartesfrancefr
[CISCO13] Cisco Visual Networking Index Global Mobile Data Traffic
Forecast Update 2012-2017 February 2013
[CHLWW08] ConilE Hadjem A Lacroux F Wong M F and Wiart J
Variability analysis of SAR from 20 MHz to 24 GHz for
different adult and child models using finite-difference
time-domain Phys Med Biol vol 53 pp 1511-1525
2008
[CHRIST10] Christ A Kainz W Hahn E G Honegger K Zefferer
M Neufeld E Rascher W Janka R Bautz W Chen
J Kiefer B Schmitt P Hollenbach H-P Shen J
Oberle M Szczerba D Kam A Guag J W amp Kuster
N The Virtual Family--development of surface-based
anatomical models of two adults and two children for
dosimetric simulations Phys Med Biol vol 55 pp 23-38
2010
[CMKB06] Cooper TG Mann SM Khalid M and Blackwell RP
Public exposure to radio waves near GSM microcell and
picocell base stations Journal of the Society for
Radiological Protection Vol 26 No 2 pp 199-211 June
2006
[GCWW10] Gati A Conil E Wong MF Wiart J Duality between
uplink local and downlink whole body exposures in
operating Networks IEEE Transactions on EMC Vol 52
ndeg4 Nov 2010
Document ID D26 Global Wireless Exposure Metric DefinitionFP7 Contract ndeg318273
Version V4 46Dissemination level PU
[HoTo11] Hola HG And Toskala A LTE for UMTS Evolution to
LTE-Advanced Wiley UK 2011
[INFORMA12] Informa telecom amp Media Small Cell Market Update June
2012
[INSEE11] Insee enquecircte Emploi du temps 2009-2010 Insee
Premiere Ndeg 1377 November 2011
[IST] httpwwwist-winnerorg
[KALLIOLA02] Kalliola K Sulonen K Laitinen H Kiveks O Krogerus J
Vainikainen P Angular power distribution and mean
effective gain of mobile antenna in different propagation
environments IEEE Trans Veh Technol vol 51 pp 823ndash
838 2002
[KIENTEGA11] Thierry Kientega EConil A Gati A Hadjem ERichalot M-F Wong OPicon Joe Wiart Analysis of thedistribution of specific absorption rate induced by fiveplane waves with a fast and new method in VisibleHuman URSI conference 2011
[LAUER13] Lauer O Frei P Gosselin M C Joseph W Roumloumlsli M
and Froumlhlich J Combining near- and far-field exposure for
an organ-specific and whole-body RF-EMF proxy for
epidemiological research a reference case
Bioelectromagnetics vol 34(5) pp 366-74 2013
[LEXNET D21 2013] Vermeeren G Thielens A Aerts S Joseph W
Martens L Oliveira C Mackowiak M Correia LM
Pejanovic-Djurisic M Veljovic Z Nešković A
Koprivica M Gati A Varsier N Hadjem A Wiart J
ConilE ldquoD21 Current metrics for EMF exposure
evaluationrdquo LEXNET project April 2013
[LEXNET D22 2013] Wiedemann P M Freudenstein F ldquoD22 Risk and
exposure perceptionrdquo LEXNET project July 2013
[LEXNET D23 2013] Vermeeren G Plets D Joseph W Martens L Conil E
Varsier N Wiart J Corre Y Oliveira C Sebastiatildeo D
Correia LM Aguumlero R Diez L Rodriacuteguez L Koprivica
M Nešković A Popović M Milinković J Nikšić S ldquoD23
Scenariosrdquo LEXNET project November 2013
[LEXNET D24 2013] Conil E ldquoD24 Global Wireless Exposure Metric
Definitionrdquo LEXNET project October 2013
Document ID D26 Global Wireless Exposure Metric DefinitionFP7 Contract ndeg318273
Version V4 47Dissemination level PU
[LEXNET D32 2014] BoriesS (ed) ldquoD32 Wideband dosimeter design study amp
performances characterizationrdquo LEXNET project July
2014
[LEXNET D41 2013] Bories S Fang Y Brown TBegaud X Pinto Y Ciblat P
Ksairi N De Domenico A Clemente A Fernandez Y
Lalam M Masera E Wilson M Tesanovic M Kocan E
Pejanovic-Djurisic M Veljovic Z Milatović B Popović M
Nešković A Koprivica M Voinescu A Dragomir D
Slusanschi E laquo D41 Promising Low Exposure Index
Solutions for Components and Transmission
Techniques raquo LEXNET project November 2013
[LEXNET IR21 2013] ldquoNumerical toolsrdquo LEXNET project July 2013
[LEXNET IR51 2013] ldquoSmart low-EMF architectures state of the art and way
forwardrdquo LEXNET project May 2013
[LEXNET D25 2014] Wiedemann P M Freudenstein F ldquoD25 Risk and
exposure perceptionrdquo LEXNET project November 2014
[LEXNET D42 2014] Bories S Fang Y Brown TBegaud X Pinto Y Ciblat P
Ksairi N De Domenico A Clemente A Fernandez Y
Lalam M Masera E Wilson M Tesanovic M Kocan E
Pejanovic-Djurisic M Veljovic Z Milatović B Popović M
Nešković A Koprivica M Voinescu A Dragomir D
Slusanschi E laquo D42 Performance Evaluation of Low
Exposure index solutions for components and
Transmission Techniques raquo LEXNET project November
2014
[MaOC12] Mackowiak M Oliveira C and Correia L M RadiationPattern of Wearable Antennas A Statistical Analysis of theInfluence of the Human Body International Journal ofWireless Information Networks Vol 19 No 3 pp 209-218 2012
[MaCo13] Mackowiak M and Correia L M Statistical Model of theInfluence of Body Dynamics on the Radiation Pattern ofWearable Antennas in Off-Body Radio ChannelsWireless Personal Communications 101007s11277-013-1193-x May 2013
[Mack13] Mackowiak M Modelling MIMO Systems in Body AreaNetworks in Outdoors PhD Thesis IST - University ofLisbon Lisbon Portugal 2013
Document ID D26 Global Wireless Exposure Metric DefinitionFP7 Contract ndeg318273
Version V4 48Dissemination level PU
[NAGAOKA08] Nagaoka T and Watanabe S Postured voxel-based
human models for electromagnetic dosimetry Physics in
medicine and biology vol 53 pp 7047-7061 2008
[PLETS12] Plets D Joseph W Vanhecke K Tanghe E and Martens
L 2012 Coverage Prediction and Optimization Algorithms
for Indoor Environments EURASIP 2012123
[PLETS14] Plets D Joseph W Aerts S Vanhecke K and Martens L
accepted 2014 Prediction and comparison of downlink
electric-field and uplink localized SAR values for realistic
indoor wireless planning Radiation Protection Dosimetry
[SaNC10] SaloJ Nur-AlamM and ChangK Practical Introduction
to LTE Radio Planning white paper European
Communications Engineering (ECE) Ltd Espoo Finland
Nov 2010 (wwweceltdcom)
[TAFLOVE00] Taflove A and Hagness S C 2000 Computational
Electrodynamics The Finite-Difference Time-Domain
Method 2nd edn (Boston MA Artech House Publishers)
[TNS10] TNS Sofres survey Observatoire Socieacutetal du teacuteleacutephone
mobile Dec 2010
[VAJM13] Vermeeren G Aerts S Plets D Joseph W Martens
LConil E Varsier N Wiart J Core YOliveira C Sebastiatildeo
DCorreia L Aguumlero R Diez L Rodriacuteguez L Koprivica M
Nešković A Popović M Milinković J Nikšić S D23
Scenarios LEXNET project Novembre 2013
[WIART08] Wiart J Hadjem A Wong M F and Bloch I Analysis of
RF exposure in the head tissues of children and adults
Physics in medicine and biology vol 53 pp 3681-3695
2008
[WINNER D112 2007] Kyoumlsti P et al D112 WINNER II Channel models
WINNER project September 2007
[ZHAO02] Zhao X Kivinen J Vainikainen P Skog K Propagation
characteristics for wideband outdoor mobile
communications at 53 GHz IEEE J Sel Areas Commun
vol 20 pp 507ndash514 2002
Document ID D26 Global Wireless Exposure Metric DefinitionFP7 Contract ndeg318273
Version V4 49Dissemination level PU
APPENDIX 1 NUMERICAL DOSIMETRIC SIMULATIONS
This appendix describes the main assumptions concerning the frequency bands used
in the numerical dosimetric simulations
Table A1 gives the frequency bands used for SAR simulations as well as theservices and DLUL frequencies considered in each of those frequency bands forLEXNET studies Note that at these frequencies (especially at the higher ones) nolarge differences are expected between SAR results [CHLWW08] Accordingly forthe sake of simplicity it is assumed that
the same frequency band is assumed for both up- and down-link each frequency band may cover more than one system (eg simulation at
1940 MHz covers both GSM1800 and UMTS2000)
Table A1 Technical specifications for LEXNET selected services
SAR
simulation
frequency
band [MHz]
RAT
RAT frequency band [MHz]
DL UL
400 LTE 400 380 - 470
900
LTE 800 875- 885 830 - 840
GSM 900 935 - 960 890 - 915
UMTS 900 925 ndash 960 880 ndash 915
1940
GSM 1800 1805 - 1880 1710 - 1785
UMTS 2000 2110 - 2170 1900 - 1980
2600WiFi bgn 2400 - 2484
LTE 2600 2620 - 2690 2500 - 2570
For the WiFi an between 5470 and 5725 MHz frequency bands no SAR simulation
was performed yet
Document ID D26 Global Wireless Exposure Metric DefinitionFP7 Contract ndeg318273
Version V4 50Dissemination level PU
APPENDIX 2 INTERNAL REVIEW
Reviewer 1 Yoann Corre Reviewer 2 Mick Wilson
Answer Comments Type Answer Comments Type
1 Is the deliverable in accordance with
(i) the Descriptionof Work
Yes
No
M
m
a
Yes
No
M
m
a
(ii) the internationalState of theArt
Yes
No
M
m
a
Yes
No
M
m
a
2 Is the quality of the deliverable in a status
(i) that allows tosend it to EC
Yes
No
M
m
a
Yes
No
M
m
a
(ii) that needsimprovement ofthe writing bythe editor of thedeliverable
Yes
No
See proposedenhancements
In particular thepresentation of the basic EIconcept could be improvedin the Abstract Introductionsection 21 and Conclusion
M
m
a
Yes
No
See comments onSection 3
M
m
a
(iii) that needsfurther work bythe partnersresponsible forthe deliverable
Yes
No
Mostly minor changes Seethe proposedenhancements
Section 44 is a copy-pastof a whole section in D33Either D26 or D33 must bechanged to avoidredundancy (replacing thewhole description by asummary adapted to theintegrated deliverable)
It must be made more clearwhere the reader will findthe missing SAR data andthe announced uncertaintystudy results
M
m
a
Yes
No
M
m
a
Type of comments M = Major comment m = minor comment a = advice
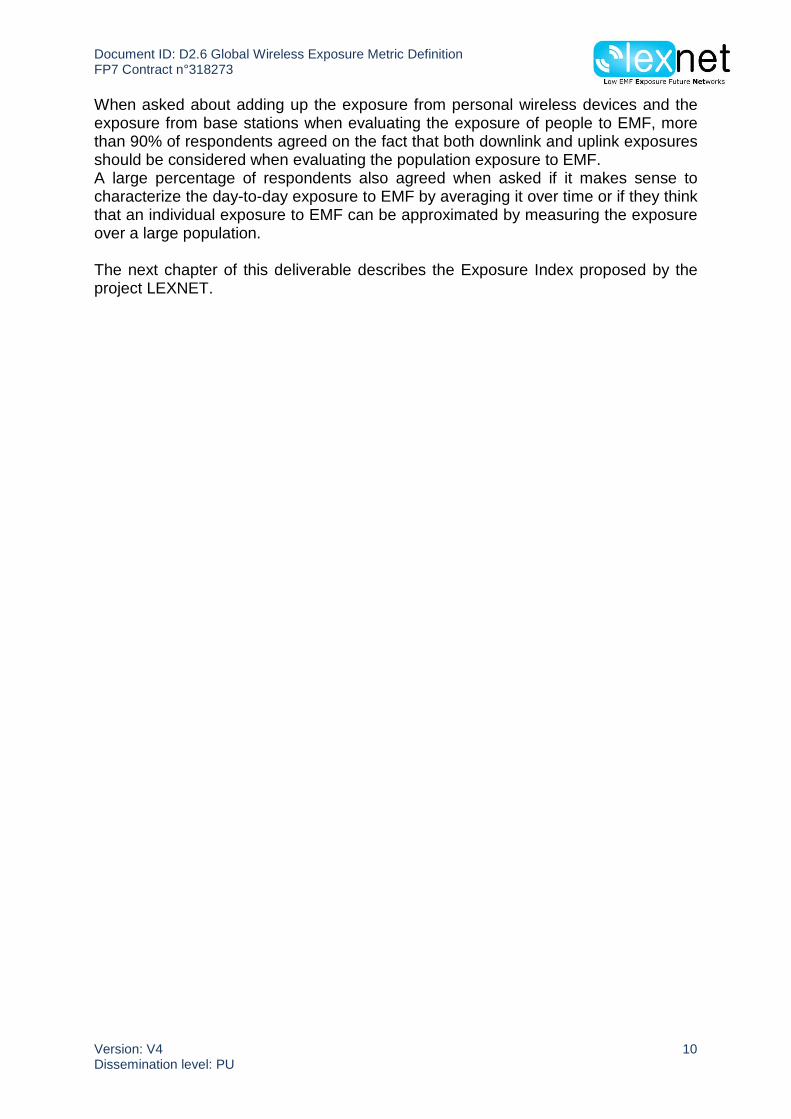
Document ID D26 Global Wireless Exposure Metric DefinitionFP7 Contract ndeg318273
Version V4 11Dissemination level PU
2 THE EXPOSURE INDEX
21 Key concept
The Exposure Index (EI) takes into account the global EMF exposure of apopulation to a given wireless telecommunication network (or a set of networks)The EI does not take into account the exposure induced by other RF sourcessuch as Frequency Modulation (FM) radio or digital terrestrial televisiontransmittersIt covers the exposure of a population during a given time frame in a given areaincurred by a wireless telecommunication network as a whole aggregating thedownlink exposure induced all day long by base stations and access points andthe uplink exposure incurred by individual wireless communication devices Theuplink exposure can be subdivided in exposure due to the uplink of the userrsquos owndevice and the uplink of devices operated by other users nearbyIn order to assess the realistic exposure of a population many parametersinfluencing the exposure need to be taken into account in the Exposure Indexage (adult and child exposure are different [CHLWW08] [WIART08]) posture[NAGAOKA08] usage technology environment etchellip
In a nutshell the LEXNET Exposure Index is a function transforming a highlycomplex set of data into a single parameter which has two key benefits it isunderstandable acceptable and usable for all the stakeholders from generalpublic to regulatory bodies and it is linked in a tangible way to the networkoperating parameters
The EI is built from the aggregation of individual exposure contributions generatedby a specific exposure source in specific exposure situations For instance anaveraged individual exposure generated by WiFi 24 GHz can be calculated atday time for an adult heavy-user located indoors sitting and with a tablet Thesame kind of individual exposure is estimated for other time periods RATspopulations environments usages and postures to get complete elements thatcompose the EI The individual exposure contributions are weighted according totheir representativeness before aggregationThe individual exposure is the sum of a down-link (DL) and up-link (UL)components as explained with more details in section 221
The EI is computed in a given area from the aggregation of individual exposurecontributions in a chain of exposure (see Figure 4) The nodes in this chain arerelated to different exposure sources or exposure situationsbull the time periods as the configuration of the network and type of usage depend
on the time of day (low-load night-time vs heavily loaded peak-hour)bull the population as different population categories will have different life
segmentations and different usages of wireless devicesbull the user profilebull the different locations as the exposure configurations will be different in
different environments
Document ID D26 Global Wireless Exposure Metric DefinitionFP7 Contract ndeg318273
Version V4 12Dissemination level PU
bull the radio access technologies RATs (GSM UMTS LTE WiFi etc)frequency bands and deployment layers (macro micro and femto cells) thatusers connect to
bull the posture as different body postures will lead to different absorption rates inthe human body
bull the device usage (making a phone call does not lead to the same exposure asdownloading data)
Figure 4 the LEXNET chain of exposure
Different exposure scenarios [LEXNET D23 2013] are considered and aggregatedby putting weights on each configuration thereby determining the EI A partial EI canbe for example computed for a scenario that considers only a subset of RATspopulation environment etc Then several partial EI can be aggregated with aweight related to their representativenessEI takes into account all these parameters coming both from the telecom world todescribe the accessible network environment and from data on how people segmenttheir life to describe how people are using this network
22 Mathematical formalization
221 Exposure Index Equation
The Exposure Index is calculated for a finite geographical area which can be ofurban suburban or rural type for instanceThe general formulation of the Exposure Index contains a set of technicalparameters as described below The number of values classes or settings ofeach parameter depends on the level of detail of the available data and on thelevel of achievable complexity in terms of calculation For a given geographicalarea the EI takes the following into account (see also Table 1)
the time period (t) eg day and night
Document ID D26 Global Wireless Exposure Metric DefinitionFP7 Contract ndeg318273
Version V4 13Dissemination level PU
the population (p) segmented into different categories eg children (under15 yo) young people (15-29 yo) adults (30-59 yo) and seniors (60 yoand over)
the user load profiles (l) eg heavy medium light or non-users the environment (e) eg indoor (office home) outdoor and in commuting
(bus car subway etchellip) the different available Radio Access Technologies (RATs) (r) eg 2G (900
MHz and 1800 MHz) 3G 4G WiFi the number of RATs depends on thescenario
the different cell types (c) eg macro micro pico and femto cells theaccessibility to the different cell types depends on the scenario
the posture (pos) eg sitting standing the usage (u) is described by the device (eg mobile PC laptop) and the
usage (eg voice call data)
Time PopulationUser
ProfileEnvironment RAT Cell Type Posture Usage
Day Children Heavy Indoor 2G Macro Standing Voice mobile
Night Youngpeople
Medium Outdoor 3G Micro Sitting Data mobile
Adults Light Commuting 4G Pico Data Tablet
Seniors Nonuser
WiFi Femto Data Laptopon the laps
Data Laptopon the desk
Table 1 input variables in the modelling of the EI
The individual exposure contributions rely on the SAR expressed in Wkg The SARwill depend on the device the frequency band the morphology and the posture ofthe user as well as on the position and distance of the source with respect to theuser As part of LEXNET a set of numerical dosimetric simulations are performed inorder to fill out a comprehensive matrix of raw normalized SAR values These SARvalues can be whole-body or localized SAR values Whole-body SAR values areevaluated by averaging SAR over the whole-body whereas localized SAR values arevalues focusing on a body volume specific organ or tissue Different EI can beevaluated depending on the value of interest (whole-body or localized value)Network simulation tools will provide transmitted and received power average valuesto apply to the raw SAR matrixInformation and Communication Technologies (ICT) usage data obtained throughsensors inside the network and segmentation life data will finally provide the levels toapply for the evaluation of the EI
Document ID D26 Global Wireless Exposure Metric DefinitionFP7 Contract ndeg318273
Version V4 14Dissemination level PU
SARܫܧ =1
T
tperlcpos ൫ ത
൯
ே
௨
ேೞ
௦
ேಽ
ே
ேೃ
ேಶ
ேು
ே
௧
+ RXinc + ௦ௗ௩௦ோ௦ௗ௩௦
൨
(1)
where EISAR is the Exposure Index value the average exposure of the population of
the considered geographical area over the considered time frame T SARrefers to whole-body SAR organ-specific SAR or localized SAR
N is the number of considered periods within the considered time frame (egsingle day)
N is the number of considered Population categories N is the number of considered Environments N is the number of considered Radio Access Technologies Nେ is the number of considered Cell types N is the number of considered user Load profiles N୮୭ୱ is the number of considered Postures
N is the number of considered Usages with devices Pഥଡ଼ is the mean TX power transmitted by the usersrsquo devices during the period
t in usage mode u connected to RAT r in environment e For example whenEI is computed from simulation tools the TX power can be predicted over amap that covers the whole considered geographical area and the averagevalue is extracted for the EI evaluation See details in section 223
Sത ଡ଼୧୬ୡis the mean incident power density on the human body during the periodt induced by RAT r in environment e A distribution of the incident powerdensity for the whole considered geographical area is considered and theaverage value over this area is taken into account for the EI evaluation
ோ௦ௗ௩௦ is the incident power density on the human body during the
period t induced by a wireless device connected to RAT r of a user in theproximity in environment e This term is important when the exposed personis the user itself it can also be significant for persons in the proximity of usersof a wireless device for instance in a crowded meeting room in publictransportation etc In the applications discussed in this paper this term is
neglected We also remark that ோ௦ௗ௩௦ depends on the orientation of
the user of the wireless device with respect to the body of the people in itsproximity See details in section 223
d (ௐ ௦
) ௦ௗ௩௦ (
ௐ ௦
ௐ
మ) and dୈ (ௐ ௦
ௐ
మ ) are the normalised
raw dose values for UL the DL from the user in the proximity and DL frombase stations and access points respectively all multiplied by the time spentin the configuration See details in section 222
Document ID D26 Global Wireless Exposure Metric DefinitionFP7 Contract ndeg318273
Version V4 15Dissemination level PU
f୲୮ ୪ୡ୮୭ୱ is the fraction of the total population that corresponds to population
category p user load profile l in posture pos connected to RAT r for a celltype c in environment e during the time period t
In the following we explain the different terms used in the EI formula in more detail
222 Coefficients and
The coefficient is associated to the exposure induced by the uplink andexpressed as an absorbed dose normalised to a transmitted power of 1 W
[ୱ୩
]
=௧௨௦[ୱ]ܦ
௨௦[ܣ ୩]
[ ]
Ws
kgW൨ (2)
where ௧௨௦ܦ
is the time duration of usage ݑ and a user profile load when
connected to the RAT ݎ operating in cell type in the environment for thepopulation category in the posture pos during the time period of the day ݐ
ௌோೠೞ
ಽ
can be the whole body or an organ-specific or tissue-specific
valueܣ for the usage ݑ and the posture pos in the frequency band of theRAT ݎ and the population category calculated for an incident emitted power
of
and normalized to this power
The coefficient is associated to the exposure induced by the downlink and alsoexpressed as an absorbed dose normalised to an incident power density of 1 Wm2
[ୱ୩
]
=௧௦[ୱ]ܦ
௦[ܣ ୩]
RX[W]inc
ݏ
ଶ ൨ (3)
where ௧௦ܦ
is the time duration of posture ݏ when connected to the RAT ݎ
operating in cell type in the environment for the population during thetime period of the day ݐ
ௌோೞ
ವಽ
ௌೃ can be the whole body or an organ-specific or tissue-specific
valueܣ induced by the base station or access points of the RAT ݎ in thepopulation for the posture ݏ normalized to the received power density
ோ
223 Transmitted power ഥ and received power density ത ܖ
ത is the average power transmitted by the device in busy mode (in active
communication) It should be noted that even in idle mode (not for activecommunication) the devices transmit from time to time some power (to stay
Document ID D26 Global Wireless Exposure Metric DefinitionFP7 Contract ndeg318273
Version V4 16Dissemination level PU
synchronized with the network for example) but the exposure induced by the devicein idle mode is negligible as it is based on rare eventsSത୧୬ୡ is the average power density incident on the human body from the base stationsor access points of the RAT The incident power density is assessed not only forusers of mobile devices but also for non-users It is assumed that the usage patternof the user considered in the EI formula does not influence the average incidentpower density From a theoretical point of view Sത୧୬ୡ is the average incident powerdensity integrated over all the frequency bands of the RAT and cell type consideredFrom a practical point of view Sത୧୬ୡ can be assessed directly from spectrum analyzer(SA) measurements dosimeters simulations and indirectly from the received poweron a user device or in a drive test measurementത and Sത୧୬ୡ average out the instantaneous variations of the transmitted power and
incident power density that arise during a communication These variations occurwhen the user is static or moving over a very small distance and are caused bydifferent phenomenas (power regulation small-scale fading resource allocation usertraffic variations etc) Values that will be used in the EI evaluation are averagedvalues over the whole considered geographical area
For both the evaluation of the DL incident power density and UL transmitted powerthe ressource allocation or duty cycle of the system has to be taken into account TheEI computation does not rely on maximum allowed power values (as in existing EMFexposure procedures) but on the incident and transmitted powers that respectivelydepend on the DL network and UL user resource load This definition leads to anestimate of the UL transmitted power that necessarily depend on the type of usertraffic (eg voice web browsing file upload etc) the higher is the instantaneous ULthroughput during the communication the higher is generally the UL transmittedpower
224 Index computation data sources
The EI evaluation relies on the collection of a wide range of data from simulationtools literature models and measurement equipments that will be demonstrated inthe LEXNET technical work-packages All the input data that were collected and areused in the framework of the project will be stored in an internal document
For life segmentation data in particular up-to-date life segmentation surveyscollected in the different participated countries were used to extract information onhow different categories of population segment their daily lifes (see Table 2)[INSEE11] [ALIAGA06]
Populationcategory
Day (8 AM-6 PM) Night (6 PM- 8AM)
Indoor(office-school-home)
Outdoor
Transportation (bus car
subwayetchellip)
Indoor(home)
Outdoor
Transportation (bus car
subwayetchellip)
Adults8h15
(825)1h10
(115)35 min
(6)13h05 min
(935)20 min(25)
35 min(4)
Document ID D26 Global Wireless Exposure Metric DefinitionFP7 Contract ndeg318273
Version V4 17Dissemination level PU
Youngpeople
8h20(83)
1h10(115)
30 min(55)
13h10 min(94)
20 min(25)
30 min(35)
Children8h15
(825)1h30 (15
)
15 min(25)
13h45 min(985)
0 min
(0 )
15 min(15)
Seniors7h35(70)
2h10(275)
15 min(25)
13h05 min(935)
40 min(5)
15 min(15)
Table 2 Life segmentation inputs for evaluation of the Exposure Index
ICT Usage data (usage of mobile phones for voice call or data usage of tabletsPChellip) are obtained through measurements of Key Performance Indicators (KPIs) bysensors inside the network KPIs of interest for evaluating the EI are for each userthe uplink and downlink data traffic volumes the number of voice calls the durationof each voice call etchellip The network operators involved in the LEXNET project ieOrange (France) and Telekom Serbia (Serbia) as well as the operators fromMontenegro being partners of University of Montenegro provided such data
3G denseurban
Voice Data (82 DL 18 UL)
tcom (s) volULdata [kB] volDLdata [kB]
Heavy user
Day 841 4948 25124
Night 689 5879 31922
Medium user
Day 147 464 2390
Night 86 387 2001
Light user
Day 26 35 158
Night 16 28 124
Table 3 shows usage data that could be derived from KPIs obtained throughmeasurements in a 3G network
3G denseurban
Voice Data (82 DL 18 UL)
tcom (s) volULdata [kB] volDLdata [kB]
Heavy user
Day 841 4948 25124
Night 689 5879 31922
Medium user
Day 147 464 2390
Night 86 387 2001
Light user
Day 26 35 158
Document ID D26 Global Wireless Exposure Metric DefinitionFP7 Contract ndeg318273
Version V4 18Dissemination level PU
Night 16 28 124Table 3 Average communication durations and data traffic volumes per user profile for a 3G
dense urban network
Reference SAR data were computed using 3D electromagnetic simulation platformsbased on the Finite Difference Time Domain (FDTD) method [TAFLOVE00] SARvalues were calculated for far-field and near-field exposure for two anatomical humanbody models of the Virtual Family [CHRIST10] Duke a 34-year-old male and Earthaan 8-year-old girl Two postures (standing and sitting) and three usages (mobilephone close to the head mobile phone or tablet for data and laptop usage) wereselected More details on numerical simulations can be found in [LEXNET IR212013]Table 4 shows the matrix of raw whole body averaged ௨௦ܣ
values induced in
an adult for a mobile phone usage the same table exists for other usages and forchild exposure
p=adult u=MOBILES
r=Frequency Band
Usage u400MHz
band (LTE)900MHz band(GSM UMTS
LTE)
1800-1940MHzband
(GSM 3G LTE)
24-26GHz(WiFi LTE)
Sitting Data 00078 00056 00016 73E-04Voice X 0012 00052 00047
Standing Data 0003 00049 319E-04 21E-05Voice X 0012 00052 00053
Table 4 Values of normalized whole-body ܛܗܘܝܚܘۯۺ induced in an adult by near sources
(mobiles laptops tablets) in different postures (all the values are given in Wkg and were
normalized to ] ]
= )
Table 5 shows the matrix of raw whole body averaged ௦ܣ values induced in an
adult by far field sources the same table exists for child exposure
p=adult r=Base station antennas (plane waves)
u=usage 400MHz band(LTE)
900MHz band(GSM UMTS
LTE)
1800-1940MHzband
(GSM UMTSLTE)
26GHz band(LTE)
Sitting 00050 00056 00043 00039Standing 00064 00052 00046 00042
Table 5 Values of normalized whole body ܛܗܘܚܘۯۺ۲ induced in adult by far and intermediate
sources (base stations and access points) (all the values are given in Wkg and were
normalized to RX[W]inc
= 1 Wm-2
)
It is worth pointing out that the aforementioned exposure index EI is defined on thebasis of the whole body averaged SAR But a local EI could be also derived fromlocal or tissue-specific SAR values
Document ID D26 Global Wireless Exposure Metric DefinitionFP7 Contract ndeg318273
Version V4 19Dissemination level PU
Last main data required to evaluate the EI are the average DL power density and ULtransmitted power They can be predicted from wireless network planning tools network monitoring tools or dosimeter The predictions or measurements collect awide range data at different locations within the study area for different periods oftime and possibly for different usages in order to derive relevant average valuesTwo types of dosimeters are designed in LEXNET wearable and fixed dosimeterslsquoIn sitursquo measurements were executed close to the end-user body thanks to thewearable version of the dosimeter Fixed dosimeters are being deployed in a densesensors network of a lsquosmartrsquo city More information on the LEXNET measurementtools is available in [LEXNET D61] and on the related assessment methodologies in[LEXNET D33]
23 Variability and uncertainty
The exposure index is the output of an analytical model expressed by the equation(1) with a number of uncertain input variables To propagate the uncertaintyassociated to the input variables in the model the first step consists in characterizingthe distribution of input variables Each uncertain variable input will be described by astatistical distributionThe uncertainties of the life segmentation data will be analyzed and modelled usingcomputable functions such as Gamma Gaussian or uniform distributionsUncertainties on the time use structure on an average day the usage segmentationand the average durations of usage will be characterizedAverage DL power density and UL transmitted power are estimated using specificconfigurations environments and usages The downlink power absorbed by the userand the uplink power emitted by the device (and so partially absorbed by the user)depend on these configurations environments and usages Their statisticaldistributions have to be characterized in order to be incorporated in the total EIstatistical uncertaintyA sensitivity analysis is ongoing in order to determine the most important parametersin the EI equation and how we could simplify the EI formula We are using Polynomialchaos and copulas for modelling of dependant parameters All the results onvariability and uncertainties will be available at the end of the LEXNET project indeliverable D28
The uplink exposure characterization requires a precise modeling of the poweremitted by the device Usually this exposure will depend on two parameters theposition of the personal device relative to the user body and the variation in spatialdistribution of the antenna gain due to the induced coupling effects The impact of thepositioning of the wireless device has been investigated by varying the position ofpersonal device with respect to the body Results have shown that the whole-bodySAR is not very sensitive to the device positionTo investigate the impact of the antenna gain on the variability of the emitted powerwe have used a statistical model of propagation channel [IST]Two propagation scenarios have been tested line of sight (LOS) and non-line ofsight (NLOS) For both scenarios we considered a lognormal distribution for theemitted power with a coefficient of variation up to 120 in the case of LOS and up to57 in the case of NLOS when studying the case of mobile phone emitting at 900MHz frequency This lognormal distribution characterizes the variability of the power
Document ID D26 Global Wireless Exposure Metric DefinitionFP7 Contract ndeg318273
Version V4 20Dissemination level PU
emitted versus the antenna gain Firstly we are assuming that the communication ismade via a single path namely LOS Assuming that the user can change randomlyits orientation with respect to the receiver antenna (eg base station) the antennagain in the LOS direction will also change depending on the user orientation Tomaintain a same control power (assumed fixed by the base station to ensure asuccessful decoding) the product of the emitted power to the antenna gain in LOSdirection should be a constant namely 1 mW in our analysis In the same spirit wehave analyzed the NLOS scenario by adding secondary paths The characterizationof the power emitted allows estimating the related exposure using the proportionalrelationship Figure 5 presents the cumulative distribution function of the poweremitted by the mobile phone when the average power required by the base stationoutside the small sphere surrounding the transmitter system (user + mobile phone) iskept to 1 mW
Figure 5 Cumulative distribution function (CDF) of the power emitted by the mobile phone (at 900MHz) obtained with both propagation scenarios (LOS and NLOS)
We could notice that the power emitted is very sensitive to the spatial distribution ofthe antenna gain especially in the case of LOS
The downlink exposure is very sensitive to the propagation environment[KALLIOLA02] [KIENTEGA11] Many physical obstacles (such as tunnels andbuildings) between the transmitter and receiver can affect the characteristics of theambient electric field This latter depends on many parameters such as the number ofwave components (due to the reflections and diffractions undergone by the originalwave radio) the fluctuations of the wave amplitude its phases and arrival angles Inthe literature several studies focused on the modeling of the electromagneticenvironment in realistic conditions by giving the statistics distributions of all of theseparameters [KALLIOLA02] [ZHAO02] [WINNER D112 2007] Based on the modelsproposed by these studies we simulated a downlink exposure induced by a realisticpropagation environment Figure 6 shows the variations of the whole body SARinduced by a single plane wave at 900 MHz
Document ID D26 Global Wireless Exposure Metric DefinitionFP7 Contract ndeg318273
Version V4 21Dissemination level PU
Figure 6 Variation of the exposure induced by a single plane wave (LOS) at 900 MHz for differentpolarization (horizontalH verticalV)
Other sources of uncertainties exist as the information on the network wirelessinfrastructure (eg the base station antenna location and orientation) the userequipment performance the Prediction errors (propagation UL power control modeletchellip) some being discussed in [D33 section 231] or measurement discretization(eg with a limited number of fixed dosimeters [D33 section 26])
3 HOW TO USE THE INDEX OF EXPOSURE
The synthetic index which is presented above aims at gathering all contributions tothe population EMF exposure induced by wireless communication networks By itselfbuilding such an index is already a challenging goal but LEXNET goes beyond thedefinition of the EI since it seeks reducing the exposure by exploring innovativetechniques at the lower (mainly PHY level) or upper layers (network level andresource management)
However a general formulation of the EI is given in this document the EI needs to beslightly adapted to the particular characteristics of each technique evaluationscenario The basic idea is that each of the proposed techniques would probablyfocus on a particular parameter and most likely on a single scenario Proposedtechniques could therefore be evaluated by using a partial EI Hence their benefitswould be specific to the characteristics of the selected use case and their impact overthe overall EI would need to be adjusted accordingly A reference scenario detailedbelow has been defined in order for all the proposed reducing solutions to be testedon one unique global scenario
31 Reference scenario
One reference global scenario will be used as a starting point scenario by LEXNETtechnical work-packages (WP 4 5 and 6) to evaluate the EI ldquobeforerdquo implementationof LEXNET exposure-minimization techniques
Document ID D26 Global Wireless Exposure Metric DefinitionFP7 Contract ndeg318273
Version V4 22Dissemination level PU
Parameter Value
Time periods Day Night
Population Adult children
Load profiles Heavy moderate light and non user
Environments Outdoor indoor commuting
RATsCellTypes
Type 2G 3G 4G WiFi
Cell size Variable (mainly depends on theenvironment)
Cell type Macro
User
Usage Voice data
Equipment Smartphone tablet Laptop (dongle)
Posture Standing sitting
The EI will be evaluated for this specific scenario using life segmentation usage andSAR data introduced in the previous chapterThen each partner will be free to test their minimizing solutions on this scenario andto calculate an EI ldquoafterrdquo LEXNETScenarios for each RAT can be simulated separately and percentages of mobiletraffic per RAT can be afterwards used as input for the EI (see Figure 7) It can beenvisaged that modifying these percentages could be one network managementsolution for reducing the EI assuming in a first approximation that the traffic per RAThas no strong influence on the RAT exposure metrics which is not completely right
Figure 7 Connections by RAT [CISCO13]
Document ID D26 Global Wireless Exposure Metric DefinitionFP7 Contract ndeg318273
Version V4 23Dissemination level PU
32 Reducing the EMF exposure using the EI
321 Lower layer solutions a common methodology to use the EI
The EI is a relevant global metric for evaluation of radio technologies performances interm of exposure reduction However WP4 has identified some difficulties to directlyaddress the global calculation To reach this global evaluation target WP4 hasadopted a specific and indirect methodology described in [LEXNET D42 2014]deliverable and synthesised in the following Despite a large diversity of technicaldomains whatever the scenario or the Radio Access Technologies (RAT) a singlestrategy to organize and align the different WP4 exposure evaluations is proposed Afive steps methodology has been established in order to evaluate and harmonize theoverall exposure improvement for each technology These steps also attempt toprovide the basis for future global exposure reduction evaluation in order todetermine the most promising WP4 techniques based on fair and relevantcomparisons
The first step is to identify how the individual WP4 techniques contribute towards theoverall LEXNET use case scenarios from WP2 Specifically for WP4 evaluations foursub-scenarios have been introduced (Macro-Cell Small-Cell Rural and WSN ampWiFi) (Step-1a) This sub-scenario categorization highlights which solutions arecomplementary and which will require further analysis to determine potential conflictsIn order to harmonize the evaluations from the studies of different solutions it iscrucial to describe properly and extensively each assumption and the inputparameters values related to the context study (Step-1b)
A limited numbers of Key Performances Indicators (KPI) for the exposure and for theQoS are used in the evaluation of each WP4 technique The step-2 has to clearlyidentify the KPIs being addressed by individual technique exploration It is taken asmore convenient to work with one of the following three simpler metrics or KPIsderived from the EI formula and addressing UL exposure
The first metric is the Specific Absorption Rate (SAR l mTx ) which describes the
amount of EM energy absorbed into the userrsquos body via the spatial distributionof the EM field from the source Thus SAR is particularly relevant for antennasolutions
The second metric is the mean duration of exposure (UL
kjit ) which indicatesthe amount of time the user is exposed It impacts the EI which is defined as adose For example the duration is impacted by the amount of transmitted dataReduced retransmission improved interference management and signalingreduction strategies are all ways of decreasing this metric The duration usedto calculate the mean is selected regarding the time constant of the studiedtechnique
The third metric is the mean transmitted power ( TxP ) during the considered
mean exposure duration As an example a 1 dB improvement on the receivingsensitivity at the Base Station (BS) could be converted in a 1 dB reduction ofthe transmit power at the User Equipment (UE) Again the duration used tocalculate the mean is selected regarding the time constant of the studiedtechnique
Document ID D26 Global Wireless Exposure Metric DefinitionFP7 Contract ndeg318273
Version V4 24Dissemination level PU
Notice that an equivalent set of three metrics adresses the DL
The step-3 concerns the evaluation itself of a partial EI ratio in comparison with abaseline scenario that is to say without implementing the studied solution Theexposure reduction is evaluated through the calculation of an EI ratio by comparingthe lsquoafter LEXNETrsquo versus the lsquobefore LEXNETrsquo (ie SotA or standard) baselineconfigurations (Eq 4) The main advantage of the proposed approach is that in mostof the presented solutions the three KPIs are independent from each other Byconsidering a given sub-scenario and depending whether the UL or the DL is studiedthis means that if a solution succeeds in decreasing the selected single KPI the twoothers will stay constant when the solution is implemented or not Thus in thatspecific sub-scenario the EI ratio is equal to the selected KPI ratio (Eq 5) Thisexposure metric is easily matched with a typical RF front-end or PHY layer evaluationstudies
(4)
This formula is simplified when a specific sub-scenario is considered
(5)
Where
partialEI is the Exposure Index for a specific sub-scenario
partialKPI is the identified metric among the three detailed in step 2
the subscript lsquow LEXrsquo correspond to the Lexnet solution implementationthe subscript lsquowo LEXrsquo correspond to the SotA or baseline (without the solutionimplementation)
Meanwhile the selected QoS metric is also evaluated with and without LEXNETsolution
The step-4 aims to ensure that capacity or QoS improvements are converted intoexposure reduction It is worth reminding that the objective of LEXNET studies is toreduce exposure without impacting QoS
At last the step-5 estimates the absolute global EI reduction from the previous stepsrsquopartial EI results throught the 24 hours LEXNET reference scenario The so-calleddilution factor [LEXNET D41 2013] is taken into account during this step-5 Theusage statistics from WP2 are used to weight the calculated partial EI reduction inorder to assess the global EI reduction for a given solution
To conclude a scheme summarizes the WP4 common EI evaluation methodology inFigure 8 This process is sufficiently generic to be applied by any of the WP4proposed solutions and examples of its step by step application can be found in[LEXNET D42 2014]
100LEXwoEI
LEXwoEI-LEXwEI()Ratio
partial
partialpartial
EI
100LEXwoKPI
LEXwoKPI-LEXwKPI()Ratio
partial
partialpartial
EI
Document ID D26 Global Wireless Exposure Metric DefinitionFP7 Contract ndeg318273
Version V4 25Dissemination level PU
Figure 8 Common EI evaluation methodology for WP4 techniques
322 Upper layer and resource management techniques
By introducing and promoting the EI as a new planning metric LEXNET intendsamong other objectives to help reduce local town planning objections to applicationsfor installing new base stations Work carried out by LEXNET WP5 so far hasdemonstrated that real-time EMF-aware network management strategies depend oncurrent traffic load radio conditions mobility application used and the duration ofuse available networks and UE capabilities Since EI calculations take into accountlong-term network statistics distributions of user profiles and habits (services usedetc) times of day period of year etc EI itself may therefore be better suited for initialnetwork design and AP placement while other metrics may be better suited for real-
Document ID D26 Global Wireless Exposure Metric DefinitionFP7 Contract ndeg318273
Version V4 26Dissemination level PU
time EMF management Clearly a link between these proxy-metrics and long-term EIvalues is needed The underlying assumption is that if we try to reduce the level ofEMF by applying correct general policies and additionally control it on a smaller time-scale (eg seconds or minutes) with fast-loop control then the overall exposure andthe EI (defined on daily level) will decreaseFast-loop (event-based) EMF control would be a response to a temporary change ofconditions This kind of control requires triggers ie thresholds that can be assessedon near-real-time scale ndash this time scale may not be as granular as for power controlFor fast-loop control offload techniques may be used as for general strategy butalso other strategies such as changing codecs delaying transmission etc Fast-loopcontrol without using triggers would be periodic optimization on a smaller time-scaleProxy metrics to be used for fast-loop control involve data that may be collected fromthe network and include
bull Measurements (UL Tx power RSSI RSCPhellip)
bull User context velocity services used profile
bull Statistics cell statistics (traffic load) etc
Some preliminary results using various proxy metrics which illustrate the pointsabove are shown hereFigure 9 shows live network measurements illustrating that available cellulartechnologies and current traffic conditions are two of the main points to be taken intoaccount when designing low-EMF solutions The metric used here is the UL Txpower The same metric is used in Figure 10 and Figure 11 which show that the typeof service could increase the exposure (based on UL Tx power) meaning thatdifferent strategies should be used to identify the best connectivity according to theservice flow requested The actual UL Tx power values can then be used in EIcalculations
Figure 9 Comparison of different 2G3G cells in high load hours by UE Tx power
Document ID D26 Global Wireless Exposure Metric DefinitionFP7 Contract ndeg318273
Version V4 27Dissemination level PU
Figure 10 Comparison of UL FTP and voice services over 2G3G cells in high load hours by UE Txpower
Figure 11 Comparison of voice service over 3G and voice service using Skype over 3G network
Another common proxy with direct link to EI is the DL power density Figure 12 showshow DL power density and UL transmit power vary for different ISD values in an LTEnetwork Based on these simulations it can be seen that small-cell densification inurban areas allows for significant exposure reduction which now needs to betranslated into the EI using various assumptions on user distributions and type ofusage
Document ID D26 Global Wireless Exposure Metric DefinitionFP7 Contract ndeg318273
Version V4 28Dissemination level PU
Figure 12 DL power density and UL transmit power for different ISD values
Whole-body SAR is another proxy metric whose statistical processing can leaddirectly to EI calculations As an example of SAR values obtained by a tooldeveloped for the prediction of whole-body and localized SARs and absorbed dosesfor indoor wireless network deployments in Figure 13 we show distributions for thetraditional deployment (top) and for the WP5 exposure-optimized deployment
Figure 13 Whole-body SAR_DL (distribution for the traditional deployment (top) and for the exposure-optimized deployment (bottom)
Document ID D26 Global Wireless Exposure Metric DefinitionFP7 Contract ndeg318273
Version V4 29Dissemination level PU
4 EXAMPLES OF APPLICATION
41 Computing chain
In this section three simplified examples of EI computation are detailed In no casethese examples are representing the completeness of the possibilities that can becover by the EI but they illustrate the process of computation
The first two examples illustrate the use of network planning tools in the evaluation ofthe EIThe first example detailed in the section 42 consists in comparing two indoor officescenarios first with wireless communication offered by only 3G outdoor macro basestations scenario and secondly with an additional 3G femtocell (Table 6)
Scenario 1
Time PopulationUser
ProfileEnvironment RAT Cell Type Posture Usage
1h inthe
afternoon
Adults Heavy Indoor 3G Macro Standing Voice mobile
Medium Datamobile
Light Data Tablet
Nonuser
Data Laptop
Scenario 2
Time PopulationUser
ProfileEnvironment RAT Cell Type Posture Usage
1h inthe
afternoon
Adults Heavy Indoor 3G Femto Standing Voice mobile
Medium Datamobile
Light Data Tablet
Nonuser
Data Laptop
Table 6 input variables for the 3G indoor sub-scenarios described in section 42
The second example detailed in section 43 is considering a data LTE macro urbanscenario (Table 7)
Time PopulationUser
ProfileEnvironment RAT Cell Type Posture Usage
Day Youngpeople
Moderate Indoor 4G Macro Standing Data mobile
Document ID D26 Global Wireless Exposure Metric DefinitionFP7 Contract ndeg318273
Version V4 30Dissemination level PU
Night Adults Non user Outdoor Sitting Data mobile
Seniors Data Tablet
Table 7 input variables for the LTE scenario described in section 43
The last example detailed in section 44 illustrates the use of dosimetermeasurements in the EI evaluation It is considering a macro outdoor LTE scenariowhere one user is wearing a dosimeter
42 Indoor exposure from 3G macro and femto-cells
The EI was evaluated for two scenarios considering the exposure of people locatedindoor The population consisted of adults making UMTS (phone calls with thephone on the right side of the head The scenario 1 is considering a macrocellconnection and the scenario 2 an indoor small cell connection Different user profilesare considered
10 heavy users 30 s usage 50 moderate users 10 s usage 25 light users 3 s usage 15 no usage 0 s usage
For the calculation of the EI several input parameters are needed reference SARvalues averaged transmitted power valuesത and averaged incident power densityvalues inc (see Table 8)The power (density) values that were used for the indoor macrocell scenario arederived from measurements in an office building (Zuiderpoort building GhentBelgium) [PLETS14] Figure 14 shows the considered buildingFor the indoor femtocell scenario accurate power (density) values from the WHIPPtool a heuristic indoor network calculator and planner [PLETS12] were used In theconsidered building a femtocell with an Equivalent Isotropically Radiated Power(EIRP) of 7 dBm is installed A different femtocell EIRP can lead to a largely differentEI Reference SAR values were taken from [LAUER13] and applied to the scenariosfor an adult standing using the phone on the right side of the head Since the
measured macrocell values (RXinc and Pഥଡ଼) were not recorded in the smaller andmore enclosed central areas of the building floor (toilets kitchen shedhellip) femtocellpredictions were limited to the non-shaded areas around the center in Figure 14 Forthe femtocell values locations within 50 cm of the base station are discardedassuming that people stay at least half a meter away from base stations For thesimulations a sub-scenario is also considered for which a 20 dB worse macrocellconnection is assumed for the same building floor This could correspond to abuilding with a penetration loss that is 20 dB higher than before or a building which islocated further from the macrocell base station (path loss increase of 20 dB) Table 8
shows that the assumed Pഥଡ଼ RXinc values in case of a lsquoworse connectionrsquo areindeed 20 dB higher lower
Document ID D26 Global Wireless Exposure Metric DefinitionFP7 Contract ndeg318273
Version V4 31Dissemination level PU
Figure 14 Ground plan of the considered floor (90 m x 17 m) of the office building that is simulatedFemtocell base station location is indicated with purple hexagon
Scenario 1Macro indoor
Scenario 2Femto indoor
௨ܣ 0003 Wkg 0003 Wkg
௨ܣ 000495 Wkg 000495 Wkg
ത 26610-5 W 28510-7 W
ത(worse connection) 26610-3 W 28510-7 W
RXinc81510-8 Wmsup2 51810-6 Wmsup2
RXinc(worse connection) 81510-10 Wmsup2 51810-6 Wmsup2
Table 8 Reference SAR values and average transmitted power and observed power densityvalues
In the following the results for the different indoor scenarios are discussedFigure 15 (a) compares the EI for scenarios 1 and 2 for the indoor office buildingFrom an exposure-point-of-view the indoor femtocell scenario (scenario 2 EI =158E-8 Wkg) is a factor 28 worse than the indoor macrocell scenario (scenario 1 EI= 564E-10 Wkg) The main EI contribution in scenario 2 is the high DL exposureoriginating from the femtocell (155E-8 Wkg) The scale in Figure 15 (a) has beenadjusted the bar that represents the DL femto indoor contribution is in reality 44times the length of the Y-scaleThere are several reasons why the installation of a femtocell is not beneficial in thiscaseA first reason is that the EI contributions of the macrocell are almost equal for UL andDL which is optimalA second reason is that the femtocell EIRP is chosen quite high (7 dBm) despite thegood macrocell connection (average value of -6925 dBm) still 77 of the DL fieldsare higher in the femtocell caseA third reason is that a femtocell installation has the disadvantage that observedpower densities on a building floor due to a femtocell base station are lesshomogeneously distributed than fields due to a (more distant) macrocell base stationAs people are assumed to ndash on average- reside an equal time at each location on thebuilding floor (except shaded areas and locations closer than 50 cm from the BS)locations close to the femtocell contribute a lot to the EI When people approach afemtocell the absorbed exposure dose increases in a more-than-linear wayMacrocell base stations have the advantage that ULDL fields are morehomogeneously distributed over the building floor It should also be noted that thehigher the UL usage the more the femtocell scenario will benefit compared to themacrocell scenario (lower EI) However in the considered case the UL usage timeswould have to increase by a factor 48 to yield a total EI (macrocell scenario 1) that isequal to the EI of scenario 2 (femtocell scenario EI = 158E-8 Wkg)
Document ID D26 Global Wireless Exposure Metric DefinitionFP7 Contract ndeg318273
Version V4 32Dissemination level PU
We also studied a second case where a less favourable macrocell case isconsidered (lsquoworse connectionrdquo) It is assumed that the connection with the macrocellbase station is now 20 dB worse than in the previous case Figure 15 (b) comparesthe EI for the macrocell and femtocell deployments Due to the worse connection(average received macrocell DL power of -8925 dBm) the macrocell EI is nowcompletely determined by the UL contribution (320E-8 Wkg) and the femtocellscenario (scenario 2 EI = 155E-8 Wkg) has an EI that is 48 of the macrocell EIwhich makes it preferable over the macrocell deployment Moreover the observedpower densities due to the femtocell are higher than the macrocell power densities atall locations (better QoS)It can be concluded that the installation of femtocell is not always recommended forshorter UL usage times andor better macrocell connection qualities it could beadvised to rely on the existing macrocell infrastructure Also when installing afemtocell its EIRP should be adjusted to the size and physical properties of thebuilding and should not be set at a needlessly high value
(a) (b)Figure 15 Comparison of the contributions to the whole-body EI for (a) indoor scenarios 1 and 2 in theconsidered building (b) indoor scenarios 1 and 2 in this building with 20 dB worse connection qualityTotal EI levels for each scenario are indicated with the horizontal line EI values are shown in Wkg
43 Data LTE macro urban scenario
431 Input variables linked to the network
The EI is evaluated from a macro-cellular LTE network in a real geographical area ndashpart of the 7th district of Paris (see Figure 16) The proposed scenario was previouslydefined in frame of the French ANR project ECOSCells [BCL12] and the EuropeanFP7 project FREEDOM (httpwwwict-freedomeu) for the simulation and analysis ofheterogeneous network topologies (hetNet) It is based on a real environment usingHigh Resolution (HR) map data realistic BSUE deployments and deterministicpropagation models
The macro layout is organized as three rings around a central three-sector sitemacro base stations being deployed with an inter-site distance of about 450 m in ahexagonal manner as shown in Figure 16
Document ID D26 Global Wireless Exposure Metric DefinitionFP7 Contract ndeg318273
Version V4 33Dissemination level PU
Figure 16 View of the macro-cell hexagonal deployment in the area
The study area (ie area where network performance is evaluated) is limited to thesurface covered by the three co-located central macro-cells and the first ring (Figure17) Thus the study area is equivalent to 12 macro-cells The base stations outsidethis study area are included in simulations to generate an accurate interferencepattern
Figure 17 Study area composed of 12 macro sites localised in the 7th
district of Paris France
Document ID D26 Global Wireless Exposure Metric DefinitionFP7 Contract ndeg318273
Version V4 34Dissemination level PU
The positions and heights of the base stations have been selected in realisticapproach sites are placed on slightly dominant rooftops and sector antennas aredistributed at the rooftop edges Directive antennas are used (with 3GPP radiationpattern) Each site is composed of three sectors oriented in azimuth directions 0deg120deg and 240deg with down-tilt 6degUsers are assumed to be uniformly distributed in the study area an indoor ratio setsthe percentage of users located inside buildings at the ground floorThe specifications of input parameters are summed up in Table 9
Environment Typical European Dense Urban environment (Paris VII district France)
System
Downlink (DL) and Uplink (UL)
LTE FDD 2 x 10 MHz
Central frequency 2600 MHz
Macro layout
Hexagonal sitedeployment
37 sites corresponding to 83 macro cellsincluding 12 sites in the center of the studyarea Inter-site distance (ISD) of 450 m
Nominal transmitpowerEPRE
40 W 228 dBm
AntennaDirectional with 14 dBi gain 6deg electric down-tilt 2 antennassector Average antennaheight 30 m above ground
Noise figure 25 dB
UL power control (openloop)
Path loss compensation factor 1SINR target 208 dB
UserEquipment
MaxMin transmit power 23 dBm -40 dBm
AntennaOmni-directional with 0 dBi gain 2antennasuser device Antenna height 15 mabove ground
Noise figure 9 dB
User traffic
Average active userdensity
Depends on daynight
DistributionUniform spatial distribution within thesimulation area Single floor (at 15 m height)No user mobility
Table 9 Inputs in SIRADEL simulator
432 Input variables linked to the population
Category of population
The population density of the 7th District of Paris was estimated at 14 36050
inhabitants per kmsup2 in 2009 [Carte09]
We are considering the population above 15 years old
Given the population distribution by age (Figure 18) it was decided to divide the adult
population into 3 categories young people (between 15 and 29 years) adults
Document ID D26 Global Wireless Exposure Metric DefinitionFP7 Contract ndeg318273
Version V4 35Dissemination level PU
(between 30 and 59 years) and seniors (over 60 years) Table 10 shows the
percentages of people in each category
Figure 18 Population distribution by age in Paris 7th district in 2007
Population category Pourcentage(prop)
Adults (30-59 yo) 45
Young people (15-29 yo) 26
Seniors (+60 yo) 29
Table 10 Number of people in each population category
Time periods
A 24-hour day is divided into two periods the day from 8 am to 6 pm (10 hours in
total) and the night from 6 pm to 8 am (14 hours in total)
Environment
Time spent indoor or outdoor on an average day for each category is extracted from
Table 2
Usage
Only data traffic is considered The device is assumed to be a mobile phone whilethe user is in a standing posture Considering the existence of 4 telecom operators inFrance only 25 of the 7th district population is assumed to be using this LTE macronetwork In this example we consider two user profiles moderate user and non-userFor each population category we derived from [Bigot et al 2013] the proportions ofusers and non-users of mobile phones for data traffic (see Table 11)
User profileYoung people (15-29
yo)Adults (30-59 yo) Seniors (over 60 yo)
non-users 33 57 91
Document ID D26 Global Wireless Exposure Metric DefinitionFP7 Contract ndeg318273
Version V4 36Dissemination level PU
users 67 43 9Table 11 Repartition of users and non-users for each population category
For simplicity the parameters for the moderate user profile are applied to all userswe assume a daily data traffic per active user of 66 MB [CISCO13] a DLUL ratio of9010 (this ratio was evaluated from data collected through measurements ofKPIs by sensors inside the French Orange network) and a daynight ratio of4357 From [CISCO13] only 29 of connections in 2013 were on 4GReference SAR values were extracted from Table 4 and Table 5
433 Transmitted power ഥ and received power density ത calculationܖ
Incident ோpower densities and transmittedത powers were calculated by usingthe network planner simulation tool Volcano Suite (Siradel France)Figure 19 andFigure 20 illustrate respectively the average UE Tx power calculated over the 7thParis district during the day and the average incident power density evaluated duringthe day or the night (values during the day or the night time were quasi identical)
Figure 19 Map of the average UL Tx power (dBm) calculated indoor at ground floor and outdoorduring the day (on the left) and map of daily average transmission duration (s) (on the right)
Figure 20 Map of the average DL incident power density (dBμVm) calculated indoor at ground floor and outdoor during the day or the night
Because the average active LTE user density is very low (41 userskm2consequence of the 29 LTE connections assumption) the DL user traffic utilises
Document ID D26 Global Wireless Exposure Metric DefinitionFP7 Contract ndeg318273
Version V4 37Dissemination level PU
less than 1 of available resources which strongly impact the predicted DL incidentpower density We can see in Figure 19 (left figure) that the calculated average Txpower is minimum in outdoor areas in the vicinity of the base stations or in Line ofSight (LOS) while it is at a maximum indoors and outdoors far away from the basestations The right map in Figure 19 gives the average communication durationwhich directly impacts the calculation of the UL exposure contribution The better thelink performance is the higher the throughput and thus the longer thecommunication duration That is why the longest durations are observed indoors andparticularly in the building parts that suffer from the strongest propagation lossesFigure 20 shows that the strongest DL incident power density levels are predicted inLOS areas while much lower levels are observed inside the buildings where mostpopulation is located
434 Exposure index calculation
Aggregating everything we obtain the following value for the EI (based on the Whole-body SAR) of the over 15 years old population of the 7th district of Paris consideringa macrocell LTE network EIWBSAR = 31910 -7 Wkg
44 Using dosimeters for the EI evaluation
This section provides an evaluation of the downlink and uplink exposure indexes fora subject wearing a reference isotropic dosimeter on the head together with fivedosimeters at different locations of the body as well as two mobile terminals Thesubject is moving in a multipath environment including a 3-sector LTE base station
When modelling the radio link between the user devices and the base station oneconsiders the influence of the body (ie body coupling [MaOC12] and bodymovements (using realistic body motion capture tools [MaCo13]) and accounts forthe propagation environment using a geometrically based statistical channel (GBSC)model (ie multipath propagation) Therefore the modelling of the radio channel hasbeen separated into several steps as described in [Mack13] Figure 21
Document ID D26 Global Wireless Exposure Metric DefinitionFP7 Contract ndeg318273
Version V4 38Dissemination level PU
Figure 21 Model for EMF assessment from dosimeter data
The simulated scenario Figure 22 considers a reference isotropic dosimeter on thehead of the user (simulating the real body exposure) together with five wearabledosimeters These dosimeters allow the downlink exposure assessment The user isalso carrying two mobile terminals allowing to assess the uplink exposure
Figure 22 Placement of wearable dosimeters and mobile terminals on the body
For the downlink the received (Rx) power ோ௫ at the mobile terminal (ordosimeter) is calculated from
ோ௫[ౚ ]= ௌ[ౚ ]
minus ௧௧[ౚ]ܮ (6)
where ௌ base station (BS) transmitted (Tx) power ௧௧ܮ total path loss including gains of mobile terminal (or
dosimeter) and BS
The received power density ோ௫ at the mobile terminal (or dosimeter) iscalculated from
ோ௫ ୫ మ൧=
ோ௫[ ]
ܣ మ൧
(7)
where ܣ is the mobile terminal antenna effective area
ܣ ୫ మ൧=ଶ[ߣ ]
ߨ4ோ௫[ౚഠ]ܩതതതതതതതതത (8)
where wavelength ோ௫തതതതതܩ average gain of the receiving antenna (ie dosimeter probe) in
off body direction (eg half-hemisphere of the gain pattern ieߠ isin [minus9090]deg and isin [minus9090]deg)
ோ௫[ౚഠ]ܩതതതതതതതതത=
1
ఏఝ ோ௫[ౚ]ܩ
ߠ) )
ேക
ୀଵ
ேഇ
ୀଵ
(9)
where ఏ and number of elevation (ߠ) and azimuth () directions
The exposure index for the DL ܫܧ can be determined from [LEXNET D24 2013]
Document ID D26 Global Wireless Exposure Metric DefinitionFP7 Contract ndeg318273
Version V4 39Dissemination level PU
[୩]ܫܧ = ௪ܣ
|ଵ ୫ మ[୫ మ୩]
times ோ௫[ ୫ మ]times [ୱ]ݐ (10)
where ௪ܣ
|ଵ ୫ మ normalised whole body averaged SAR coefficient per
1 Wm2 of Rx power density as indicated in [LEXNET D24 2013] ݐ time of the exposure from BS
ோ௫ average Rx power density during period ݐ
For the uplink the required Tx power from the mobile terminal is determined from ௫[୫ ]
= ௌ[୫ ]+ ܫ ௧௧[]
+ ܯ [] + ௧௧[]ܮ (11)
where ௌ noise and interference level at the BS ܫ ௧௧ target SINR at the BS
ܯ fading margin for a dynamic usage ௧௧ܮ total path loss including gain of MT and BS
ௌ is calculated asௌ[୫ ]
= minus174[୫ ] + 10logଵ(ܤ[ୌ]) + ி[]+ []ܫ (12)
where ܤ bandwidth ி noise figure ܫ interference
The EI for the UL ܫܧ can be determined from [LEXNET D24 2013]
[୩]ܫܧ = ௪ܣ
|ଵ [ଵ୩]times ௫[ ]
times [ୱ]ݐ (13)
where ௪ܣ
|ଵ whole body averaged SAR coefficient per 1 W of Tx poweras indicated in [LEXNET D24 2013]
ݐ time of the exposure ( duration of the mobile terminal usage)
௫ average Tx power during period ݐ
A macro cell outdoor street scenario has been considered including a set of 10clusters of 3 scatterers each with a Uniform Distribution in the half space of anellipsoid A 3-sector base station antenna is located in the middle of the street atx=100 m The user is moving on a straight line in the middle of the street (ie y=10m xisin[50 150] m) Figure 23
Document ID D26 Global Wireless Exposure Metric DefinitionFP7 Contract ndeg318273
Version V4 40Dissemination level PU
Figure 23 Scenario
The parameters of the scenario are presented in Table 12 being worthwhile to noticethat the values of ௪ܣ
and ௪ܣ are taken from preliminary SAR simulations The
calculated noise and interference level at the BS is ௌ= -12774 dBm
System
Frequency [MHz] 2600
[HoTo11]ܤ
Resource Block [kHz] 15
Full [MHz] 20
Full LTE-A [MHz] 100
Downlink
EIRP BS Tx power [dBm] 46 [LEXNET D23 2013]
ோ௫ܩ [dBi] 122 [LEXNET D32 2014]
ݓܣ|ܮܦ
1Wm2[m2kg] 300
Uplink
ܫ ௧௧[dB] 208 [HoTo11]
ி [dB] 25 [LEXNET D23 2013]
[dB]ܫ 8 [HoTo11]
ܯ [dB] 30 [Mack13]
ݓܣ|ܮ
1W[1kg] 495
Table 12 Scenario overview
Figure 24 illustrates the considered macro cell base station antenna and thedosimeter realised gain patterns
(a) BS with 3 sectors (b) Dosimeter on the bodyFigure 24 Realised gain pattern
Document ID D26 Global Wireless Exposure Metric DefinitionFP7 Contract ndeg318273
Version V4 41Dissemination level PU
441 EI for downlink
The average Rx power density obtained from the isotropic reference probe and thedosimeter located at WA_L and WA_R is presented in Figure 25 The received powerdensity at WA_L dosimeter is very similar to the one gathered at the isotropic probewhich mainly comes from the similar Line-Of-Sight (LOS) propagation conditions Thepower received in WA_R dosimeter is much lower due to the body shadowing
Figure 25 Rx power density at selected positions
The distribution of the Rx power density is presented in Figure 26 In spite of thebody shadowing the distribution of the Rx power density at the WA_R dosimeter ismuch similar to the ones for the reference and the WA_L dosimeters All of themfollow an exponential decay which should be subject to further investigation
(a) isotropic (b) WA_L (c) WA_R
Figure 26 Rx power density histograms
The received power density and the downlink exposure index calculated based onthe measurement of the dosimeters located in the various locations on the body arepresented in Table 13
ோ௫ [mWm2] ܫܧ [mJkg]
isotropic 35868 2690
WA_F 18357 1377
WA_B 29538 2215
Document ID D26 Global Wireless Exposure Metric DefinitionFP7 Contract ndeg318273
Version V4 42Dissemination level PU
WA_L 28516 2138
WA_R 9060 680
TO_F 18436 1383
Table 13 Downlink Exposure
The WA_L dosimeter and the isotropic probe exposure indexes are very similarbecause of the LOS propagation conditions The same is valid for the WA_Bdosimeter which is also in LOS with the base station For the other dosimeters theexposure index is naturally lower due to the body shadowing In this scenario theuse of a wearable dosimeter in the front or in the right side of the body displays anexposure index reading about 4 times lower than the real user exposure
442 EI for uplink
The average Tx power from the mobile phone hold near HE_L and HE_R ispresented in Figure 27 The uplink power control is clearly noticeable by the highertransmitted power in HE_R as the mobile terminal adjusts the Tx power tocompensate for the higher channel fading
Figure 27 Tx power for straight6min scenario at 2600 MHz for LTE-A
The distribution of the Tx power at HE_L and HE_R is presented in Figure 28 Inspite of the different intensities HE_L and HE_R Tx powers present a similardistribution
Document ID D26 Global Wireless Exposure Metric DefinitionFP7 Contract ndeg318273
Version V4 43Dissemination level PU
(a) HE_L (b) HE_R
Figure 28 Tx power histograms
The average transmitted power and the uplink exposure index from the mobileterminals located near left and right side of the head ( e HE_L and HE_R) arepresented in Table 14
௫ [mW] ܫܧ [mJkg]
RB FULL FULL_A RB FULL FULL_A
HE_L mobile 002 165 827 003 295 1474
HE_R mobile 008 838 4191 014 1493 7468
Table 14 Uplink Exposure
These results show the importance of the propagation conditions in the EMFexposure Due to the non LOS conditions the exposure index in the right side of thehead is 5 times higher than the one on the left side
5 CONCLUSION
In this deliverable a global metric is defined to test and optimize wirelesstelecommunication networks in terms of EMF exposureThe proposed metric called Exposure Index (EI) has the advantage to overpass thelimitations of the actual metrics that in fact are managing separately the exposureinduced by personal devices and the one induced by the network equipment (basestations and access points) But devices base station antennas and access pointsare definitely parts of the same wireless environment and the global wirelessexposure is induced by all of them
The EI is described with an analytical model with input variables describing thecoverage area of interest the accessible networks the population and the habits interms of location and of wireless devices usage The output is the EI covering theday-to-day averaged exposure of population in a given area incurred by an entirewireless network from base stations and access points to individual devices
In this deliverable the analytical model of EI has been detailed and the inputvariables defined Then the use of the EI to minimize the EMF exposure in wirelesscommunication networks is presented in connection with work-package 4 dedicated
Document ID D26 Global Wireless Exposure Metric DefinitionFP7 Contract ndeg318273
Version V4 44Dissemination level PU
to innovative radio components and work-package 5 focused on networks topologiesand technologies
The way to process a complete calculation of EI is illustrated on three deterministicexamples The first example considers comparison of indoor 3G macro and femtoscenarios The second example is taking into account an adult population in a LTEmacro urban environment with their data usage specifications Both examples arebased on a real environment representation and network simulation tools have beenused to simulate the up and down links The third example illustrates how dosimetermeasurements can be used to assess the EI
In our further work the statistical description of input variables will enable topropagate the variability and the uncertainty in the EI model making it more accurateand reliable Results will be made available in the future deliverable D28 DeliverableD33 will detail the used methodology to assess the EI and for the last year of theproject the work of partners involved in WP6 will be enhanced as they will be incharge of the implementation and evaluation of the EI
Document ID D26 Global Wireless Exposure Metric DefinitionFP7 Contract ndeg318273
Version V4 45Dissemination level PU
6 REFERENCES
[ALIAGA06] Aliaga C How is the time of women and men distributed
in Europe Statistics in focus population and social
conditions April 2006
[APVJM13] Aerts S Plets D Verloock L Joseph W and MartensL Assessment and comparison of RF-EMF exposure infemtocell and macrocell scenarios Radiat Protec Dosim2013
[BCL12] Brau M Corre Y Lostanlen Y Assessment of 3D
network coverage performance from dense small-cell LTE
Communications (ICC) 2012 IEEE International
Conference on
[Carte09] httpwwwcartesfrancefr
[CISCO13] Cisco Visual Networking Index Global Mobile Data Traffic
Forecast Update 2012-2017 February 2013
[CHLWW08] ConilE Hadjem A Lacroux F Wong M F and Wiart J
Variability analysis of SAR from 20 MHz to 24 GHz for
different adult and child models using finite-difference
time-domain Phys Med Biol vol 53 pp 1511-1525
2008
[CHRIST10] Christ A Kainz W Hahn E G Honegger K Zefferer
M Neufeld E Rascher W Janka R Bautz W Chen
J Kiefer B Schmitt P Hollenbach H-P Shen J
Oberle M Szczerba D Kam A Guag J W amp Kuster
N The Virtual Family--development of surface-based
anatomical models of two adults and two children for
dosimetric simulations Phys Med Biol vol 55 pp 23-38
2010
[CMKB06] Cooper TG Mann SM Khalid M and Blackwell RP
Public exposure to radio waves near GSM microcell and
picocell base stations Journal of the Society for
Radiological Protection Vol 26 No 2 pp 199-211 June
2006
[GCWW10] Gati A Conil E Wong MF Wiart J Duality between
uplink local and downlink whole body exposures in
operating Networks IEEE Transactions on EMC Vol 52
ndeg4 Nov 2010
Document ID D26 Global Wireless Exposure Metric DefinitionFP7 Contract ndeg318273
Version V4 46Dissemination level PU
[HoTo11] Hola HG And Toskala A LTE for UMTS Evolution to
LTE-Advanced Wiley UK 2011
[INFORMA12] Informa telecom amp Media Small Cell Market Update June
2012
[INSEE11] Insee enquecircte Emploi du temps 2009-2010 Insee
Premiere Ndeg 1377 November 2011
[IST] httpwwwist-winnerorg
[KALLIOLA02] Kalliola K Sulonen K Laitinen H Kiveks O Krogerus J
Vainikainen P Angular power distribution and mean
effective gain of mobile antenna in different propagation
environments IEEE Trans Veh Technol vol 51 pp 823ndash
838 2002
[KIENTEGA11] Thierry Kientega EConil A Gati A Hadjem ERichalot M-F Wong OPicon Joe Wiart Analysis of thedistribution of specific absorption rate induced by fiveplane waves with a fast and new method in VisibleHuman URSI conference 2011
[LAUER13] Lauer O Frei P Gosselin M C Joseph W Roumloumlsli M
and Froumlhlich J Combining near- and far-field exposure for
an organ-specific and whole-body RF-EMF proxy for
epidemiological research a reference case
Bioelectromagnetics vol 34(5) pp 366-74 2013
[LEXNET D21 2013] Vermeeren G Thielens A Aerts S Joseph W
Martens L Oliveira C Mackowiak M Correia LM
Pejanovic-Djurisic M Veljovic Z Nešković A
Koprivica M Gati A Varsier N Hadjem A Wiart J
ConilE ldquoD21 Current metrics for EMF exposure
evaluationrdquo LEXNET project April 2013
[LEXNET D22 2013] Wiedemann P M Freudenstein F ldquoD22 Risk and
exposure perceptionrdquo LEXNET project July 2013
[LEXNET D23 2013] Vermeeren G Plets D Joseph W Martens L Conil E
Varsier N Wiart J Corre Y Oliveira C Sebastiatildeo D
Correia LM Aguumlero R Diez L Rodriacuteguez L Koprivica
M Nešković A Popović M Milinković J Nikšić S ldquoD23
Scenariosrdquo LEXNET project November 2013
[LEXNET D24 2013] Conil E ldquoD24 Global Wireless Exposure Metric
Definitionrdquo LEXNET project October 2013
Document ID D26 Global Wireless Exposure Metric DefinitionFP7 Contract ndeg318273
Version V4 47Dissemination level PU
[LEXNET D32 2014] BoriesS (ed) ldquoD32 Wideband dosimeter design study amp
performances characterizationrdquo LEXNET project July
2014
[LEXNET D41 2013] Bories S Fang Y Brown TBegaud X Pinto Y Ciblat P
Ksairi N De Domenico A Clemente A Fernandez Y
Lalam M Masera E Wilson M Tesanovic M Kocan E
Pejanovic-Djurisic M Veljovic Z Milatović B Popović M
Nešković A Koprivica M Voinescu A Dragomir D
Slusanschi E laquo D41 Promising Low Exposure Index
Solutions for Components and Transmission
Techniques raquo LEXNET project November 2013
[LEXNET IR21 2013] ldquoNumerical toolsrdquo LEXNET project July 2013
[LEXNET IR51 2013] ldquoSmart low-EMF architectures state of the art and way
forwardrdquo LEXNET project May 2013
[LEXNET D25 2014] Wiedemann P M Freudenstein F ldquoD25 Risk and
exposure perceptionrdquo LEXNET project November 2014
[LEXNET D42 2014] Bories S Fang Y Brown TBegaud X Pinto Y Ciblat P
Ksairi N De Domenico A Clemente A Fernandez Y
Lalam M Masera E Wilson M Tesanovic M Kocan E
Pejanovic-Djurisic M Veljovic Z Milatović B Popović M
Nešković A Koprivica M Voinescu A Dragomir D
Slusanschi E laquo D42 Performance Evaluation of Low
Exposure index solutions for components and
Transmission Techniques raquo LEXNET project November
2014
[MaOC12] Mackowiak M Oliveira C and Correia L M RadiationPattern of Wearable Antennas A Statistical Analysis of theInfluence of the Human Body International Journal ofWireless Information Networks Vol 19 No 3 pp 209-218 2012
[MaCo13] Mackowiak M and Correia L M Statistical Model of theInfluence of Body Dynamics on the Radiation Pattern ofWearable Antennas in Off-Body Radio ChannelsWireless Personal Communications 101007s11277-013-1193-x May 2013
[Mack13] Mackowiak M Modelling MIMO Systems in Body AreaNetworks in Outdoors PhD Thesis IST - University ofLisbon Lisbon Portugal 2013
Document ID D26 Global Wireless Exposure Metric DefinitionFP7 Contract ndeg318273
Version V4 48Dissemination level PU
[NAGAOKA08] Nagaoka T and Watanabe S Postured voxel-based
human models for electromagnetic dosimetry Physics in
medicine and biology vol 53 pp 7047-7061 2008
[PLETS12] Plets D Joseph W Vanhecke K Tanghe E and Martens
L 2012 Coverage Prediction and Optimization Algorithms
for Indoor Environments EURASIP 2012123
[PLETS14] Plets D Joseph W Aerts S Vanhecke K and Martens L
accepted 2014 Prediction and comparison of downlink
electric-field and uplink localized SAR values for realistic
indoor wireless planning Radiation Protection Dosimetry
[SaNC10] SaloJ Nur-AlamM and ChangK Practical Introduction
to LTE Radio Planning white paper European
Communications Engineering (ECE) Ltd Espoo Finland
Nov 2010 (wwweceltdcom)
[TAFLOVE00] Taflove A and Hagness S C 2000 Computational
Electrodynamics The Finite-Difference Time-Domain
Method 2nd edn (Boston MA Artech House Publishers)
[TNS10] TNS Sofres survey Observatoire Socieacutetal du teacuteleacutephone
mobile Dec 2010
[VAJM13] Vermeeren G Aerts S Plets D Joseph W Martens
LConil E Varsier N Wiart J Core YOliveira C Sebastiatildeo
DCorreia L Aguumlero R Diez L Rodriacuteguez L Koprivica M
Nešković A Popović M Milinković J Nikšić S D23
Scenarios LEXNET project Novembre 2013
[WIART08] Wiart J Hadjem A Wong M F and Bloch I Analysis of
RF exposure in the head tissues of children and adults
Physics in medicine and biology vol 53 pp 3681-3695
2008
[WINNER D112 2007] Kyoumlsti P et al D112 WINNER II Channel models
WINNER project September 2007
[ZHAO02] Zhao X Kivinen J Vainikainen P Skog K Propagation
characteristics for wideband outdoor mobile
communications at 53 GHz IEEE J Sel Areas Commun
vol 20 pp 507ndash514 2002
Document ID D26 Global Wireless Exposure Metric DefinitionFP7 Contract ndeg318273
Version V4 49Dissemination level PU
APPENDIX 1 NUMERICAL DOSIMETRIC SIMULATIONS
This appendix describes the main assumptions concerning the frequency bands used
in the numerical dosimetric simulations
Table A1 gives the frequency bands used for SAR simulations as well as theservices and DLUL frequencies considered in each of those frequency bands forLEXNET studies Note that at these frequencies (especially at the higher ones) nolarge differences are expected between SAR results [CHLWW08] Accordingly forthe sake of simplicity it is assumed that
the same frequency band is assumed for both up- and down-link each frequency band may cover more than one system (eg simulation at
1940 MHz covers both GSM1800 and UMTS2000)
Table A1 Technical specifications for LEXNET selected services
SAR
simulation
frequency
band [MHz]
RAT
RAT frequency band [MHz]
DL UL
400 LTE 400 380 - 470
900
LTE 800 875- 885 830 - 840
GSM 900 935 - 960 890 - 915
UMTS 900 925 ndash 960 880 ndash 915
1940
GSM 1800 1805 - 1880 1710 - 1785
UMTS 2000 2110 - 2170 1900 - 1980
2600WiFi bgn 2400 - 2484
LTE 2600 2620 - 2690 2500 - 2570
For the WiFi an between 5470 and 5725 MHz frequency bands no SAR simulation
was performed yet
Document ID D26 Global Wireless Exposure Metric DefinitionFP7 Contract ndeg318273
Version V4 50Dissemination level PU
APPENDIX 2 INTERNAL REVIEW
Reviewer 1 Yoann Corre Reviewer 2 Mick Wilson
Answer Comments Type Answer Comments Type
1 Is the deliverable in accordance with
(i) the Descriptionof Work
Yes
No
M
m
a
Yes
No
M
m
a
(ii) the internationalState of theArt
Yes
No
M
m
a
Yes
No
M
m
a
2 Is the quality of the deliverable in a status
(i) that allows tosend it to EC
Yes
No
M
m
a
Yes
No
M
m
a
(ii) that needsimprovement ofthe writing bythe editor of thedeliverable
Yes
No
See proposedenhancements
In particular thepresentation of the basic EIconcept could be improvedin the Abstract Introductionsection 21 and Conclusion
M
m
a
Yes
No
See comments onSection 3
M
m
a
(iii) that needsfurther work bythe partnersresponsible forthe deliverable
Yes
No
Mostly minor changes Seethe proposedenhancements
Section 44 is a copy-pastof a whole section in D33Either D26 or D33 must bechanged to avoidredundancy (replacing thewhole description by asummary adapted to theintegrated deliverable)
It must be made more clearwhere the reader will findthe missing SAR data andthe announced uncertaintystudy results
M
m
a
Yes
No
M
m
a
Type of comments M = Major comment m = minor comment a = advice
Document ID D26 Global Wireless Exposure Metric DefinitionFP7 Contract ndeg318273
Version V4 12Dissemination level PU
bull the radio access technologies RATs (GSM UMTS LTE WiFi etc)frequency bands and deployment layers (macro micro and femto cells) thatusers connect to
bull the posture as different body postures will lead to different absorption rates inthe human body
bull the device usage (making a phone call does not lead to the same exposure asdownloading data)
Figure 4 the LEXNET chain of exposure
Different exposure scenarios [LEXNET D23 2013] are considered and aggregatedby putting weights on each configuration thereby determining the EI A partial EI canbe for example computed for a scenario that considers only a subset of RATspopulation environment etc Then several partial EI can be aggregated with aweight related to their representativenessEI takes into account all these parameters coming both from the telecom world todescribe the accessible network environment and from data on how people segmenttheir life to describe how people are using this network
22 Mathematical formalization
221 Exposure Index Equation
The Exposure Index is calculated for a finite geographical area which can be ofurban suburban or rural type for instanceThe general formulation of the Exposure Index contains a set of technicalparameters as described below The number of values classes or settings ofeach parameter depends on the level of detail of the available data and on thelevel of achievable complexity in terms of calculation For a given geographicalarea the EI takes the following into account (see also Table 1)
the time period (t) eg day and night
Document ID D26 Global Wireless Exposure Metric DefinitionFP7 Contract ndeg318273
Version V4 13Dissemination level PU
the population (p) segmented into different categories eg children (under15 yo) young people (15-29 yo) adults (30-59 yo) and seniors (60 yoand over)
the user load profiles (l) eg heavy medium light or non-users the environment (e) eg indoor (office home) outdoor and in commuting
(bus car subway etchellip) the different available Radio Access Technologies (RATs) (r) eg 2G (900
MHz and 1800 MHz) 3G 4G WiFi the number of RATs depends on thescenario
the different cell types (c) eg macro micro pico and femto cells theaccessibility to the different cell types depends on the scenario
the posture (pos) eg sitting standing the usage (u) is described by the device (eg mobile PC laptop) and the
usage (eg voice call data)
Time PopulationUser
ProfileEnvironment RAT Cell Type Posture Usage
Day Children Heavy Indoor 2G Macro Standing Voice mobile
Night Youngpeople
Medium Outdoor 3G Micro Sitting Data mobile
Adults Light Commuting 4G Pico Data Tablet
Seniors Nonuser
WiFi Femto Data Laptopon the laps
Data Laptopon the desk
Table 1 input variables in the modelling of the EI
The individual exposure contributions rely on the SAR expressed in Wkg The SARwill depend on the device the frequency band the morphology and the posture ofthe user as well as on the position and distance of the source with respect to theuser As part of LEXNET a set of numerical dosimetric simulations are performed inorder to fill out a comprehensive matrix of raw normalized SAR values These SARvalues can be whole-body or localized SAR values Whole-body SAR values areevaluated by averaging SAR over the whole-body whereas localized SAR values arevalues focusing on a body volume specific organ or tissue Different EI can beevaluated depending on the value of interest (whole-body or localized value)Network simulation tools will provide transmitted and received power average valuesto apply to the raw SAR matrixInformation and Communication Technologies (ICT) usage data obtained throughsensors inside the network and segmentation life data will finally provide the levels toapply for the evaluation of the EI
Document ID D26 Global Wireless Exposure Metric DefinitionFP7 Contract ndeg318273
Version V4 14Dissemination level PU
SARܫܧ =1
T
tperlcpos ൫ ത
൯
ே
௨
ேೞ
௦
ேಽ
ே
ேೃ
ேಶ
ேು
ே
௧
+ RXinc + ௦ௗ௩௦ோ௦ௗ௩௦
൨
(1)
where EISAR is the Exposure Index value the average exposure of the population of
the considered geographical area over the considered time frame T SARrefers to whole-body SAR organ-specific SAR or localized SAR
N is the number of considered periods within the considered time frame (egsingle day)
N is the number of considered Population categories N is the number of considered Environments N is the number of considered Radio Access Technologies Nେ is the number of considered Cell types N is the number of considered user Load profiles N୮୭ୱ is the number of considered Postures
N is the number of considered Usages with devices Pഥଡ଼ is the mean TX power transmitted by the usersrsquo devices during the period
t in usage mode u connected to RAT r in environment e For example whenEI is computed from simulation tools the TX power can be predicted over amap that covers the whole considered geographical area and the averagevalue is extracted for the EI evaluation See details in section 223
Sത ଡ଼୧୬ୡis the mean incident power density on the human body during the periodt induced by RAT r in environment e A distribution of the incident powerdensity for the whole considered geographical area is considered and theaverage value over this area is taken into account for the EI evaluation
ோ௦ௗ௩௦ is the incident power density on the human body during the
period t induced by a wireless device connected to RAT r of a user in theproximity in environment e This term is important when the exposed personis the user itself it can also be significant for persons in the proximity of usersof a wireless device for instance in a crowded meeting room in publictransportation etc In the applications discussed in this paper this term is
neglected We also remark that ோ௦ௗ௩௦ depends on the orientation of
the user of the wireless device with respect to the body of the people in itsproximity See details in section 223
d (ௐ ௦
) ௦ௗ௩௦ (
ௐ ௦
ௐ
మ) and dୈ (ௐ ௦
ௐ
మ ) are the normalised
raw dose values for UL the DL from the user in the proximity and DL frombase stations and access points respectively all multiplied by the time spentin the configuration See details in section 222
Document ID D26 Global Wireless Exposure Metric DefinitionFP7 Contract ndeg318273
Version V4 15Dissemination level PU
f୲୮ ୪ୡ୮୭ୱ is the fraction of the total population that corresponds to population
category p user load profile l in posture pos connected to RAT r for a celltype c in environment e during the time period t
In the following we explain the different terms used in the EI formula in more detail
222 Coefficients and
The coefficient is associated to the exposure induced by the uplink andexpressed as an absorbed dose normalised to a transmitted power of 1 W
[ୱ୩
]
=௧௨௦[ୱ]ܦ
௨௦[ܣ ୩]
[ ]
Ws
kgW൨ (2)
where ௧௨௦ܦ
is the time duration of usage ݑ and a user profile load when
connected to the RAT ݎ operating in cell type in the environment for thepopulation category in the posture pos during the time period of the day ݐ
ௌோೠೞ
ಽ
can be the whole body or an organ-specific or tissue-specific
valueܣ for the usage ݑ and the posture pos in the frequency band of theRAT ݎ and the population category calculated for an incident emitted power
of
and normalized to this power
The coefficient is associated to the exposure induced by the downlink and alsoexpressed as an absorbed dose normalised to an incident power density of 1 Wm2
[ୱ୩
]
=௧௦[ୱ]ܦ
௦[ܣ ୩]
RX[W]inc
ݏ
ଶ ൨ (3)
where ௧௦ܦ
is the time duration of posture ݏ when connected to the RAT ݎ
operating in cell type in the environment for the population during thetime period of the day ݐ
ௌோೞ
ವಽ
ௌೃ can be the whole body or an organ-specific or tissue-specific
valueܣ induced by the base station or access points of the RAT ݎ in thepopulation for the posture ݏ normalized to the received power density
ோ
223 Transmitted power ഥ and received power density ത ܖ
ത is the average power transmitted by the device in busy mode (in active
communication) It should be noted that even in idle mode (not for activecommunication) the devices transmit from time to time some power (to stay
Document ID D26 Global Wireless Exposure Metric DefinitionFP7 Contract ndeg318273
Version V4 16Dissemination level PU
synchronized with the network for example) but the exposure induced by the devicein idle mode is negligible as it is based on rare eventsSത୧୬ୡ is the average power density incident on the human body from the base stationsor access points of the RAT The incident power density is assessed not only forusers of mobile devices but also for non-users It is assumed that the usage patternof the user considered in the EI formula does not influence the average incidentpower density From a theoretical point of view Sത୧୬ୡ is the average incident powerdensity integrated over all the frequency bands of the RAT and cell type consideredFrom a practical point of view Sത୧୬ୡ can be assessed directly from spectrum analyzer(SA) measurements dosimeters simulations and indirectly from the received poweron a user device or in a drive test measurementത and Sത୧୬ୡ average out the instantaneous variations of the transmitted power and
incident power density that arise during a communication These variations occurwhen the user is static or moving over a very small distance and are caused bydifferent phenomenas (power regulation small-scale fading resource allocation usertraffic variations etc) Values that will be used in the EI evaluation are averagedvalues over the whole considered geographical area
For both the evaluation of the DL incident power density and UL transmitted powerthe ressource allocation or duty cycle of the system has to be taken into account TheEI computation does not rely on maximum allowed power values (as in existing EMFexposure procedures) but on the incident and transmitted powers that respectivelydepend on the DL network and UL user resource load This definition leads to anestimate of the UL transmitted power that necessarily depend on the type of usertraffic (eg voice web browsing file upload etc) the higher is the instantaneous ULthroughput during the communication the higher is generally the UL transmittedpower
224 Index computation data sources
The EI evaluation relies on the collection of a wide range of data from simulationtools literature models and measurement equipments that will be demonstrated inthe LEXNET technical work-packages All the input data that were collected and areused in the framework of the project will be stored in an internal document
For life segmentation data in particular up-to-date life segmentation surveyscollected in the different participated countries were used to extract information onhow different categories of population segment their daily lifes (see Table 2)[INSEE11] [ALIAGA06]
Populationcategory
Day (8 AM-6 PM) Night (6 PM- 8AM)
Indoor(office-school-home)
Outdoor
Transportation (bus car
subwayetchellip)
Indoor(home)
Outdoor
Transportation (bus car
subwayetchellip)
Adults8h15
(825)1h10
(115)35 min
(6)13h05 min
(935)20 min(25)
35 min(4)
Document ID D26 Global Wireless Exposure Metric DefinitionFP7 Contract ndeg318273
Version V4 17Dissemination level PU
Youngpeople
8h20(83)
1h10(115)
30 min(55)
13h10 min(94)
20 min(25)
30 min(35)
Children8h15
(825)1h30 (15
)
15 min(25)
13h45 min(985)
0 min
(0 )
15 min(15)
Seniors7h35(70)
2h10(275)
15 min(25)
13h05 min(935)
40 min(5)
15 min(15)
Table 2 Life segmentation inputs for evaluation of the Exposure Index
ICT Usage data (usage of mobile phones for voice call or data usage of tabletsPChellip) are obtained through measurements of Key Performance Indicators (KPIs) bysensors inside the network KPIs of interest for evaluating the EI are for each userthe uplink and downlink data traffic volumes the number of voice calls the durationof each voice call etchellip The network operators involved in the LEXNET project ieOrange (France) and Telekom Serbia (Serbia) as well as the operators fromMontenegro being partners of University of Montenegro provided such data
3G denseurban
Voice Data (82 DL 18 UL)
tcom (s) volULdata [kB] volDLdata [kB]
Heavy user
Day 841 4948 25124
Night 689 5879 31922
Medium user
Day 147 464 2390
Night 86 387 2001
Light user
Day 26 35 158
Night 16 28 124
Table 3 shows usage data that could be derived from KPIs obtained throughmeasurements in a 3G network
3G denseurban
Voice Data (82 DL 18 UL)
tcom (s) volULdata [kB] volDLdata [kB]
Heavy user
Day 841 4948 25124
Night 689 5879 31922
Medium user
Day 147 464 2390
Night 86 387 2001
Light user
Day 26 35 158
Document ID D26 Global Wireless Exposure Metric DefinitionFP7 Contract ndeg318273
Version V4 18Dissemination level PU
Night 16 28 124Table 3 Average communication durations and data traffic volumes per user profile for a 3G
dense urban network
Reference SAR data were computed using 3D electromagnetic simulation platformsbased on the Finite Difference Time Domain (FDTD) method [TAFLOVE00] SARvalues were calculated for far-field and near-field exposure for two anatomical humanbody models of the Virtual Family [CHRIST10] Duke a 34-year-old male and Earthaan 8-year-old girl Two postures (standing and sitting) and three usages (mobilephone close to the head mobile phone or tablet for data and laptop usage) wereselected More details on numerical simulations can be found in [LEXNET IR212013]Table 4 shows the matrix of raw whole body averaged ௨௦ܣ
values induced in
an adult for a mobile phone usage the same table exists for other usages and forchild exposure
p=adult u=MOBILES
r=Frequency Band
Usage u400MHz
band (LTE)900MHz band(GSM UMTS
LTE)
1800-1940MHzband
(GSM 3G LTE)
24-26GHz(WiFi LTE)
Sitting Data 00078 00056 00016 73E-04Voice X 0012 00052 00047
Standing Data 0003 00049 319E-04 21E-05Voice X 0012 00052 00053
Table 4 Values of normalized whole-body ܛܗܘܝܚܘۯۺ induced in an adult by near sources
(mobiles laptops tablets) in different postures (all the values are given in Wkg and were
normalized to ] ]
= )
Table 5 shows the matrix of raw whole body averaged ௦ܣ values induced in an
adult by far field sources the same table exists for child exposure
p=adult r=Base station antennas (plane waves)
u=usage 400MHz band(LTE)
900MHz band(GSM UMTS
LTE)
1800-1940MHzband
(GSM UMTSLTE)
26GHz band(LTE)
Sitting 00050 00056 00043 00039Standing 00064 00052 00046 00042
Table 5 Values of normalized whole body ܛܗܘܚܘۯۺ۲ induced in adult by far and intermediate
sources (base stations and access points) (all the values are given in Wkg and were
normalized to RX[W]inc
= 1 Wm-2
)
It is worth pointing out that the aforementioned exposure index EI is defined on thebasis of the whole body averaged SAR But a local EI could be also derived fromlocal or tissue-specific SAR values
Document ID D26 Global Wireless Exposure Metric DefinitionFP7 Contract ndeg318273
Version V4 19Dissemination level PU
Last main data required to evaluate the EI are the average DL power density and ULtransmitted power They can be predicted from wireless network planning tools network monitoring tools or dosimeter The predictions or measurements collect awide range data at different locations within the study area for different periods oftime and possibly for different usages in order to derive relevant average valuesTwo types of dosimeters are designed in LEXNET wearable and fixed dosimeterslsquoIn sitursquo measurements were executed close to the end-user body thanks to thewearable version of the dosimeter Fixed dosimeters are being deployed in a densesensors network of a lsquosmartrsquo city More information on the LEXNET measurementtools is available in [LEXNET D61] and on the related assessment methodologies in[LEXNET D33]
23 Variability and uncertainty
The exposure index is the output of an analytical model expressed by the equation(1) with a number of uncertain input variables To propagate the uncertaintyassociated to the input variables in the model the first step consists in characterizingthe distribution of input variables Each uncertain variable input will be described by astatistical distributionThe uncertainties of the life segmentation data will be analyzed and modelled usingcomputable functions such as Gamma Gaussian or uniform distributionsUncertainties on the time use structure on an average day the usage segmentationand the average durations of usage will be characterizedAverage DL power density and UL transmitted power are estimated using specificconfigurations environments and usages The downlink power absorbed by the userand the uplink power emitted by the device (and so partially absorbed by the user)depend on these configurations environments and usages Their statisticaldistributions have to be characterized in order to be incorporated in the total EIstatistical uncertaintyA sensitivity analysis is ongoing in order to determine the most important parametersin the EI equation and how we could simplify the EI formula We are using Polynomialchaos and copulas for modelling of dependant parameters All the results onvariability and uncertainties will be available at the end of the LEXNET project indeliverable D28
The uplink exposure characterization requires a precise modeling of the poweremitted by the device Usually this exposure will depend on two parameters theposition of the personal device relative to the user body and the variation in spatialdistribution of the antenna gain due to the induced coupling effects The impact of thepositioning of the wireless device has been investigated by varying the position ofpersonal device with respect to the body Results have shown that the whole-bodySAR is not very sensitive to the device positionTo investigate the impact of the antenna gain on the variability of the emitted powerwe have used a statistical model of propagation channel [IST]Two propagation scenarios have been tested line of sight (LOS) and non-line ofsight (NLOS) For both scenarios we considered a lognormal distribution for theemitted power with a coefficient of variation up to 120 in the case of LOS and up to57 in the case of NLOS when studying the case of mobile phone emitting at 900MHz frequency This lognormal distribution characterizes the variability of the power
Document ID D26 Global Wireless Exposure Metric DefinitionFP7 Contract ndeg318273
Version V4 20Dissemination level PU
emitted versus the antenna gain Firstly we are assuming that the communication ismade via a single path namely LOS Assuming that the user can change randomlyits orientation with respect to the receiver antenna (eg base station) the antennagain in the LOS direction will also change depending on the user orientation Tomaintain a same control power (assumed fixed by the base station to ensure asuccessful decoding) the product of the emitted power to the antenna gain in LOSdirection should be a constant namely 1 mW in our analysis In the same spirit wehave analyzed the NLOS scenario by adding secondary paths The characterizationof the power emitted allows estimating the related exposure using the proportionalrelationship Figure 5 presents the cumulative distribution function of the poweremitted by the mobile phone when the average power required by the base stationoutside the small sphere surrounding the transmitter system (user + mobile phone) iskept to 1 mW
Figure 5 Cumulative distribution function (CDF) of the power emitted by the mobile phone (at 900MHz) obtained with both propagation scenarios (LOS and NLOS)
We could notice that the power emitted is very sensitive to the spatial distribution ofthe antenna gain especially in the case of LOS
The downlink exposure is very sensitive to the propagation environment[KALLIOLA02] [KIENTEGA11] Many physical obstacles (such as tunnels andbuildings) between the transmitter and receiver can affect the characteristics of theambient electric field This latter depends on many parameters such as the number ofwave components (due to the reflections and diffractions undergone by the originalwave radio) the fluctuations of the wave amplitude its phases and arrival angles Inthe literature several studies focused on the modeling of the electromagneticenvironment in realistic conditions by giving the statistics distributions of all of theseparameters [KALLIOLA02] [ZHAO02] [WINNER D112 2007] Based on the modelsproposed by these studies we simulated a downlink exposure induced by a realisticpropagation environment Figure 6 shows the variations of the whole body SARinduced by a single plane wave at 900 MHz
Document ID D26 Global Wireless Exposure Metric DefinitionFP7 Contract ndeg318273
Version V4 21Dissemination level PU
Figure 6 Variation of the exposure induced by a single plane wave (LOS) at 900 MHz for differentpolarization (horizontalH verticalV)
Other sources of uncertainties exist as the information on the network wirelessinfrastructure (eg the base station antenna location and orientation) the userequipment performance the Prediction errors (propagation UL power control modeletchellip) some being discussed in [D33 section 231] or measurement discretization(eg with a limited number of fixed dosimeters [D33 section 26])
3 HOW TO USE THE INDEX OF EXPOSURE
The synthetic index which is presented above aims at gathering all contributions tothe population EMF exposure induced by wireless communication networks By itselfbuilding such an index is already a challenging goal but LEXNET goes beyond thedefinition of the EI since it seeks reducing the exposure by exploring innovativetechniques at the lower (mainly PHY level) or upper layers (network level andresource management)
However a general formulation of the EI is given in this document the EI needs to beslightly adapted to the particular characteristics of each technique evaluationscenario The basic idea is that each of the proposed techniques would probablyfocus on a particular parameter and most likely on a single scenario Proposedtechniques could therefore be evaluated by using a partial EI Hence their benefitswould be specific to the characteristics of the selected use case and their impact overthe overall EI would need to be adjusted accordingly A reference scenario detailedbelow has been defined in order for all the proposed reducing solutions to be testedon one unique global scenario
31 Reference scenario
One reference global scenario will be used as a starting point scenario by LEXNETtechnical work-packages (WP 4 5 and 6) to evaluate the EI ldquobeforerdquo implementationof LEXNET exposure-minimization techniques
Document ID D26 Global Wireless Exposure Metric DefinitionFP7 Contract ndeg318273
Version V4 22Dissemination level PU
Parameter Value
Time periods Day Night
Population Adult children
Load profiles Heavy moderate light and non user
Environments Outdoor indoor commuting
RATsCellTypes
Type 2G 3G 4G WiFi
Cell size Variable (mainly depends on theenvironment)
Cell type Macro
User
Usage Voice data
Equipment Smartphone tablet Laptop (dongle)
Posture Standing sitting
The EI will be evaluated for this specific scenario using life segmentation usage andSAR data introduced in the previous chapterThen each partner will be free to test their minimizing solutions on this scenario andto calculate an EI ldquoafterrdquo LEXNETScenarios for each RAT can be simulated separately and percentages of mobiletraffic per RAT can be afterwards used as input for the EI (see Figure 7) It can beenvisaged that modifying these percentages could be one network managementsolution for reducing the EI assuming in a first approximation that the traffic per RAThas no strong influence on the RAT exposure metrics which is not completely right
Figure 7 Connections by RAT [CISCO13]
Document ID D26 Global Wireless Exposure Metric DefinitionFP7 Contract ndeg318273
Version V4 23Dissemination level PU
32 Reducing the EMF exposure using the EI
321 Lower layer solutions a common methodology to use the EI
The EI is a relevant global metric for evaluation of radio technologies performances interm of exposure reduction However WP4 has identified some difficulties to directlyaddress the global calculation To reach this global evaluation target WP4 hasadopted a specific and indirect methodology described in [LEXNET D42 2014]deliverable and synthesised in the following Despite a large diversity of technicaldomains whatever the scenario or the Radio Access Technologies (RAT) a singlestrategy to organize and align the different WP4 exposure evaluations is proposed Afive steps methodology has been established in order to evaluate and harmonize theoverall exposure improvement for each technology These steps also attempt toprovide the basis for future global exposure reduction evaluation in order todetermine the most promising WP4 techniques based on fair and relevantcomparisons
The first step is to identify how the individual WP4 techniques contribute towards theoverall LEXNET use case scenarios from WP2 Specifically for WP4 evaluations foursub-scenarios have been introduced (Macro-Cell Small-Cell Rural and WSN ampWiFi) (Step-1a) This sub-scenario categorization highlights which solutions arecomplementary and which will require further analysis to determine potential conflictsIn order to harmonize the evaluations from the studies of different solutions it iscrucial to describe properly and extensively each assumption and the inputparameters values related to the context study (Step-1b)
A limited numbers of Key Performances Indicators (KPI) for the exposure and for theQoS are used in the evaluation of each WP4 technique The step-2 has to clearlyidentify the KPIs being addressed by individual technique exploration It is taken asmore convenient to work with one of the following three simpler metrics or KPIsderived from the EI formula and addressing UL exposure
The first metric is the Specific Absorption Rate (SAR l mTx ) which describes the
amount of EM energy absorbed into the userrsquos body via the spatial distributionof the EM field from the source Thus SAR is particularly relevant for antennasolutions
The second metric is the mean duration of exposure (UL
kjit ) which indicatesthe amount of time the user is exposed It impacts the EI which is defined as adose For example the duration is impacted by the amount of transmitted dataReduced retransmission improved interference management and signalingreduction strategies are all ways of decreasing this metric The duration usedto calculate the mean is selected regarding the time constant of the studiedtechnique
The third metric is the mean transmitted power ( TxP ) during the considered
mean exposure duration As an example a 1 dB improvement on the receivingsensitivity at the Base Station (BS) could be converted in a 1 dB reduction ofthe transmit power at the User Equipment (UE) Again the duration used tocalculate the mean is selected regarding the time constant of the studiedtechnique
Document ID D26 Global Wireless Exposure Metric DefinitionFP7 Contract ndeg318273
Version V4 24Dissemination level PU
Notice that an equivalent set of three metrics adresses the DL
The step-3 concerns the evaluation itself of a partial EI ratio in comparison with abaseline scenario that is to say without implementing the studied solution Theexposure reduction is evaluated through the calculation of an EI ratio by comparingthe lsquoafter LEXNETrsquo versus the lsquobefore LEXNETrsquo (ie SotA or standard) baselineconfigurations (Eq 4) The main advantage of the proposed approach is that in mostof the presented solutions the three KPIs are independent from each other Byconsidering a given sub-scenario and depending whether the UL or the DL is studiedthis means that if a solution succeeds in decreasing the selected single KPI the twoothers will stay constant when the solution is implemented or not Thus in thatspecific sub-scenario the EI ratio is equal to the selected KPI ratio (Eq 5) Thisexposure metric is easily matched with a typical RF front-end or PHY layer evaluationstudies
(4)
This formula is simplified when a specific sub-scenario is considered
(5)
Where
partialEI is the Exposure Index for a specific sub-scenario
partialKPI is the identified metric among the three detailed in step 2
the subscript lsquow LEXrsquo correspond to the Lexnet solution implementationthe subscript lsquowo LEXrsquo correspond to the SotA or baseline (without the solutionimplementation)
Meanwhile the selected QoS metric is also evaluated with and without LEXNETsolution
The step-4 aims to ensure that capacity or QoS improvements are converted intoexposure reduction It is worth reminding that the objective of LEXNET studies is toreduce exposure without impacting QoS
At last the step-5 estimates the absolute global EI reduction from the previous stepsrsquopartial EI results throught the 24 hours LEXNET reference scenario The so-calleddilution factor [LEXNET D41 2013] is taken into account during this step-5 Theusage statistics from WP2 are used to weight the calculated partial EI reduction inorder to assess the global EI reduction for a given solution
To conclude a scheme summarizes the WP4 common EI evaluation methodology inFigure 8 This process is sufficiently generic to be applied by any of the WP4proposed solutions and examples of its step by step application can be found in[LEXNET D42 2014]
100LEXwoEI
LEXwoEI-LEXwEI()Ratio
partial
partialpartial
EI
100LEXwoKPI
LEXwoKPI-LEXwKPI()Ratio
partial
partialpartial
EI
Document ID D26 Global Wireless Exposure Metric DefinitionFP7 Contract ndeg318273
Version V4 25Dissemination level PU
Figure 8 Common EI evaluation methodology for WP4 techniques
322 Upper layer and resource management techniques
By introducing and promoting the EI as a new planning metric LEXNET intendsamong other objectives to help reduce local town planning objections to applicationsfor installing new base stations Work carried out by LEXNET WP5 so far hasdemonstrated that real-time EMF-aware network management strategies depend oncurrent traffic load radio conditions mobility application used and the duration ofuse available networks and UE capabilities Since EI calculations take into accountlong-term network statistics distributions of user profiles and habits (services usedetc) times of day period of year etc EI itself may therefore be better suited for initialnetwork design and AP placement while other metrics may be better suited for real-
Document ID D26 Global Wireless Exposure Metric DefinitionFP7 Contract ndeg318273
Version V4 26Dissemination level PU
time EMF management Clearly a link between these proxy-metrics and long-term EIvalues is needed The underlying assumption is that if we try to reduce the level ofEMF by applying correct general policies and additionally control it on a smaller time-scale (eg seconds or minutes) with fast-loop control then the overall exposure andthe EI (defined on daily level) will decreaseFast-loop (event-based) EMF control would be a response to a temporary change ofconditions This kind of control requires triggers ie thresholds that can be assessedon near-real-time scale ndash this time scale may not be as granular as for power controlFor fast-loop control offload techniques may be used as for general strategy butalso other strategies such as changing codecs delaying transmission etc Fast-loopcontrol without using triggers would be periodic optimization on a smaller time-scaleProxy metrics to be used for fast-loop control involve data that may be collected fromthe network and include
bull Measurements (UL Tx power RSSI RSCPhellip)
bull User context velocity services used profile
bull Statistics cell statistics (traffic load) etc
Some preliminary results using various proxy metrics which illustrate the pointsabove are shown hereFigure 9 shows live network measurements illustrating that available cellulartechnologies and current traffic conditions are two of the main points to be taken intoaccount when designing low-EMF solutions The metric used here is the UL Txpower The same metric is used in Figure 10 and Figure 11 which show that the typeof service could increase the exposure (based on UL Tx power) meaning thatdifferent strategies should be used to identify the best connectivity according to theservice flow requested The actual UL Tx power values can then be used in EIcalculations
Figure 9 Comparison of different 2G3G cells in high load hours by UE Tx power
Document ID D26 Global Wireless Exposure Metric DefinitionFP7 Contract ndeg318273
Version V4 27Dissemination level PU
Figure 10 Comparison of UL FTP and voice services over 2G3G cells in high load hours by UE Txpower
Figure 11 Comparison of voice service over 3G and voice service using Skype over 3G network
Another common proxy with direct link to EI is the DL power density Figure 12 showshow DL power density and UL transmit power vary for different ISD values in an LTEnetwork Based on these simulations it can be seen that small-cell densification inurban areas allows for significant exposure reduction which now needs to betranslated into the EI using various assumptions on user distributions and type ofusage
Document ID D26 Global Wireless Exposure Metric DefinitionFP7 Contract ndeg318273
Version V4 28Dissemination level PU
Figure 12 DL power density and UL transmit power for different ISD values
Whole-body SAR is another proxy metric whose statistical processing can leaddirectly to EI calculations As an example of SAR values obtained by a tooldeveloped for the prediction of whole-body and localized SARs and absorbed dosesfor indoor wireless network deployments in Figure 13 we show distributions for thetraditional deployment (top) and for the WP5 exposure-optimized deployment
Figure 13 Whole-body SAR_DL (distribution for the traditional deployment (top) and for the exposure-optimized deployment (bottom)
Document ID D26 Global Wireless Exposure Metric DefinitionFP7 Contract ndeg318273
Version V4 29Dissemination level PU
4 EXAMPLES OF APPLICATION
41 Computing chain
In this section three simplified examples of EI computation are detailed In no casethese examples are representing the completeness of the possibilities that can becover by the EI but they illustrate the process of computation
The first two examples illustrate the use of network planning tools in the evaluation ofthe EIThe first example detailed in the section 42 consists in comparing two indoor officescenarios first with wireless communication offered by only 3G outdoor macro basestations scenario and secondly with an additional 3G femtocell (Table 6)
Scenario 1
Time PopulationUser
ProfileEnvironment RAT Cell Type Posture Usage
1h inthe
afternoon
Adults Heavy Indoor 3G Macro Standing Voice mobile
Medium Datamobile
Light Data Tablet
Nonuser
Data Laptop
Scenario 2
Time PopulationUser
ProfileEnvironment RAT Cell Type Posture Usage
1h inthe
afternoon
Adults Heavy Indoor 3G Femto Standing Voice mobile
Medium Datamobile
Light Data Tablet
Nonuser
Data Laptop
Table 6 input variables for the 3G indoor sub-scenarios described in section 42
The second example detailed in section 43 is considering a data LTE macro urbanscenario (Table 7)
Time PopulationUser
ProfileEnvironment RAT Cell Type Posture Usage
Day Youngpeople
Moderate Indoor 4G Macro Standing Data mobile
Document ID D26 Global Wireless Exposure Metric DefinitionFP7 Contract ndeg318273
Version V4 30Dissemination level PU
Night Adults Non user Outdoor Sitting Data mobile
Seniors Data Tablet
Table 7 input variables for the LTE scenario described in section 43
The last example detailed in section 44 illustrates the use of dosimetermeasurements in the EI evaluation It is considering a macro outdoor LTE scenariowhere one user is wearing a dosimeter
42 Indoor exposure from 3G macro and femto-cells
The EI was evaluated for two scenarios considering the exposure of people locatedindoor The population consisted of adults making UMTS (phone calls with thephone on the right side of the head The scenario 1 is considering a macrocellconnection and the scenario 2 an indoor small cell connection Different user profilesare considered
10 heavy users 30 s usage 50 moderate users 10 s usage 25 light users 3 s usage 15 no usage 0 s usage
For the calculation of the EI several input parameters are needed reference SARvalues averaged transmitted power valuesത and averaged incident power densityvalues inc (see Table 8)The power (density) values that were used for the indoor macrocell scenario arederived from measurements in an office building (Zuiderpoort building GhentBelgium) [PLETS14] Figure 14 shows the considered buildingFor the indoor femtocell scenario accurate power (density) values from the WHIPPtool a heuristic indoor network calculator and planner [PLETS12] were used In theconsidered building a femtocell with an Equivalent Isotropically Radiated Power(EIRP) of 7 dBm is installed A different femtocell EIRP can lead to a largely differentEI Reference SAR values were taken from [LAUER13] and applied to the scenariosfor an adult standing using the phone on the right side of the head Since the
measured macrocell values (RXinc and Pഥଡ଼) were not recorded in the smaller andmore enclosed central areas of the building floor (toilets kitchen shedhellip) femtocellpredictions were limited to the non-shaded areas around the center in Figure 14 Forthe femtocell values locations within 50 cm of the base station are discardedassuming that people stay at least half a meter away from base stations For thesimulations a sub-scenario is also considered for which a 20 dB worse macrocellconnection is assumed for the same building floor This could correspond to abuilding with a penetration loss that is 20 dB higher than before or a building which islocated further from the macrocell base station (path loss increase of 20 dB) Table 8
shows that the assumed Pഥଡ଼ RXinc values in case of a lsquoworse connectionrsquo areindeed 20 dB higher lower
Document ID D26 Global Wireless Exposure Metric DefinitionFP7 Contract ndeg318273
Version V4 31Dissemination level PU
Figure 14 Ground plan of the considered floor (90 m x 17 m) of the office building that is simulatedFemtocell base station location is indicated with purple hexagon
Scenario 1Macro indoor
Scenario 2Femto indoor
௨ܣ 0003 Wkg 0003 Wkg
௨ܣ 000495 Wkg 000495 Wkg
ത 26610-5 W 28510-7 W
ത(worse connection) 26610-3 W 28510-7 W
RXinc81510-8 Wmsup2 51810-6 Wmsup2
RXinc(worse connection) 81510-10 Wmsup2 51810-6 Wmsup2
Table 8 Reference SAR values and average transmitted power and observed power densityvalues
In the following the results for the different indoor scenarios are discussedFigure 15 (a) compares the EI for scenarios 1 and 2 for the indoor office buildingFrom an exposure-point-of-view the indoor femtocell scenario (scenario 2 EI =158E-8 Wkg) is a factor 28 worse than the indoor macrocell scenario (scenario 1 EI= 564E-10 Wkg) The main EI contribution in scenario 2 is the high DL exposureoriginating from the femtocell (155E-8 Wkg) The scale in Figure 15 (a) has beenadjusted the bar that represents the DL femto indoor contribution is in reality 44times the length of the Y-scaleThere are several reasons why the installation of a femtocell is not beneficial in thiscaseA first reason is that the EI contributions of the macrocell are almost equal for UL andDL which is optimalA second reason is that the femtocell EIRP is chosen quite high (7 dBm) despite thegood macrocell connection (average value of -6925 dBm) still 77 of the DL fieldsare higher in the femtocell caseA third reason is that a femtocell installation has the disadvantage that observedpower densities on a building floor due to a femtocell base station are lesshomogeneously distributed than fields due to a (more distant) macrocell base stationAs people are assumed to ndash on average- reside an equal time at each location on thebuilding floor (except shaded areas and locations closer than 50 cm from the BS)locations close to the femtocell contribute a lot to the EI When people approach afemtocell the absorbed exposure dose increases in a more-than-linear wayMacrocell base stations have the advantage that ULDL fields are morehomogeneously distributed over the building floor It should also be noted that thehigher the UL usage the more the femtocell scenario will benefit compared to themacrocell scenario (lower EI) However in the considered case the UL usage timeswould have to increase by a factor 48 to yield a total EI (macrocell scenario 1) that isequal to the EI of scenario 2 (femtocell scenario EI = 158E-8 Wkg)
Document ID D26 Global Wireless Exposure Metric DefinitionFP7 Contract ndeg318273
Version V4 32Dissemination level PU
We also studied a second case where a less favourable macrocell case isconsidered (lsquoworse connectionrdquo) It is assumed that the connection with the macrocellbase station is now 20 dB worse than in the previous case Figure 15 (b) comparesthe EI for the macrocell and femtocell deployments Due to the worse connection(average received macrocell DL power of -8925 dBm) the macrocell EI is nowcompletely determined by the UL contribution (320E-8 Wkg) and the femtocellscenario (scenario 2 EI = 155E-8 Wkg) has an EI that is 48 of the macrocell EIwhich makes it preferable over the macrocell deployment Moreover the observedpower densities due to the femtocell are higher than the macrocell power densities atall locations (better QoS)It can be concluded that the installation of femtocell is not always recommended forshorter UL usage times andor better macrocell connection qualities it could beadvised to rely on the existing macrocell infrastructure Also when installing afemtocell its EIRP should be adjusted to the size and physical properties of thebuilding and should not be set at a needlessly high value
(a) (b)Figure 15 Comparison of the contributions to the whole-body EI for (a) indoor scenarios 1 and 2 in theconsidered building (b) indoor scenarios 1 and 2 in this building with 20 dB worse connection qualityTotal EI levels for each scenario are indicated with the horizontal line EI values are shown in Wkg
43 Data LTE macro urban scenario
431 Input variables linked to the network
The EI is evaluated from a macro-cellular LTE network in a real geographical area ndashpart of the 7th district of Paris (see Figure 16) The proposed scenario was previouslydefined in frame of the French ANR project ECOSCells [BCL12] and the EuropeanFP7 project FREEDOM (httpwwwict-freedomeu) for the simulation and analysis ofheterogeneous network topologies (hetNet) It is based on a real environment usingHigh Resolution (HR) map data realistic BSUE deployments and deterministicpropagation models
The macro layout is organized as three rings around a central three-sector sitemacro base stations being deployed with an inter-site distance of about 450 m in ahexagonal manner as shown in Figure 16
Document ID D26 Global Wireless Exposure Metric DefinitionFP7 Contract ndeg318273
Version V4 33Dissemination level PU
Figure 16 View of the macro-cell hexagonal deployment in the area
The study area (ie area where network performance is evaluated) is limited to thesurface covered by the three co-located central macro-cells and the first ring (Figure17) Thus the study area is equivalent to 12 macro-cells The base stations outsidethis study area are included in simulations to generate an accurate interferencepattern
Figure 17 Study area composed of 12 macro sites localised in the 7th
district of Paris France
Document ID D26 Global Wireless Exposure Metric DefinitionFP7 Contract ndeg318273
Version V4 34Dissemination level PU
The positions and heights of the base stations have been selected in realisticapproach sites are placed on slightly dominant rooftops and sector antennas aredistributed at the rooftop edges Directive antennas are used (with 3GPP radiationpattern) Each site is composed of three sectors oriented in azimuth directions 0deg120deg and 240deg with down-tilt 6degUsers are assumed to be uniformly distributed in the study area an indoor ratio setsthe percentage of users located inside buildings at the ground floorThe specifications of input parameters are summed up in Table 9
Environment Typical European Dense Urban environment (Paris VII district France)
System
Downlink (DL) and Uplink (UL)
LTE FDD 2 x 10 MHz
Central frequency 2600 MHz
Macro layout
Hexagonal sitedeployment
37 sites corresponding to 83 macro cellsincluding 12 sites in the center of the studyarea Inter-site distance (ISD) of 450 m
Nominal transmitpowerEPRE
40 W 228 dBm
AntennaDirectional with 14 dBi gain 6deg electric down-tilt 2 antennassector Average antennaheight 30 m above ground
Noise figure 25 dB
UL power control (openloop)
Path loss compensation factor 1SINR target 208 dB
UserEquipment
MaxMin transmit power 23 dBm -40 dBm
AntennaOmni-directional with 0 dBi gain 2antennasuser device Antenna height 15 mabove ground
Noise figure 9 dB
User traffic
Average active userdensity
Depends on daynight
DistributionUniform spatial distribution within thesimulation area Single floor (at 15 m height)No user mobility
Table 9 Inputs in SIRADEL simulator
432 Input variables linked to the population
Category of population
The population density of the 7th District of Paris was estimated at 14 36050
inhabitants per kmsup2 in 2009 [Carte09]
We are considering the population above 15 years old
Given the population distribution by age (Figure 18) it was decided to divide the adult
population into 3 categories young people (between 15 and 29 years) adults
Document ID D26 Global Wireless Exposure Metric DefinitionFP7 Contract ndeg318273
Version V4 35Dissemination level PU
(between 30 and 59 years) and seniors (over 60 years) Table 10 shows the
percentages of people in each category
Figure 18 Population distribution by age in Paris 7th district in 2007
Population category Pourcentage(prop)
Adults (30-59 yo) 45
Young people (15-29 yo) 26
Seniors (+60 yo) 29
Table 10 Number of people in each population category
Time periods
A 24-hour day is divided into two periods the day from 8 am to 6 pm (10 hours in
total) and the night from 6 pm to 8 am (14 hours in total)
Environment
Time spent indoor or outdoor on an average day for each category is extracted from
Table 2
Usage
Only data traffic is considered The device is assumed to be a mobile phone whilethe user is in a standing posture Considering the existence of 4 telecom operators inFrance only 25 of the 7th district population is assumed to be using this LTE macronetwork In this example we consider two user profiles moderate user and non-userFor each population category we derived from [Bigot et al 2013] the proportions ofusers and non-users of mobile phones for data traffic (see Table 11)
User profileYoung people (15-29
yo)Adults (30-59 yo) Seniors (over 60 yo)
non-users 33 57 91
Document ID D26 Global Wireless Exposure Metric DefinitionFP7 Contract ndeg318273
Version V4 36Dissemination level PU
users 67 43 9Table 11 Repartition of users and non-users for each population category
For simplicity the parameters for the moderate user profile are applied to all userswe assume a daily data traffic per active user of 66 MB [CISCO13] a DLUL ratio of9010 (this ratio was evaluated from data collected through measurements ofKPIs by sensors inside the French Orange network) and a daynight ratio of4357 From [CISCO13] only 29 of connections in 2013 were on 4GReference SAR values were extracted from Table 4 and Table 5
433 Transmitted power ഥ and received power density ത calculationܖ
Incident ோpower densities and transmittedത powers were calculated by usingthe network planner simulation tool Volcano Suite (Siradel France)Figure 19 andFigure 20 illustrate respectively the average UE Tx power calculated over the 7thParis district during the day and the average incident power density evaluated duringthe day or the night (values during the day or the night time were quasi identical)
Figure 19 Map of the average UL Tx power (dBm) calculated indoor at ground floor and outdoorduring the day (on the left) and map of daily average transmission duration (s) (on the right)
Figure 20 Map of the average DL incident power density (dBμVm) calculated indoor at ground floor and outdoor during the day or the night
Because the average active LTE user density is very low (41 userskm2consequence of the 29 LTE connections assumption) the DL user traffic utilises
Document ID D26 Global Wireless Exposure Metric DefinitionFP7 Contract ndeg318273
Version V4 37Dissemination level PU
less than 1 of available resources which strongly impact the predicted DL incidentpower density We can see in Figure 19 (left figure) that the calculated average Txpower is minimum in outdoor areas in the vicinity of the base stations or in Line ofSight (LOS) while it is at a maximum indoors and outdoors far away from the basestations The right map in Figure 19 gives the average communication durationwhich directly impacts the calculation of the UL exposure contribution The better thelink performance is the higher the throughput and thus the longer thecommunication duration That is why the longest durations are observed indoors andparticularly in the building parts that suffer from the strongest propagation lossesFigure 20 shows that the strongest DL incident power density levels are predicted inLOS areas while much lower levels are observed inside the buildings where mostpopulation is located
434 Exposure index calculation
Aggregating everything we obtain the following value for the EI (based on the Whole-body SAR) of the over 15 years old population of the 7th district of Paris consideringa macrocell LTE network EIWBSAR = 31910 -7 Wkg
44 Using dosimeters for the EI evaluation
This section provides an evaluation of the downlink and uplink exposure indexes fora subject wearing a reference isotropic dosimeter on the head together with fivedosimeters at different locations of the body as well as two mobile terminals Thesubject is moving in a multipath environment including a 3-sector LTE base station
When modelling the radio link between the user devices and the base station oneconsiders the influence of the body (ie body coupling [MaOC12] and bodymovements (using realistic body motion capture tools [MaCo13]) and accounts forthe propagation environment using a geometrically based statistical channel (GBSC)model (ie multipath propagation) Therefore the modelling of the radio channel hasbeen separated into several steps as described in [Mack13] Figure 21
Document ID D26 Global Wireless Exposure Metric DefinitionFP7 Contract ndeg318273
Version V4 38Dissemination level PU
Figure 21 Model for EMF assessment from dosimeter data
The simulated scenario Figure 22 considers a reference isotropic dosimeter on thehead of the user (simulating the real body exposure) together with five wearabledosimeters These dosimeters allow the downlink exposure assessment The user isalso carrying two mobile terminals allowing to assess the uplink exposure
Figure 22 Placement of wearable dosimeters and mobile terminals on the body
For the downlink the received (Rx) power ோ௫ at the mobile terminal (ordosimeter) is calculated from
ோ௫[ౚ ]= ௌ[ౚ ]
minus ௧௧[ౚ]ܮ (6)
where ௌ base station (BS) transmitted (Tx) power ௧௧ܮ total path loss including gains of mobile terminal (or
dosimeter) and BS
The received power density ோ௫ at the mobile terminal (or dosimeter) iscalculated from
ோ௫ ୫ మ൧=
ோ௫[ ]
ܣ మ൧
(7)
where ܣ is the mobile terminal antenna effective area
ܣ ୫ మ൧=ଶ[ߣ ]
ߨ4ோ௫[ౚഠ]ܩതതതതതതതതത (8)
where wavelength ோ௫തതതതതܩ average gain of the receiving antenna (ie dosimeter probe) in
off body direction (eg half-hemisphere of the gain pattern ieߠ isin [minus9090]deg and isin [minus9090]deg)
ோ௫[ౚഠ]ܩതതതതതതതതത=
1
ఏఝ ோ௫[ౚ]ܩ
ߠ) )
ேക
ୀଵ
ேഇ
ୀଵ
(9)
where ఏ and number of elevation (ߠ) and azimuth () directions
The exposure index for the DL ܫܧ can be determined from [LEXNET D24 2013]
Document ID D26 Global Wireless Exposure Metric DefinitionFP7 Contract ndeg318273
Version V4 39Dissemination level PU
[୩]ܫܧ = ௪ܣ
|ଵ ୫ మ[୫ మ୩]
times ோ௫[ ୫ మ]times [ୱ]ݐ (10)
where ௪ܣ
|ଵ ୫ మ normalised whole body averaged SAR coefficient per
1 Wm2 of Rx power density as indicated in [LEXNET D24 2013] ݐ time of the exposure from BS
ோ௫ average Rx power density during period ݐ
For the uplink the required Tx power from the mobile terminal is determined from ௫[୫ ]
= ௌ[୫ ]+ ܫ ௧௧[]
+ ܯ [] + ௧௧[]ܮ (11)
where ௌ noise and interference level at the BS ܫ ௧௧ target SINR at the BS
ܯ fading margin for a dynamic usage ௧௧ܮ total path loss including gain of MT and BS
ௌ is calculated asௌ[୫ ]
= minus174[୫ ] + 10logଵ(ܤ[ୌ]) + ி[]+ []ܫ (12)
where ܤ bandwidth ி noise figure ܫ interference
The EI for the UL ܫܧ can be determined from [LEXNET D24 2013]
[୩]ܫܧ = ௪ܣ
|ଵ [ଵ୩]times ௫[ ]
times [ୱ]ݐ (13)
where ௪ܣ
|ଵ whole body averaged SAR coefficient per 1 W of Tx poweras indicated in [LEXNET D24 2013]
ݐ time of the exposure ( duration of the mobile terminal usage)
௫ average Tx power during period ݐ
A macro cell outdoor street scenario has been considered including a set of 10clusters of 3 scatterers each with a Uniform Distribution in the half space of anellipsoid A 3-sector base station antenna is located in the middle of the street atx=100 m The user is moving on a straight line in the middle of the street (ie y=10m xisin[50 150] m) Figure 23
Document ID D26 Global Wireless Exposure Metric DefinitionFP7 Contract ndeg318273
Version V4 40Dissemination level PU
Figure 23 Scenario
The parameters of the scenario are presented in Table 12 being worthwhile to noticethat the values of ௪ܣ
and ௪ܣ are taken from preliminary SAR simulations The
calculated noise and interference level at the BS is ௌ= -12774 dBm
System
Frequency [MHz] 2600
[HoTo11]ܤ
Resource Block [kHz] 15
Full [MHz] 20
Full LTE-A [MHz] 100
Downlink
EIRP BS Tx power [dBm] 46 [LEXNET D23 2013]
ோ௫ܩ [dBi] 122 [LEXNET D32 2014]
ݓܣ|ܮܦ
1Wm2[m2kg] 300
Uplink
ܫ ௧௧[dB] 208 [HoTo11]
ி [dB] 25 [LEXNET D23 2013]
[dB]ܫ 8 [HoTo11]
ܯ [dB] 30 [Mack13]
ݓܣ|ܮ
1W[1kg] 495
Table 12 Scenario overview
Figure 24 illustrates the considered macro cell base station antenna and thedosimeter realised gain patterns
(a) BS with 3 sectors (b) Dosimeter on the bodyFigure 24 Realised gain pattern
Document ID D26 Global Wireless Exposure Metric DefinitionFP7 Contract ndeg318273
Version V4 41Dissemination level PU
441 EI for downlink
The average Rx power density obtained from the isotropic reference probe and thedosimeter located at WA_L and WA_R is presented in Figure 25 The received powerdensity at WA_L dosimeter is very similar to the one gathered at the isotropic probewhich mainly comes from the similar Line-Of-Sight (LOS) propagation conditions Thepower received in WA_R dosimeter is much lower due to the body shadowing
Figure 25 Rx power density at selected positions
The distribution of the Rx power density is presented in Figure 26 In spite of thebody shadowing the distribution of the Rx power density at the WA_R dosimeter ismuch similar to the ones for the reference and the WA_L dosimeters All of themfollow an exponential decay which should be subject to further investigation
(a) isotropic (b) WA_L (c) WA_R
Figure 26 Rx power density histograms
The received power density and the downlink exposure index calculated based onthe measurement of the dosimeters located in the various locations on the body arepresented in Table 13
ோ௫ [mWm2] ܫܧ [mJkg]
isotropic 35868 2690
WA_F 18357 1377
WA_B 29538 2215
Document ID D26 Global Wireless Exposure Metric DefinitionFP7 Contract ndeg318273
Version V4 42Dissemination level PU
WA_L 28516 2138
WA_R 9060 680
TO_F 18436 1383
Table 13 Downlink Exposure
The WA_L dosimeter and the isotropic probe exposure indexes are very similarbecause of the LOS propagation conditions The same is valid for the WA_Bdosimeter which is also in LOS with the base station For the other dosimeters theexposure index is naturally lower due to the body shadowing In this scenario theuse of a wearable dosimeter in the front or in the right side of the body displays anexposure index reading about 4 times lower than the real user exposure
442 EI for uplink
The average Tx power from the mobile phone hold near HE_L and HE_R ispresented in Figure 27 The uplink power control is clearly noticeable by the highertransmitted power in HE_R as the mobile terminal adjusts the Tx power tocompensate for the higher channel fading
Figure 27 Tx power for straight6min scenario at 2600 MHz for LTE-A
The distribution of the Tx power at HE_L and HE_R is presented in Figure 28 Inspite of the different intensities HE_L and HE_R Tx powers present a similardistribution
Document ID D26 Global Wireless Exposure Metric DefinitionFP7 Contract ndeg318273
Version V4 43Dissemination level PU
(a) HE_L (b) HE_R
Figure 28 Tx power histograms
The average transmitted power and the uplink exposure index from the mobileterminals located near left and right side of the head ( e HE_L and HE_R) arepresented in Table 14
௫ [mW] ܫܧ [mJkg]
RB FULL FULL_A RB FULL FULL_A
HE_L mobile 002 165 827 003 295 1474
HE_R mobile 008 838 4191 014 1493 7468
Table 14 Uplink Exposure
These results show the importance of the propagation conditions in the EMFexposure Due to the non LOS conditions the exposure index in the right side of thehead is 5 times higher than the one on the left side
5 CONCLUSION
In this deliverable a global metric is defined to test and optimize wirelesstelecommunication networks in terms of EMF exposureThe proposed metric called Exposure Index (EI) has the advantage to overpass thelimitations of the actual metrics that in fact are managing separately the exposureinduced by personal devices and the one induced by the network equipment (basestations and access points) But devices base station antennas and access pointsare definitely parts of the same wireless environment and the global wirelessexposure is induced by all of them
The EI is described with an analytical model with input variables describing thecoverage area of interest the accessible networks the population and the habits interms of location and of wireless devices usage The output is the EI covering theday-to-day averaged exposure of population in a given area incurred by an entirewireless network from base stations and access points to individual devices
In this deliverable the analytical model of EI has been detailed and the inputvariables defined Then the use of the EI to minimize the EMF exposure in wirelesscommunication networks is presented in connection with work-package 4 dedicated
Document ID D26 Global Wireless Exposure Metric DefinitionFP7 Contract ndeg318273
Version V4 44Dissemination level PU
to innovative radio components and work-package 5 focused on networks topologiesand technologies
The way to process a complete calculation of EI is illustrated on three deterministicexamples The first example considers comparison of indoor 3G macro and femtoscenarios The second example is taking into account an adult population in a LTEmacro urban environment with their data usage specifications Both examples arebased on a real environment representation and network simulation tools have beenused to simulate the up and down links The third example illustrates how dosimetermeasurements can be used to assess the EI
In our further work the statistical description of input variables will enable topropagate the variability and the uncertainty in the EI model making it more accurateand reliable Results will be made available in the future deliverable D28 DeliverableD33 will detail the used methodology to assess the EI and for the last year of theproject the work of partners involved in WP6 will be enhanced as they will be incharge of the implementation and evaluation of the EI
Document ID D26 Global Wireless Exposure Metric DefinitionFP7 Contract ndeg318273
Version V4 45Dissemination level PU
6 REFERENCES
[ALIAGA06] Aliaga C How is the time of women and men distributed
in Europe Statistics in focus population and social
conditions April 2006
[APVJM13] Aerts S Plets D Verloock L Joseph W and MartensL Assessment and comparison of RF-EMF exposure infemtocell and macrocell scenarios Radiat Protec Dosim2013
[BCL12] Brau M Corre Y Lostanlen Y Assessment of 3D
network coverage performance from dense small-cell LTE
Communications (ICC) 2012 IEEE International
Conference on
[Carte09] httpwwwcartesfrancefr
[CISCO13] Cisco Visual Networking Index Global Mobile Data Traffic
Forecast Update 2012-2017 February 2013
[CHLWW08] ConilE Hadjem A Lacroux F Wong M F and Wiart J
Variability analysis of SAR from 20 MHz to 24 GHz for
different adult and child models using finite-difference
time-domain Phys Med Biol vol 53 pp 1511-1525
2008
[CHRIST10] Christ A Kainz W Hahn E G Honegger K Zefferer
M Neufeld E Rascher W Janka R Bautz W Chen
J Kiefer B Schmitt P Hollenbach H-P Shen J
Oberle M Szczerba D Kam A Guag J W amp Kuster
N The Virtual Family--development of surface-based
anatomical models of two adults and two children for
dosimetric simulations Phys Med Biol vol 55 pp 23-38
2010
[CMKB06] Cooper TG Mann SM Khalid M and Blackwell RP
Public exposure to radio waves near GSM microcell and
picocell base stations Journal of the Society for
Radiological Protection Vol 26 No 2 pp 199-211 June
2006
[GCWW10] Gati A Conil E Wong MF Wiart J Duality between
uplink local and downlink whole body exposures in
operating Networks IEEE Transactions on EMC Vol 52
ndeg4 Nov 2010
Document ID D26 Global Wireless Exposure Metric DefinitionFP7 Contract ndeg318273
Version V4 46Dissemination level PU
[HoTo11] Hola HG And Toskala A LTE for UMTS Evolution to
LTE-Advanced Wiley UK 2011
[INFORMA12] Informa telecom amp Media Small Cell Market Update June
2012
[INSEE11] Insee enquecircte Emploi du temps 2009-2010 Insee
Premiere Ndeg 1377 November 2011
[IST] httpwwwist-winnerorg
[KALLIOLA02] Kalliola K Sulonen K Laitinen H Kiveks O Krogerus J
Vainikainen P Angular power distribution and mean
effective gain of mobile antenna in different propagation
environments IEEE Trans Veh Technol vol 51 pp 823ndash
838 2002
[KIENTEGA11] Thierry Kientega EConil A Gati A Hadjem ERichalot M-F Wong OPicon Joe Wiart Analysis of thedistribution of specific absorption rate induced by fiveplane waves with a fast and new method in VisibleHuman URSI conference 2011
[LAUER13] Lauer O Frei P Gosselin M C Joseph W Roumloumlsli M
and Froumlhlich J Combining near- and far-field exposure for
an organ-specific and whole-body RF-EMF proxy for
epidemiological research a reference case
Bioelectromagnetics vol 34(5) pp 366-74 2013
[LEXNET D21 2013] Vermeeren G Thielens A Aerts S Joseph W
Martens L Oliveira C Mackowiak M Correia LM
Pejanovic-Djurisic M Veljovic Z Nešković A
Koprivica M Gati A Varsier N Hadjem A Wiart J
ConilE ldquoD21 Current metrics for EMF exposure
evaluationrdquo LEXNET project April 2013
[LEXNET D22 2013] Wiedemann P M Freudenstein F ldquoD22 Risk and
exposure perceptionrdquo LEXNET project July 2013
[LEXNET D23 2013] Vermeeren G Plets D Joseph W Martens L Conil E
Varsier N Wiart J Corre Y Oliveira C Sebastiatildeo D
Correia LM Aguumlero R Diez L Rodriacuteguez L Koprivica
M Nešković A Popović M Milinković J Nikšić S ldquoD23
Scenariosrdquo LEXNET project November 2013
[LEXNET D24 2013] Conil E ldquoD24 Global Wireless Exposure Metric
Definitionrdquo LEXNET project October 2013
Document ID D26 Global Wireless Exposure Metric DefinitionFP7 Contract ndeg318273
Version V4 47Dissemination level PU
[LEXNET D32 2014] BoriesS (ed) ldquoD32 Wideband dosimeter design study amp
performances characterizationrdquo LEXNET project July
2014
[LEXNET D41 2013] Bories S Fang Y Brown TBegaud X Pinto Y Ciblat P
Ksairi N De Domenico A Clemente A Fernandez Y
Lalam M Masera E Wilson M Tesanovic M Kocan E
Pejanovic-Djurisic M Veljovic Z Milatović B Popović M
Nešković A Koprivica M Voinescu A Dragomir D
Slusanschi E laquo D41 Promising Low Exposure Index
Solutions for Components and Transmission
Techniques raquo LEXNET project November 2013
[LEXNET IR21 2013] ldquoNumerical toolsrdquo LEXNET project July 2013
[LEXNET IR51 2013] ldquoSmart low-EMF architectures state of the art and way
forwardrdquo LEXNET project May 2013
[LEXNET D25 2014] Wiedemann P M Freudenstein F ldquoD25 Risk and
exposure perceptionrdquo LEXNET project November 2014
[LEXNET D42 2014] Bories S Fang Y Brown TBegaud X Pinto Y Ciblat P
Ksairi N De Domenico A Clemente A Fernandez Y
Lalam M Masera E Wilson M Tesanovic M Kocan E
Pejanovic-Djurisic M Veljovic Z Milatović B Popović M
Nešković A Koprivica M Voinescu A Dragomir D
Slusanschi E laquo D42 Performance Evaluation of Low
Exposure index solutions for components and
Transmission Techniques raquo LEXNET project November
2014
[MaOC12] Mackowiak M Oliveira C and Correia L M RadiationPattern of Wearable Antennas A Statistical Analysis of theInfluence of the Human Body International Journal ofWireless Information Networks Vol 19 No 3 pp 209-218 2012
[MaCo13] Mackowiak M and Correia L M Statistical Model of theInfluence of Body Dynamics on the Radiation Pattern ofWearable Antennas in Off-Body Radio ChannelsWireless Personal Communications 101007s11277-013-1193-x May 2013
[Mack13] Mackowiak M Modelling MIMO Systems in Body AreaNetworks in Outdoors PhD Thesis IST - University ofLisbon Lisbon Portugal 2013
Document ID D26 Global Wireless Exposure Metric DefinitionFP7 Contract ndeg318273
Version V4 48Dissemination level PU
[NAGAOKA08] Nagaoka T and Watanabe S Postured voxel-based
human models for electromagnetic dosimetry Physics in
medicine and biology vol 53 pp 7047-7061 2008
[PLETS12] Plets D Joseph W Vanhecke K Tanghe E and Martens
L 2012 Coverage Prediction and Optimization Algorithms
for Indoor Environments EURASIP 2012123
[PLETS14] Plets D Joseph W Aerts S Vanhecke K and Martens L
accepted 2014 Prediction and comparison of downlink
electric-field and uplink localized SAR values for realistic
indoor wireless planning Radiation Protection Dosimetry
[SaNC10] SaloJ Nur-AlamM and ChangK Practical Introduction
to LTE Radio Planning white paper European
Communications Engineering (ECE) Ltd Espoo Finland
Nov 2010 (wwweceltdcom)
[TAFLOVE00] Taflove A and Hagness S C 2000 Computational
Electrodynamics The Finite-Difference Time-Domain
Method 2nd edn (Boston MA Artech House Publishers)
[TNS10] TNS Sofres survey Observatoire Socieacutetal du teacuteleacutephone
mobile Dec 2010
[VAJM13] Vermeeren G Aerts S Plets D Joseph W Martens
LConil E Varsier N Wiart J Core YOliveira C Sebastiatildeo
DCorreia L Aguumlero R Diez L Rodriacuteguez L Koprivica M
Nešković A Popović M Milinković J Nikšić S D23
Scenarios LEXNET project Novembre 2013
[WIART08] Wiart J Hadjem A Wong M F and Bloch I Analysis of
RF exposure in the head tissues of children and adults
Physics in medicine and biology vol 53 pp 3681-3695
2008
[WINNER D112 2007] Kyoumlsti P et al D112 WINNER II Channel models
WINNER project September 2007
[ZHAO02] Zhao X Kivinen J Vainikainen P Skog K Propagation
characteristics for wideband outdoor mobile
communications at 53 GHz IEEE J Sel Areas Commun
vol 20 pp 507ndash514 2002
Document ID D26 Global Wireless Exposure Metric DefinitionFP7 Contract ndeg318273
Version V4 49Dissemination level PU
APPENDIX 1 NUMERICAL DOSIMETRIC SIMULATIONS
This appendix describes the main assumptions concerning the frequency bands used
in the numerical dosimetric simulations
Table A1 gives the frequency bands used for SAR simulations as well as theservices and DLUL frequencies considered in each of those frequency bands forLEXNET studies Note that at these frequencies (especially at the higher ones) nolarge differences are expected between SAR results [CHLWW08] Accordingly forthe sake of simplicity it is assumed that
the same frequency band is assumed for both up- and down-link each frequency band may cover more than one system (eg simulation at
1940 MHz covers both GSM1800 and UMTS2000)
Table A1 Technical specifications for LEXNET selected services
SAR
simulation
frequency
band [MHz]
RAT
RAT frequency band [MHz]
DL UL
400 LTE 400 380 - 470
900
LTE 800 875- 885 830 - 840
GSM 900 935 - 960 890 - 915
UMTS 900 925 ndash 960 880 ndash 915
1940
GSM 1800 1805 - 1880 1710 - 1785
UMTS 2000 2110 - 2170 1900 - 1980
2600WiFi bgn 2400 - 2484
LTE 2600 2620 - 2690 2500 - 2570
For the WiFi an between 5470 and 5725 MHz frequency bands no SAR simulation
was performed yet
Document ID D26 Global Wireless Exposure Metric DefinitionFP7 Contract ndeg318273
Version V4 50Dissemination level PU
APPENDIX 2 INTERNAL REVIEW
Reviewer 1 Yoann Corre Reviewer 2 Mick Wilson
Answer Comments Type Answer Comments Type
1 Is the deliverable in accordance with
(i) the Descriptionof Work
Yes
No
M
m
a
Yes
No
M
m
a
(ii) the internationalState of theArt
Yes
No
M
m
a
Yes
No
M
m
a
2 Is the quality of the deliverable in a status
(i) that allows tosend it to EC
Yes
No
M
m
a
Yes
No
M
m
a
(ii) that needsimprovement ofthe writing bythe editor of thedeliverable
Yes
No
See proposedenhancements
In particular thepresentation of the basic EIconcept could be improvedin the Abstract Introductionsection 21 and Conclusion
M
m
a
Yes
No
See comments onSection 3
M
m
a
(iii) that needsfurther work bythe partnersresponsible forthe deliverable
Yes
No
Mostly minor changes Seethe proposedenhancements
Section 44 is a copy-pastof a whole section in D33Either D26 or D33 must bechanged to avoidredundancy (replacing thewhole description by asummary adapted to theintegrated deliverable)
It must be made more clearwhere the reader will findthe missing SAR data andthe announced uncertaintystudy results
M
m
a
Yes
No
M
m
a
Type of comments M = Major comment m = minor comment a = advice

Document ID D26 Global Wireless Exposure Metric DefinitionFP7 Contract ndeg318273
Version V4 18Dissemination level PU
Night 16 28 124Table 3 Average communication durations and data traffic volumes per user profile for a 3G
dense urban network
Reference SAR data were computed using 3D electromagnetic simulation platformsbased on the Finite Difference Time Domain (FDTD) method [TAFLOVE00] SARvalues were calculated for far-field and near-field exposure for two anatomical humanbody models of the Virtual Family [CHRIST10] Duke a 34-year-old male and Earthaan 8-year-old girl Two postures (standing and sitting) and three usages (mobilephone close to the head mobile phone or tablet for data and laptop usage) wereselected More details on numerical simulations can be found in [LEXNET IR212013]Table 4 shows the matrix of raw whole body averaged ௨௦ܣ
values induced in
an adult for a mobile phone usage the same table exists for other usages and forchild exposure
p=adult u=MOBILES
r=Frequency Band
Usage u400MHz
band (LTE)900MHz band(GSM UMTS
LTE)
1800-1940MHzband
(GSM 3G LTE)
24-26GHz(WiFi LTE)
Sitting Data 00078 00056 00016 73E-04Voice X 0012 00052 00047
Standing Data 0003 00049 319E-04 21E-05Voice X 0012 00052 00053
Table 4 Values of normalized whole-body ܛܗܘܝܚܘۯۺ induced in an adult by near sources
(mobiles laptops tablets) in different postures (all the values are given in Wkg and were
normalized to ] ]
= )
Table 5 shows the matrix of raw whole body averaged ௦ܣ values induced in an
adult by far field sources the same table exists for child exposure
p=adult r=Base station antennas (plane waves)
u=usage 400MHz band(LTE)
900MHz band(GSM UMTS
LTE)
1800-1940MHzband
(GSM UMTSLTE)
26GHz band(LTE)
Sitting 00050 00056 00043 00039Standing 00064 00052 00046 00042
Table 5 Values of normalized whole body ܛܗܘܚܘۯۺ۲ induced in adult by far and intermediate
sources (base stations and access points) (all the values are given in Wkg and were
normalized to RX[W]inc
= 1 Wm-2
)
It is worth pointing out that the aforementioned exposure index EI is defined on thebasis of the whole body averaged SAR But a local EI could be also derived fromlocal or tissue-specific SAR values
Document ID D26 Global Wireless Exposure Metric DefinitionFP7 Contract ndeg318273
Version V4 19Dissemination level PU
Last main data required to evaluate the EI are the average DL power density and ULtransmitted power They can be predicted from wireless network planning tools network monitoring tools or dosimeter The predictions or measurements collect awide range data at different locations within the study area for different periods oftime and possibly for different usages in order to derive relevant average valuesTwo types of dosimeters are designed in LEXNET wearable and fixed dosimeterslsquoIn sitursquo measurements were executed close to the end-user body thanks to thewearable version of the dosimeter Fixed dosimeters are being deployed in a densesensors network of a lsquosmartrsquo city More information on the LEXNET measurementtools is available in [LEXNET D61] and on the related assessment methodologies in[LEXNET D33]
23 Variability and uncertainty
The exposure index is the output of an analytical model expressed by the equation(1) with a number of uncertain input variables To propagate the uncertaintyassociated to the input variables in the model the first step consists in characterizingthe distribution of input variables Each uncertain variable input will be described by astatistical distributionThe uncertainties of the life segmentation data will be analyzed and modelled usingcomputable functions such as Gamma Gaussian or uniform distributionsUncertainties on the time use structure on an average day the usage segmentationand the average durations of usage will be characterizedAverage DL power density and UL transmitted power are estimated using specificconfigurations environments and usages The downlink power absorbed by the userand the uplink power emitted by the device (and so partially absorbed by the user)depend on these configurations environments and usages Their statisticaldistributions have to be characterized in order to be incorporated in the total EIstatistical uncertaintyA sensitivity analysis is ongoing in order to determine the most important parametersin the EI equation and how we could simplify the EI formula We are using Polynomialchaos and copulas for modelling of dependant parameters All the results onvariability and uncertainties will be available at the end of the LEXNET project indeliverable D28
The uplink exposure characterization requires a precise modeling of the poweremitted by the device Usually this exposure will depend on two parameters theposition of the personal device relative to the user body and the variation in spatialdistribution of the antenna gain due to the induced coupling effects The impact of thepositioning of the wireless device has been investigated by varying the position ofpersonal device with respect to the body Results have shown that the whole-bodySAR is not very sensitive to the device positionTo investigate the impact of the antenna gain on the variability of the emitted powerwe have used a statistical model of propagation channel [IST]Two propagation scenarios have been tested line of sight (LOS) and non-line ofsight (NLOS) For both scenarios we considered a lognormal distribution for theemitted power with a coefficient of variation up to 120 in the case of LOS and up to57 in the case of NLOS when studying the case of mobile phone emitting at 900MHz frequency This lognormal distribution characterizes the variability of the power
Document ID D26 Global Wireless Exposure Metric DefinitionFP7 Contract ndeg318273
Version V4 20Dissemination level PU
emitted versus the antenna gain Firstly we are assuming that the communication ismade via a single path namely LOS Assuming that the user can change randomlyits orientation with respect to the receiver antenna (eg base station) the antennagain in the LOS direction will also change depending on the user orientation Tomaintain a same control power (assumed fixed by the base station to ensure asuccessful decoding) the product of the emitted power to the antenna gain in LOSdirection should be a constant namely 1 mW in our analysis In the same spirit wehave analyzed the NLOS scenario by adding secondary paths The characterizationof the power emitted allows estimating the related exposure using the proportionalrelationship Figure 5 presents the cumulative distribution function of the poweremitted by the mobile phone when the average power required by the base stationoutside the small sphere surrounding the transmitter system (user + mobile phone) iskept to 1 mW
Figure 5 Cumulative distribution function (CDF) of the power emitted by the mobile phone (at 900MHz) obtained with both propagation scenarios (LOS and NLOS)
We could notice that the power emitted is very sensitive to the spatial distribution ofthe antenna gain especially in the case of LOS
The downlink exposure is very sensitive to the propagation environment[KALLIOLA02] [KIENTEGA11] Many physical obstacles (such as tunnels andbuildings) between the transmitter and receiver can affect the characteristics of theambient electric field This latter depends on many parameters such as the number ofwave components (due to the reflections and diffractions undergone by the originalwave radio) the fluctuations of the wave amplitude its phases and arrival angles Inthe literature several studies focused on the modeling of the electromagneticenvironment in realistic conditions by giving the statistics distributions of all of theseparameters [KALLIOLA02] [ZHAO02] [WINNER D112 2007] Based on the modelsproposed by these studies we simulated a downlink exposure induced by a realisticpropagation environment Figure 6 shows the variations of the whole body SARinduced by a single plane wave at 900 MHz
Document ID D26 Global Wireless Exposure Metric DefinitionFP7 Contract ndeg318273
Version V4 21Dissemination level PU
Figure 6 Variation of the exposure induced by a single plane wave (LOS) at 900 MHz for differentpolarization (horizontalH verticalV)
Other sources of uncertainties exist as the information on the network wirelessinfrastructure (eg the base station antenna location and orientation) the userequipment performance the Prediction errors (propagation UL power control modeletchellip) some being discussed in [D33 section 231] or measurement discretization(eg with a limited number of fixed dosimeters [D33 section 26])
3 HOW TO USE THE INDEX OF EXPOSURE
The synthetic index which is presented above aims at gathering all contributions tothe population EMF exposure induced by wireless communication networks By itselfbuilding such an index is already a challenging goal but LEXNET goes beyond thedefinition of the EI since it seeks reducing the exposure by exploring innovativetechniques at the lower (mainly PHY level) or upper layers (network level andresource management)
However a general formulation of the EI is given in this document the EI needs to beslightly adapted to the particular characteristics of each technique evaluationscenario The basic idea is that each of the proposed techniques would probablyfocus on a particular parameter and most likely on a single scenario Proposedtechniques could therefore be evaluated by using a partial EI Hence their benefitswould be specific to the characteristics of the selected use case and their impact overthe overall EI would need to be adjusted accordingly A reference scenario detailedbelow has been defined in order for all the proposed reducing solutions to be testedon one unique global scenario
31 Reference scenario
One reference global scenario will be used as a starting point scenario by LEXNETtechnical work-packages (WP 4 5 and 6) to evaluate the EI ldquobeforerdquo implementationof LEXNET exposure-minimization techniques
Document ID D26 Global Wireless Exposure Metric DefinitionFP7 Contract ndeg318273
Version V4 22Dissemination level PU
Parameter Value
Time periods Day Night
Population Adult children
Load profiles Heavy moderate light and non user
Environments Outdoor indoor commuting
RATsCellTypes
Type 2G 3G 4G WiFi
Cell size Variable (mainly depends on theenvironment)
Cell type Macro
User
Usage Voice data
Equipment Smartphone tablet Laptop (dongle)
Posture Standing sitting
The EI will be evaluated for this specific scenario using life segmentation usage andSAR data introduced in the previous chapterThen each partner will be free to test their minimizing solutions on this scenario andto calculate an EI ldquoafterrdquo LEXNETScenarios for each RAT can be simulated separately and percentages of mobiletraffic per RAT can be afterwards used as input for the EI (see Figure 7) It can beenvisaged that modifying these percentages could be one network managementsolution for reducing the EI assuming in a first approximation that the traffic per RAThas no strong influence on the RAT exposure metrics which is not completely right
Figure 7 Connections by RAT [CISCO13]
Document ID D26 Global Wireless Exposure Metric DefinitionFP7 Contract ndeg318273
Version V4 23Dissemination level PU
32 Reducing the EMF exposure using the EI
321 Lower layer solutions a common methodology to use the EI
The EI is a relevant global metric for evaluation of radio technologies performances interm of exposure reduction However WP4 has identified some difficulties to directlyaddress the global calculation To reach this global evaluation target WP4 hasadopted a specific and indirect methodology described in [LEXNET D42 2014]deliverable and synthesised in the following Despite a large diversity of technicaldomains whatever the scenario or the Radio Access Technologies (RAT) a singlestrategy to organize and align the different WP4 exposure evaluations is proposed Afive steps methodology has been established in order to evaluate and harmonize theoverall exposure improvement for each technology These steps also attempt toprovide the basis for future global exposure reduction evaluation in order todetermine the most promising WP4 techniques based on fair and relevantcomparisons
The first step is to identify how the individual WP4 techniques contribute towards theoverall LEXNET use case scenarios from WP2 Specifically for WP4 evaluations foursub-scenarios have been introduced (Macro-Cell Small-Cell Rural and WSN ampWiFi) (Step-1a) This sub-scenario categorization highlights which solutions arecomplementary and which will require further analysis to determine potential conflictsIn order to harmonize the evaluations from the studies of different solutions it iscrucial to describe properly and extensively each assumption and the inputparameters values related to the context study (Step-1b)
A limited numbers of Key Performances Indicators (KPI) for the exposure and for theQoS are used in the evaluation of each WP4 technique The step-2 has to clearlyidentify the KPIs being addressed by individual technique exploration It is taken asmore convenient to work with one of the following three simpler metrics or KPIsderived from the EI formula and addressing UL exposure
The first metric is the Specific Absorption Rate (SAR l mTx ) which describes the
amount of EM energy absorbed into the userrsquos body via the spatial distributionof the EM field from the source Thus SAR is particularly relevant for antennasolutions
The second metric is the mean duration of exposure (UL
kjit ) which indicatesthe amount of time the user is exposed It impacts the EI which is defined as adose For example the duration is impacted by the amount of transmitted dataReduced retransmission improved interference management and signalingreduction strategies are all ways of decreasing this metric The duration usedto calculate the mean is selected regarding the time constant of the studiedtechnique
The third metric is the mean transmitted power ( TxP ) during the considered
mean exposure duration As an example a 1 dB improvement on the receivingsensitivity at the Base Station (BS) could be converted in a 1 dB reduction ofthe transmit power at the User Equipment (UE) Again the duration used tocalculate the mean is selected regarding the time constant of the studiedtechnique
Document ID D26 Global Wireless Exposure Metric DefinitionFP7 Contract ndeg318273
Version V4 24Dissemination level PU
Notice that an equivalent set of three metrics adresses the DL
The step-3 concerns the evaluation itself of a partial EI ratio in comparison with abaseline scenario that is to say without implementing the studied solution Theexposure reduction is evaluated through the calculation of an EI ratio by comparingthe lsquoafter LEXNETrsquo versus the lsquobefore LEXNETrsquo (ie SotA or standard) baselineconfigurations (Eq 4) The main advantage of the proposed approach is that in mostof the presented solutions the three KPIs are independent from each other Byconsidering a given sub-scenario and depending whether the UL or the DL is studiedthis means that if a solution succeeds in decreasing the selected single KPI the twoothers will stay constant when the solution is implemented or not Thus in thatspecific sub-scenario the EI ratio is equal to the selected KPI ratio (Eq 5) Thisexposure metric is easily matched with a typical RF front-end or PHY layer evaluationstudies
(4)
This formula is simplified when a specific sub-scenario is considered
(5)
Where
partialEI is the Exposure Index for a specific sub-scenario
partialKPI is the identified metric among the three detailed in step 2
the subscript lsquow LEXrsquo correspond to the Lexnet solution implementationthe subscript lsquowo LEXrsquo correspond to the SotA or baseline (without the solutionimplementation)
Meanwhile the selected QoS metric is also evaluated with and without LEXNETsolution
The step-4 aims to ensure that capacity or QoS improvements are converted intoexposure reduction It is worth reminding that the objective of LEXNET studies is toreduce exposure without impacting QoS
At last the step-5 estimates the absolute global EI reduction from the previous stepsrsquopartial EI results throught the 24 hours LEXNET reference scenario The so-calleddilution factor [LEXNET D41 2013] is taken into account during this step-5 Theusage statistics from WP2 are used to weight the calculated partial EI reduction inorder to assess the global EI reduction for a given solution
To conclude a scheme summarizes the WP4 common EI evaluation methodology inFigure 8 This process is sufficiently generic to be applied by any of the WP4proposed solutions and examples of its step by step application can be found in[LEXNET D42 2014]
100LEXwoEI
LEXwoEI-LEXwEI()Ratio
partial
partialpartial
EI
100LEXwoKPI
LEXwoKPI-LEXwKPI()Ratio
partial
partialpartial
EI
Document ID D26 Global Wireless Exposure Metric DefinitionFP7 Contract ndeg318273
Version V4 25Dissemination level PU
Figure 8 Common EI evaluation methodology for WP4 techniques
322 Upper layer and resource management techniques
By introducing and promoting the EI as a new planning metric LEXNET intendsamong other objectives to help reduce local town planning objections to applicationsfor installing new base stations Work carried out by LEXNET WP5 so far hasdemonstrated that real-time EMF-aware network management strategies depend oncurrent traffic load radio conditions mobility application used and the duration ofuse available networks and UE capabilities Since EI calculations take into accountlong-term network statistics distributions of user profiles and habits (services usedetc) times of day period of year etc EI itself may therefore be better suited for initialnetwork design and AP placement while other metrics may be better suited for real-
Document ID D26 Global Wireless Exposure Metric DefinitionFP7 Contract ndeg318273
Version V4 26Dissemination level PU
time EMF management Clearly a link between these proxy-metrics and long-term EIvalues is needed The underlying assumption is that if we try to reduce the level ofEMF by applying correct general policies and additionally control it on a smaller time-scale (eg seconds or minutes) with fast-loop control then the overall exposure andthe EI (defined on daily level) will decreaseFast-loop (event-based) EMF control would be a response to a temporary change ofconditions This kind of control requires triggers ie thresholds that can be assessedon near-real-time scale ndash this time scale may not be as granular as for power controlFor fast-loop control offload techniques may be used as for general strategy butalso other strategies such as changing codecs delaying transmission etc Fast-loopcontrol without using triggers would be periodic optimization on a smaller time-scaleProxy metrics to be used for fast-loop control involve data that may be collected fromthe network and include
bull Measurements (UL Tx power RSSI RSCPhellip)
bull User context velocity services used profile
bull Statistics cell statistics (traffic load) etc
Some preliminary results using various proxy metrics which illustrate the pointsabove are shown hereFigure 9 shows live network measurements illustrating that available cellulartechnologies and current traffic conditions are two of the main points to be taken intoaccount when designing low-EMF solutions The metric used here is the UL Txpower The same metric is used in Figure 10 and Figure 11 which show that the typeof service could increase the exposure (based on UL Tx power) meaning thatdifferent strategies should be used to identify the best connectivity according to theservice flow requested The actual UL Tx power values can then be used in EIcalculations
Figure 9 Comparison of different 2G3G cells in high load hours by UE Tx power
Document ID D26 Global Wireless Exposure Metric DefinitionFP7 Contract ndeg318273
Version V4 27Dissemination level PU
Figure 10 Comparison of UL FTP and voice services over 2G3G cells in high load hours by UE Txpower
Figure 11 Comparison of voice service over 3G and voice service using Skype over 3G network
Another common proxy with direct link to EI is the DL power density Figure 12 showshow DL power density and UL transmit power vary for different ISD values in an LTEnetwork Based on these simulations it can be seen that small-cell densification inurban areas allows for significant exposure reduction which now needs to betranslated into the EI using various assumptions on user distributions and type ofusage
Document ID D26 Global Wireless Exposure Metric DefinitionFP7 Contract ndeg318273
Version V4 28Dissemination level PU
Figure 12 DL power density and UL transmit power for different ISD values
Whole-body SAR is another proxy metric whose statistical processing can leaddirectly to EI calculations As an example of SAR values obtained by a tooldeveloped for the prediction of whole-body and localized SARs and absorbed dosesfor indoor wireless network deployments in Figure 13 we show distributions for thetraditional deployment (top) and for the WP5 exposure-optimized deployment
Figure 13 Whole-body SAR_DL (distribution for the traditional deployment (top) and for the exposure-optimized deployment (bottom)
Document ID D26 Global Wireless Exposure Metric DefinitionFP7 Contract ndeg318273
Version V4 29Dissemination level PU
4 EXAMPLES OF APPLICATION
41 Computing chain
In this section three simplified examples of EI computation are detailed In no casethese examples are representing the completeness of the possibilities that can becover by the EI but they illustrate the process of computation
The first two examples illustrate the use of network planning tools in the evaluation ofthe EIThe first example detailed in the section 42 consists in comparing two indoor officescenarios first with wireless communication offered by only 3G outdoor macro basestations scenario and secondly with an additional 3G femtocell (Table 6)
Scenario 1
Time PopulationUser
ProfileEnvironment RAT Cell Type Posture Usage
1h inthe
afternoon
Adults Heavy Indoor 3G Macro Standing Voice mobile
Medium Datamobile
Light Data Tablet
Nonuser
Data Laptop
Scenario 2
Time PopulationUser
ProfileEnvironment RAT Cell Type Posture Usage
1h inthe
afternoon
Adults Heavy Indoor 3G Femto Standing Voice mobile
Medium Datamobile
Light Data Tablet
Nonuser
Data Laptop
Table 6 input variables for the 3G indoor sub-scenarios described in section 42
The second example detailed in section 43 is considering a data LTE macro urbanscenario (Table 7)
Time PopulationUser
ProfileEnvironment RAT Cell Type Posture Usage
Day Youngpeople
Moderate Indoor 4G Macro Standing Data mobile
Document ID D26 Global Wireless Exposure Metric DefinitionFP7 Contract ndeg318273
Version V4 30Dissemination level PU
Night Adults Non user Outdoor Sitting Data mobile
Seniors Data Tablet
Table 7 input variables for the LTE scenario described in section 43
The last example detailed in section 44 illustrates the use of dosimetermeasurements in the EI evaluation It is considering a macro outdoor LTE scenariowhere one user is wearing a dosimeter
42 Indoor exposure from 3G macro and femto-cells
The EI was evaluated for two scenarios considering the exposure of people locatedindoor The population consisted of adults making UMTS (phone calls with thephone on the right side of the head The scenario 1 is considering a macrocellconnection and the scenario 2 an indoor small cell connection Different user profilesare considered
10 heavy users 30 s usage 50 moderate users 10 s usage 25 light users 3 s usage 15 no usage 0 s usage
For the calculation of the EI several input parameters are needed reference SARvalues averaged transmitted power valuesത and averaged incident power densityvalues inc (see Table 8)The power (density) values that were used for the indoor macrocell scenario arederived from measurements in an office building (Zuiderpoort building GhentBelgium) [PLETS14] Figure 14 shows the considered buildingFor the indoor femtocell scenario accurate power (density) values from the WHIPPtool a heuristic indoor network calculator and planner [PLETS12] were used In theconsidered building a femtocell with an Equivalent Isotropically Radiated Power(EIRP) of 7 dBm is installed A different femtocell EIRP can lead to a largely differentEI Reference SAR values were taken from [LAUER13] and applied to the scenariosfor an adult standing using the phone on the right side of the head Since the
measured macrocell values (RXinc and Pഥଡ଼) were not recorded in the smaller andmore enclosed central areas of the building floor (toilets kitchen shedhellip) femtocellpredictions were limited to the non-shaded areas around the center in Figure 14 Forthe femtocell values locations within 50 cm of the base station are discardedassuming that people stay at least half a meter away from base stations For thesimulations a sub-scenario is also considered for which a 20 dB worse macrocellconnection is assumed for the same building floor This could correspond to abuilding with a penetration loss that is 20 dB higher than before or a building which islocated further from the macrocell base station (path loss increase of 20 dB) Table 8
shows that the assumed Pഥଡ଼ RXinc values in case of a lsquoworse connectionrsquo areindeed 20 dB higher lower
Document ID D26 Global Wireless Exposure Metric DefinitionFP7 Contract ndeg318273
Version V4 31Dissemination level PU
Figure 14 Ground plan of the considered floor (90 m x 17 m) of the office building that is simulatedFemtocell base station location is indicated with purple hexagon
Scenario 1Macro indoor
Scenario 2Femto indoor
௨ܣ 0003 Wkg 0003 Wkg
௨ܣ 000495 Wkg 000495 Wkg
ത 26610-5 W 28510-7 W
ത(worse connection) 26610-3 W 28510-7 W
RXinc81510-8 Wmsup2 51810-6 Wmsup2
RXinc(worse connection) 81510-10 Wmsup2 51810-6 Wmsup2
Table 8 Reference SAR values and average transmitted power and observed power densityvalues
In the following the results for the different indoor scenarios are discussedFigure 15 (a) compares the EI for scenarios 1 and 2 for the indoor office buildingFrom an exposure-point-of-view the indoor femtocell scenario (scenario 2 EI =158E-8 Wkg) is a factor 28 worse than the indoor macrocell scenario (scenario 1 EI= 564E-10 Wkg) The main EI contribution in scenario 2 is the high DL exposureoriginating from the femtocell (155E-8 Wkg) The scale in Figure 15 (a) has beenadjusted the bar that represents the DL femto indoor contribution is in reality 44times the length of the Y-scaleThere are several reasons why the installation of a femtocell is not beneficial in thiscaseA first reason is that the EI contributions of the macrocell are almost equal for UL andDL which is optimalA second reason is that the femtocell EIRP is chosen quite high (7 dBm) despite thegood macrocell connection (average value of -6925 dBm) still 77 of the DL fieldsare higher in the femtocell caseA third reason is that a femtocell installation has the disadvantage that observedpower densities on a building floor due to a femtocell base station are lesshomogeneously distributed than fields due to a (more distant) macrocell base stationAs people are assumed to ndash on average- reside an equal time at each location on thebuilding floor (except shaded areas and locations closer than 50 cm from the BS)locations close to the femtocell contribute a lot to the EI When people approach afemtocell the absorbed exposure dose increases in a more-than-linear wayMacrocell base stations have the advantage that ULDL fields are morehomogeneously distributed over the building floor It should also be noted that thehigher the UL usage the more the femtocell scenario will benefit compared to themacrocell scenario (lower EI) However in the considered case the UL usage timeswould have to increase by a factor 48 to yield a total EI (macrocell scenario 1) that isequal to the EI of scenario 2 (femtocell scenario EI = 158E-8 Wkg)
Document ID D26 Global Wireless Exposure Metric DefinitionFP7 Contract ndeg318273
Version V4 32Dissemination level PU
We also studied a second case where a less favourable macrocell case isconsidered (lsquoworse connectionrdquo) It is assumed that the connection with the macrocellbase station is now 20 dB worse than in the previous case Figure 15 (b) comparesthe EI for the macrocell and femtocell deployments Due to the worse connection(average received macrocell DL power of -8925 dBm) the macrocell EI is nowcompletely determined by the UL contribution (320E-8 Wkg) and the femtocellscenario (scenario 2 EI = 155E-8 Wkg) has an EI that is 48 of the macrocell EIwhich makes it preferable over the macrocell deployment Moreover the observedpower densities due to the femtocell are higher than the macrocell power densities atall locations (better QoS)It can be concluded that the installation of femtocell is not always recommended forshorter UL usage times andor better macrocell connection qualities it could beadvised to rely on the existing macrocell infrastructure Also when installing afemtocell its EIRP should be adjusted to the size and physical properties of thebuilding and should not be set at a needlessly high value
(a) (b)Figure 15 Comparison of the contributions to the whole-body EI for (a) indoor scenarios 1 and 2 in theconsidered building (b) indoor scenarios 1 and 2 in this building with 20 dB worse connection qualityTotal EI levels for each scenario are indicated with the horizontal line EI values are shown in Wkg
43 Data LTE macro urban scenario
431 Input variables linked to the network
The EI is evaluated from a macro-cellular LTE network in a real geographical area ndashpart of the 7th district of Paris (see Figure 16) The proposed scenario was previouslydefined in frame of the French ANR project ECOSCells [BCL12] and the EuropeanFP7 project FREEDOM (httpwwwict-freedomeu) for the simulation and analysis ofheterogeneous network topologies (hetNet) It is based on a real environment usingHigh Resolution (HR) map data realistic BSUE deployments and deterministicpropagation models
The macro layout is organized as three rings around a central three-sector sitemacro base stations being deployed with an inter-site distance of about 450 m in ahexagonal manner as shown in Figure 16
Document ID D26 Global Wireless Exposure Metric DefinitionFP7 Contract ndeg318273
Version V4 33Dissemination level PU
Figure 16 View of the macro-cell hexagonal deployment in the area
The study area (ie area where network performance is evaluated) is limited to thesurface covered by the three co-located central macro-cells and the first ring (Figure17) Thus the study area is equivalent to 12 macro-cells The base stations outsidethis study area are included in simulations to generate an accurate interferencepattern
Figure 17 Study area composed of 12 macro sites localised in the 7th
district of Paris France
Document ID D26 Global Wireless Exposure Metric DefinitionFP7 Contract ndeg318273
Version V4 34Dissemination level PU
The positions and heights of the base stations have been selected in realisticapproach sites are placed on slightly dominant rooftops and sector antennas aredistributed at the rooftop edges Directive antennas are used (with 3GPP radiationpattern) Each site is composed of three sectors oriented in azimuth directions 0deg120deg and 240deg with down-tilt 6degUsers are assumed to be uniformly distributed in the study area an indoor ratio setsthe percentage of users located inside buildings at the ground floorThe specifications of input parameters are summed up in Table 9
Environment Typical European Dense Urban environment (Paris VII district France)
System
Downlink (DL) and Uplink (UL)
LTE FDD 2 x 10 MHz
Central frequency 2600 MHz
Macro layout
Hexagonal sitedeployment
37 sites corresponding to 83 macro cellsincluding 12 sites in the center of the studyarea Inter-site distance (ISD) of 450 m
Nominal transmitpowerEPRE
40 W 228 dBm
AntennaDirectional with 14 dBi gain 6deg electric down-tilt 2 antennassector Average antennaheight 30 m above ground
Noise figure 25 dB
UL power control (openloop)
Path loss compensation factor 1SINR target 208 dB
UserEquipment
MaxMin transmit power 23 dBm -40 dBm
AntennaOmni-directional with 0 dBi gain 2antennasuser device Antenna height 15 mabove ground
Noise figure 9 dB
User traffic
Average active userdensity
Depends on daynight
DistributionUniform spatial distribution within thesimulation area Single floor (at 15 m height)No user mobility
Table 9 Inputs in SIRADEL simulator
432 Input variables linked to the population
Category of population
The population density of the 7th District of Paris was estimated at 14 36050
inhabitants per kmsup2 in 2009 [Carte09]
We are considering the population above 15 years old
Given the population distribution by age (Figure 18) it was decided to divide the adult
population into 3 categories young people (between 15 and 29 years) adults
Document ID D26 Global Wireless Exposure Metric DefinitionFP7 Contract ndeg318273
Version V4 35Dissemination level PU
(between 30 and 59 years) and seniors (over 60 years) Table 10 shows the
percentages of people in each category
Figure 18 Population distribution by age in Paris 7th district in 2007
Population category Pourcentage(prop)
Adults (30-59 yo) 45
Young people (15-29 yo) 26
Seniors (+60 yo) 29
Table 10 Number of people in each population category
Time periods
A 24-hour day is divided into two periods the day from 8 am to 6 pm (10 hours in
total) and the night from 6 pm to 8 am (14 hours in total)
Environment
Time spent indoor or outdoor on an average day for each category is extracted from
Table 2
Usage
Only data traffic is considered The device is assumed to be a mobile phone whilethe user is in a standing posture Considering the existence of 4 telecom operators inFrance only 25 of the 7th district population is assumed to be using this LTE macronetwork In this example we consider two user profiles moderate user and non-userFor each population category we derived from [Bigot et al 2013] the proportions ofusers and non-users of mobile phones for data traffic (see Table 11)
User profileYoung people (15-29
yo)Adults (30-59 yo) Seniors (over 60 yo)
non-users 33 57 91
Document ID D26 Global Wireless Exposure Metric DefinitionFP7 Contract ndeg318273
Version V4 36Dissemination level PU
users 67 43 9Table 11 Repartition of users and non-users for each population category
For simplicity the parameters for the moderate user profile are applied to all userswe assume a daily data traffic per active user of 66 MB [CISCO13] a DLUL ratio of9010 (this ratio was evaluated from data collected through measurements ofKPIs by sensors inside the French Orange network) and a daynight ratio of4357 From [CISCO13] only 29 of connections in 2013 were on 4GReference SAR values were extracted from Table 4 and Table 5
433 Transmitted power ഥ and received power density ത calculationܖ
Incident ோpower densities and transmittedത powers were calculated by usingthe network planner simulation tool Volcano Suite (Siradel France)Figure 19 andFigure 20 illustrate respectively the average UE Tx power calculated over the 7thParis district during the day and the average incident power density evaluated duringthe day or the night (values during the day or the night time were quasi identical)
Figure 19 Map of the average UL Tx power (dBm) calculated indoor at ground floor and outdoorduring the day (on the left) and map of daily average transmission duration (s) (on the right)
Figure 20 Map of the average DL incident power density (dBμVm) calculated indoor at ground floor and outdoor during the day or the night
Because the average active LTE user density is very low (41 userskm2consequence of the 29 LTE connections assumption) the DL user traffic utilises
Document ID D26 Global Wireless Exposure Metric DefinitionFP7 Contract ndeg318273
Version V4 37Dissemination level PU
less than 1 of available resources which strongly impact the predicted DL incidentpower density We can see in Figure 19 (left figure) that the calculated average Txpower is minimum in outdoor areas in the vicinity of the base stations or in Line ofSight (LOS) while it is at a maximum indoors and outdoors far away from the basestations The right map in Figure 19 gives the average communication durationwhich directly impacts the calculation of the UL exposure contribution The better thelink performance is the higher the throughput and thus the longer thecommunication duration That is why the longest durations are observed indoors andparticularly in the building parts that suffer from the strongest propagation lossesFigure 20 shows that the strongest DL incident power density levels are predicted inLOS areas while much lower levels are observed inside the buildings where mostpopulation is located
434 Exposure index calculation
Aggregating everything we obtain the following value for the EI (based on the Whole-body SAR) of the over 15 years old population of the 7th district of Paris consideringa macrocell LTE network EIWBSAR = 31910 -7 Wkg
44 Using dosimeters for the EI evaluation
This section provides an evaluation of the downlink and uplink exposure indexes fora subject wearing a reference isotropic dosimeter on the head together with fivedosimeters at different locations of the body as well as two mobile terminals Thesubject is moving in a multipath environment including a 3-sector LTE base station
When modelling the radio link between the user devices and the base station oneconsiders the influence of the body (ie body coupling [MaOC12] and bodymovements (using realistic body motion capture tools [MaCo13]) and accounts forthe propagation environment using a geometrically based statistical channel (GBSC)model (ie multipath propagation) Therefore the modelling of the radio channel hasbeen separated into several steps as described in [Mack13] Figure 21
Document ID D26 Global Wireless Exposure Metric DefinitionFP7 Contract ndeg318273
Version V4 38Dissemination level PU
Figure 21 Model for EMF assessment from dosimeter data
The simulated scenario Figure 22 considers a reference isotropic dosimeter on thehead of the user (simulating the real body exposure) together with five wearabledosimeters These dosimeters allow the downlink exposure assessment The user isalso carrying two mobile terminals allowing to assess the uplink exposure
Figure 22 Placement of wearable dosimeters and mobile terminals on the body
For the downlink the received (Rx) power ோ௫ at the mobile terminal (ordosimeter) is calculated from
ோ௫[ౚ ]= ௌ[ౚ ]
minus ௧௧[ౚ]ܮ (6)
where ௌ base station (BS) transmitted (Tx) power ௧௧ܮ total path loss including gains of mobile terminal (or
dosimeter) and BS
The received power density ோ௫ at the mobile terminal (or dosimeter) iscalculated from
ோ௫ ୫ మ൧=
ோ௫[ ]
ܣ మ൧
(7)
where ܣ is the mobile terminal antenna effective area
ܣ ୫ మ൧=ଶ[ߣ ]
ߨ4ோ௫[ౚഠ]ܩതതതതതതതതത (8)
where wavelength ோ௫തതതതതܩ average gain of the receiving antenna (ie dosimeter probe) in
off body direction (eg half-hemisphere of the gain pattern ieߠ isin [minus9090]deg and isin [minus9090]deg)
ோ௫[ౚഠ]ܩതതതതതതതതത=
1
ఏఝ ோ௫[ౚ]ܩ
ߠ) )
ேക
ୀଵ
ேഇ
ୀଵ
(9)
where ఏ and number of elevation (ߠ) and azimuth () directions
The exposure index for the DL ܫܧ can be determined from [LEXNET D24 2013]
Document ID D26 Global Wireless Exposure Metric DefinitionFP7 Contract ndeg318273
Version V4 39Dissemination level PU
[୩]ܫܧ = ௪ܣ
|ଵ ୫ మ[୫ మ୩]
times ோ௫[ ୫ మ]times [ୱ]ݐ (10)
where ௪ܣ
|ଵ ୫ మ normalised whole body averaged SAR coefficient per
1 Wm2 of Rx power density as indicated in [LEXNET D24 2013] ݐ time of the exposure from BS
ோ௫ average Rx power density during period ݐ
For the uplink the required Tx power from the mobile terminal is determined from ௫[୫ ]
= ௌ[୫ ]+ ܫ ௧௧[]
+ ܯ [] + ௧௧[]ܮ (11)
where ௌ noise and interference level at the BS ܫ ௧௧ target SINR at the BS
ܯ fading margin for a dynamic usage ௧௧ܮ total path loss including gain of MT and BS
ௌ is calculated asௌ[୫ ]
= minus174[୫ ] + 10logଵ(ܤ[ୌ]) + ி[]+ []ܫ (12)
where ܤ bandwidth ி noise figure ܫ interference
The EI for the UL ܫܧ can be determined from [LEXNET D24 2013]
[୩]ܫܧ = ௪ܣ
|ଵ [ଵ୩]times ௫[ ]
times [ୱ]ݐ (13)
where ௪ܣ
|ଵ whole body averaged SAR coefficient per 1 W of Tx poweras indicated in [LEXNET D24 2013]
ݐ time of the exposure ( duration of the mobile terminal usage)
௫ average Tx power during period ݐ
A macro cell outdoor street scenario has been considered including a set of 10clusters of 3 scatterers each with a Uniform Distribution in the half space of anellipsoid A 3-sector base station antenna is located in the middle of the street atx=100 m The user is moving on a straight line in the middle of the street (ie y=10m xisin[50 150] m) Figure 23
Document ID D26 Global Wireless Exposure Metric DefinitionFP7 Contract ndeg318273
Version V4 40Dissemination level PU
Figure 23 Scenario
The parameters of the scenario are presented in Table 12 being worthwhile to noticethat the values of ௪ܣ
and ௪ܣ are taken from preliminary SAR simulations The
calculated noise and interference level at the BS is ௌ= -12774 dBm
System
Frequency [MHz] 2600
[HoTo11]ܤ
Resource Block [kHz] 15
Full [MHz] 20
Full LTE-A [MHz] 100
Downlink
EIRP BS Tx power [dBm] 46 [LEXNET D23 2013]
ோ௫ܩ [dBi] 122 [LEXNET D32 2014]
ݓܣ|ܮܦ
1Wm2[m2kg] 300
Uplink
ܫ ௧௧[dB] 208 [HoTo11]
ி [dB] 25 [LEXNET D23 2013]
[dB]ܫ 8 [HoTo11]
ܯ [dB] 30 [Mack13]
ݓܣ|ܮ
1W[1kg] 495
Table 12 Scenario overview
Figure 24 illustrates the considered macro cell base station antenna and thedosimeter realised gain patterns
(a) BS with 3 sectors (b) Dosimeter on the bodyFigure 24 Realised gain pattern
Document ID D26 Global Wireless Exposure Metric DefinitionFP7 Contract ndeg318273
Version V4 41Dissemination level PU
441 EI for downlink
The average Rx power density obtained from the isotropic reference probe and thedosimeter located at WA_L and WA_R is presented in Figure 25 The received powerdensity at WA_L dosimeter is very similar to the one gathered at the isotropic probewhich mainly comes from the similar Line-Of-Sight (LOS) propagation conditions Thepower received in WA_R dosimeter is much lower due to the body shadowing
Figure 25 Rx power density at selected positions
The distribution of the Rx power density is presented in Figure 26 In spite of thebody shadowing the distribution of the Rx power density at the WA_R dosimeter ismuch similar to the ones for the reference and the WA_L dosimeters All of themfollow an exponential decay which should be subject to further investigation
(a) isotropic (b) WA_L (c) WA_R
Figure 26 Rx power density histograms
The received power density and the downlink exposure index calculated based onthe measurement of the dosimeters located in the various locations on the body arepresented in Table 13
ோ௫ [mWm2] ܫܧ [mJkg]
isotropic 35868 2690
WA_F 18357 1377
WA_B 29538 2215
Document ID D26 Global Wireless Exposure Metric DefinitionFP7 Contract ndeg318273
Version V4 42Dissemination level PU
WA_L 28516 2138
WA_R 9060 680
TO_F 18436 1383
Table 13 Downlink Exposure
The WA_L dosimeter and the isotropic probe exposure indexes are very similarbecause of the LOS propagation conditions The same is valid for the WA_Bdosimeter which is also in LOS with the base station For the other dosimeters theexposure index is naturally lower due to the body shadowing In this scenario theuse of a wearable dosimeter in the front or in the right side of the body displays anexposure index reading about 4 times lower than the real user exposure
442 EI for uplink
The average Tx power from the mobile phone hold near HE_L and HE_R ispresented in Figure 27 The uplink power control is clearly noticeable by the highertransmitted power in HE_R as the mobile terminal adjusts the Tx power tocompensate for the higher channel fading
Figure 27 Tx power for straight6min scenario at 2600 MHz for LTE-A
The distribution of the Tx power at HE_L and HE_R is presented in Figure 28 Inspite of the different intensities HE_L and HE_R Tx powers present a similardistribution
Document ID D26 Global Wireless Exposure Metric DefinitionFP7 Contract ndeg318273
Version V4 43Dissemination level PU
(a) HE_L (b) HE_R
Figure 28 Tx power histograms
The average transmitted power and the uplink exposure index from the mobileterminals located near left and right side of the head ( e HE_L and HE_R) arepresented in Table 14
௫ [mW] ܫܧ [mJkg]
RB FULL FULL_A RB FULL FULL_A
HE_L mobile 002 165 827 003 295 1474
HE_R mobile 008 838 4191 014 1493 7468
Table 14 Uplink Exposure
These results show the importance of the propagation conditions in the EMFexposure Due to the non LOS conditions the exposure index in the right side of thehead is 5 times higher than the one on the left side
5 CONCLUSION
In this deliverable a global metric is defined to test and optimize wirelesstelecommunication networks in terms of EMF exposureThe proposed metric called Exposure Index (EI) has the advantage to overpass thelimitations of the actual metrics that in fact are managing separately the exposureinduced by personal devices and the one induced by the network equipment (basestations and access points) But devices base station antennas and access pointsare definitely parts of the same wireless environment and the global wirelessexposure is induced by all of them
The EI is described with an analytical model with input variables describing thecoverage area of interest the accessible networks the population and the habits interms of location and of wireless devices usage The output is the EI covering theday-to-day averaged exposure of population in a given area incurred by an entirewireless network from base stations and access points to individual devices
In this deliverable the analytical model of EI has been detailed and the inputvariables defined Then the use of the EI to minimize the EMF exposure in wirelesscommunication networks is presented in connection with work-package 4 dedicated
Document ID D26 Global Wireless Exposure Metric DefinitionFP7 Contract ndeg318273
Version V4 44Dissemination level PU
to innovative radio components and work-package 5 focused on networks topologiesand technologies
The way to process a complete calculation of EI is illustrated on three deterministicexamples The first example considers comparison of indoor 3G macro and femtoscenarios The second example is taking into account an adult population in a LTEmacro urban environment with their data usage specifications Both examples arebased on a real environment representation and network simulation tools have beenused to simulate the up and down links The third example illustrates how dosimetermeasurements can be used to assess the EI
In our further work the statistical description of input variables will enable topropagate the variability and the uncertainty in the EI model making it more accurateand reliable Results will be made available in the future deliverable D28 DeliverableD33 will detail the used methodology to assess the EI and for the last year of theproject the work of partners involved in WP6 will be enhanced as they will be incharge of the implementation and evaluation of the EI
Document ID D26 Global Wireless Exposure Metric DefinitionFP7 Contract ndeg318273
Version V4 45Dissemination level PU
6 REFERENCES
[ALIAGA06] Aliaga C How is the time of women and men distributed
in Europe Statistics in focus population and social
conditions April 2006
[APVJM13] Aerts S Plets D Verloock L Joseph W and MartensL Assessment and comparison of RF-EMF exposure infemtocell and macrocell scenarios Radiat Protec Dosim2013
[BCL12] Brau M Corre Y Lostanlen Y Assessment of 3D
network coverage performance from dense small-cell LTE
Communications (ICC) 2012 IEEE International
Conference on
[Carte09] httpwwwcartesfrancefr
[CISCO13] Cisco Visual Networking Index Global Mobile Data Traffic
Forecast Update 2012-2017 February 2013
[CHLWW08] ConilE Hadjem A Lacroux F Wong M F and Wiart J
Variability analysis of SAR from 20 MHz to 24 GHz for
different adult and child models using finite-difference
time-domain Phys Med Biol vol 53 pp 1511-1525
2008
[CHRIST10] Christ A Kainz W Hahn E G Honegger K Zefferer
M Neufeld E Rascher W Janka R Bautz W Chen
J Kiefer B Schmitt P Hollenbach H-P Shen J
Oberle M Szczerba D Kam A Guag J W amp Kuster
N The Virtual Family--development of surface-based
anatomical models of two adults and two children for
dosimetric simulations Phys Med Biol vol 55 pp 23-38
2010
[CMKB06] Cooper TG Mann SM Khalid M and Blackwell RP
Public exposure to radio waves near GSM microcell and
picocell base stations Journal of the Society for
Radiological Protection Vol 26 No 2 pp 199-211 June
2006
[GCWW10] Gati A Conil E Wong MF Wiart J Duality between
uplink local and downlink whole body exposures in
operating Networks IEEE Transactions on EMC Vol 52
ndeg4 Nov 2010
Document ID D26 Global Wireless Exposure Metric DefinitionFP7 Contract ndeg318273
Version V4 46Dissemination level PU
[HoTo11] Hola HG And Toskala A LTE for UMTS Evolution to
LTE-Advanced Wiley UK 2011
[INFORMA12] Informa telecom amp Media Small Cell Market Update June
2012
[INSEE11] Insee enquecircte Emploi du temps 2009-2010 Insee
Premiere Ndeg 1377 November 2011
[IST] httpwwwist-winnerorg
[KALLIOLA02] Kalliola K Sulonen K Laitinen H Kiveks O Krogerus J
Vainikainen P Angular power distribution and mean
effective gain of mobile antenna in different propagation
environments IEEE Trans Veh Technol vol 51 pp 823ndash
838 2002
[KIENTEGA11] Thierry Kientega EConil A Gati A Hadjem ERichalot M-F Wong OPicon Joe Wiart Analysis of thedistribution of specific absorption rate induced by fiveplane waves with a fast and new method in VisibleHuman URSI conference 2011
[LAUER13] Lauer O Frei P Gosselin M C Joseph W Roumloumlsli M
and Froumlhlich J Combining near- and far-field exposure for
an organ-specific and whole-body RF-EMF proxy for
epidemiological research a reference case
Bioelectromagnetics vol 34(5) pp 366-74 2013
[LEXNET D21 2013] Vermeeren G Thielens A Aerts S Joseph W
Martens L Oliveira C Mackowiak M Correia LM
Pejanovic-Djurisic M Veljovic Z Nešković A
Koprivica M Gati A Varsier N Hadjem A Wiart J
ConilE ldquoD21 Current metrics for EMF exposure
evaluationrdquo LEXNET project April 2013
[LEXNET D22 2013] Wiedemann P M Freudenstein F ldquoD22 Risk and
exposure perceptionrdquo LEXNET project July 2013
[LEXNET D23 2013] Vermeeren G Plets D Joseph W Martens L Conil E
Varsier N Wiart J Corre Y Oliveira C Sebastiatildeo D
Correia LM Aguumlero R Diez L Rodriacuteguez L Koprivica
M Nešković A Popović M Milinković J Nikšić S ldquoD23
Scenariosrdquo LEXNET project November 2013
[LEXNET D24 2013] Conil E ldquoD24 Global Wireless Exposure Metric
Definitionrdquo LEXNET project October 2013
Document ID D26 Global Wireless Exposure Metric DefinitionFP7 Contract ndeg318273
Version V4 47Dissemination level PU
[LEXNET D32 2014] BoriesS (ed) ldquoD32 Wideband dosimeter design study amp
performances characterizationrdquo LEXNET project July
2014
[LEXNET D41 2013] Bories S Fang Y Brown TBegaud X Pinto Y Ciblat P
Ksairi N De Domenico A Clemente A Fernandez Y
Lalam M Masera E Wilson M Tesanovic M Kocan E
Pejanovic-Djurisic M Veljovic Z Milatović B Popović M
Nešković A Koprivica M Voinescu A Dragomir D
Slusanschi E laquo D41 Promising Low Exposure Index
Solutions for Components and Transmission
Techniques raquo LEXNET project November 2013
[LEXNET IR21 2013] ldquoNumerical toolsrdquo LEXNET project July 2013
[LEXNET IR51 2013] ldquoSmart low-EMF architectures state of the art and way
forwardrdquo LEXNET project May 2013
[LEXNET D25 2014] Wiedemann P M Freudenstein F ldquoD25 Risk and
exposure perceptionrdquo LEXNET project November 2014
[LEXNET D42 2014] Bories S Fang Y Brown TBegaud X Pinto Y Ciblat P
Ksairi N De Domenico A Clemente A Fernandez Y
Lalam M Masera E Wilson M Tesanovic M Kocan E
Pejanovic-Djurisic M Veljovic Z Milatović B Popović M
Nešković A Koprivica M Voinescu A Dragomir D
Slusanschi E laquo D42 Performance Evaluation of Low
Exposure index solutions for components and
Transmission Techniques raquo LEXNET project November
2014
[MaOC12] Mackowiak M Oliveira C and Correia L M RadiationPattern of Wearable Antennas A Statistical Analysis of theInfluence of the Human Body International Journal ofWireless Information Networks Vol 19 No 3 pp 209-218 2012
[MaCo13] Mackowiak M and Correia L M Statistical Model of theInfluence of Body Dynamics on the Radiation Pattern ofWearable Antennas in Off-Body Radio ChannelsWireless Personal Communications 101007s11277-013-1193-x May 2013
[Mack13] Mackowiak M Modelling MIMO Systems in Body AreaNetworks in Outdoors PhD Thesis IST - University ofLisbon Lisbon Portugal 2013
Document ID D26 Global Wireless Exposure Metric DefinitionFP7 Contract ndeg318273
Version V4 48Dissemination level PU
[NAGAOKA08] Nagaoka T and Watanabe S Postured voxel-based
human models for electromagnetic dosimetry Physics in
medicine and biology vol 53 pp 7047-7061 2008
[PLETS12] Plets D Joseph W Vanhecke K Tanghe E and Martens
L 2012 Coverage Prediction and Optimization Algorithms
for Indoor Environments EURASIP 2012123
[PLETS14] Plets D Joseph W Aerts S Vanhecke K and Martens L
accepted 2014 Prediction and comparison of downlink
electric-field and uplink localized SAR values for realistic
indoor wireless planning Radiation Protection Dosimetry
[SaNC10] SaloJ Nur-AlamM and ChangK Practical Introduction
to LTE Radio Planning white paper European
Communications Engineering (ECE) Ltd Espoo Finland
Nov 2010 (wwweceltdcom)
[TAFLOVE00] Taflove A and Hagness S C 2000 Computational
Electrodynamics The Finite-Difference Time-Domain
Method 2nd edn (Boston MA Artech House Publishers)
[TNS10] TNS Sofres survey Observatoire Socieacutetal du teacuteleacutephone
mobile Dec 2010
[VAJM13] Vermeeren G Aerts S Plets D Joseph W Martens
LConil E Varsier N Wiart J Core YOliveira C Sebastiatildeo
DCorreia L Aguumlero R Diez L Rodriacuteguez L Koprivica M
Nešković A Popović M Milinković J Nikšić S D23
Scenarios LEXNET project Novembre 2013
[WIART08] Wiart J Hadjem A Wong M F and Bloch I Analysis of
RF exposure in the head tissues of children and adults
Physics in medicine and biology vol 53 pp 3681-3695
2008
[WINNER D112 2007] Kyoumlsti P et al D112 WINNER II Channel models
WINNER project September 2007
[ZHAO02] Zhao X Kivinen J Vainikainen P Skog K Propagation
characteristics for wideband outdoor mobile
communications at 53 GHz IEEE J Sel Areas Commun
vol 20 pp 507ndash514 2002
Document ID D26 Global Wireless Exposure Metric DefinitionFP7 Contract ndeg318273
Version V4 49Dissemination level PU
APPENDIX 1 NUMERICAL DOSIMETRIC SIMULATIONS
This appendix describes the main assumptions concerning the frequency bands used
in the numerical dosimetric simulations
Table A1 gives the frequency bands used for SAR simulations as well as theservices and DLUL frequencies considered in each of those frequency bands forLEXNET studies Note that at these frequencies (especially at the higher ones) nolarge differences are expected between SAR results [CHLWW08] Accordingly forthe sake of simplicity it is assumed that
the same frequency band is assumed for both up- and down-link each frequency band may cover more than one system (eg simulation at
1940 MHz covers both GSM1800 and UMTS2000)
Table A1 Technical specifications for LEXNET selected services
SAR
simulation
frequency
band [MHz]
RAT
RAT frequency band [MHz]
DL UL
400 LTE 400 380 - 470
900
LTE 800 875- 885 830 - 840
GSM 900 935 - 960 890 - 915
UMTS 900 925 ndash 960 880 ndash 915
1940
GSM 1800 1805 - 1880 1710 - 1785
UMTS 2000 2110 - 2170 1900 - 1980
2600WiFi bgn 2400 - 2484
LTE 2600 2620 - 2690 2500 - 2570
For the WiFi an between 5470 and 5725 MHz frequency bands no SAR simulation
was performed yet
Document ID D26 Global Wireless Exposure Metric DefinitionFP7 Contract ndeg318273
Version V4 50Dissemination level PU
APPENDIX 2 INTERNAL REVIEW
Reviewer 1 Yoann Corre Reviewer 2 Mick Wilson
Answer Comments Type Answer Comments Type
1 Is the deliverable in accordance with
(i) the Descriptionof Work
Yes
No
M
m
a
Yes
No
M
m
a
(ii) the internationalState of theArt
Yes
No
M
m
a
Yes
No
M
m
a
2 Is the quality of the deliverable in a status
(i) that allows tosend it to EC
Yes
No
M
m
a
Yes
No
M
m
a
(ii) that needsimprovement ofthe writing bythe editor of thedeliverable
Yes
No
See proposedenhancements
In particular thepresentation of the basic EIconcept could be improvedin the Abstract Introductionsection 21 and Conclusion
M
m
a
Yes
No
See comments onSection 3
M
m
a
(iii) that needsfurther work bythe partnersresponsible forthe deliverable
Yes
No
Mostly minor changes Seethe proposedenhancements
Section 44 is a copy-pastof a whole section in D33Either D26 or D33 must bechanged to avoidredundancy (replacing thewhole description by asummary adapted to theintegrated deliverable)
It must be made more clearwhere the reader will findthe missing SAR data andthe announced uncertaintystudy results
M
m
a
Yes
No
M
m
a
Type of comments M = Major comment m = minor comment a = advice
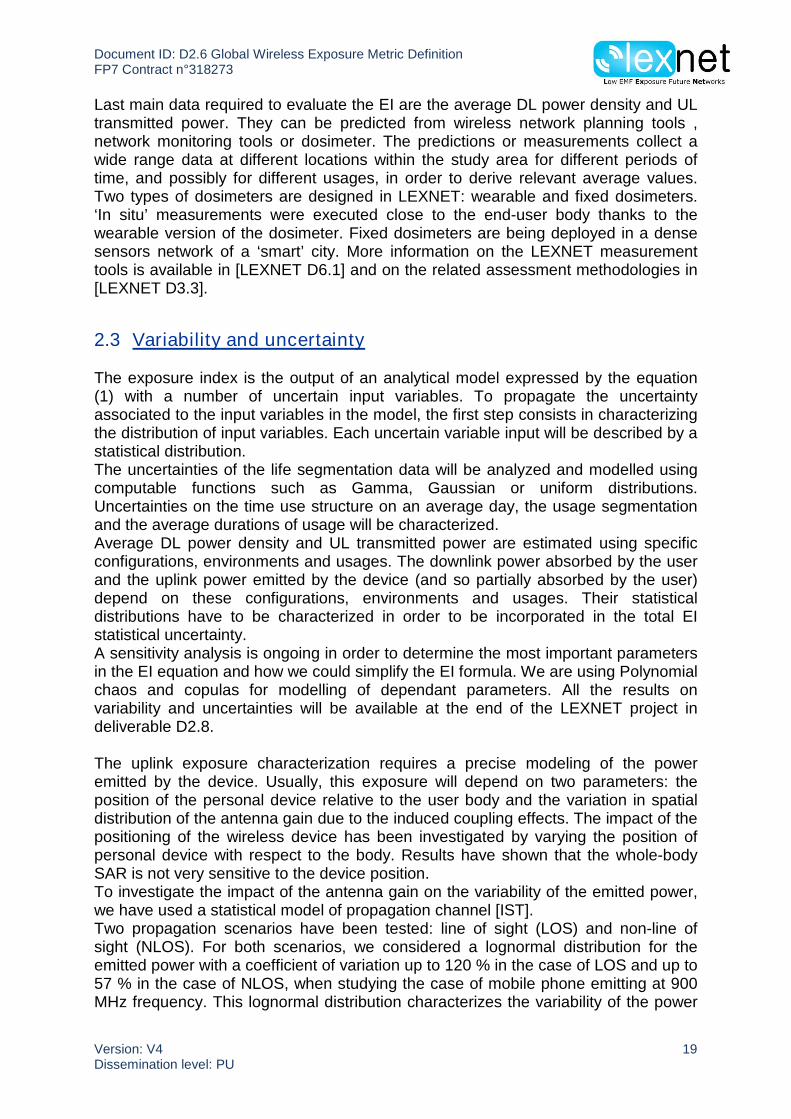
Document ID D26 Global Wireless Exposure Metric DefinitionFP7 Contract ndeg318273
Version V4 23Dissemination level PU
32 Reducing the EMF exposure using the EI
321 Lower layer solutions a common methodology to use the EI
The EI is a relevant global metric for evaluation of radio technologies performances interm of exposure reduction However WP4 has identified some difficulties to directlyaddress the global calculation To reach this global evaluation target WP4 hasadopted a specific and indirect methodology described in [LEXNET D42 2014]deliverable and synthesised in the following Despite a large diversity of technicaldomains whatever the scenario or the Radio Access Technologies (RAT) a singlestrategy to organize and align the different WP4 exposure evaluations is proposed Afive steps methodology has been established in order to evaluate and harmonize theoverall exposure improvement for each technology These steps also attempt toprovide the basis for future global exposure reduction evaluation in order todetermine the most promising WP4 techniques based on fair and relevantcomparisons
The first step is to identify how the individual WP4 techniques contribute towards theoverall LEXNET use case scenarios from WP2 Specifically for WP4 evaluations foursub-scenarios have been introduced (Macro-Cell Small-Cell Rural and WSN ampWiFi) (Step-1a) This sub-scenario categorization highlights which solutions arecomplementary and which will require further analysis to determine potential conflictsIn order to harmonize the evaluations from the studies of different solutions it iscrucial to describe properly and extensively each assumption and the inputparameters values related to the context study (Step-1b)
A limited numbers of Key Performances Indicators (KPI) for the exposure and for theQoS are used in the evaluation of each WP4 technique The step-2 has to clearlyidentify the KPIs being addressed by individual technique exploration It is taken asmore convenient to work with one of the following three simpler metrics or KPIsderived from the EI formula and addressing UL exposure
The first metric is the Specific Absorption Rate (SAR l mTx ) which describes the
amount of EM energy absorbed into the userrsquos body via the spatial distributionof the EM field from the source Thus SAR is particularly relevant for antennasolutions
The second metric is the mean duration of exposure (UL
kjit ) which indicatesthe amount of time the user is exposed It impacts the EI which is defined as adose For example the duration is impacted by the amount of transmitted dataReduced retransmission improved interference management and signalingreduction strategies are all ways of decreasing this metric The duration usedto calculate the mean is selected regarding the time constant of the studiedtechnique
The third metric is the mean transmitted power ( TxP ) during the considered
mean exposure duration As an example a 1 dB improvement on the receivingsensitivity at the Base Station (BS) could be converted in a 1 dB reduction ofthe transmit power at the User Equipment (UE) Again the duration used tocalculate the mean is selected regarding the time constant of the studiedtechnique
Document ID D26 Global Wireless Exposure Metric DefinitionFP7 Contract ndeg318273
Version V4 24Dissemination level PU
Notice that an equivalent set of three metrics adresses the DL
The step-3 concerns the evaluation itself of a partial EI ratio in comparison with abaseline scenario that is to say without implementing the studied solution Theexposure reduction is evaluated through the calculation of an EI ratio by comparingthe lsquoafter LEXNETrsquo versus the lsquobefore LEXNETrsquo (ie SotA or standard) baselineconfigurations (Eq 4) The main advantage of the proposed approach is that in mostof the presented solutions the three KPIs are independent from each other Byconsidering a given sub-scenario and depending whether the UL or the DL is studiedthis means that if a solution succeeds in decreasing the selected single KPI the twoothers will stay constant when the solution is implemented or not Thus in thatspecific sub-scenario the EI ratio is equal to the selected KPI ratio (Eq 5) Thisexposure metric is easily matched with a typical RF front-end or PHY layer evaluationstudies
(4)
This formula is simplified when a specific sub-scenario is considered
(5)
Where
partialEI is the Exposure Index for a specific sub-scenario
partialKPI is the identified metric among the three detailed in step 2
the subscript lsquow LEXrsquo correspond to the Lexnet solution implementationthe subscript lsquowo LEXrsquo correspond to the SotA or baseline (without the solutionimplementation)
Meanwhile the selected QoS metric is also evaluated with and without LEXNETsolution
The step-4 aims to ensure that capacity or QoS improvements are converted intoexposure reduction It is worth reminding that the objective of LEXNET studies is toreduce exposure without impacting QoS
At last the step-5 estimates the absolute global EI reduction from the previous stepsrsquopartial EI results throught the 24 hours LEXNET reference scenario The so-calleddilution factor [LEXNET D41 2013] is taken into account during this step-5 Theusage statistics from WP2 are used to weight the calculated partial EI reduction inorder to assess the global EI reduction for a given solution
To conclude a scheme summarizes the WP4 common EI evaluation methodology inFigure 8 This process is sufficiently generic to be applied by any of the WP4proposed solutions and examples of its step by step application can be found in[LEXNET D42 2014]
100LEXwoEI
LEXwoEI-LEXwEI()Ratio
partial
partialpartial
EI
100LEXwoKPI
LEXwoKPI-LEXwKPI()Ratio
partial
partialpartial
EI
Document ID D26 Global Wireless Exposure Metric DefinitionFP7 Contract ndeg318273
Version V4 25Dissemination level PU
Figure 8 Common EI evaluation methodology for WP4 techniques
322 Upper layer and resource management techniques
By introducing and promoting the EI as a new planning metric LEXNET intendsamong other objectives to help reduce local town planning objections to applicationsfor installing new base stations Work carried out by LEXNET WP5 so far hasdemonstrated that real-time EMF-aware network management strategies depend oncurrent traffic load radio conditions mobility application used and the duration ofuse available networks and UE capabilities Since EI calculations take into accountlong-term network statistics distributions of user profiles and habits (services usedetc) times of day period of year etc EI itself may therefore be better suited for initialnetwork design and AP placement while other metrics may be better suited for real-
Document ID D26 Global Wireless Exposure Metric DefinitionFP7 Contract ndeg318273
Version V4 26Dissemination level PU
time EMF management Clearly a link between these proxy-metrics and long-term EIvalues is needed The underlying assumption is that if we try to reduce the level ofEMF by applying correct general policies and additionally control it on a smaller time-scale (eg seconds or minutes) with fast-loop control then the overall exposure andthe EI (defined on daily level) will decreaseFast-loop (event-based) EMF control would be a response to a temporary change ofconditions This kind of control requires triggers ie thresholds that can be assessedon near-real-time scale ndash this time scale may not be as granular as for power controlFor fast-loop control offload techniques may be used as for general strategy butalso other strategies such as changing codecs delaying transmission etc Fast-loopcontrol without using triggers would be periodic optimization on a smaller time-scaleProxy metrics to be used for fast-loop control involve data that may be collected fromthe network and include
bull Measurements (UL Tx power RSSI RSCPhellip)
bull User context velocity services used profile
bull Statistics cell statistics (traffic load) etc
Some preliminary results using various proxy metrics which illustrate the pointsabove are shown hereFigure 9 shows live network measurements illustrating that available cellulartechnologies and current traffic conditions are two of the main points to be taken intoaccount when designing low-EMF solutions The metric used here is the UL Txpower The same metric is used in Figure 10 and Figure 11 which show that the typeof service could increase the exposure (based on UL Tx power) meaning thatdifferent strategies should be used to identify the best connectivity according to theservice flow requested The actual UL Tx power values can then be used in EIcalculations
Figure 9 Comparison of different 2G3G cells in high load hours by UE Tx power
Document ID D26 Global Wireless Exposure Metric DefinitionFP7 Contract ndeg318273
Version V4 27Dissemination level PU
Figure 10 Comparison of UL FTP and voice services over 2G3G cells in high load hours by UE Txpower
Figure 11 Comparison of voice service over 3G and voice service using Skype over 3G network
Another common proxy with direct link to EI is the DL power density Figure 12 showshow DL power density and UL transmit power vary for different ISD values in an LTEnetwork Based on these simulations it can be seen that small-cell densification inurban areas allows for significant exposure reduction which now needs to betranslated into the EI using various assumptions on user distributions and type ofusage
Document ID D26 Global Wireless Exposure Metric DefinitionFP7 Contract ndeg318273
Version V4 28Dissemination level PU
Figure 12 DL power density and UL transmit power for different ISD values
Whole-body SAR is another proxy metric whose statistical processing can leaddirectly to EI calculations As an example of SAR values obtained by a tooldeveloped for the prediction of whole-body and localized SARs and absorbed dosesfor indoor wireless network deployments in Figure 13 we show distributions for thetraditional deployment (top) and for the WP5 exposure-optimized deployment
Figure 13 Whole-body SAR_DL (distribution for the traditional deployment (top) and for the exposure-optimized deployment (bottom)
Document ID D26 Global Wireless Exposure Metric DefinitionFP7 Contract ndeg318273
Version V4 29Dissemination level PU
4 EXAMPLES OF APPLICATION
41 Computing chain
In this section three simplified examples of EI computation are detailed In no casethese examples are representing the completeness of the possibilities that can becover by the EI but they illustrate the process of computation
The first two examples illustrate the use of network planning tools in the evaluation ofthe EIThe first example detailed in the section 42 consists in comparing two indoor officescenarios first with wireless communication offered by only 3G outdoor macro basestations scenario and secondly with an additional 3G femtocell (Table 6)
Scenario 1
Time PopulationUser
ProfileEnvironment RAT Cell Type Posture Usage
1h inthe
afternoon
Adults Heavy Indoor 3G Macro Standing Voice mobile
Medium Datamobile
Light Data Tablet
Nonuser
Data Laptop
Scenario 2
Time PopulationUser
ProfileEnvironment RAT Cell Type Posture Usage
1h inthe
afternoon
Adults Heavy Indoor 3G Femto Standing Voice mobile
Medium Datamobile
Light Data Tablet
Nonuser
Data Laptop
Table 6 input variables for the 3G indoor sub-scenarios described in section 42
The second example detailed in section 43 is considering a data LTE macro urbanscenario (Table 7)
Time PopulationUser
ProfileEnvironment RAT Cell Type Posture Usage
Day Youngpeople
Moderate Indoor 4G Macro Standing Data mobile
Document ID D26 Global Wireless Exposure Metric DefinitionFP7 Contract ndeg318273
Version V4 30Dissemination level PU
Night Adults Non user Outdoor Sitting Data mobile
Seniors Data Tablet
Table 7 input variables for the LTE scenario described in section 43
The last example detailed in section 44 illustrates the use of dosimetermeasurements in the EI evaluation It is considering a macro outdoor LTE scenariowhere one user is wearing a dosimeter
42 Indoor exposure from 3G macro and femto-cells
The EI was evaluated for two scenarios considering the exposure of people locatedindoor The population consisted of adults making UMTS (phone calls with thephone on the right side of the head The scenario 1 is considering a macrocellconnection and the scenario 2 an indoor small cell connection Different user profilesare considered
10 heavy users 30 s usage 50 moderate users 10 s usage 25 light users 3 s usage 15 no usage 0 s usage
For the calculation of the EI several input parameters are needed reference SARvalues averaged transmitted power valuesത and averaged incident power densityvalues inc (see Table 8)The power (density) values that were used for the indoor macrocell scenario arederived from measurements in an office building (Zuiderpoort building GhentBelgium) [PLETS14] Figure 14 shows the considered buildingFor the indoor femtocell scenario accurate power (density) values from the WHIPPtool a heuristic indoor network calculator and planner [PLETS12] were used In theconsidered building a femtocell with an Equivalent Isotropically Radiated Power(EIRP) of 7 dBm is installed A different femtocell EIRP can lead to a largely differentEI Reference SAR values were taken from [LAUER13] and applied to the scenariosfor an adult standing using the phone on the right side of the head Since the
measured macrocell values (RXinc and Pഥଡ଼) were not recorded in the smaller andmore enclosed central areas of the building floor (toilets kitchen shedhellip) femtocellpredictions were limited to the non-shaded areas around the center in Figure 14 Forthe femtocell values locations within 50 cm of the base station are discardedassuming that people stay at least half a meter away from base stations For thesimulations a sub-scenario is also considered for which a 20 dB worse macrocellconnection is assumed for the same building floor This could correspond to abuilding with a penetration loss that is 20 dB higher than before or a building which islocated further from the macrocell base station (path loss increase of 20 dB) Table 8
shows that the assumed Pഥଡ଼ RXinc values in case of a lsquoworse connectionrsquo areindeed 20 dB higher lower
Document ID D26 Global Wireless Exposure Metric DefinitionFP7 Contract ndeg318273
Version V4 31Dissemination level PU
Figure 14 Ground plan of the considered floor (90 m x 17 m) of the office building that is simulatedFemtocell base station location is indicated with purple hexagon
Scenario 1Macro indoor
Scenario 2Femto indoor
௨ܣ 0003 Wkg 0003 Wkg
௨ܣ 000495 Wkg 000495 Wkg
ത 26610-5 W 28510-7 W
ത(worse connection) 26610-3 W 28510-7 W
RXinc81510-8 Wmsup2 51810-6 Wmsup2
RXinc(worse connection) 81510-10 Wmsup2 51810-6 Wmsup2
Table 8 Reference SAR values and average transmitted power and observed power densityvalues
In the following the results for the different indoor scenarios are discussedFigure 15 (a) compares the EI for scenarios 1 and 2 for the indoor office buildingFrom an exposure-point-of-view the indoor femtocell scenario (scenario 2 EI =158E-8 Wkg) is a factor 28 worse than the indoor macrocell scenario (scenario 1 EI= 564E-10 Wkg) The main EI contribution in scenario 2 is the high DL exposureoriginating from the femtocell (155E-8 Wkg) The scale in Figure 15 (a) has beenadjusted the bar that represents the DL femto indoor contribution is in reality 44times the length of the Y-scaleThere are several reasons why the installation of a femtocell is not beneficial in thiscaseA first reason is that the EI contributions of the macrocell are almost equal for UL andDL which is optimalA second reason is that the femtocell EIRP is chosen quite high (7 dBm) despite thegood macrocell connection (average value of -6925 dBm) still 77 of the DL fieldsare higher in the femtocell caseA third reason is that a femtocell installation has the disadvantage that observedpower densities on a building floor due to a femtocell base station are lesshomogeneously distributed than fields due to a (more distant) macrocell base stationAs people are assumed to ndash on average- reside an equal time at each location on thebuilding floor (except shaded areas and locations closer than 50 cm from the BS)locations close to the femtocell contribute a lot to the EI When people approach afemtocell the absorbed exposure dose increases in a more-than-linear wayMacrocell base stations have the advantage that ULDL fields are morehomogeneously distributed over the building floor It should also be noted that thehigher the UL usage the more the femtocell scenario will benefit compared to themacrocell scenario (lower EI) However in the considered case the UL usage timeswould have to increase by a factor 48 to yield a total EI (macrocell scenario 1) that isequal to the EI of scenario 2 (femtocell scenario EI = 158E-8 Wkg)
Document ID D26 Global Wireless Exposure Metric DefinitionFP7 Contract ndeg318273
Version V4 32Dissemination level PU
We also studied a second case where a less favourable macrocell case isconsidered (lsquoworse connectionrdquo) It is assumed that the connection with the macrocellbase station is now 20 dB worse than in the previous case Figure 15 (b) comparesthe EI for the macrocell and femtocell deployments Due to the worse connection(average received macrocell DL power of -8925 dBm) the macrocell EI is nowcompletely determined by the UL contribution (320E-8 Wkg) and the femtocellscenario (scenario 2 EI = 155E-8 Wkg) has an EI that is 48 of the macrocell EIwhich makes it preferable over the macrocell deployment Moreover the observedpower densities due to the femtocell are higher than the macrocell power densities atall locations (better QoS)It can be concluded that the installation of femtocell is not always recommended forshorter UL usage times andor better macrocell connection qualities it could beadvised to rely on the existing macrocell infrastructure Also when installing afemtocell its EIRP should be adjusted to the size and physical properties of thebuilding and should not be set at a needlessly high value
(a) (b)Figure 15 Comparison of the contributions to the whole-body EI for (a) indoor scenarios 1 and 2 in theconsidered building (b) indoor scenarios 1 and 2 in this building with 20 dB worse connection qualityTotal EI levels for each scenario are indicated with the horizontal line EI values are shown in Wkg
43 Data LTE macro urban scenario
431 Input variables linked to the network
The EI is evaluated from a macro-cellular LTE network in a real geographical area ndashpart of the 7th district of Paris (see Figure 16) The proposed scenario was previouslydefined in frame of the French ANR project ECOSCells [BCL12] and the EuropeanFP7 project FREEDOM (httpwwwict-freedomeu) for the simulation and analysis ofheterogeneous network topologies (hetNet) It is based on a real environment usingHigh Resolution (HR) map data realistic BSUE deployments and deterministicpropagation models
The macro layout is organized as three rings around a central three-sector sitemacro base stations being deployed with an inter-site distance of about 450 m in ahexagonal manner as shown in Figure 16
Document ID D26 Global Wireless Exposure Metric DefinitionFP7 Contract ndeg318273
Version V4 33Dissemination level PU
Figure 16 View of the macro-cell hexagonal deployment in the area
The study area (ie area where network performance is evaluated) is limited to thesurface covered by the three co-located central macro-cells and the first ring (Figure17) Thus the study area is equivalent to 12 macro-cells The base stations outsidethis study area are included in simulations to generate an accurate interferencepattern
Figure 17 Study area composed of 12 macro sites localised in the 7th
district of Paris France
Document ID D26 Global Wireless Exposure Metric DefinitionFP7 Contract ndeg318273
Version V4 34Dissemination level PU
The positions and heights of the base stations have been selected in realisticapproach sites are placed on slightly dominant rooftops and sector antennas aredistributed at the rooftop edges Directive antennas are used (with 3GPP radiationpattern) Each site is composed of three sectors oriented in azimuth directions 0deg120deg and 240deg with down-tilt 6degUsers are assumed to be uniformly distributed in the study area an indoor ratio setsthe percentage of users located inside buildings at the ground floorThe specifications of input parameters are summed up in Table 9
Environment Typical European Dense Urban environment (Paris VII district France)
System
Downlink (DL) and Uplink (UL)
LTE FDD 2 x 10 MHz
Central frequency 2600 MHz
Macro layout
Hexagonal sitedeployment
37 sites corresponding to 83 macro cellsincluding 12 sites in the center of the studyarea Inter-site distance (ISD) of 450 m
Nominal transmitpowerEPRE
40 W 228 dBm
AntennaDirectional with 14 dBi gain 6deg electric down-tilt 2 antennassector Average antennaheight 30 m above ground
Noise figure 25 dB
UL power control (openloop)
Path loss compensation factor 1SINR target 208 dB
UserEquipment
MaxMin transmit power 23 dBm -40 dBm
AntennaOmni-directional with 0 dBi gain 2antennasuser device Antenna height 15 mabove ground
Noise figure 9 dB
User traffic
Average active userdensity
Depends on daynight
DistributionUniform spatial distribution within thesimulation area Single floor (at 15 m height)No user mobility
Table 9 Inputs in SIRADEL simulator
432 Input variables linked to the population
Category of population
The population density of the 7th District of Paris was estimated at 14 36050
inhabitants per kmsup2 in 2009 [Carte09]
We are considering the population above 15 years old
Given the population distribution by age (Figure 18) it was decided to divide the adult
population into 3 categories young people (between 15 and 29 years) adults
Document ID D26 Global Wireless Exposure Metric DefinitionFP7 Contract ndeg318273
Version V4 35Dissemination level PU
(between 30 and 59 years) and seniors (over 60 years) Table 10 shows the
percentages of people in each category
Figure 18 Population distribution by age in Paris 7th district in 2007
Population category Pourcentage(prop)
Adults (30-59 yo) 45
Young people (15-29 yo) 26
Seniors (+60 yo) 29
Table 10 Number of people in each population category
Time periods
A 24-hour day is divided into two periods the day from 8 am to 6 pm (10 hours in
total) and the night from 6 pm to 8 am (14 hours in total)
Environment
Time spent indoor or outdoor on an average day for each category is extracted from
Table 2
Usage
Only data traffic is considered The device is assumed to be a mobile phone whilethe user is in a standing posture Considering the existence of 4 telecom operators inFrance only 25 of the 7th district population is assumed to be using this LTE macronetwork In this example we consider two user profiles moderate user and non-userFor each population category we derived from [Bigot et al 2013] the proportions ofusers and non-users of mobile phones for data traffic (see Table 11)
User profileYoung people (15-29
yo)Adults (30-59 yo) Seniors (over 60 yo)
non-users 33 57 91
Document ID D26 Global Wireless Exposure Metric DefinitionFP7 Contract ndeg318273
Version V4 36Dissemination level PU
users 67 43 9Table 11 Repartition of users and non-users for each population category
For simplicity the parameters for the moderate user profile are applied to all userswe assume a daily data traffic per active user of 66 MB [CISCO13] a DLUL ratio of9010 (this ratio was evaluated from data collected through measurements ofKPIs by sensors inside the French Orange network) and a daynight ratio of4357 From [CISCO13] only 29 of connections in 2013 were on 4GReference SAR values were extracted from Table 4 and Table 5
433 Transmitted power ഥ and received power density ത calculationܖ
Incident ோpower densities and transmittedത powers were calculated by usingthe network planner simulation tool Volcano Suite (Siradel France)Figure 19 andFigure 20 illustrate respectively the average UE Tx power calculated over the 7thParis district during the day and the average incident power density evaluated duringthe day or the night (values during the day or the night time were quasi identical)
Figure 19 Map of the average UL Tx power (dBm) calculated indoor at ground floor and outdoorduring the day (on the left) and map of daily average transmission duration (s) (on the right)
Figure 20 Map of the average DL incident power density (dBμVm) calculated indoor at ground floor and outdoor during the day or the night
Because the average active LTE user density is very low (41 userskm2consequence of the 29 LTE connections assumption) the DL user traffic utilises
Document ID D26 Global Wireless Exposure Metric DefinitionFP7 Contract ndeg318273
Version V4 37Dissemination level PU
less than 1 of available resources which strongly impact the predicted DL incidentpower density We can see in Figure 19 (left figure) that the calculated average Txpower is minimum in outdoor areas in the vicinity of the base stations or in Line ofSight (LOS) while it is at a maximum indoors and outdoors far away from the basestations The right map in Figure 19 gives the average communication durationwhich directly impacts the calculation of the UL exposure contribution The better thelink performance is the higher the throughput and thus the longer thecommunication duration That is why the longest durations are observed indoors andparticularly in the building parts that suffer from the strongest propagation lossesFigure 20 shows that the strongest DL incident power density levels are predicted inLOS areas while much lower levels are observed inside the buildings where mostpopulation is located
434 Exposure index calculation
Aggregating everything we obtain the following value for the EI (based on the Whole-body SAR) of the over 15 years old population of the 7th district of Paris consideringa macrocell LTE network EIWBSAR = 31910 -7 Wkg
44 Using dosimeters for the EI evaluation
This section provides an evaluation of the downlink and uplink exposure indexes fora subject wearing a reference isotropic dosimeter on the head together with fivedosimeters at different locations of the body as well as two mobile terminals Thesubject is moving in a multipath environment including a 3-sector LTE base station
When modelling the radio link between the user devices and the base station oneconsiders the influence of the body (ie body coupling [MaOC12] and bodymovements (using realistic body motion capture tools [MaCo13]) and accounts forthe propagation environment using a geometrically based statistical channel (GBSC)model (ie multipath propagation) Therefore the modelling of the radio channel hasbeen separated into several steps as described in [Mack13] Figure 21
Document ID D26 Global Wireless Exposure Metric DefinitionFP7 Contract ndeg318273
Version V4 38Dissemination level PU
Figure 21 Model for EMF assessment from dosimeter data
The simulated scenario Figure 22 considers a reference isotropic dosimeter on thehead of the user (simulating the real body exposure) together with five wearabledosimeters These dosimeters allow the downlink exposure assessment The user isalso carrying two mobile terminals allowing to assess the uplink exposure
Figure 22 Placement of wearable dosimeters and mobile terminals on the body
For the downlink the received (Rx) power ோ௫ at the mobile terminal (ordosimeter) is calculated from
ோ௫[ౚ ]= ௌ[ౚ ]
minus ௧௧[ౚ]ܮ (6)
where ௌ base station (BS) transmitted (Tx) power ௧௧ܮ total path loss including gains of mobile terminal (or
dosimeter) and BS
The received power density ோ௫ at the mobile terminal (or dosimeter) iscalculated from
ோ௫ ୫ మ൧=
ோ௫[ ]
ܣ మ൧
(7)
where ܣ is the mobile terminal antenna effective area
ܣ ୫ మ൧=ଶ[ߣ ]
ߨ4ோ௫[ౚഠ]ܩതതതതതതതതത (8)
where wavelength ோ௫തതതതതܩ average gain of the receiving antenna (ie dosimeter probe) in
off body direction (eg half-hemisphere of the gain pattern ieߠ isin [minus9090]deg and isin [minus9090]deg)
ோ௫[ౚഠ]ܩതതതതതതതതത=
1
ఏఝ ோ௫[ౚ]ܩ
ߠ) )
ேക
ୀଵ
ேഇ
ୀଵ
(9)
where ఏ and number of elevation (ߠ) and azimuth () directions
The exposure index for the DL ܫܧ can be determined from [LEXNET D24 2013]
Document ID D26 Global Wireless Exposure Metric DefinitionFP7 Contract ndeg318273
Version V4 39Dissemination level PU
[୩]ܫܧ = ௪ܣ
|ଵ ୫ మ[୫ మ୩]
times ோ௫[ ୫ మ]times [ୱ]ݐ (10)
where ௪ܣ
|ଵ ୫ మ normalised whole body averaged SAR coefficient per
1 Wm2 of Rx power density as indicated in [LEXNET D24 2013] ݐ time of the exposure from BS
ோ௫ average Rx power density during period ݐ
For the uplink the required Tx power from the mobile terminal is determined from ௫[୫ ]
= ௌ[୫ ]+ ܫ ௧௧[]
+ ܯ [] + ௧௧[]ܮ (11)
where ௌ noise and interference level at the BS ܫ ௧௧ target SINR at the BS
ܯ fading margin for a dynamic usage ௧௧ܮ total path loss including gain of MT and BS
ௌ is calculated asௌ[୫ ]
= minus174[୫ ] + 10logଵ(ܤ[ୌ]) + ி[]+ []ܫ (12)
where ܤ bandwidth ி noise figure ܫ interference
The EI for the UL ܫܧ can be determined from [LEXNET D24 2013]
[୩]ܫܧ = ௪ܣ
|ଵ [ଵ୩]times ௫[ ]
times [ୱ]ݐ (13)
where ௪ܣ
|ଵ whole body averaged SAR coefficient per 1 W of Tx poweras indicated in [LEXNET D24 2013]
ݐ time of the exposure ( duration of the mobile terminal usage)
௫ average Tx power during period ݐ
A macro cell outdoor street scenario has been considered including a set of 10clusters of 3 scatterers each with a Uniform Distribution in the half space of anellipsoid A 3-sector base station antenna is located in the middle of the street atx=100 m The user is moving on a straight line in the middle of the street (ie y=10m xisin[50 150] m) Figure 23
Document ID D26 Global Wireless Exposure Metric DefinitionFP7 Contract ndeg318273
Version V4 40Dissemination level PU
Figure 23 Scenario
The parameters of the scenario are presented in Table 12 being worthwhile to noticethat the values of ௪ܣ
and ௪ܣ are taken from preliminary SAR simulations The
calculated noise and interference level at the BS is ௌ= -12774 dBm
System
Frequency [MHz] 2600
[HoTo11]ܤ
Resource Block [kHz] 15
Full [MHz] 20
Full LTE-A [MHz] 100
Downlink
EIRP BS Tx power [dBm] 46 [LEXNET D23 2013]
ோ௫ܩ [dBi] 122 [LEXNET D32 2014]
ݓܣ|ܮܦ
1Wm2[m2kg] 300
Uplink
ܫ ௧௧[dB] 208 [HoTo11]
ி [dB] 25 [LEXNET D23 2013]
[dB]ܫ 8 [HoTo11]
ܯ [dB] 30 [Mack13]
ݓܣ|ܮ
1W[1kg] 495
Table 12 Scenario overview
Figure 24 illustrates the considered macro cell base station antenna and thedosimeter realised gain patterns
(a) BS with 3 sectors (b) Dosimeter on the bodyFigure 24 Realised gain pattern
Document ID D26 Global Wireless Exposure Metric DefinitionFP7 Contract ndeg318273
Version V4 41Dissemination level PU
441 EI for downlink
The average Rx power density obtained from the isotropic reference probe and thedosimeter located at WA_L and WA_R is presented in Figure 25 The received powerdensity at WA_L dosimeter is very similar to the one gathered at the isotropic probewhich mainly comes from the similar Line-Of-Sight (LOS) propagation conditions Thepower received in WA_R dosimeter is much lower due to the body shadowing
Figure 25 Rx power density at selected positions
The distribution of the Rx power density is presented in Figure 26 In spite of thebody shadowing the distribution of the Rx power density at the WA_R dosimeter ismuch similar to the ones for the reference and the WA_L dosimeters All of themfollow an exponential decay which should be subject to further investigation
(a) isotropic (b) WA_L (c) WA_R
Figure 26 Rx power density histograms
The received power density and the downlink exposure index calculated based onthe measurement of the dosimeters located in the various locations on the body arepresented in Table 13
ோ௫ [mWm2] ܫܧ [mJkg]
isotropic 35868 2690
WA_F 18357 1377
WA_B 29538 2215
Document ID D26 Global Wireless Exposure Metric DefinitionFP7 Contract ndeg318273
Version V4 42Dissemination level PU
WA_L 28516 2138
WA_R 9060 680
TO_F 18436 1383
Table 13 Downlink Exposure
The WA_L dosimeter and the isotropic probe exposure indexes are very similarbecause of the LOS propagation conditions The same is valid for the WA_Bdosimeter which is also in LOS with the base station For the other dosimeters theexposure index is naturally lower due to the body shadowing In this scenario theuse of a wearable dosimeter in the front or in the right side of the body displays anexposure index reading about 4 times lower than the real user exposure
442 EI for uplink
The average Tx power from the mobile phone hold near HE_L and HE_R ispresented in Figure 27 The uplink power control is clearly noticeable by the highertransmitted power in HE_R as the mobile terminal adjusts the Tx power tocompensate for the higher channel fading
Figure 27 Tx power for straight6min scenario at 2600 MHz for LTE-A
The distribution of the Tx power at HE_L and HE_R is presented in Figure 28 Inspite of the different intensities HE_L and HE_R Tx powers present a similardistribution
Document ID D26 Global Wireless Exposure Metric DefinitionFP7 Contract ndeg318273
Version V4 43Dissemination level PU
(a) HE_L (b) HE_R
Figure 28 Tx power histograms
The average transmitted power and the uplink exposure index from the mobileterminals located near left and right side of the head ( e HE_L and HE_R) arepresented in Table 14
௫ [mW] ܫܧ [mJkg]
RB FULL FULL_A RB FULL FULL_A
HE_L mobile 002 165 827 003 295 1474
HE_R mobile 008 838 4191 014 1493 7468
Table 14 Uplink Exposure
These results show the importance of the propagation conditions in the EMFexposure Due to the non LOS conditions the exposure index in the right side of thehead is 5 times higher than the one on the left side
5 CONCLUSION
In this deliverable a global metric is defined to test and optimize wirelesstelecommunication networks in terms of EMF exposureThe proposed metric called Exposure Index (EI) has the advantage to overpass thelimitations of the actual metrics that in fact are managing separately the exposureinduced by personal devices and the one induced by the network equipment (basestations and access points) But devices base station antennas and access pointsare definitely parts of the same wireless environment and the global wirelessexposure is induced by all of them
The EI is described with an analytical model with input variables describing thecoverage area of interest the accessible networks the population and the habits interms of location and of wireless devices usage The output is the EI covering theday-to-day averaged exposure of population in a given area incurred by an entirewireless network from base stations and access points to individual devices
In this deliverable the analytical model of EI has been detailed and the inputvariables defined Then the use of the EI to minimize the EMF exposure in wirelesscommunication networks is presented in connection with work-package 4 dedicated
Document ID D26 Global Wireless Exposure Metric DefinitionFP7 Contract ndeg318273
Version V4 44Dissemination level PU
to innovative radio components and work-package 5 focused on networks topologiesand technologies
The way to process a complete calculation of EI is illustrated on three deterministicexamples The first example considers comparison of indoor 3G macro and femtoscenarios The second example is taking into account an adult population in a LTEmacro urban environment with their data usage specifications Both examples arebased on a real environment representation and network simulation tools have beenused to simulate the up and down links The third example illustrates how dosimetermeasurements can be used to assess the EI
In our further work the statistical description of input variables will enable topropagate the variability and the uncertainty in the EI model making it more accurateand reliable Results will be made available in the future deliverable D28 DeliverableD33 will detail the used methodology to assess the EI and for the last year of theproject the work of partners involved in WP6 will be enhanced as they will be incharge of the implementation and evaluation of the EI
Document ID D26 Global Wireless Exposure Metric DefinitionFP7 Contract ndeg318273
Version V4 45Dissemination level PU
6 REFERENCES
[ALIAGA06] Aliaga C How is the time of women and men distributed
in Europe Statistics in focus population and social
conditions April 2006
[APVJM13] Aerts S Plets D Verloock L Joseph W and MartensL Assessment and comparison of RF-EMF exposure infemtocell and macrocell scenarios Radiat Protec Dosim2013
[BCL12] Brau M Corre Y Lostanlen Y Assessment of 3D
network coverage performance from dense small-cell LTE
Communications (ICC) 2012 IEEE International
Conference on
[Carte09] httpwwwcartesfrancefr
[CISCO13] Cisco Visual Networking Index Global Mobile Data Traffic
Forecast Update 2012-2017 February 2013
[CHLWW08] ConilE Hadjem A Lacroux F Wong M F and Wiart J
Variability analysis of SAR from 20 MHz to 24 GHz for
different adult and child models using finite-difference
time-domain Phys Med Biol vol 53 pp 1511-1525
2008
[CHRIST10] Christ A Kainz W Hahn E G Honegger K Zefferer
M Neufeld E Rascher W Janka R Bautz W Chen
J Kiefer B Schmitt P Hollenbach H-P Shen J
Oberle M Szczerba D Kam A Guag J W amp Kuster
N The Virtual Family--development of surface-based
anatomical models of two adults and two children for
dosimetric simulations Phys Med Biol vol 55 pp 23-38
2010
[CMKB06] Cooper TG Mann SM Khalid M and Blackwell RP
Public exposure to radio waves near GSM microcell and
picocell base stations Journal of the Society for
Radiological Protection Vol 26 No 2 pp 199-211 June
2006
[GCWW10] Gati A Conil E Wong MF Wiart J Duality between
uplink local and downlink whole body exposures in
operating Networks IEEE Transactions on EMC Vol 52
ndeg4 Nov 2010
Document ID D26 Global Wireless Exposure Metric DefinitionFP7 Contract ndeg318273
Version V4 46Dissemination level PU
[HoTo11] Hola HG And Toskala A LTE for UMTS Evolution to
LTE-Advanced Wiley UK 2011
[INFORMA12] Informa telecom amp Media Small Cell Market Update June
2012
[INSEE11] Insee enquecircte Emploi du temps 2009-2010 Insee
Premiere Ndeg 1377 November 2011
[IST] httpwwwist-winnerorg
[KALLIOLA02] Kalliola K Sulonen K Laitinen H Kiveks O Krogerus J
Vainikainen P Angular power distribution and mean
effective gain of mobile antenna in different propagation
environments IEEE Trans Veh Technol vol 51 pp 823ndash
838 2002
[KIENTEGA11] Thierry Kientega EConil A Gati A Hadjem ERichalot M-F Wong OPicon Joe Wiart Analysis of thedistribution of specific absorption rate induced by fiveplane waves with a fast and new method in VisibleHuman URSI conference 2011
[LAUER13] Lauer O Frei P Gosselin M C Joseph W Roumloumlsli M
and Froumlhlich J Combining near- and far-field exposure for
an organ-specific and whole-body RF-EMF proxy for
epidemiological research a reference case
Bioelectromagnetics vol 34(5) pp 366-74 2013
[LEXNET D21 2013] Vermeeren G Thielens A Aerts S Joseph W
Martens L Oliveira C Mackowiak M Correia LM
Pejanovic-Djurisic M Veljovic Z Nešković A
Koprivica M Gati A Varsier N Hadjem A Wiart J
ConilE ldquoD21 Current metrics for EMF exposure
evaluationrdquo LEXNET project April 2013
[LEXNET D22 2013] Wiedemann P M Freudenstein F ldquoD22 Risk and
exposure perceptionrdquo LEXNET project July 2013
[LEXNET D23 2013] Vermeeren G Plets D Joseph W Martens L Conil E
Varsier N Wiart J Corre Y Oliveira C Sebastiatildeo D
Correia LM Aguumlero R Diez L Rodriacuteguez L Koprivica
M Nešković A Popović M Milinković J Nikšić S ldquoD23
Scenariosrdquo LEXNET project November 2013
[LEXNET D24 2013] Conil E ldquoD24 Global Wireless Exposure Metric
Definitionrdquo LEXNET project October 2013
Document ID D26 Global Wireless Exposure Metric DefinitionFP7 Contract ndeg318273
Version V4 47Dissemination level PU
[LEXNET D32 2014] BoriesS (ed) ldquoD32 Wideband dosimeter design study amp
performances characterizationrdquo LEXNET project July
2014
[LEXNET D41 2013] Bories S Fang Y Brown TBegaud X Pinto Y Ciblat P
Ksairi N De Domenico A Clemente A Fernandez Y
Lalam M Masera E Wilson M Tesanovic M Kocan E
Pejanovic-Djurisic M Veljovic Z Milatović B Popović M
Nešković A Koprivica M Voinescu A Dragomir D
Slusanschi E laquo D41 Promising Low Exposure Index
Solutions for Components and Transmission
Techniques raquo LEXNET project November 2013
[LEXNET IR21 2013] ldquoNumerical toolsrdquo LEXNET project July 2013
[LEXNET IR51 2013] ldquoSmart low-EMF architectures state of the art and way
forwardrdquo LEXNET project May 2013
[LEXNET D25 2014] Wiedemann P M Freudenstein F ldquoD25 Risk and
exposure perceptionrdquo LEXNET project November 2014
[LEXNET D42 2014] Bories S Fang Y Brown TBegaud X Pinto Y Ciblat P
Ksairi N De Domenico A Clemente A Fernandez Y
Lalam M Masera E Wilson M Tesanovic M Kocan E
Pejanovic-Djurisic M Veljovic Z Milatović B Popović M
Nešković A Koprivica M Voinescu A Dragomir D
Slusanschi E laquo D42 Performance Evaluation of Low
Exposure index solutions for components and
Transmission Techniques raquo LEXNET project November
2014
[MaOC12] Mackowiak M Oliveira C and Correia L M RadiationPattern of Wearable Antennas A Statistical Analysis of theInfluence of the Human Body International Journal ofWireless Information Networks Vol 19 No 3 pp 209-218 2012
[MaCo13] Mackowiak M and Correia L M Statistical Model of theInfluence of Body Dynamics on the Radiation Pattern ofWearable Antennas in Off-Body Radio ChannelsWireless Personal Communications 101007s11277-013-1193-x May 2013
[Mack13] Mackowiak M Modelling MIMO Systems in Body AreaNetworks in Outdoors PhD Thesis IST - University ofLisbon Lisbon Portugal 2013
Document ID D26 Global Wireless Exposure Metric DefinitionFP7 Contract ndeg318273
Version V4 48Dissemination level PU
[NAGAOKA08] Nagaoka T and Watanabe S Postured voxel-based
human models for electromagnetic dosimetry Physics in
medicine and biology vol 53 pp 7047-7061 2008
[PLETS12] Plets D Joseph W Vanhecke K Tanghe E and Martens
L 2012 Coverage Prediction and Optimization Algorithms
for Indoor Environments EURASIP 2012123
[PLETS14] Plets D Joseph W Aerts S Vanhecke K and Martens L
accepted 2014 Prediction and comparison of downlink
electric-field and uplink localized SAR values for realistic
indoor wireless planning Radiation Protection Dosimetry
[SaNC10] SaloJ Nur-AlamM and ChangK Practical Introduction
to LTE Radio Planning white paper European
Communications Engineering (ECE) Ltd Espoo Finland
Nov 2010 (wwweceltdcom)
[TAFLOVE00] Taflove A and Hagness S C 2000 Computational
Electrodynamics The Finite-Difference Time-Domain
Method 2nd edn (Boston MA Artech House Publishers)
[TNS10] TNS Sofres survey Observatoire Socieacutetal du teacuteleacutephone
mobile Dec 2010
[VAJM13] Vermeeren G Aerts S Plets D Joseph W Martens
LConil E Varsier N Wiart J Core YOliveira C Sebastiatildeo
DCorreia L Aguumlero R Diez L Rodriacuteguez L Koprivica M
Nešković A Popović M Milinković J Nikšić S D23
Scenarios LEXNET project Novembre 2013
[WIART08] Wiart J Hadjem A Wong M F and Bloch I Analysis of
RF exposure in the head tissues of children and adults
Physics in medicine and biology vol 53 pp 3681-3695
2008
[WINNER D112 2007] Kyoumlsti P et al D112 WINNER II Channel models
WINNER project September 2007
[ZHAO02] Zhao X Kivinen J Vainikainen P Skog K Propagation
characteristics for wideband outdoor mobile
communications at 53 GHz IEEE J Sel Areas Commun
vol 20 pp 507ndash514 2002
Document ID D26 Global Wireless Exposure Metric DefinitionFP7 Contract ndeg318273
Version V4 49Dissemination level PU
APPENDIX 1 NUMERICAL DOSIMETRIC SIMULATIONS
This appendix describes the main assumptions concerning the frequency bands used
in the numerical dosimetric simulations
Table A1 gives the frequency bands used for SAR simulations as well as theservices and DLUL frequencies considered in each of those frequency bands forLEXNET studies Note that at these frequencies (especially at the higher ones) nolarge differences are expected between SAR results [CHLWW08] Accordingly forthe sake of simplicity it is assumed that
the same frequency band is assumed for both up- and down-link each frequency band may cover more than one system (eg simulation at
1940 MHz covers both GSM1800 and UMTS2000)
Table A1 Technical specifications for LEXNET selected services
SAR
simulation
frequency
band [MHz]
RAT
RAT frequency band [MHz]
DL UL
400 LTE 400 380 - 470
900
LTE 800 875- 885 830 - 840
GSM 900 935 - 960 890 - 915
UMTS 900 925 ndash 960 880 ndash 915
1940
GSM 1800 1805 - 1880 1710 - 1785
UMTS 2000 2110 - 2170 1900 - 1980
2600WiFi bgn 2400 - 2484
LTE 2600 2620 - 2690 2500 - 2570
For the WiFi an between 5470 and 5725 MHz frequency bands no SAR simulation
was performed yet
Document ID D26 Global Wireless Exposure Metric DefinitionFP7 Contract ndeg318273
Version V4 50Dissemination level PU
APPENDIX 2 INTERNAL REVIEW
Reviewer 1 Yoann Corre Reviewer 2 Mick Wilson
Answer Comments Type Answer Comments Type
1 Is the deliverable in accordance with
(i) the Descriptionof Work
Yes
No
M
m
a
Yes
No
M
m
a
(ii) the internationalState of theArt
Yes
No
M
m
a
Yes
No
M
m
a
2 Is the quality of the deliverable in a status
(i) that allows tosend it to EC
Yes
No
M
m
a
Yes
No
M
m
a
(ii) that needsimprovement ofthe writing bythe editor of thedeliverable
Yes
No
See proposedenhancements
In particular thepresentation of the basic EIconcept could be improvedin the Abstract Introductionsection 21 and Conclusion
M
m
a
Yes
No
See comments onSection 3
M
m
a
(iii) that needsfurther work bythe partnersresponsible forthe deliverable
Yes
No
Mostly minor changes Seethe proposedenhancements
Section 44 is a copy-pastof a whole section in D33Either D26 or D33 must bechanged to avoidredundancy (replacing thewhole description by asummary adapted to theintegrated deliverable)
It must be made more clearwhere the reader will findthe missing SAR data andthe announced uncertaintystudy results
M
m
a
Yes
No
M
m
a
Type of comments M = Major comment m = minor comment a = advice
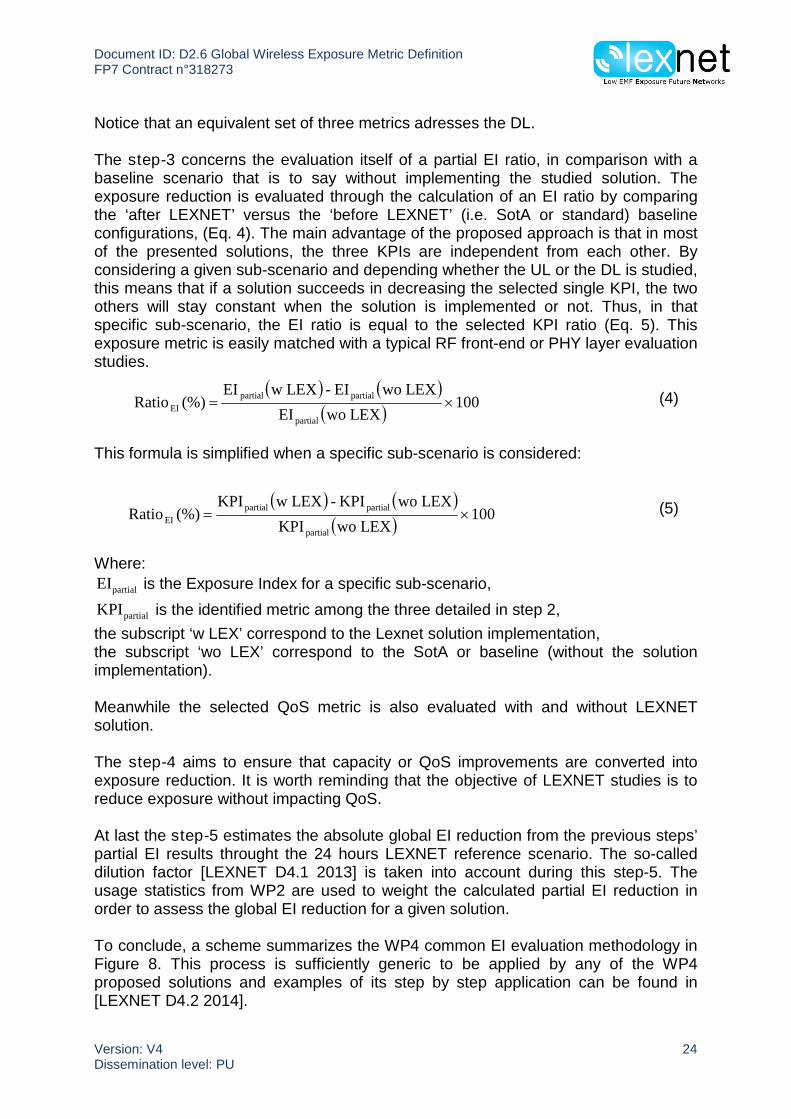
Document ID D26 Global Wireless Exposure Metric DefinitionFP7 Contract ndeg318273
Version V4 26Dissemination level PU
time EMF management Clearly a link between these proxy-metrics and long-term EIvalues is needed The underlying assumption is that if we try to reduce the level ofEMF by applying correct general policies and additionally control it on a smaller time-scale (eg seconds or minutes) with fast-loop control then the overall exposure andthe EI (defined on daily level) will decreaseFast-loop (event-based) EMF control would be a response to a temporary change ofconditions This kind of control requires triggers ie thresholds that can be assessedon near-real-time scale ndash this time scale may not be as granular as for power controlFor fast-loop control offload techniques may be used as for general strategy butalso other strategies such as changing codecs delaying transmission etc Fast-loopcontrol without using triggers would be periodic optimization on a smaller time-scaleProxy metrics to be used for fast-loop control involve data that may be collected fromthe network and include
bull Measurements (UL Tx power RSSI RSCPhellip)
bull User context velocity services used profile
bull Statistics cell statistics (traffic load) etc
Some preliminary results using various proxy metrics which illustrate the pointsabove are shown hereFigure 9 shows live network measurements illustrating that available cellulartechnologies and current traffic conditions are two of the main points to be taken intoaccount when designing low-EMF solutions The metric used here is the UL Txpower The same metric is used in Figure 10 and Figure 11 which show that the typeof service could increase the exposure (based on UL Tx power) meaning thatdifferent strategies should be used to identify the best connectivity according to theservice flow requested The actual UL Tx power values can then be used in EIcalculations
Figure 9 Comparison of different 2G3G cells in high load hours by UE Tx power
Document ID D26 Global Wireless Exposure Metric DefinitionFP7 Contract ndeg318273
Version V4 27Dissemination level PU
Figure 10 Comparison of UL FTP and voice services over 2G3G cells in high load hours by UE Txpower
Figure 11 Comparison of voice service over 3G and voice service using Skype over 3G network
Another common proxy with direct link to EI is the DL power density Figure 12 showshow DL power density and UL transmit power vary for different ISD values in an LTEnetwork Based on these simulations it can be seen that small-cell densification inurban areas allows for significant exposure reduction which now needs to betranslated into the EI using various assumptions on user distributions and type ofusage
Document ID D26 Global Wireless Exposure Metric DefinitionFP7 Contract ndeg318273
Version V4 28Dissemination level PU
Figure 12 DL power density and UL transmit power for different ISD values
Whole-body SAR is another proxy metric whose statistical processing can leaddirectly to EI calculations As an example of SAR values obtained by a tooldeveloped for the prediction of whole-body and localized SARs and absorbed dosesfor indoor wireless network deployments in Figure 13 we show distributions for thetraditional deployment (top) and for the WP5 exposure-optimized deployment
Figure 13 Whole-body SAR_DL (distribution for the traditional deployment (top) and for the exposure-optimized deployment (bottom)
Document ID D26 Global Wireless Exposure Metric DefinitionFP7 Contract ndeg318273
Version V4 29Dissemination level PU
4 EXAMPLES OF APPLICATION
41 Computing chain
In this section three simplified examples of EI computation are detailed In no casethese examples are representing the completeness of the possibilities that can becover by the EI but they illustrate the process of computation
The first two examples illustrate the use of network planning tools in the evaluation ofthe EIThe first example detailed in the section 42 consists in comparing two indoor officescenarios first with wireless communication offered by only 3G outdoor macro basestations scenario and secondly with an additional 3G femtocell (Table 6)
Scenario 1
Time PopulationUser
ProfileEnvironment RAT Cell Type Posture Usage
1h inthe
afternoon
Adults Heavy Indoor 3G Macro Standing Voice mobile
Medium Datamobile
Light Data Tablet
Nonuser
Data Laptop
Scenario 2
Time PopulationUser
ProfileEnvironment RAT Cell Type Posture Usage
1h inthe
afternoon
Adults Heavy Indoor 3G Femto Standing Voice mobile
Medium Datamobile
Light Data Tablet
Nonuser
Data Laptop
Table 6 input variables for the 3G indoor sub-scenarios described in section 42
The second example detailed in section 43 is considering a data LTE macro urbanscenario (Table 7)
Time PopulationUser
ProfileEnvironment RAT Cell Type Posture Usage
Day Youngpeople
Moderate Indoor 4G Macro Standing Data mobile
Document ID D26 Global Wireless Exposure Metric DefinitionFP7 Contract ndeg318273
Version V4 30Dissemination level PU
Night Adults Non user Outdoor Sitting Data mobile
Seniors Data Tablet
Table 7 input variables for the LTE scenario described in section 43
The last example detailed in section 44 illustrates the use of dosimetermeasurements in the EI evaluation It is considering a macro outdoor LTE scenariowhere one user is wearing a dosimeter
42 Indoor exposure from 3G macro and femto-cells
The EI was evaluated for two scenarios considering the exposure of people locatedindoor The population consisted of adults making UMTS (phone calls with thephone on the right side of the head The scenario 1 is considering a macrocellconnection and the scenario 2 an indoor small cell connection Different user profilesare considered
10 heavy users 30 s usage 50 moderate users 10 s usage 25 light users 3 s usage 15 no usage 0 s usage
For the calculation of the EI several input parameters are needed reference SARvalues averaged transmitted power valuesത and averaged incident power densityvalues inc (see Table 8)The power (density) values that were used for the indoor macrocell scenario arederived from measurements in an office building (Zuiderpoort building GhentBelgium) [PLETS14] Figure 14 shows the considered buildingFor the indoor femtocell scenario accurate power (density) values from the WHIPPtool a heuristic indoor network calculator and planner [PLETS12] were used In theconsidered building a femtocell with an Equivalent Isotropically Radiated Power(EIRP) of 7 dBm is installed A different femtocell EIRP can lead to a largely differentEI Reference SAR values were taken from [LAUER13] and applied to the scenariosfor an adult standing using the phone on the right side of the head Since the
measured macrocell values (RXinc and Pഥଡ଼) were not recorded in the smaller andmore enclosed central areas of the building floor (toilets kitchen shedhellip) femtocellpredictions were limited to the non-shaded areas around the center in Figure 14 Forthe femtocell values locations within 50 cm of the base station are discardedassuming that people stay at least half a meter away from base stations For thesimulations a sub-scenario is also considered for which a 20 dB worse macrocellconnection is assumed for the same building floor This could correspond to abuilding with a penetration loss that is 20 dB higher than before or a building which islocated further from the macrocell base station (path loss increase of 20 dB) Table 8
shows that the assumed Pഥଡ଼ RXinc values in case of a lsquoworse connectionrsquo areindeed 20 dB higher lower
Document ID D26 Global Wireless Exposure Metric DefinitionFP7 Contract ndeg318273
Version V4 31Dissemination level PU
Figure 14 Ground plan of the considered floor (90 m x 17 m) of the office building that is simulatedFemtocell base station location is indicated with purple hexagon
Scenario 1Macro indoor
Scenario 2Femto indoor
௨ܣ 0003 Wkg 0003 Wkg
௨ܣ 000495 Wkg 000495 Wkg
ത 26610-5 W 28510-7 W
ത(worse connection) 26610-3 W 28510-7 W
RXinc81510-8 Wmsup2 51810-6 Wmsup2
RXinc(worse connection) 81510-10 Wmsup2 51810-6 Wmsup2
Table 8 Reference SAR values and average transmitted power and observed power densityvalues
In the following the results for the different indoor scenarios are discussedFigure 15 (a) compares the EI for scenarios 1 and 2 for the indoor office buildingFrom an exposure-point-of-view the indoor femtocell scenario (scenario 2 EI =158E-8 Wkg) is a factor 28 worse than the indoor macrocell scenario (scenario 1 EI= 564E-10 Wkg) The main EI contribution in scenario 2 is the high DL exposureoriginating from the femtocell (155E-8 Wkg) The scale in Figure 15 (a) has beenadjusted the bar that represents the DL femto indoor contribution is in reality 44times the length of the Y-scaleThere are several reasons why the installation of a femtocell is not beneficial in thiscaseA first reason is that the EI contributions of the macrocell are almost equal for UL andDL which is optimalA second reason is that the femtocell EIRP is chosen quite high (7 dBm) despite thegood macrocell connection (average value of -6925 dBm) still 77 of the DL fieldsare higher in the femtocell caseA third reason is that a femtocell installation has the disadvantage that observedpower densities on a building floor due to a femtocell base station are lesshomogeneously distributed than fields due to a (more distant) macrocell base stationAs people are assumed to ndash on average- reside an equal time at each location on thebuilding floor (except shaded areas and locations closer than 50 cm from the BS)locations close to the femtocell contribute a lot to the EI When people approach afemtocell the absorbed exposure dose increases in a more-than-linear wayMacrocell base stations have the advantage that ULDL fields are morehomogeneously distributed over the building floor It should also be noted that thehigher the UL usage the more the femtocell scenario will benefit compared to themacrocell scenario (lower EI) However in the considered case the UL usage timeswould have to increase by a factor 48 to yield a total EI (macrocell scenario 1) that isequal to the EI of scenario 2 (femtocell scenario EI = 158E-8 Wkg)
Document ID D26 Global Wireless Exposure Metric DefinitionFP7 Contract ndeg318273
Version V4 32Dissemination level PU
We also studied a second case where a less favourable macrocell case isconsidered (lsquoworse connectionrdquo) It is assumed that the connection with the macrocellbase station is now 20 dB worse than in the previous case Figure 15 (b) comparesthe EI for the macrocell and femtocell deployments Due to the worse connection(average received macrocell DL power of -8925 dBm) the macrocell EI is nowcompletely determined by the UL contribution (320E-8 Wkg) and the femtocellscenario (scenario 2 EI = 155E-8 Wkg) has an EI that is 48 of the macrocell EIwhich makes it preferable over the macrocell deployment Moreover the observedpower densities due to the femtocell are higher than the macrocell power densities atall locations (better QoS)It can be concluded that the installation of femtocell is not always recommended forshorter UL usage times andor better macrocell connection qualities it could beadvised to rely on the existing macrocell infrastructure Also when installing afemtocell its EIRP should be adjusted to the size and physical properties of thebuilding and should not be set at a needlessly high value
(a) (b)Figure 15 Comparison of the contributions to the whole-body EI for (a) indoor scenarios 1 and 2 in theconsidered building (b) indoor scenarios 1 and 2 in this building with 20 dB worse connection qualityTotal EI levels for each scenario are indicated with the horizontal line EI values are shown in Wkg
43 Data LTE macro urban scenario
431 Input variables linked to the network
The EI is evaluated from a macro-cellular LTE network in a real geographical area ndashpart of the 7th district of Paris (see Figure 16) The proposed scenario was previouslydefined in frame of the French ANR project ECOSCells [BCL12] and the EuropeanFP7 project FREEDOM (httpwwwict-freedomeu) for the simulation and analysis ofheterogeneous network topologies (hetNet) It is based on a real environment usingHigh Resolution (HR) map data realistic BSUE deployments and deterministicpropagation models
The macro layout is organized as three rings around a central three-sector sitemacro base stations being deployed with an inter-site distance of about 450 m in ahexagonal manner as shown in Figure 16
Document ID D26 Global Wireless Exposure Metric DefinitionFP7 Contract ndeg318273
Version V4 33Dissemination level PU
Figure 16 View of the macro-cell hexagonal deployment in the area
The study area (ie area where network performance is evaluated) is limited to thesurface covered by the three co-located central macro-cells and the first ring (Figure17) Thus the study area is equivalent to 12 macro-cells The base stations outsidethis study area are included in simulations to generate an accurate interferencepattern
Figure 17 Study area composed of 12 macro sites localised in the 7th
district of Paris France
Document ID D26 Global Wireless Exposure Metric DefinitionFP7 Contract ndeg318273
Version V4 34Dissemination level PU
The positions and heights of the base stations have been selected in realisticapproach sites are placed on slightly dominant rooftops and sector antennas aredistributed at the rooftop edges Directive antennas are used (with 3GPP radiationpattern) Each site is composed of three sectors oriented in azimuth directions 0deg120deg and 240deg with down-tilt 6degUsers are assumed to be uniformly distributed in the study area an indoor ratio setsthe percentage of users located inside buildings at the ground floorThe specifications of input parameters are summed up in Table 9
Environment Typical European Dense Urban environment (Paris VII district France)
System
Downlink (DL) and Uplink (UL)
LTE FDD 2 x 10 MHz
Central frequency 2600 MHz
Macro layout
Hexagonal sitedeployment
37 sites corresponding to 83 macro cellsincluding 12 sites in the center of the studyarea Inter-site distance (ISD) of 450 m
Nominal transmitpowerEPRE
40 W 228 dBm
AntennaDirectional with 14 dBi gain 6deg electric down-tilt 2 antennassector Average antennaheight 30 m above ground
Noise figure 25 dB
UL power control (openloop)
Path loss compensation factor 1SINR target 208 dB
UserEquipment
MaxMin transmit power 23 dBm -40 dBm
AntennaOmni-directional with 0 dBi gain 2antennasuser device Antenna height 15 mabove ground
Noise figure 9 dB
User traffic
Average active userdensity
Depends on daynight
DistributionUniform spatial distribution within thesimulation area Single floor (at 15 m height)No user mobility
Table 9 Inputs in SIRADEL simulator
432 Input variables linked to the population
Category of population
The population density of the 7th District of Paris was estimated at 14 36050
inhabitants per kmsup2 in 2009 [Carte09]
We are considering the population above 15 years old
Given the population distribution by age (Figure 18) it was decided to divide the adult
population into 3 categories young people (between 15 and 29 years) adults
Document ID D26 Global Wireless Exposure Metric DefinitionFP7 Contract ndeg318273
Version V4 35Dissemination level PU
(between 30 and 59 years) and seniors (over 60 years) Table 10 shows the
percentages of people in each category
Figure 18 Population distribution by age in Paris 7th district in 2007
Population category Pourcentage(prop)
Adults (30-59 yo) 45
Young people (15-29 yo) 26
Seniors (+60 yo) 29
Table 10 Number of people in each population category
Time periods
A 24-hour day is divided into two periods the day from 8 am to 6 pm (10 hours in
total) and the night from 6 pm to 8 am (14 hours in total)
Environment
Time spent indoor or outdoor on an average day for each category is extracted from
Table 2
Usage
Only data traffic is considered The device is assumed to be a mobile phone whilethe user is in a standing posture Considering the existence of 4 telecom operators inFrance only 25 of the 7th district population is assumed to be using this LTE macronetwork In this example we consider two user profiles moderate user and non-userFor each population category we derived from [Bigot et al 2013] the proportions ofusers and non-users of mobile phones for data traffic (see Table 11)
User profileYoung people (15-29
yo)Adults (30-59 yo) Seniors (over 60 yo)
non-users 33 57 91
Document ID D26 Global Wireless Exposure Metric DefinitionFP7 Contract ndeg318273
Version V4 36Dissemination level PU
users 67 43 9Table 11 Repartition of users and non-users for each population category
For simplicity the parameters for the moderate user profile are applied to all userswe assume a daily data traffic per active user of 66 MB [CISCO13] a DLUL ratio of9010 (this ratio was evaluated from data collected through measurements ofKPIs by sensors inside the French Orange network) and a daynight ratio of4357 From [CISCO13] only 29 of connections in 2013 were on 4GReference SAR values were extracted from Table 4 and Table 5
433 Transmitted power ഥ and received power density ത calculationܖ
Incident ோpower densities and transmittedത powers were calculated by usingthe network planner simulation tool Volcano Suite (Siradel France)Figure 19 andFigure 20 illustrate respectively the average UE Tx power calculated over the 7thParis district during the day and the average incident power density evaluated duringthe day or the night (values during the day or the night time were quasi identical)
Figure 19 Map of the average UL Tx power (dBm) calculated indoor at ground floor and outdoorduring the day (on the left) and map of daily average transmission duration (s) (on the right)
Figure 20 Map of the average DL incident power density (dBμVm) calculated indoor at ground floor and outdoor during the day or the night
Because the average active LTE user density is very low (41 userskm2consequence of the 29 LTE connections assumption) the DL user traffic utilises
Document ID D26 Global Wireless Exposure Metric DefinitionFP7 Contract ndeg318273
Version V4 37Dissemination level PU
less than 1 of available resources which strongly impact the predicted DL incidentpower density We can see in Figure 19 (left figure) that the calculated average Txpower is minimum in outdoor areas in the vicinity of the base stations or in Line ofSight (LOS) while it is at a maximum indoors and outdoors far away from the basestations The right map in Figure 19 gives the average communication durationwhich directly impacts the calculation of the UL exposure contribution The better thelink performance is the higher the throughput and thus the longer thecommunication duration That is why the longest durations are observed indoors andparticularly in the building parts that suffer from the strongest propagation lossesFigure 20 shows that the strongest DL incident power density levels are predicted inLOS areas while much lower levels are observed inside the buildings where mostpopulation is located
434 Exposure index calculation
Aggregating everything we obtain the following value for the EI (based on the Whole-body SAR) of the over 15 years old population of the 7th district of Paris consideringa macrocell LTE network EIWBSAR = 31910 -7 Wkg
44 Using dosimeters for the EI evaluation
This section provides an evaluation of the downlink and uplink exposure indexes fora subject wearing a reference isotropic dosimeter on the head together with fivedosimeters at different locations of the body as well as two mobile terminals Thesubject is moving in a multipath environment including a 3-sector LTE base station
When modelling the radio link between the user devices and the base station oneconsiders the influence of the body (ie body coupling [MaOC12] and bodymovements (using realistic body motion capture tools [MaCo13]) and accounts forthe propagation environment using a geometrically based statistical channel (GBSC)model (ie multipath propagation) Therefore the modelling of the radio channel hasbeen separated into several steps as described in [Mack13] Figure 21
Document ID D26 Global Wireless Exposure Metric DefinitionFP7 Contract ndeg318273
Version V4 38Dissemination level PU
Figure 21 Model for EMF assessment from dosimeter data
The simulated scenario Figure 22 considers a reference isotropic dosimeter on thehead of the user (simulating the real body exposure) together with five wearabledosimeters These dosimeters allow the downlink exposure assessment The user isalso carrying two mobile terminals allowing to assess the uplink exposure
Figure 22 Placement of wearable dosimeters and mobile terminals on the body
For the downlink the received (Rx) power ோ௫ at the mobile terminal (ordosimeter) is calculated from
ோ௫[ౚ ]= ௌ[ౚ ]
minus ௧௧[ౚ]ܮ (6)
where ௌ base station (BS) transmitted (Tx) power ௧௧ܮ total path loss including gains of mobile terminal (or
dosimeter) and BS
The received power density ோ௫ at the mobile terminal (or dosimeter) iscalculated from
ோ௫ ୫ మ൧=
ோ௫[ ]
ܣ మ൧
(7)
where ܣ is the mobile terminal antenna effective area
ܣ ୫ మ൧=ଶ[ߣ ]
ߨ4ோ௫[ౚഠ]ܩതതതതതതതതത (8)
where wavelength ோ௫തതതതതܩ average gain of the receiving antenna (ie dosimeter probe) in
off body direction (eg half-hemisphere of the gain pattern ieߠ isin [minus9090]deg and isin [minus9090]deg)
ோ௫[ౚഠ]ܩതതതതതതതതത=
1
ఏఝ ோ௫[ౚ]ܩ
ߠ) )
ேക
ୀଵ
ேഇ
ୀଵ
(9)
where ఏ and number of elevation (ߠ) and azimuth () directions
The exposure index for the DL ܫܧ can be determined from [LEXNET D24 2013]
Document ID D26 Global Wireless Exposure Metric DefinitionFP7 Contract ndeg318273
Version V4 39Dissemination level PU
[୩]ܫܧ = ௪ܣ
|ଵ ୫ మ[୫ మ୩]
times ோ௫[ ୫ మ]times [ୱ]ݐ (10)
where ௪ܣ
|ଵ ୫ మ normalised whole body averaged SAR coefficient per
1 Wm2 of Rx power density as indicated in [LEXNET D24 2013] ݐ time of the exposure from BS
ோ௫ average Rx power density during period ݐ
For the uplink the required Tx power from the mobile terminal is determined from ௫[୫ ]
= ௌ[୫ ]+ ܫ ௧௧[]
+ ܯ [] + ௧௧[]ܮ (11)
where ௌ noise and interference level at the BS ܫ ௧௧ target SINR at the BS
ܯ fading margin for a dynamic usage ௧௧ܮ total path loss including gain of MT and BS
ௌ is calculated asௌ[୫ ]
= minus174[୫ ] + 10logଵ(ܤ[ୌ]) + ி[]+ []ܫ (12)
where ܤ bandwidth ி noise figure ܫ interference
The EI for the UL ܫܧ can be determined from [LEXNET D24 2013]
[୩]ܫܧ = ௪ܣ
|ଵ [ଵ୩]times ௫[ ]
times [ୱ]ݐ (13)
where ௪ܣ
|ଵ whole body averaged SAR coefficient per 1 W of Tx poweras indicated in [LEXNET D24 2013]
ݐ time of the exposure ( duration of the mobile terminal usage)
௫ average Tx power during period ݐ
A macro cell outdoor street scenario has been considered including a set of 10clusters of 3 scatterers each with a Uniform Distribution in the half space of anellipsoid A 3-sector base station antenna is located in the middle of the street atx=100 m The user is moving on a straight line in the middle of the street (ie y=10m xisin[50 150] m) Figure 23
Document ID D26 Global Wireless Exposure Metric DefinitionFP7 Contract ndeg318273
Version V4 40Dissemination level PU
Figure 23 Scenario
The parameters of the scenario are presented in Table 12 being worthwhile to noticethat the values of ௪ܣ
and ௪ܣ are taken from preliminary SAR simulations The
calculated noise and interference level at the BS is ௌ= -12774 dBm
System
Frequency [MHz] 2600
[HoTo11]ܤ
Resource Block [kHz] 15
Full [MHz] 20
Full LTE-A [MHz] 100
Downlink
EIRP BS Tx power [dBm] 46 [LEXNET D23 2013]
ோ௫ܩ [dBi] 122 [LEXNET D32 2014]
ݓܣ|ܮܦ
1Wm2[m2kg] 300
Uplink
ܫ ௧௧[dB] 208 [HoTo11]
ி [dB] 25 [LEXNET D23 2013]
[dB]ܫ 8 [HoTo11]
ܯ [dB] 30 [Mack13]
ݓܣ|ܮ
1W[1kg] 495
Table 12 Scenario overview
Figure 24 illustrates the considered macro cell base station antenna and thedosimeter realised gain patterns
(a) BS with 3 sectors (b) Dosimeter on the bodyFigure 24 Realised gain pattern
Document ID D26 Global Wireless Exposure Metric DefinitionFP7 Contract ndeg318273
Version V4 41Dissemination level PU
441 EI for downlink
The average Rx power density obtained from the isotropic reference probe and thedosimeter located at WA_L and WA_R is presented in Figure 25 The received powerdensity at WA_L dosimeter is very similar to the one gathered at the isotropic probewhich mainly comes from the similar Line-Of-Sight (LOS) propagation conditions Thepower received in WA_R dosimeter is much lower due to the body shadowing
Figure 25 Rx power density at selected positions
The distribution of the Rx power density is presented in Figure 26 In spite of thebody shadowing the distribution of the Rx power density at the WA_R dosimeter ismuch similar to the ones for the reference and the WA_L dosimeters All of themfollow an exponential decay which should be subject to further investigation
(a) isotropic (b) WA_L (c) WA_R
Figure 26 Rx power density histograms
The received power density and the downlink exposure index calculated based onthe measurement of the dosimeters located in the various locations on the body arepresented in Table 13
ோ௫ [mWm2] ܫܧ [mJkg]
isotropic 35868 2690
WA_F 18357 1377
WA_B 29538 2215
Document ID D26 Global Wireless Exposure Metric DefinitionFP7 Contract ndeg318273
Version V4 42Dissemination level PU
WA_L 28516 2138
WA_R 9060 680
TO_F 18436 1383
Table 13 Downlink Exposure
The WA_L dosimeter and the isotropic probe exposure indexes are very similarbecause of the LOS propagation conditions The same is valid for the WA_Bdosimeter which is also in LOS with the base station For the other dosimeters theexposure index is naturally lower due to the body shadowing In this scenario theuse of a wearable dosimeter in the front or in the right side of the body displays anexposure index reading about 4 times lower than the real user exposure
442 EI for uplink
The average Tx power from the mobile phone hold near HE_L and HE_R ispresented in Figure 27 The uplink power control is clearly noticeable by the highertransmitted power in HE_R as the mobile terminal adjusts the Tx power tocompensate for the higher channel fading
Figure 27 Tx power for straight6min scenario at 2600 MHz for LTE-A
The distribution of the Tx power at HE_L and HE_R is presented in Figure 28 Inspite of the different intensities HE_L and HE_R Tx powers present a similardistribution
Document ID D26 Global Wireless Exposure Metric DefinitionFP7 Contract ndeg318273
Version V4 43Dissemination level PU
(a) HE_L (b) HE_R
Figure 28 Tx power histograms
The average transmitted power and the uplink exposure index from the mobileterminals located near left and right side of the head ( e HE_L and HE_R) arepresented in Table 14
௫ [mW] ܫܧ [mJkg]
RB FULL FULL_A RB FULL FULL_A
HE_L mobile 002 165 827 003 295 1474
HE_R mobile 008 838 4191 014 1493 7468
Table 14 Uplink Exposure
These results show the importance of the propagation conditions in the EMFexposure Due to the non LOS conditions the exposure index in the right side of thehead is 5 times higher than the one on the left side
5 CONCLUSION
In this deliverable a global metric is defined to test and optimize wirelesstelecommunication networks in terms of EMF exposureThe proposed metric called Exposure Index (EI) has the advantage to overpass thelimitations of the actual metrics that in fact are managing separately the exposureinduced by personal devices and the one induced by the network equipment (basestations and access points) But devices base station antennas and access pointsare definitely parts of the same wireless environment and the global wirelessexposure is induced by all of them
The EI is described with an analytical model with input variables describing thecoverage area of interest the accessible networks the population and the habits interms of location and of wireless devices usage The output is the EI covering theday-to-day averaged exposure of population in a given area incurred by an entirewireless network from base stations and access points to individual devices
In this deliverable the analytical model of EI has been detailed and the inputvariables defined Then the use of the EI to minimize the EMF exposure in wirelesscommunication networks is presented in connection with work-package 4 dedicated
Document ID D26 Global Wireless Exposure Metric DefinitionFP7 Contract ndeg318273
Version V4 44Dissemination level PU
to innovative radio components and work-package 5 focused on networks topologiesand technologies
The way to process a complete calculation of EI is illustrated on three deterministicexamples The first example considers comparison of indoor 3G macro and femtoscenarios The second example is taking into account an adult population in a LTEmacro urban environment with their data usage specifications Both examples arebased on a real environment representation and network simulation tools have beenused to simulate the up and down links The third example illustrates how dosimetermeasurements can be used to assess the EI
In our further work the statistical description of input variables will enable topropagate the variability and the uncertainty in the EI model making it more accurateand reliable Results will be made available in the future deliverable D28 DeliverableD33 will detail the used methodology to assess the EI and for the last year of theproject the work of partners involved in WP6 will be enhanced as they will be incharge of the implementation and evaluation of the EI
Document ID D26 Global Wireless Exposure Metric DefinitionFP7 Contract ndeg318273
Version V4 45Dissemination level PU
6 REFERENCES
[ALIAGA06] Aliaga C How is the time of women and men distributed
in Europe Statistics in focus population and social
conditions April 2006
[APVJM13] Aerts S Plets D Verloock L Joseph W and MartensL Assessment and comparison of RF-EMF exposure infemtocell and macrocell scenarios Radiat Protec Dosim2013
[BCL12] Brau M Corre Y Lostanlen Y Assessment of 3D
network coverage performance from dense small-cell LTE
Communications (ICC) 2012 IEEE International
Conference on
[Carte09] httpwwwcartesfrancefr
[CISCO13] Cisco Visual Networking Index Global Mobile Data Traffic
Forecast Update 2012-2017 February 2013
[CHLWW08] ConilE Hadjem A Lacroux F Wong M F and Wiart J
Variability analysis of SAR from 20 MHz to 24 GHz for
different adult and child models using finite-difference
time-domain Phys Med Biol vol 53 pp 1511-1525
2008
[CHRIST10] Christ A Kainz W Hahn E G Honegger K Zefferer
M Neufeld E Rascher W Janka R Bautz W Chen
J Kiefer B Schmitt P Hollenbach H-P Shen J
Oberle M Szczerba D Kam A Guag J W amp Kuster
N The Virtual Family--development of surface-based
anatomical models of two adults and two children for
dosimetric simulations Phys Med Biol vol 55 pp 23-38
2010
[CMKB06] Cooper TG Mann SM Khalid M and Blackwell RP
Public exposure to radio waves near GSM microcell and
picocell base stations Journal of the Society for
Radiological Protection Vol 26 No 2 pp 199-211 June
2006
[GCWW10] Gati A Conil E Wong MF Wiart J Duality between
uplink local and downlink whole body exposures in
operating Networks IEEE Transactions on EMC Vol 52
ndeg4 Nov 2010
Document ID D26 Global Wireless Exposure Metric DefinitionFP7 Contract ndeg318273
Version V4 46Dissemination level PU
[HoTo11] Hola HG And Toskala A LTE for UMTS Evolution to
LTE-Advanced Wiley UK 2011
[INFORMA12] Informa telecom amp Media Small Cell Market Update June
2012
[INSEE11] Insee enquecircte Emploi du temps 2009-2010 Insee
Premiere Ndeg 1377 November 2011
[IST] httpwwwist-winnerorg
[KALLIOLA02] Kalliola K Sulonen K Laitinen H Kiveks O Krogerus J
Vainikainen P Angular power distribution and mean
effective gain of mobile antenna in different propagation
environments IEEE Trans Veh Technol vol 51 pp 823ndash
838 2002
[KIENTEGA11] Thierry Kientega EConil A Gati A Hadjem ERichalot M-F Wong OPicon Joe Wiart Analysis of thedistribution of specific absorption rate induced by fiveplane waves with a fast and new method in VisibleHuman URSI conference 2011
[LAUER13] Lauer O Frei P Gosselin M C Joseph W Roumloumlsli M
and Froumlhlich J Combining near- and far-field exposure for
an organ-specific and whole-body RF-EMF proxy for
epidemiological research a reference case
Bioelectromagnetics vol 34(5) pp 366-74 2013
[LEXNET D21 2013] Vermeeren G Thielens A Aerts S Joseph W
Martens L Oliveira C Mackowiak M Correia LM
Pejanovic-Djurisic M Veljovic Z Nešković A
Koprivica M Gati A Varsier N Hadjem A Wiart J
ConilE ldquoD21 Current metrics for EMF exposure
evaluationrdquo LEXNET project April 2013
[LEXNET D22 2013] Wiedemann P M Freudenstein F ldquoD22 Risk and
exposure perceptionrdquo LEXNET project July 2013
[LEXNET D23 2013] Vermeeren G Plets D Joseph W Martens L Conil E
Varsier N Wiart J Corre Y Oliveira C Sebastiatildeo D
Correia LM Aguumlero R Diez L Rodriacuteguez L Koprivica
M Nešković A Popović M Milinković J Nikšić S ldquoD23
Scenariosrdquo LEXNET project November 2013
[LEXNET D24 2013] Conil E ldquoD24 Global Wireless Exposure Metric
Definitionrdquo LEXNET project October 2013
Document ID D26 Global Wireless Exposure Metric DefinitionFP7 Contract ndeg318273
Version V4 47Dissemination level PU
[LEXNET D32 2014] BoriesS (ed) ldquoD32 Wideband dosimeter design study amp
performances characterizationrdquo LEXNET project July
2014
[LEXNET D41 2013] Bories S Fang Y Brown TBegaud X Pinto Y Ciblat P
Ksairi N De Domenico A Clemente A Fernandez Y
Lalam M Masera E Wilson M Tesanovic M Kocan E
Pejanovic-Djurisic M Veljovic Z Milatović B Popović M
Nešković A Koprivica M Voinescu A Dragomir D
Slusanschi E laquo D41 Promising Low Exposure Index
Solutions for Components and Transmission
Techniques raquo LEXNET project November 2013
[LEXNET IR21 2013] ldquoNumerical toolsrdquo LEXNET project July 2013
[LEXNET IR51 2013] ldquoSmart low-EMF architectures state of the art and way
forwardrdquo LEXNET project May 2013
[LEXNET D25 2014] Wiedemann P M Freudenstein F ldquoD25 Risk and
exposure perceptionrdquo LEXNET project November 2014
[LEXNET D42 2014] Bories S Fang Y Brown TBegaud X Pinto Y Ciblat P
Ksairi N De Domenico A Clemente A Fernandez Y
Lalam M Masera E Wilson M Tesanovic M Kocan E
Pejanovic-Djurisic M Veljovic Z Milatović B Popović M
Nešković A Koprivica M Voinescu A Dragomir D
Slusanschi E laquo D42 Performance Evaluation of Low
Exposure index solutions for components and
Transmission Techniques raquo LEXNET project November
2014
[MaOC12] Mackowiak M Oliveira C and Correia L M RadiationPattern of Wearable Antennas A Statistical Analysis of theInfluence of the Human Body International Journal ofWireless Information Networks Vol 19 No 3 pp 209-218 2012
[MaCo13] Mackowiak M and Correia L M Statistical Model of theInfluence of Body Dynamics on the Radiation Pattern ofWearable Antennas in Off-Body Radio ChannelsWireless Personal Communications 101007s11277-013-1193-x May 2013
[Mack13] Mackowiak M Modelling MIMO Systems in Body AreaNetworks in Outdoors PhD Thesis IST - University ofLisbon Lisbon Portugal 2013
Document ID D26 Global Wireless Exposure Metric DefinitionFP7 Contract ndeg318273
Version V4 48Dissemination level PU
[NAGAOKA08] Nagaoka T and Watanabe S Postured voxel-based
human models for electromagnetic dosimetry Physics in
medicine and biology vol 53 pp 7047-7061 2008
[PLETS12] Plets D Joseph W Vanhecke K Tanghe E and Martens
L 2012 Coverage Prediction and Optimization Algorithms
for Indoor Environments EURASIP 2012123
[PLETS14] Plets D Joseph W Aerts S Vanhecke K and Martens L
accepted 2014 Prediction and comparison of downlink
electric-field and uplink localized SAR values for realistic
indoor wireless planning Radiation Protection Dosimetry
[SaNC10] SaloJ Nur-AlamM and ChangK Practical Introduction
to LTE Radio Planning white paper European
Communications Engineering (ECE) Ltd Espoo Finland
Nov 2010 (wwweceltdcom)
[TAFLOVE00] Taflove A and Hagness S C 2000 Computational
Electrodynamics The Finite-Difference Time-Domain
Method 2nd edn (Boston MA Artech House Publishers)
[TNS10] TNS Sofres survey Observatoire Socieacutetal du teacuteleacutephone
mobile Dec 2010
[VAJM13] Vermeeren G Aerts S Plets D Joseph W Martens
LConil E Varsier N Wiart J Core YOliveira C Sebastiatildeo
DCorreia L Aguumlero R Diez L Rodriacuteguez L Koprivica M
Nešković A Popović M Milinković J Nikšić S D23
Scenarios LEXNET project Novembre 2013
[WIART08] Wiart J Hadjem A Wong M F and Bloch I Analysis of
RF exposure in the head tissues of children and adults
Physics in medicine and biology vol 53 pp 3681-3695
2008
[WINNER D112 2007] Kyoumlsti P et al D112 WINNER II Channel models
WINNER project September 2007
[ZHAO02] Zhao X Kivinen J Vainikainen P Skog K Propagation
characteristics for wideband outdoor mobile
communications at 53 GHz IEEE J Sel Areas Commun
vol 20 pp 507ndash514 2002
Document ID D26 Global Wireless Exposure Metric DefinitionFP7 Contract ndeg318273
Version V4 49Dissemination level PU
APPENDIX 1 NUMERICAL DOSIMETRIC SIMULATIONS
This appendix describes the main assumptions concerning the frequency bands used
in the numerical dosimetric simulations
Table A1 gives the frequency bands used for SAR simulations as well as theservices and DLUL frequencies considered in each of those frequency bands forLEXNET studies Note that at these frequencies (especially at the higher ones) nolarge differences are expected between SAR results [CHLWW08] Accordingly forthe sake of simplicity it is assumed that
the same frequency band is assumed for both up- and down-link each frequency band may cover more than one system (eg simulation at
1940 MHz covers both GSM1800 and UMTS2000)
Table A1 Technical specifications for LEXNET selected services
SAR
simulation
frequency
band [MHz]
RAT
RAT frequency band [MHz]
DL UL
400 LTE 400 380 - 470
900
LTE 800 875- 885 830 - 840
GSM 900 935 - 960 890 - 915
UMTS 900 925 ndash 960 880 ndash 915
1940
GSM 1800 1805 - 1880 1710 - 1785
UMTS 2000 2110 - 2170 1900 - 1980
2600WiFi bgn 2400 - 2484
LTE 2600 2620 - 2690 2500 - 2570
For the WiFi an between 5470 and 5725 MHz frequency bands no SAR simulation
was performed yet
Document ID D26 Global Wireless Exposure Metric DefinitionFP7 Contract ndeg318273
Version V4 50Dissemination level PU
APPENDIX 2 INTERNAL REVIEW
Reviewer 1 Yoann Corre Reviewer 2 Mick Wilson
Answer Comments Type Answer Comments Type
1 Is the deliverable in accordance with
(i) the Descriptionof Work
Yes
No
M
m
a
Yes
No
M
m
a
(ii) the internationalState of theArt
Yes
No
M
m
a
Yes
No
M
m
a
2 Is the quality of the deliverable in a status
(i) that allows tosend it to EC
Yes
No
M
m
a
Yes
No
M
m
a
(ii) that needsimprovement ofthe writing bythe editor of thedeliverable
Yes
No
See proposedenhancements
In particular thepresentation of the basic EIconcept could be improvedin the Abstract Introductionsection 21 and Conclusion
M
m
a
Yes
No
See comments onSection 3
M
m
a
(iii) that needsfurther work bythe partnersresponsible forthe deliverable
Yes
No
Mostly minor changes Seethe proposedenhancements
Section 44 is a copy-pastof a whole section in D33Either D26 or D33 must bechanged to avoidredundancy (replacing thewhole description by asummary adapted to theintegrated deliverable)
It must be made more clearwhere the reader will findthe missing SAR data andthe announced uncertaintystudy results
M
m
a
Yes
No
M
m
a
Type of comments M = Major comment m = minor comment a = advice
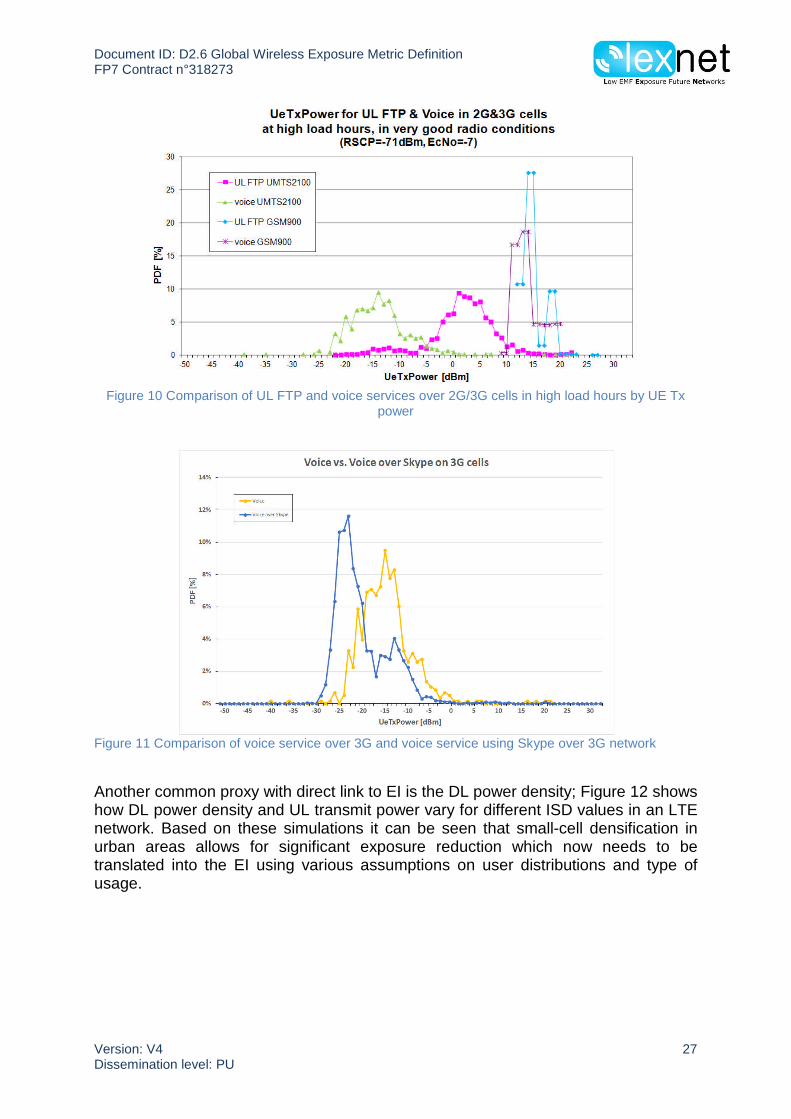
Document ID D26 Global Wireless Exposure Metric DefinitionFP7 Contract ndeg318273
Version V4 39Dissemination level PU
[୩]ܫܧ = ௪ܣ
|ଵ ୫ మ[୫ మ୩]
times ோ௫[ ୫ మ]times [ୱ]ݐ (10)
where ௪ܣ
|ଵ ୫ మ normalised whole body averaged SAR coefficient per
1 Wm2 of Rx power density as indicated in [LEXNET D24 2013] ݐ time of the exposure from BS
ோ௫ average Rx power density during period ݐ
For the uplink the required Tx power from the mobile terminal is determined from ௫[୫ ]
= ௌ[୫ ]+ ܫ ௧௧[]
+ ܯ [] + ௧௧[]ܮ (11)
where ௌ noise and interference level at the BS ܫ ௧௧ target SINR at the BS
ܯ fading margin for a dynamic usage ௧௧ܮ total path loss including gain of MT and BS
ௌ is calculated asௌ[୫ ]
= minus174[୫ ] + 10logଵ(ܤ[ୌ]) + ி[]+ []ܫ (12)
where ܤ bandwidth ி noise figure ܫ interference
The EI for the UL ܫܧ can be determined from [LEXNET D24 2013]
[୩]ܫܧ = ௪ܣ
|ଵ [ଵ୩]times ௫[ ]
times [ୱ]ݐ (13)
where ௪ܣ
|ଵ whole body averaged SAR coefficient per 1 W of Tx poweras indicated in [LEXNET D24 2013]
ݐ time of the exposure ( duration of the mobile terminal usage)
௫ average Tx power during period ݐ
A macro cell outdoor street scenario has been considered including a set of 10clusters of 3 scatterers each with a Uniform Distribution in the half space of anellipsoid A 3-sector base station antenna is located in the middle of the street atx=100 m The user is moving on a straight line in the middle of the street (ie y=10m xisin[50 150] m) Figure 23
Document ID D26 Global Wireless Exposure Metric DefinitionFP7 Contract ndeg318273
Version V4 40Dissemination level PU
Figure 23 Scenario
The parameters of the scenario are presented in Table 12 being worthwhile to noticethat the values of ௪ܣ
and ௪ܣ are taken from preliminary SAR simulations The
calculated noise and interference level at the BS is ௌ= -12774 dBm
System
Frequency [MHz] 2600
[HoTo11]ܤ
Resource Block [kHz] 15
Full [MHz] 20
Full LTE-A [MHz] 100
Downlink
EIRP BS Tx power [dBm] 46 [LEXNET D23 2013]
ோ௫ܩ [dBi] 122 [LEXNET D32 2014]
ݓܣ|ܮܦ
1Wm2[m2kg] 300
Uplink
ܫ ௧௧[dB] 208 [HoTo11]
ி [dB] 25 [LEXNET D23 2013]
[dB]ܫ 8 [HoTo11]
ܯ [dB] 30 [Mack13]
ݓܣ|ܮ
1W[1kg] 495
Table 12 Scenario overview
Figure 24 illustrates the considered macro cell base station antenna and thedosimeter realised gain patterns
(a) BS with 3 sectors (b) Dosimeter on the bodyFigure 24 Realised gain pattern
Document ID D26 Global Wireless Exposure Metric DefinitionFP7 Contract ndeg318273
Version V4 41Dissemination level PU
441 EI for downlink
The average Rx power density obtained from the isotropic reference probe and thedosimeter located at WA_L and WA_R is presented in Figure 25 The received powerdensity at WA_L dosimeter is very similar to the one gathered at the isotropic probewhich mainly comes from the similar Line-Of-Sight (LOS) propagation conditions Thepower received in WA_R dosimeter is much lower due to the body shadowing
Figure 25 Rx power density at selected positions
The distribution of the Rx power density is presented in Figure 26 In spite of thebody shadowing the distribution of the Rx power density at the WA_R dosimeter ismuch similar to the ones for the reference and the WA_L dosimeters All of themfollow an exponential decay which should be subject to further investigation
(a) isotropic (b) WA_L (c) WA_R
Figure 26 Rx power density histograms
The received power density and the downlink exposure index calculated based onthe measurement of the dosimeters located in the various locations on the body arepresented in Table 13
ோ௫ [mWm2] ܫܧ [mJkg]
isotropic 35868 2690
WA_F 18357 1377
WA_B 29538 2215
Document ID D26 Global Wireless Exposure Metric DefinitionFP7 Contract ndeg318273
Version V4 42Dissemination level PU
WA_L 28516 2138
WA_R 9060 680
TO_F 18436 1383
Table 13 Downlink Exposure
The WA_L dosimeter and the isotropic probe exposure indexes are very similarbecause of the LOS propagation conditions The same is valid for the WA_Bdosimeter which is also in LOS with the base station For the other dosimeters theexposure index is naturally lower due to the body shadowing In this scenario theuse of a wearable dosimeter in the front or in the right side of the body displays anexposure index reading about 4 times lower than the real user exposure
442 EI for uplink
The average Tx power from the mobile phone hold near HE_L and HE_R ispresented in Figure 27 The uplink power control is clearly noticeable by the highertransmitted power in HE_R as the mobile terminal adjusts the Tx power tocompensate for the higher channel fading
Figure 27 Tx power for straight6min scenario at 2600 MHz for LTE-A
The distribution of the Tx power at HE_L and HE_R is presented in Figure 28 Inspite of the different intensities HE_L and HE_R Tx powers present a similardistribution
Document ID D26 Global Wireless Exposure Metric DefinitionFP7 Contract ndeg318273
Version V4 43Dissemination level PU
(a) HE_L (b) HE_R
Figure 28 Tx power histograms
The average transmitted power and the uplink exposure index from the mobileterminals located near left and right side of the head ( e HE_L and HE_R) arepresented in Table 14
௫ [mW] ܫܧ [mJkg]
RB FULL FULL_A RB FULL FULL_A
HE_L mobile 002 165 827 003 295 1474
HE_R mobile 008 838 4191 014 1493 7468
Table 14 Uplink Exposure
These results show the importance of the propagation conditions in the EMFexposure Due to the non LOS conditions the exposure index in the right side of thehead is 5 times higher than the one on the left side
5 CONCLUSION
In this deliverable a global metric is defined to test and optimize wirelesstelecommunication networks in terms of EMF exposureThe proposed metric called Exposure Index (EI) has the advantage to overpass thelimitations of the actual metrics that in fact are managing separately the exposureinduced by personal devices and the one induced by the network equipment (basestations and access points) But devices base station antennas and access pointsare definitely parts of the same wireless environment and the global wirelessexposure is induced by all of them
The EI is described with an analytical model with input variables describing thecoverage area of interest the accessible networks the population and the habits interms of location and of wireless devices usage The output is the EI covering theday-to-day averaged exposure of population in a given area incurred by an entirewireless network from base stations and access points to individual devices
In this deliverable the analytical model of EI has been detailed and the inputvariables defined Then the use of the EI to minimize the EMF exposure in wirelesscommunication networks is presented in connection with work-package 4 dedicated
Document ID D26 Global Wireless Exposure Metric DefinitionFP7 Contract ndeg318273
Version V4 44Dissemination level PU
to innovative radio components and work-package 5 focused on networks topologiesand technologies
The way to process a complete calculation of EI is illustrated on three deterministicexamples The first example considers comparison of indoor 3G macro and femtoscenarios The second example is taking into account an adult population in a LTEmacro urban environment with their data usage specifications Both examples arebased on a real environment representation and network simulation tools have beenused to simulate the up and down links The third example illustrates how dosimetermeasurements can be used to assess the EI
In our further work the statistical description of input variables will enable topropagate the variability and the uncertainty in the EI model making it more accurateand reliable Results will be made available in the future deliverable D28 DeliverableD33 will detail the used methodology to assess the EI and for the last year of theproject the work of partners involved in WP6 will be enhanced as they will be incharge of the implementation and evaluation of the EI
Document ID D26 Global Wireless Exposure Metric DefinitionFP7 Contract ndeg318273
Version V4 45Dissemination level PU
6 REFERENCES
[ALIAGA06] Aliaga C How is the time of women and men distributed
in Europe Statistics in focus population and social
conditions April 2006
[APVJM13] Aerts S Plets D Verloock L Joseph W and MartensL Assessment and comparison of RF-EMF exposure infemtocell and macrocell scenarios Radiat Protec Dosim2013
[BCL12] Brau M Corre Y Lostanlen Y Assessment of 3D
network coverage performance from dense small-cell LTE
Communications (ICC) 2012 IEEE International
Conference on
[Carte09] httpwwwcartesfrancefr
[CISCO13] Cisco Visual Networking Index Global Mobile Data Traffic
Forecast Update 2012-2017 February 2013
[CHLWW08] ConilE Hadjem A Lacroux F Wong M F and Wiart J
Variability analysis of SAR from 20 MHz to 24 GHz for
different adult and child models using finite-difference
time-domain Phys Med Biol vol 53 pp 1511-1525
2008
[CHRIST10] Christ A Kainz W Hahn E G Honegger K Zefferer
M Neufeld E Rascher W Janka R Bautz W Chen
J Kiefer B Schmitt P Hollenbach H-P Shen J
Oberle M Szczerba D Kam A Guag J W amp Kuster
N The Virtual Family--development of surface-based
anatomical models of two adults and two children for
dosimetric simulations Phys Med Biol vol 55 pp 23-38
2010
[CMKB06] Cooper TG Mann SM Khalid M and Blackwell RP
Public exposure to radio waves near GSM microcell and
picocell base stations Journal of the Society for
Radiological Protection Vol 26 No 2 pp 199-211 June
2006
[GCWW10] Gati A Conil E Wong MF Wiart J Duality between
uplink local and downlink whole body exposures in
operating Networks IEEE Transactions on EMC Vol 52
ndeg4 Nov 2010
Document ID D26 Global Wireless Exposure Metric DefinitionFP7 Contract ndeg318273
Version V4 46Dissemination level PU
[HoTo11] Hola HG And Toskala A LTE for UMTS Evolution to
LTE-Advanced Wiley UK 2011
[INFORMA12] Informa telecom amp Media Small Cell Market Update June
2012
[INSEE11] Insee enquecircte Emploi du temps 2009-2010 Insee
Premiere Ndeg 1377 November 2011
[IST] httpwwwist-winnerorg
[KALLIOLA02] Kalliola K Sulonen K Laitinen H Kiveks O Krogerus J
Vainikainen P Angular power distribution and mean
effective gain of mobile antenna in different propagation
environments IEEE Trans Veh Technol vol 51 pp 823ndash
838 2002
[KIENTEGA11] Thierry Kientega EConil A Gati A Hadjem ERichalot M-F Wong OPicon Joe Wiart Analysis of thedistribution of specific absorption rate induced by fiveplane waves with a fast and new method in VisibleHuman URSI conference 2011
[LAUER13] Lauer O Frei P Gosselin M C Joseph W Roumloumlsli M
and Froumlhlich J Combining near- and far-field exposure for
an organ-specific and whole-body RF-EMF proxy for
epidemiological research a reference case
Bioelectromagnetics vol 34(5) pp 366-74 2013
[LEXNET D21 2013] Vermeeren G Thielens A Aerts S Joseph W
Martens L Oliveira C Mackowiak M Correia LM
Pejanovic-Djurisic M Veljovic Z Nešković A
Koprivica M Gati A Varsier N Hadjem A Wiart J
ConilE ldquoD21 Current metrics for EMF exposure
evaluationrdquo LEXNET project April 2013
[LEXNET D22 2013] Wiedemann P M Freudenstein F ldquoD22 Risk and
exposure perceptionrdquo LEXNET project July 2013
[LEXNET D23 2013] Vermeeren G Plets D Joseph W Martens L Conil E
Varsier N Wiart J Corre Y Oliveira C Sebastiatildeo D
Correia LM Aguumlero R Diez L Rodriacuteguez L Koprivica
M Nešković A Popović M Milinković J Nikšić S ldquoD23
Scenariosrdquo LEXNET project November 2013
[LEXNET D24 2013] Conil E ldquoD24 Global Wireless Exposure Metric
Definitionrdquo LEXNET project October 2013
Document ID D26 Global Wireless Exposure Metric DefinitionFP7 Contract ndeg318273
Version V4 47Dissemination level PU
[LEXNET D32 2014] BoriesS (ed) ldquoD32 Wideband dosimeter design study amp
performances characterizationrdquo LEXNET project July
2014
[LEXNET D41 2013] Bories S Fang Y Brown TBegaud X Pinto Y Ciblat P
Ksairi N De Domenico A Clemente A Fernandez Y
Lalam M Masera E Wilson M Tesanovic M Kocan E
Pejanovic-Djurisic M Veljovic Z Milatović B Popović M
Nešković A Koprivica M Voinescu A Dragomir D
Slusanschi E laquo D41 Promising Low Exposure Index
Solutions for Components and Transmission
Techniques raquo LEXNET project November 2013
[LEXNET IR21 2013] ldquoNumerical toolsrdquo LEXNET project July 2013
[LEXNET IR51 2013] ldquoSmart low-EMF architectures state of the art and way
forwardrdquo LEXNET project May 2013
[LEXNET D25 2014] Wiedemann P M Freudenstein F ldquoD25 Risk and
exposure perceptionrdquo LEXNET project November 2014
[LEXNET D42 2014] Bories S Fang Y Brown TBegaud X Pinto Y Ciblat P
Ksairi N De Domenico A Clemente A Fernandez Y
Lalam M Masera E Wilson M Tesanovic M Kocan E
Pejanovic-Djurisic M Veljovic Z Milatović B Popović M
Nešković A Koprivica M Voinescu A Dragomir D
Slusanschi E laquo D42 Performance Evaluation of Low
Exposure index solutions for components and
Transmission Techniques raquo LEXNET project November
2014
[MaOC12] Mackowiak M Oliveira C and Correia L M RadiationPattern of Wearable Antennas A Statistical Analysis of theInfluence of the Human Body International Journal ofWireless Information Networks Vol 19 No 3 pp 209-218 2012
[MaCo13] Mackowiak M and Correia L M Statistical Model of theInfluence of Body Dynamics on the Radiation Pattern ofWearable Antennas in Off-Body Radio ChannelsWireless Personal Communications 101007s11277-013-1193-x May 2013
[Mack13] Mackowiak M Modelling MIMO Systems in Body AreaNetworks in Outdoors PhD Thesis IST - University ofLisbon Lisbon Portugal 2013
Document ID D26 Global Wireless Exposure Metric DefinitionFP7 Contract ndeg318273
Version V4 48Dissemination level PU
[NAGAOKA08] Nagaoka T and Watanabe S Postured voxel-based
human models for electromagnetic dosimetry Physics in
medicine and biology vol 53 pp 7047-7061 2008
[PLETS12] Plets D Joseph W Vanhecke K Tanghe E and Martens
L 2012 Coverage Prediction and Optimization Algorithms
for Indoor Environments EURASIP 2012123
[PLETS14] Plets D Joseph W Aerts S Vanhecke K and Martens L
accepted 2014 Prediction and comparison of downlink
electric-field and uplink localized SAR values for realistic
indoor wireless planning Radiation Protection Dosimetry
[SaNC10] SaloJ Nur-AlamM and ChangK Practical Introduction
to LTE Radio Planning white paper European
Communications Engineering (ECE) Ltd Espoo Finland
Nov 2010 (wwweceltdcom)
[TAFLOVE00] Taflove A and Hagness S C 2000 Computational
Electrodynamics The Finite-Difference Time-Domain
Method 2nd edn (Boston MA Artech House Publishers)
[TNS10] TNS Sofres survey Observatoire Socieacutetal du teacuteleacutephone
mobile Dec 2010
[VAJM13] Vermeeren G Aerts S Plets D Joseph W Martens
LConil E Varsier N Wiart J Core YOliveira C Sebastiatildeo
DCorreia L Aguumlero R Diez L Rodriacuteguez L Koprivica M
Nešković A Popović M Milinković J Nikšić S D23
Scenarios LEXNET project Novembre 2013
[WIART08] Wiart J Hadjem A Wong M F and Bloch I Analysis of
RF exposure in the head tissues of children and adults
Physics in medicine and biology vol 53 pp 3681-3695
2008
[WINNER D112 2007] Kyoumlsti P et al D112 WINNER II Channel models
WINNER project September 2007
[ZHAO02] Zhao X Kivinen J Vainikainen P Skog K Propagation
characteristics for wideband outdoor mobile
communications at 53 GHz IEEE J Sel Areas Commun
vol 20 pp 507ndash514 2002
Document ID D26 Global Wireless Exposure Metric DefinitionFP7 Contract ndeg318273
Version V4 49Dissemination level PU
APPENDIX 1 NUMERICAL DOSIMETRIC SIMULATIONS
This appendix describes the main assumptions concerning the frequency bands used
in the numerical dosimetric simulations
Table A1 gives the frequency bands used for SAR simulations as well as theservices and DLUL frequencies considered in each of those frequency bands forLEXNET studies Note that at these frequencies (especially at the higher ones) nolarge differences are expected between SAR results [CHLWW08] Accordingly forthe sake of simplicity it is assumed that
the same frequency band is assumed for both up- and down-link each frequency band may cover more than one system (eg simulation at
1940 MHz covers both GSM1800 and UMTS2000)
Table A1 Technical specifications for LEXNET selected services
SAR
simulation
frequency
band [MHz]
RAT
RAT frequency band [MHz]
DL UL
400 LTE 400 380 - 470
900
LTE 800 875- 885 830 - 840
GSM 900 935 - 960 890 - 915
UMTS 900 925 ndash 960 880 ndash 915
1940
GSM 1800 1805 - 1880 1710 - 1785
UMTS 2000 2110 - 2170 1900 - 1980
2600WiFi bgn 2400 - 2484
LTE 2600 2620 - 2690 2500 - 2570
For the WiFi an between 5470 and 5725 MHz frequency bands no SAR simulation
was performed yet
Document ID D26 Global Wireless Exposure Metric DefinitionFP7 Contract ndeg318273
Version V4 50Dissemination level PU
APPENDIX 2 INTERNAL REVIEW
Reviewer 1 Yoann Corre Reviewer 2 Mick Wilson
Answer Comments Type Answer Comments Type
1 Is the deliverable in accordance with
(i) the Descriptionof Work
Yes
No
M
m
a
Yes
No
M
m
a
(ii) the internationalState of theArt
Yes
No
M
m
a
Yes
No
M
m
a
2 Is the quality of the deliverable in a status
(i) that allows tosend it to EC
Yes
No
M
m
a
Yes
No
M
m
a
(ii) that needsimprovement ofthe writing bythe editor of thedeliverable
Yes
No
See proposedenhancements
In particular thepresentation of the basic EIconcept could be improvedin the Abstract Introductionsection 21 and Conclusion
M
m
a
Yes
No
See comments onSection 3
M
m
a
(iii) that needsfurther work bythe partnersresponsible forthe deliverable
Yes
No
Mostly minor changes Seethe proposedenhancements
Section 44 is a copy-pastof a whole section in D33Either D26 or D33 must bechanged to avoidredundancy (replacing thewhole description by asummary adapted to theintegrated deliverable)
It must be made more clearwhere the reader will findthe missing SAR data andthe announced uncertaintystudy results
M
m
a
Yes
No
M
m
a
Type of comments M = Major comment m = minor comment a = advice
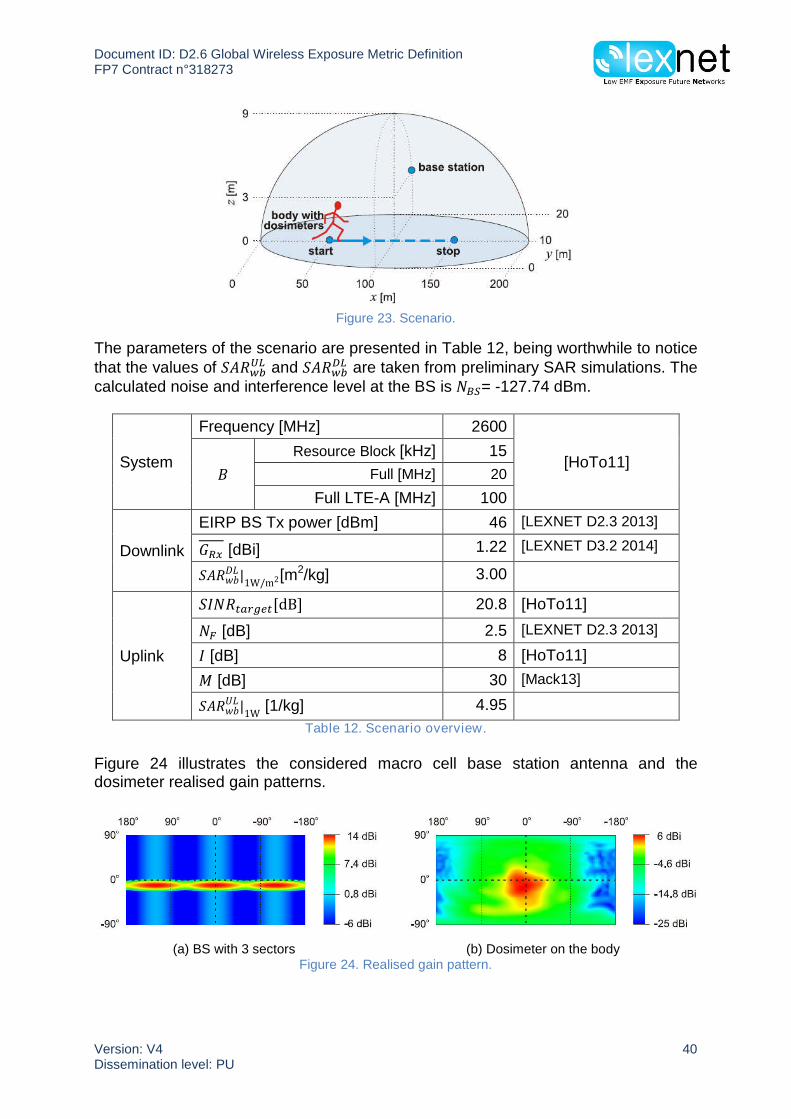
Document ID D26 Global Wireless Exposure Metric DefinitionFP7 Contract ndeg318273
Version V4 42Dissemination level PU
WA_L 28516 2138
WA_R 9060 680
TO_F 18436 1383
Table 13 Downlink Exposure
The WA_L dosimeter and the isotropic probe exposure indexes are very similarbecause of the LOS propagation conditions The same is valid for the WA_Bdosimeter which is also in LOS with the base station For the other dosimeters theexposure index is naturally lower due to the body shadowing In this scenario theuse of a wearable dosimeter in the front or in the right side of the body displays anexposure index reading about 4 times lower than the real user exposure
442 EI for uplink
The average Tx power from the mobile phone hold near HE_L and HE_R ispresented in Figure 27 The uplink power control is clearly noticeable by the highertransmitted power in HE_R as the mobile terminal adjusts the Tx power tocompensate for the higher channel fading
Figure 27 Tx power for straight6min scenario at 2600 MHz for LTE-A
The distribution of the Tx power at HE_L and HE_R is presented in Figure 28 Inspite of the different intensities HE_L and HE_R Tx powers present a similardistribution
Document ID D26 Global Wireless Exposure Metric DefinitionFP7 Contract ndeg318273
Version V4 43Dissemination level PU
(a) HE_L (b) HE_R
Figure 28 Tx power histograms
The average transmitted power and the uplink exposure index from the mobileterminals located near left and right side of the head ( e HE_L and HE_R) arepresented in Table 14
௫ [mW] ܫܧ [mJkg]
RB FULL FULL_A RB FULL FULL_A
HE_L mobile 002 165 827 003 295 1474
HE_R mobile 008 838 4191 014 1493 7468
Table 14 Uplink Exposure
These results show the importance of the propagation conditions in the EMFexposure Due to the non LOS conditions the exposure index in the right side of thehead is 5 times higher than the one on the left side
5 CONCLUSION
In this deliverable a global metric is defined to test and optimize wirelesstelecommunication networks in terms of EMF exposureThe proposed metric called Exposure Index (EI) has the advantage to overpass thelimitations of the actual metrics that in fact are managing separately the exposureinduced by personal devices and the one induced by the network equipment (basestations and access points) But devices base station antennas and access pointsare definitely parts of the same wireless environment and the global wirelessexposure is induced by all of them
The EI is described with an analytical model with input variables describing thecoverage area of interest the accessible networks the population and the habits interms of location and of wireless devices usage The output is the EI covering theday-to-day averaged exposure of population in a given area incurred by an entirewireless network from base stations and access points to individual devices
In this deliverable the analytical model of EI has been detailed and the inputvariables defined Then the use of the EI to minimize the EMF exposure in wirelesscommunication networks is presented in connection with work-package 4 dedicated
Document ID D26 Global Wireless Exposure Metric DefinitionFP7 Contract ndeg318273
Version V4 44Dissemination level PU
to innovative radio components and work-package 5 focused on networks topologiesand technologies
The way to process a complete calculation of EI is illustrated on three deterministicexamples The first example considers comparison of indoor 3G macro and femtoscenarios The second example is taking into account an adult population in a LTEmacro urban environment with their data usage specifications Both examples arebased on a real environment representation and network simulation tools have beenused to simulate the up and down links The third example illustrates how dosimetermeasurements can be used to assess the EI
In our further work the statistical description of input variables will enable topropagate the variability and the uncertainty in the EI model making it more accurateand reliable Results will be made available in the future deliverable D28 DeliverableD33 will detail the used methodology to assess the EI and for the last year of theproject the work of partners involved in WP6 will be enhanced as they will be incharge of the implementation and evaluation of the EI
Document ID D26 Global Wireless Exposure Metric DefinitionFP7 Contract ndeg318273
Version V4 45Dissemination level PU
6 REFERENCES
[ALIAGA06] Aliaga C How is the time of women and men distributed
in Europe Statistics in focus population and social
conditions April 2006
[APVJM13] Aerts S Plets D Verloock L Joseph W and MartensL Assessment and comparison of RF-EMF exposure infemtocell and macrocell scenarios Radiat Protec Dosim2013
[BCL12] Brau M Corre Y Lostanlen Y Assessment of 3D
network coverage performance from dense small-cell LTE
Communications (ICC) 2012 IEEE International
Conference on
[Carte09] httpwwwcartesfrancefr
[CISCO13] Cisco Visual Networking Index Global Mobile Data Traffic
Forecast Update 2012-2017 February 2013
[CHLWW08] ConilE Hadjem A Lacroux F Wong M F and Wiart J
Variability analysis of SAR from 20 MHz to 24 GHz for
different adult and child models using finite-difference
time-domain Phys Med Biol vol 53 pp 1511-1525
2008
[CHRIST10] Christ A Kainz W Hahn E G Honegger K Zefferer
M Neufeld E Rascher W Janka R Bautz W Chen
J Kiefer B Schmitt P Hollenbach H-P Shen J
Oberle M Szczerba D Kam A Guag J W amp Kuster
N The Virtual Family--development of surface-based
anatomical models of two adults and two children for
dosimetric simulations Phys Med Biol vol 55 pp 23-38
2010
[CMKB06] Cooper TG Mann SM Khalid M and Blackwell RP
Public exposure to radio waves near GSM microcell and
picocell base stations Journal of the Society for
Radiological Protection Vol 26 No 2 pp 199-211 June
2006
[GCWW10] Gati A Conil E Wong MF Wiart J Duality between
uplink local and downlink whole body exposures in
operating Networks IEEE Transactions on EMC Vol 52
ndeg4 Nov 2010
Document ID D26 Global Wireless Exposure Metric DefinitionFP7 Contract ndeg318273
Version V4 46Dissemination level PU
[HoTo11] Hola HG And Toskala A LTE for UMTS Evolution to
LTE-Advanced Wiley UK 2011
[INFORMA12] Informa telecom amp Media Small Cell Market Update June
2012
[INSEE11] Insee enquecircte Emploi du temps 2009-2010 Insee
Premiere Ndeg 1377 November 2011
[IST] httpwwwist-winnerorg
[KALLIOLA02] Kalliola K Sulonen K Laitinen H Kiveks O Krogerus J
Vainikainen P Angular power distribution and mean
effective gain of mobile antenna in different propagation
environments IEEE Trans Veh Technol vol 51 pp 823ndash
838 2002
[KIENTEGA11] Thierry Kientega EConil A Gati A Hadjem ERichalot M-F Wong OPicon Joe Wiart Analysis of thedistribution of specific absorption rate induced by fiveplane waves with a fast and new method in VisibleHuman URSI conference 2011
[LAUER13] Lauer O Frei P Gosselin M C Joseph W Roumloumlsli M
and Froumlhlich J Combining near- and far-field exposure for
an organ-specific and whole-body RF-EMF proxy for
epidemiological research a reference case
Bioelectromagnetics vol 34(5) pp 366-74 2013
[LEXNET D21 2013] Vermeeren G Thielens A Aerts S Joseph W
Martens L Oliveira C Mackowiak M Correia LM
Pejanovic-Djurisic M Veljovic Z Nešković A
Koprivica M Gati A Varsier N Hadjem A Wiart J
ConilE ldquoD21 Current metrics for EMF exposure
evaluationrdquo LEXNET project April 2013
[LEXNET D22 2013] Wiedemann P M Freudenstein F ldquoD22 Risk and
exposure perceptionrdquo LEXNET project July 2013
[LEXNET D23 2013] Vermeeren G Plets D Joseph W Martens L Conil E
Varsier N Wiart J Corre Y Oliveira C Sebastiatildeo D
Correia LM Aguumlero R Diez L Rodriacuteguez L Koprivica
M Nešković A Popović M Milinković J Nikšić S ldquoD23
Scenariosrdquo LEXNET project November 2013
[LEXNET D24 2013] Conil E ldquoD24 Global Wireless Exposure Metric
Definitionrdquo LEXNET project October 2013
Document ID D26 Global Wireless Exposure Metric DefinitionFP7 Contract ndeg318273
Version V4 47Dissemination level PU
[LEXNET D32 2014] BoriesS (ed) ldquoD32 Wideband dosimeter design study amp
performances characterizationrdquo LEXNET project July
2014
[LEXNET D41 2013] Bories S Fang Y Brown TBegaud X Pinto Y Ciblat P
Ksairi N De Domenico A Clemente A Fernandez Y
Lalam M Masera E Wilson M Tesanovic M Kocan E
Pejanovic-Djurisic M Veljovic Z Milatović B Popović M
Nešković A Koprivica M Voinescu A Dragomir D
Slusanschi E laquo D41 Promising Low Exposure Index
Solutions for Components and Transmission
Techniques raquo LEXNET project November 2013
[LEXNET IR21 2013] ldquoNumerical toolsrdquo LEXNET project July 2013
[LEXNET IR51 2013] ldquoSmart low-EMF architectures state of the art and way
forwardrdquo LEXNET project May 2013
[LEXNET D25 2014] Wiedemann P M Freudenstein F ldquoD25 Risk and
exposure perceptionrdquo LEXNET project November 2014
[LEXNET D42 2014] Bories S Fang Y Brown TBegaud X Pinto Y Ciblat P
Ksairi N De Domenico A Clemente A Fernandez Y
Lalam M Masera E Wilson M Tesanovic M Kocan E
Pejanovic-Djurisic M Veljovic Z Milatović B Popović M
Nešković A Koprivica M Voinescu A Dragomir D
Slusanschi E laquo D42 Performance Evaluation of Low
Exposure index solutions for components and
Transmission Techniques raquo LEXNET project November
2014
[MaOC12] Mackowiak M Oliveira C and Correia L M RadiationPattern of Wearable Antennas A Statistical Analysis of theInfluence of the Human Body International Journal ofWireless Information Networks Vol 19 No 3 pp 209-218 2012
[MaCo13] Mackowiak M and Correia L M Statistical Model of theInfluence of Body Dynamics on the Radiation Pattern ofWearable Antennas in Off-Body Radio ChannelsWireless Personal Communications 101007s11277-013-1193-x May 2013
[Mack13] Mackowiak M Modelling MIMO Systems in Body AreaNetworks in Outdoors PhD Thesis IST - University ofLisbon Lisbon Portugal 2013
Document ID D26 Global Wireless Exposure Metric DefinitionFP7 Contract ndeg318273
Version V4 48Dissemination level PU
[NAGAOKA08] Nagaoka T and Watanabe S Postured voxel-based
human models for electromagnetic dosimetry Physics in
medicine and biology vol 53 pp 7047-7061 2008
[PLETS12] Plets D Joseph W Vanhecke K Tanghe E and Martens
L 2012 Coverage Prediction and Optimization Algorithms
for Indoor Environments EURASIP 2012123
[PLETS14] Plets D Joseph W Aerts S Vanhecke K and Martens L
accepted 2014 Prediction and comparison of downlink
electric-field and uplink localized SAR values for realistic
indoor wireless planning Radiation Protection Dosimetry
[SaNC10] SaloJ Nur-AlamM and ChangK Practical Introduction
to LTE Radio Planning white paper European
Communications Engineering (ECE) Ltd Espoo Finland
Nov 2010 (wwweceltdcom)
[TAFLOVE00] Taflove A and Hagness S C 2000 Computational
Electrodynamics The Finite-Difference Time-Domain
Method 2nd edn (Boston MA Artech House Publishers)
[TNS10] TNS Sofres survey Observatoire Socieacutetal du teacuteleacutephone
mobile Dec 2010
[VAJM13] Vermeeren G Aerts S Plets D Joseph W Martens
LConil E Varsier N Wiart J Core YOliveira C Sebastiatildeo
DCorreia L Aguumlero R Diez L Rodriacuteguez L Koprivica M
Nešković A Popović M Milinković J Nikšić S D23
Scenarios LEXNET project Novembre 2013
[WIART08] Wiart J Hadjem A Wong M F and Bloch I Analysis of
RF exposure in the head tissues of children and adults
Physics in medicine and biology vol 53 pp 3681-3695
2008
[WINNER D112 2007] Kyoumlsti P et al D112 WINNER II Channel models
WINNER project September 2007
[ZHAO02] Zhao X Kivinen J Vainikainen P Skog K Propagation
characteristics for wideband outdoor mobile
communications at 53 GHz IEEE J Sel Areas Commun
vol 20 pp 507ndash514 2002
Document ID D26 Global Wireless Exposure Metric DefinitionFP7 Contract ndeg318273
Version V4 49Dissemination level PU
APPENDIX 1 NUMERICAL DOSIMETRIC SIMULATIONS
This appendix describes the main assumptions concerning the frequency bands used
in the numerical dosimetric simulations
Table A1 gives the frequency bands used for SAR simulations as well as theservices and DLUL frequencies considered in each of those frequency bands forLEXNET studies Note that at these frequencies (especially at the higher ones) nolarge differences are expected between SAR results [CHLWW08] Accordingly forthe sake of simplicity it is assumed that
the same frequency band is assumed for both up- and down-link each frequency band may cover more than one system (eg simulation at
1940 MHz covers both GSM1800 and UMTS2000)
Table A1 Technical specifications for LEXNET selected services
SAR
simulation
frequency
band [MHz]
RAT
RAT frequency band [MHz]
DL UL
400 LTE 400 380 - 470
900
LTE 800 875- 885 830 - 840
GSM 900 935 - 960 890 - 915
UMTS 900 925 ndash 960 880 ndash 915
1940
GSM 1800 1805 - 1880 1710 - 1785
UMTS 2000 2110 - 2170 1900 - 1980
2600WiFi bgn 2400 - 2484
LTE 2600 2620 - 2690 2500 - 2570
For the WiFi an between 5470 and 5725 MHz frequency bands no SAR simulation
was performed yet
Document ID D26 Global Wireless Exposure Metric DefinitionFP7 Contract ndeg318273
Version V4 50Dissemination level PU
APPENDIX 2 INTERNAL REVIEW
Reviewer 1 Yoann Corre Reviewer 2 Mick Wilson
Answer Comments Type Answer Comments Type
1 Is the deliverable in accordance with
(i) the Descriptionof Work
Yes
No
M
m
a
Yes
No
M
m
a
(ii) the internationalState of theArt
Yes
No
M
m
a
Yes
No
M
m
a
2 Is the quality of the deliverable in a status
(i) that allows tosend it to EC
Yes
No
M
m
a
Yes
No
M
m
a
(ii) that needsimprovement ofthe writing bythe editor of thedeliverable
Yes
No
See proposedenhancements
In particular thepresentation of the basic EIconcept could be improvedin the Abstract Introductionsection 21 and Conclusion
M
m
a
Yes
No
See comments onSection 3
M
m
a
(iii) that needsfurther work bythe partnersresponsible forthe deliverable
Yes
No
Mostly minor changes Seethe proposedenhancements
Section 44 is a copy-pastof a whole section in D33Either D26 or D33 must bechanged to avoidredundancy (replacing thewhole description by asummary adapted to theintegrated deliverable)
It must be made more clearwhere the reader will findthe missing SAR data andthe announced uncertaintystudy results
M
m
a
Yes
No
M
m
a
Type of comments M = Major comment m = minor comment a = advice
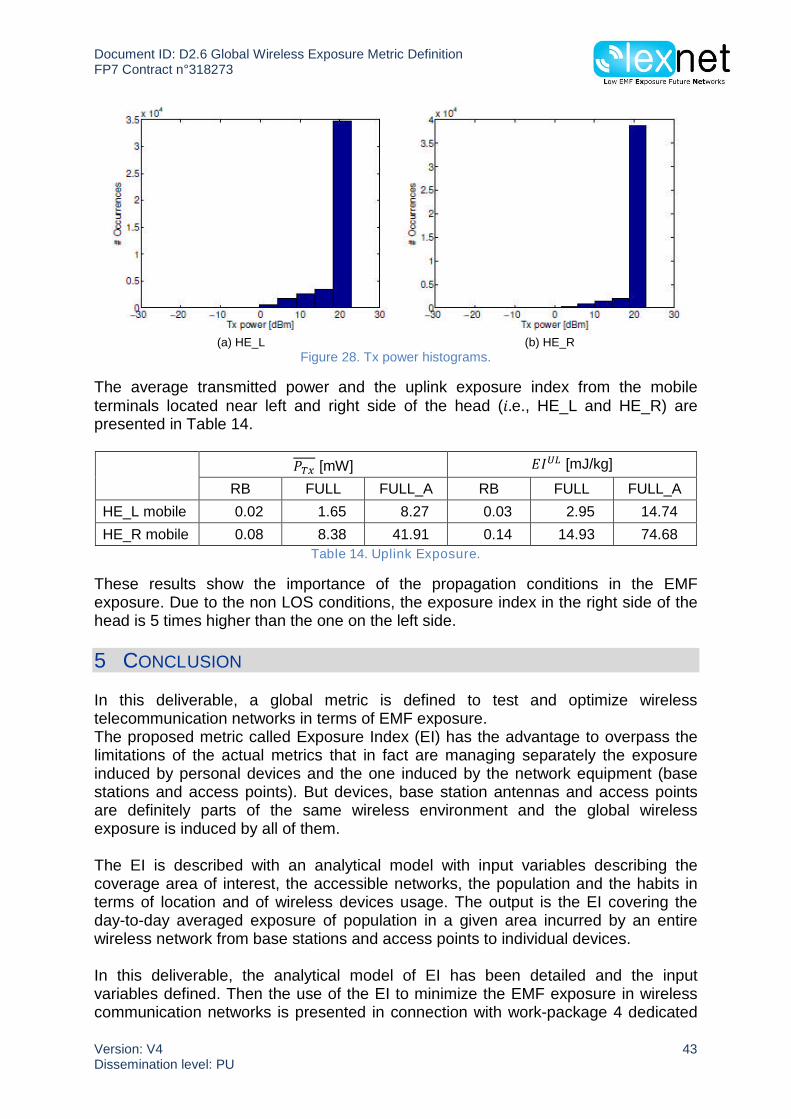
Document ID D26 Global Wireless Exposure Metric DefinitionFP7 Contract ndeg318273
Version V4 50Dissemination level PU
APPENDIX 2 INTERNAL REVIEW
Reviewer 1 Yoann Corre Reviewer 2 Mick Wilson
Answer Comments Type Answer Comments Type
1 Is the deliverable in accordance with
(i) the Descriptionof Work
Yes
No
M
m
a
Yes
No
M
m
a
(ii) the internationalState of theArt
Yes
No
M
m
a
Yes
No
M
m
a
2 Is the quality of the deliverable in a status
(i) that allows tosend it to EC
Yes
No
M
m
a
Yes
No
M
m
a
(ii) that needsimprovement ofthe writing bythe editor of thedeliverable
Yes
No
See proposedenhancements
In particular thepresentation of the basic EIconcept could be improvedin the Abstract Introductionsection 21 and Conclusion
M
m
a
Yes
No
See comments onSection 3
M
m
a
(iii) that needsfurther work bythe partnersresponsible forthe deliverable
Yes
No
Mostly minor changes Seethe proposedenhancements
Section 44 is a copy-pastof a whole section in D33Either D26 or D33 must bechanged to avoidredundancy (replacing thewhole description by asummary adapted to theintegrated deliverable)
It must be made more clearwhere the reader will findthe missing SAR data andthe announced uncertaintystudy results
M
m
a
Yes
No
M
m
a
Type of comments M = Major comment m = minor comment a = advice