Lewis Adam Whitley April, 2018 Director of Thesis: Qin ...
50
EDUCATIONAL DATA MINING AND ITS USES TO PREDICT THE MOST PROSPEROUS LEARNING ENVIRONMENT by Lewis Adam Whitley April, 2018 Director of Thesis: Qin Ding, Ph.D. Major Department: Department of Computer Science The use of technology and data analysis within the classroom has been a resourceful tool in order to collect, study, and compare a student’s level of success. With the large amount of regularly collected data from student behaviors, and course structure there is more than enough resources in order to find student success with data analysis. A method of data analysis within a learning environment is called Educational Data Mining (EDM), which has proven to be an emerging trend when it involves the development of exploration techniques and the analysis of educational data. EDM has been able to contribute to the understanding of student behavior, as well as factors that influence both student actions and their success. The study of student success within EDM has focused on student learning patterns, student to teacher culture, and teaching techniques. In this research we will look at uses of technology and data mining in an EDM setting and compare the success of findings. Using past experience of other research we will determine which method would be best in order to look at a learning environment, and try to find which factors will affect a student’s academic performance.
Transcript of Lewis Adam Whitley April, 2018 Director of Thesis: Qin ...
EDUCATIONAL DATA MINING AND ITS USES TO PREDICT THE MOST
PROSPEROUS LEARNING ENVIRONMENT
by
Lewis Adam Whitley
April, 2018
Director of Thesis: Qin Ding, Ph.D.
Major Department: Department of Computer Science
The use of technology and data analysis within the classroom has been a resourceful tool
in order to collect, study, and compare a student’s level of success. With the large amount of
regularly collected data from student behaviors, and course structure there is more than enough
resources in order to find student success with data analysis. A method of data analysis within a
learning environment is called Educational Data Mining (EDM), which has proven to be an
emerging trend when it involves the development of exploration techniques and the analysis of
educational data. EDM has been able to contribute to the understanding of student behavior, as
well as factors that influence both student actions and their success. The study of student success
within EDM has focused on student learning patterns, student to teacher culture, and teaching
techniques. In this research we will look at uses of technology and data mining in an EDM
setting and compare the success of findings. Using past experience of other research we will
determine which method would be best in order to look at a learning environment, and try to find
which factors will affect a student’s academic performance.

EDUCATIONAL DATA MINING AND ITS USES TO PREDICT THE MOST
PROSPEROUS LEARNING ENVIRONMENT
A Thesis
Presented To the Faculty of the Department of Computer Science
East Carolina University
In Partial Fulfillment of the Requirements for the Degree
Master of Science in Software Engineering
by
Lewis Adam Whitley
April, 2018

© Lewis Adam Whitley, 2018
Educational Data Mining and its Uses to Predict the Most
Prosperous Learning Environment
by
Lewis Adam Whitley
APPROVED BY:
DIRECTOR OF
THESIS: _______________________________________________________________
Qin Ding, PhD.
COMMITTEE MEMBER: ______________________________________________
Nasseh Tabrizi, PhD.
COMMITTEE MEMBER: ______________________________________________
Mark Hills, PhD.
CHAIR OF THE DEPARTMENT
OF COMPUTER SCIENCE: ____________________________________________
Venkat Gudivada, PhD.
DEAN OF THE
GRADUATE SCHOOL: ________________________________________________
Paul J. Gemperline, PhD.

ACKNOWLEDGEMENTS
Firstly, I would like to express my gratitude to my supervisor, Dr. Qin Ding, for her
advice and guidance throughout my master degree study.
I would also like to extend my thanks to Dr. Junhua Ding and the faculty who were a part
of the 2013 Computer Science REU program, as it was that time in which I knew I wanted to
come to ECU for my higher education degree.
Great thanks also goes to my parents, and wife who supported me throughout this
process.
Lastly, I would like to thank anyone who have contributed to the success of this thesis.
TABLE OF CONTENTS
LIST OF TABLES ........................................................................................................................ vii
LIST OF FIGURES ..................................................................................................................... viii
CHAPTER 1 INTRODUCTION .................................................................................................... 1
1.1. Motivation and Objectives ............................................................................................... 1
1.2. Structure of Thesis Proposal ............................................................................................ 3
CHAPTER 2 LITERATURE REVIEW ......................................................................................... 4
2.1. Data Collection and Database Development .................................................................... 4
2.1.1. Blackbox ................................................................................................................... 4
2.1.2. Classroom Sentinel ................................................................................................... 5
2.2. Data Mining Techniques .................................................................................................. 6
2.2.1. Association Rule ....................................................................................................... 6
2.2.2. Classification Rule .................................................................................................... 6
2.2.3. Clustering Rule ......................................................................................................... 7
2.3. Education Data Mining Execution ................................................................................... 7
CHAPTER 3 RESEARCH DESIGN ............................................................................................ 10
3.1. Data Selection ................................................................................................................ 10
3.1.1. Average GPA .......................................................................................................... 11
3.1.2. Enrollment............................................................................................................... 12
3.1.3. Graduation/Retention .............................................................................................. 13
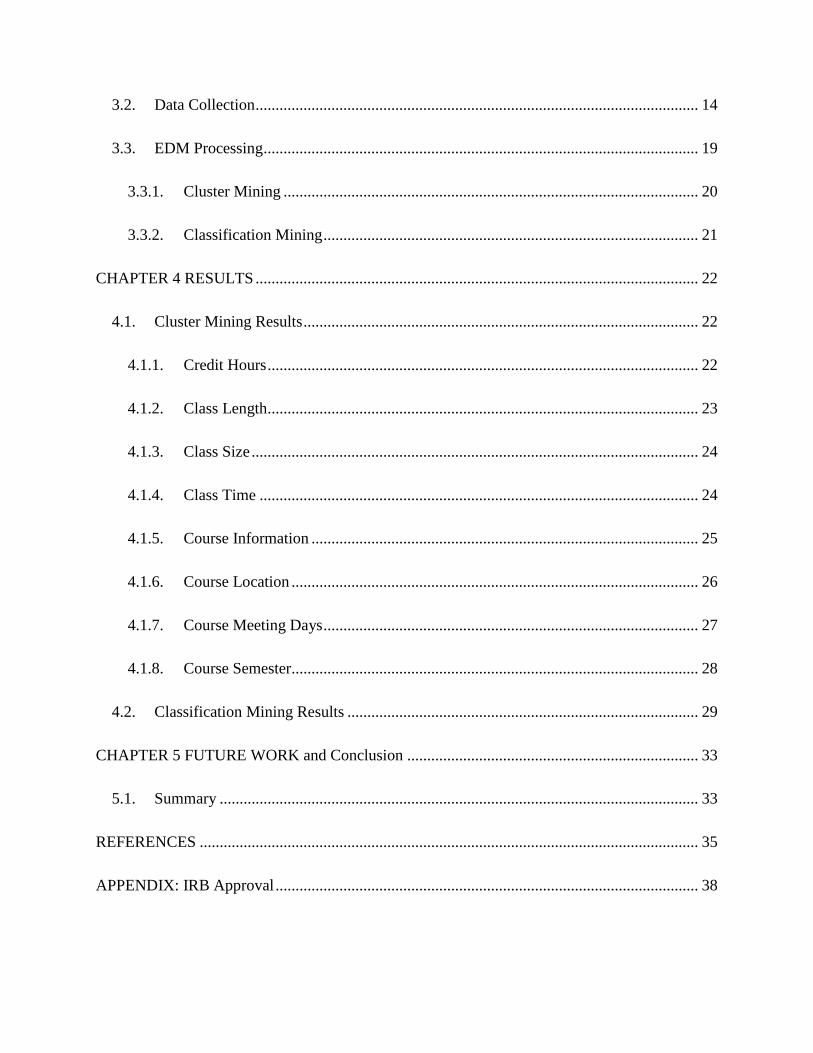
3.2. Data Collection ............................................................................................................... 14
3.3. EDM Processing ............................................................................................................. 19
3.3.1. Cluster Mining ........................................................................................................ 20
3.3.2. Classification Mining .............................................................................................. 21
CHAPTER 4 RESULTS ............................................................................................................... 22
4.1. Cluster Mining Results ................................................................................................... 22
4.1.1. Credit Hours ............................................................................................................ 22
4.1.2. Class Length............................................................................................................ 23
4.1.3. Class Size ................................................................................................................ 24
4.1.4. Class Time .............................................................................................................. 24
4.1.5. Course Information ................................................................................................. 25
4.1.6. Course Location ...................................................................................................... 26
4.1.7. Course Meeting Days .............................................................................................. 27
4.1.8. Course Semester...................................................................................................... 28
4.2. Classification Mining Results ........................................................................................ 29
CHAPTER 5 FUTURE WORK and Conclusion ......................................................................... 33
5.1. Summary ........................................................................................................................ 33
REFERENCES ............................................................................................................................. 35
APPENDIX: IRB Approval .......................................................................................................... 38
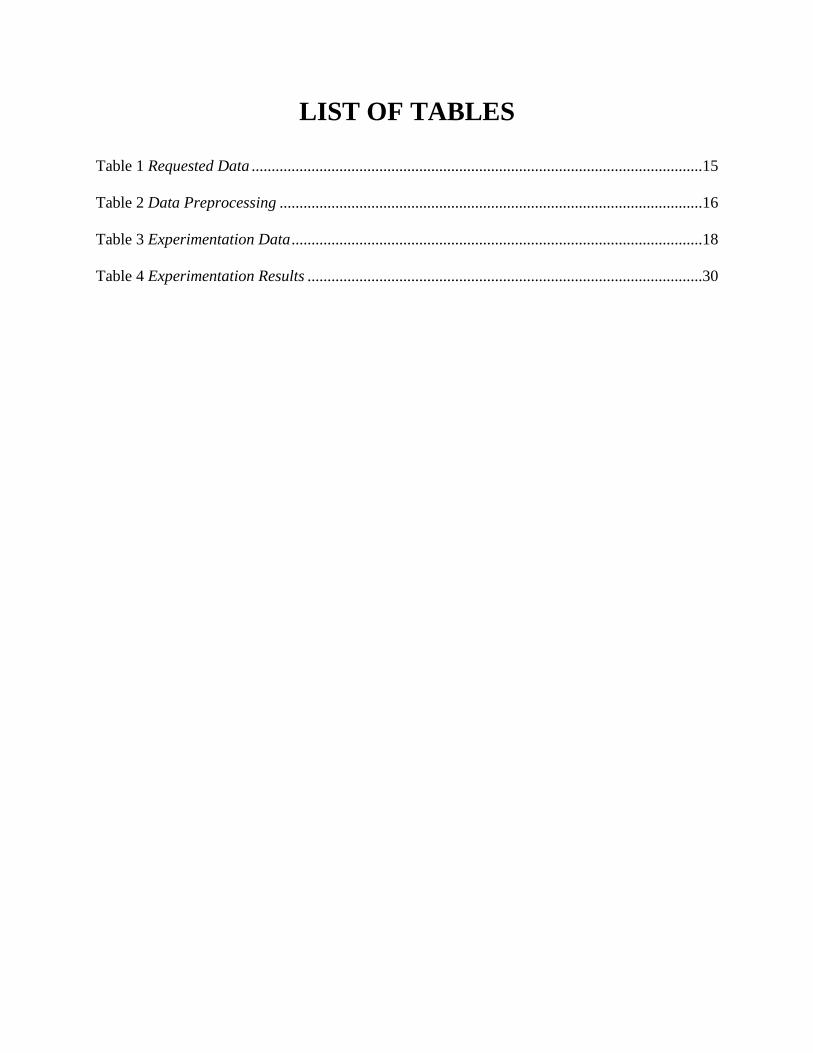
LIST OF TABLES
Table 1 Requested Data .................................................................................................................15
Table 2 Data Preprocessing ..........................................................................................................16
Table 3 Experimentation Data .......................................................................................................18
Table 4 Experimentation Results ...................................................................................................30
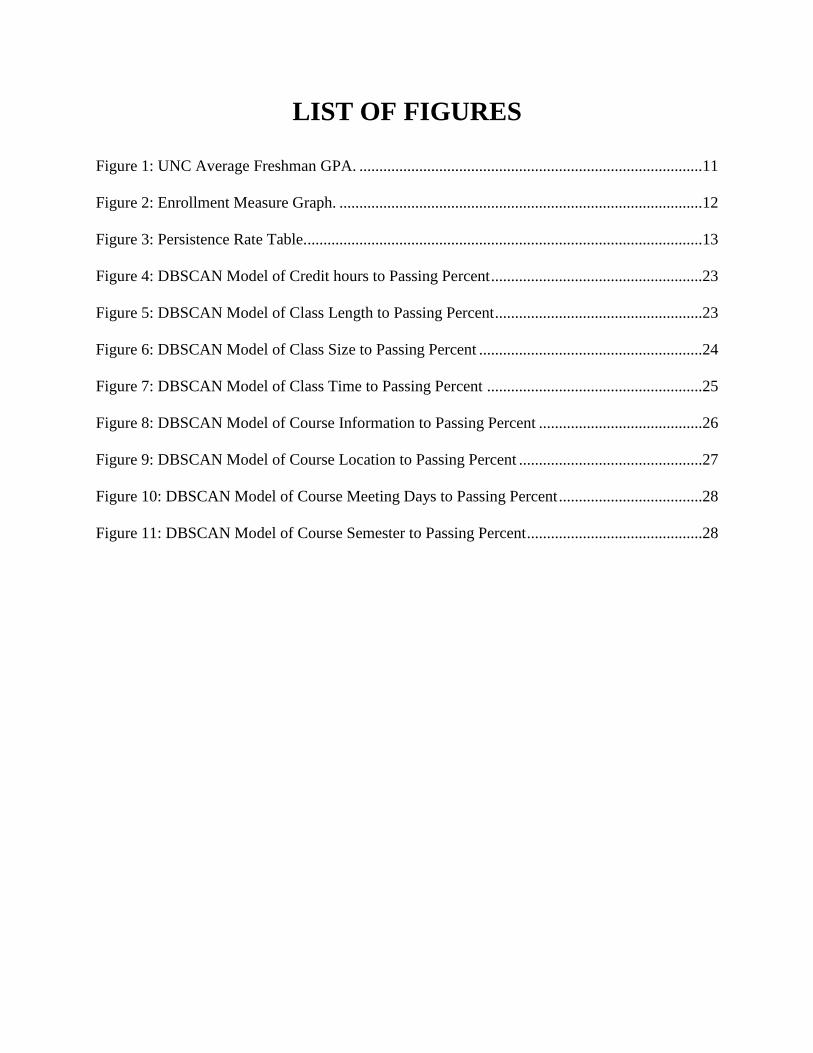
LIST OF FIGURES
Figure 1: UNC Average Freshman GPA. ......................................................................................11
Figure 2: Enrollment Measure Graph. ...........................................................................................12
Figure 3: Persistence Rate Table....................................................................................................13
Figure 4: DBSCAN Model of Credit hours to Passing Percent .....................................................23
Figure 5: DBSCAN Model of Class Length to Passing Percent ....................................................23
Figure 6: DBSCAN Model of Class Size to Passing Percent ........................................................24
Figure 7: DBSCAN Model of Class Time to Passing Percent ......................................................25
Figure 8: DBSCAN Model of Course Information to Passing Percent .........................................26
Figure 9: DBSCAN Model of Course Location to Passing Percent ..............................................27
Figure 10: DBSCAN Model of Course Meeting Days to Passing Percent ....................................28
Figure 11: DBSCAN Model of Course Semester to Passing Percent ............................................28

CHAPTER 1 INTRODUCTION
The educational data mining community [12, 16] has defined Educational Data Mining
(EDM) as a growing discipline which is concerned with the development of methods for
exploring the unique types of data that come from an educational setting, and use this data in
order to better understand students and the settings in which they learn in. Past research found
has been primarily focused on the learning methods and behaviors of the students, as well as the
teaching methods used to find troubled students. Within this research project we will attempt to
use data from University of North Carolina at Pembroke, and process the data into environmental
factors that may or may not have effect on a student’s learning ability. We will use this data for
EDM methods discussed with the purpose to predict which environmental factors provide the
most influence on a student’s success when learning a new subject.
1.1. Motivation and Objectives
The primary motivation of this research is the importance of student’s success which can
affect the enrollment, retention, and graduation rate of a University or other educational
establishment.
With research in EDM already being focus within the student learning ability, student to
teacher culture, and teaching behaviors research within the learning environment has been a
neglected area that has shown some promise to enhance the learning performance of students.
The result of a course’s success can be measured by the number of students who have passed the
course compared to the number of students who have either failed or withdrawn from the class.
The ability of a student being able to pass or show a form of success to a course, or number or
courses taken will too have an impact on a program’s retention of students.
Being able to not only find a pattern to student’s success, but to find a way in which it is

2
possible to predict what environmental factors to be able to promote the learning potential of
students will be beneficial to educational systems. The information found between students and
environment will attract interest to low retention low graduation programs with the motivation to
renovate their programs with the goal to improve re-enrollment and graduation. Studies have
been able to show that environment can have an impact on the result of a student’s grade [23].
To further expand on past research and with the motivations stated earlier the project had the
following objectives.
Compare Universities to find schools with lower retention and graduation rates.
Collect and construct a database which will store course data from chosen a
University.
Compare EDM algorithms to suggest methods that will provide influence on
environmental factors in the student learning process.
Process data through EDM algorithms and provide results of possible predictions
for student success, and knowledge as to what factors will influence the learning
process most.
The University of North Carolina General Administration [20] was used with the purpose
to find data about University retention and graduation rates. The data received about courses will
be requested from the campus data collection within the University of choice. With the
expectation to provide faster aid in the processed data running with EDM algorithms the open
source data mining tool Weka [21,22] will be used.
By the end of the thesis the data provided should be expected to meet the following
research goals:
Establish a new area in which EDM can be used to find problematic areas for
3
student learning.
Generate results that prove the hypothesis that environmental factors can have an
effect on how successful a course is in regards to the number of students passing.
Provide information that can be grown upon in which future programs can work
with to better develop their program schedule with the goal to provide low
performance courses the most prosperous learning environment to improve
student success.
1.2. Structure of Thesis
This thesis consists of 5 chapters. These chapters will inhere of the following sections.
Chapter 1 is to briefly introduce the background of the research, along with the motivation and
objectives. Chapter 2 consists of the background studies on EDM and the related research that
includes technology, and data uses for the advancement of education. Chapter 3 presents an
initial plan to execute our research being able to provide which environmental factors will affect
the student’s ability to learn and succeed in an academic setting. Chapter 4 discusses the results
that are found within the research experimentation. Chapter 5 summarizes the goal of this
research, and possible future methods that may be done in order to improve on the finding
uncovered by this research.
CHAPTER 2 LITERATURE REVIEW
2.1. Data Collection and Database Development
The first and one of the more important aspects to data mining and EDM is the method
data is collected, and as well what data is collected [4, 12, 16]. With the growth of technology
used inside of a classroom, data collection has for the most part become automated receiving
student attempts, grades, and course data. Technology tools used with the classroom that collect
data can be used within the EDM process as they play a crucial role in finding non-influenced
data [16]. Tools that have been reviewed during the process of this research include Blackbox [2,
7], WebCAT [9], Classroom Sentinel [19], and Blackboard [11]. Tools that have been mentioned
in other research studies found were WebCat, BlueJ or the extention Blackbox, and CodeWrite
[14]. Looking closer into the technical tools Blackbox and Classroom Sentinel we will be able to
get a stronger understanding how the data collection is simplified, and how this data has been
used in past research and studies.
2.1.1. Blackbox
In past data mining studies have been conducted within single institution, or smaller
groups of people [2]. With the addition of tools such as Blackbox and the Classroom Sentinel
data collection can be collected within different institution even from other nations. The
Blackbox repository is used to collect data from novice programmers with the goal to find what
common issues are seen, and what areas to focus on within computer and information science
education. Being able to pull data from BlueJ, a Java programming environment specifically for
those who are learning object oriented programming languages, Blackbox can store and organize
data received from compilation. BlueJ being released in 1999 has grown to 1.8 million users

5
worldwide by 2012, but as an online connection is required for tracking usage the number of 1.8
million users are expected to be on a lower bound of possible activity [7].
The data design and requirements to assign data anonymously is possible to cause issues
within the database design. With the goal to prevent data being assigned to a person’s name or
location, the idea of using the projects name will be the primary identifier for a data’s input.
Along with fellow researchers the Blackbox project team could develop a design of what data to
collect. The data collected includes unique identifier, start and end programming sessions, use of
IDE tools, editing behavior, and optional participant identifier [7]. The Blackbox project would
go live on June 11, 2013, in which it would ask users of BlueJ if they would like to opt into the
program. Use of this data was able help answer research questions as frequent mistakes, common
and uncommon errors, time to fix errors, and how these errors evolve over time [2]. The use of
this data can already tell which problems will be more likely experienced throughout an
academic year.
2.1.2. Classroom Sentinel
As Blackbox was used for data collection, the Classroom Sentinel was introduced to
collect classroom data to find potential struggling students. The need for the Classroom Sentinel
was due to the push for accountability appointed by the No Child Left Behind Act in 2001 [19].
Prior to the introduction of the act schools would typically record data over the course of the
school year, and would rarely use the data to aid in day to day classroom environment. The
Classroom Sentinel is a web service that uses student data, and mine that data to find learning
patterns [19].
The goal of the Classroom Sentinel is to improve the day to day decision making process,
by providing teachers with a timely understanding of student proficiency patterns. This is done
6
by the web application storing and reviewing the administrative data reporting, and with
processing this data through active data mining methods alerts are provided to the teacher about
possible struggling students. Alerts given to teachers will provide an explanation of a student’s
troubled area, as well as workable solutions as how to fix these areas [19].
2.2. Data Mining Techniques
While there are many different techniques in the study of data mining, for this paper we
will focus on those that are used in the practice of EDM. Most commonly used EDM tasks are
association, classification, and clustering [6, 17, 18, 16]. The techniques used within each of
these tasks that are seen most in EDM would include decision trees, neural networks, and
Bayesian networks [16].
2.2.1. Association Rule
The use of association rule mining is to find relationships between items within a data set.
This method of data mining was originally developed for use on market basket data, but has been
proven to provide correlation between other types of data to include educational relationships
[8,18]. An example that is used in [8] would be an insurance company that looks to find a strong
correlation between two policies A and B, in the form of A => B, indicating those who held
policy A were likely to hold policy B. This would inform the insurance company to target sales
of policy B to those who hold policy A without policy B.
2.2.2. Classification Rule
Classification analysis is used to predict unlabeled patterns from known patterns [6, 17].
The method we will focus on for classification rule would be decision tree such as the C4.5
algorithm as this is the more popular method used. The decision tree algorithm will produce a

7
tree that models the relationship structure of the variables used. This tree will be able to illustrate
the prediction rules in the form of if x then y outcome [15]. Another way to explaining the use of
decision tree models is it will produce a prediction by starting at the leaf of the tree and
following the branches (conditions) back to the root (result) [17].
2.2.3. Clustering Rule
Clustering rule mining is the unsupervised classification of patterns in groups of like data
within N-dimensional space [5, 14, 17]. In EDM cluster mining has been used to group student
behavior as well to group schools to find similar and different attributes. Another use of cluster
data mining is used with the educational process mining (EPM). Differences between EDM and
EPM is the process of EDM is to predict results by focus on data dependencies and do not focus
on the whole data, while EPM aims to construct complete and compact educational models, and
to project information from logs into the model [5]. The way clustering data mining will be used
in EPM is to group like students together before the use of other traditional EDM methods such
as association, or classification rule mining. Popular clustering rule mining includes k-mean, and
expectation maximization [17].
2.3. Education Data Mining Execution
While EDM is a relatively new area of research within the data mining area, there has
been different experiments and topic reviews within this area [3]. As the experimentation and
review studies continue to increase the majority of topics would include comparing and
combining datamining techniques, while focusing the data used being student attributes with a
goal to find troubled students early by what type of data combinations to look for [2, 18, 19, 23].
Mentioned earlier in 2.3 majority of techniques used with EDM are classification
mining’s C4.5, BayesNet and cluster mining’s k-means method. Those that were tested between
8
incremental data and collective data, a superior testing method has found that classification
methods have the ability to show a higher percentage of classifier accuracy in which data is
tested by groups. If data cannot be separated by incremental methods such as by year, or section
then other effective proven methods include clustering data in like categories before process
mining. This clustering pre-classification method has proven to improve both quality, and size of
resulting data by five to ten percent per group [5].
The use of EDM with the purpose to find early identifiers of students who may need
special attention too has proven effective for use within the classroom setting. Using the tools
such as the Classroom Sentinel a web application can collect student data by grades, attendance,
and noted student work habits an instructor can receive a message about an extra need student.
These alerts will not only provide cause of student deficient performance but viable solutions to
implement [19].
Other areas that were covered in EDM implementation would be the ability of grade
improvement by course hybrid settings. As seen within [23] Peking University used student data
to include online activity, test scores, to understand factors that will promote improvement
within student learning. Data was collected between two diverse types of classroom situations,
one being a traditional classroom and the other was a small online classroom. Within this study it
was noticed that making full use of the small private online course resources, students received a
significant improvement on grade and their learning effect.
Additional information found within [23] was the difference of learning between
freshmen and senior students. This could have been due to the freshmen needs to work as a
community, compared to seniors who can focus on more self-development requirements. With
the focus on EDM research being on students time spent on topic or practice in course material,
9
new research in different classroom setting effects on student learning and results have proven to
be a rewarding area of research. The ability to improve the chance of a student receiving success
within a course by changing specific classroom attributes will improve not only the student’s
behavior, but institution numbers will receive a rise using this type of research.

CHAPTER 3 RESEARCH DESIGN
3.1. Data Selection
The data selection process we wanted to use for testing the importance of classroom
environments needed to come from a source that covers different areas of study. The best way to
gather course environments of different subjects would be to collect the data from a University
setting, providing different areas of study for different majors. When searching for which
University’s data to use, the need for retention and graduation data will be taken into account as
these factors should reflect a need to improve grades and student success. Using the University
of North Carolina system as a pool of what campus to use, first we need to review data for each
of the Universities.
The University of North Carolina (UNC) system includes sixteen Undergrad and
Graduate institutions. During the process of choosing which University’s data to use it was best
to compare the following data, and not only will we compare the data between different
Universities but between the Universities to the UNC system as a whole.
Average GPA
Enrollment
Graduation
Retention
The data in which we use to choose the University for the research study will have been
collected and stored based on the need of UNC system and the University of North Carolina
General Administration (UNCGA). The data we used can be found in a central location, and is
publicly accessible through the UNCGA website [20].
11
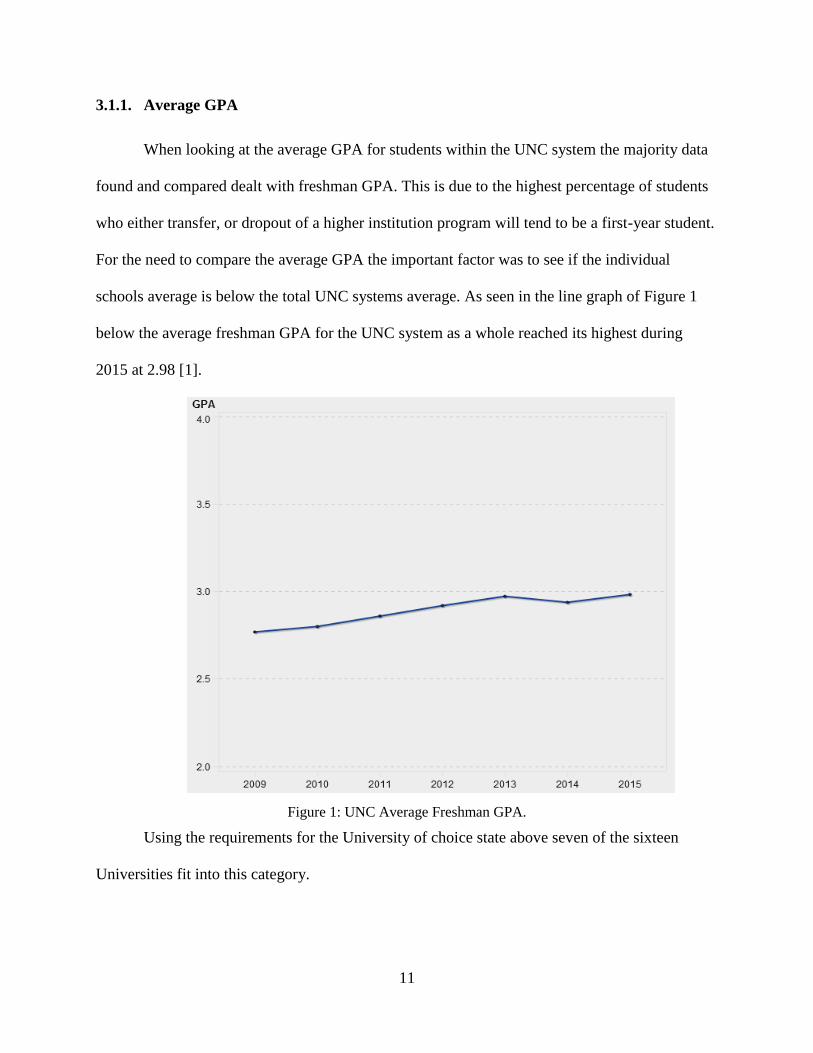
3.1.1. Average GPA
When looking at the average GPA for students within the UNC system the majority data
found and compared dealt with freshman GPA. This is due to the highest percentage of students
who either transfer, or dropout of a higher institution program will tend to be a first-year student.
For the need to compare the average GPA the important factor was to see if the individual
schools average is below the total UNC systems average. As seen in the line graph of Figure 1
below the average freshman GPA for the UNC system as a whole reached its highest during
2015 at 2.98 [1].
Figure 1: UNC Average Freshman GPA.
Using the requirements for the University of choice state above seven of the sixteen
Universities fit into this category.

12
3.1.2. Enrollment
In order to get an idea of how many courses that will be used for the experimentation
portion, using the number of student enrollments will be gauged to guess how much data to
expect. As the data will be preprocessed by hand it will be favorable to choose a campus that has
less than 10,000 students, but more than 5,000 to get enough data to find any trends. In order to
keep up with the requirements of average GPA we only looked at the schools who fell under the
UNC average of 2.98. The results of schools who fall below the GPA average, and have less than
10,000 students can be seen in Figure 2.
Figure 2: Enrollment Measure Graph.
Starting this phase of comparison to each campus and our expectations we have narrowed
our search down from seven Universities to two. The two Universities that we will use to
compare graduation and retention rates will be University of North Carolina at Pembroke
(UNCP) and Winston-Salem State University (WSSU) [10].

13
3.1.3. Graduation/Retention
The final method on University comparison would be the graduation and retention rates.
When comparing UNCP and WSSU between their graduation 2007 cohort rates UNCP would
have a six-year graduation rate of 33% while WSSU would sit at 46% [1]. The most up to date
data found would be the persistence rates which included both graduation and retention numbers.
Figure 3: Persistence Rate Table.
(Upper) UNCP Table. (Lower) WSSU Table.
Comparing the table data shown in Figure 3 a few differences were noted between UNCP
and WSSU persistence rates. The students who transitioned from first year to second year
students average 11% higher at WSSU compared to UNCP. While not all year persistence may
be at 11% looking at the data it does continue to validate the assumption that WSSU holds a
higher persistence rate compared to UNCP [1].
When looking at the individual graduation and retention percentage between the two
Universities, the data will show a similar conclusion. The graduation data collected from
students who started University studies 2007 33% of students graduated from UNCP while 46%
of the students from WSSU was able to graduate. The retention rates from students who started
14
2012 69% of students continued to stay at UNCP from first year to the second year, and 75% of
students continued their enrollment with WSSU [1, 10].
Using the attributes of enrollment, GPA, retention, and graduation rates, the choice of
University to study became clear. Choosing a school that holds under 10,000 students and above
5,000, then looking at the other three attributes can remove non-favorable Universities to choose
for this study. When initially looking at campus’ that holds a lower average GPA majority of the
16 UNC program schools are removed, and that will leave schools that have lower retention and
graduation rates. The University that met majority of the primary attribute requirements for this
study was UNCP.
3.2. Data Collection
The data collection process will consist of an online data request from UNCP’s
Institutional Research (UNCP IR) department. The mission of UNCP IR is to collect data, and
provide strategic and timely information to enhance institutional effectiveness [13]. The data that
will be requested will include course information for the past 2 years. The data that will be used
for the study will consist mostly of undergraduate courses that require a standard letter grade.
Courses that are graded by a pass fail system will not be used as this data may sway the results
towards a strong passing environment.
The purpose of this experiment will be to compare the different attributes of courses in
order to determine if environmental settings play a part in the degree of influence to a student’s
success. Using data from a University that has a lower graduation and retention rate will provide
an interest to the results of the experiment. Using results from the experimentation a University
should be able to find what environmental factors promote student learning, and in return should
15
benefit the same University to improve grades and willingness for students to stay at their
campus.
Using the UNCP IR department the data requested will not only be based on the
classroom attributes, but to provide a number of passing and failing students for each course.
When looking at data to classify the different attributes the goal was to find ones that can provide
even coverage during the data preprocessing procedure.
Table 1
Requested Data
Attribute Name Attribute Information Attribute Values
Year Calendar year course was held 2016,2017
(nominal)
Semester Semester course was held
Fall, Spring, Summer
(nominal)
Subject Area of study course is for
ACC, AIS, ART, BIO…
(nominal)
Course/Section # Course identifier 1000, 1050, 1750, 4990
(nominal)
Department Department which provides course Art, History, Mathematics
(nominal)
Credit Hours Amount of hours course is held per week 1,2,3,4
(numeric)
Instructor Name of instructor of course (nominal)
Level Level of course Undergrad, Grad
(nominal)
Site Building, or instructional method Main, RCC, RICH
(nominal)

16
Meeting Type Method course was provided Lect., Ind., Sem.
(nominal)
Course Start Time Time in which course starts 0600-2100
(numeric)
Course End Time Time in which course ends 0600-2100
(numeric)
Meeting Days Days course members meet M,T,W,R,F
(nominal)
Enrolled Students Amount of students who initially enrolled
into course
1-75
(numeric)
Grades ABC Number of students who completed the
course with a passing grade
0-75
(numeric)
Grades DWF Number of students who reached a poor,
failing grade or withdrawn from the course
0-75
(numeric)
The data preprocessing procedure will consist of changing some of the data received into
more even groups, as well as provide anonymity or removal of instructor names. Data
preprocessing will include changes as seen in Table 2. Attributes that are included in Table 1 but
not in Table 2 are expected to keep their original values. A new attribute will also be generated
by the number of passing students compared to the initial enrollment number which will be
known as the student success rate. This will be grouped into three sections poor, moderate, and
good.
Table 2
Data Preprocessing
Attribute Name Received Data Modified Data

17
Level Undergrad, Grad
Remove graduate courses
Meeting Type Lect., Ind., Sem.
Remove courses that are
independent study and
seminar
Course Start Time 0000-1100
1101-1500
1501-1800
1801-1159
Null
Morning
Mid-Day
Afternoon
Night
Online
Class Size 1-15
16-40
41<
Small
Moderate
Large
Class Meeting
Length
00:00:00
00:01:00-01:30:00
01:31:00 – 03:00:00
03:01:00<
None
Short
Moderate
Long
Course Success
Rate
Grades ABC/Enrolled numbers 0-50% - Poor
51-70% - Moderate
71-100% - Good
Number Days Met M
T
W
R
F
MW
TR
MWF
Null (Online)
1
2
3
4
5
6
7
8
9
Over the course of the data preprocessing phase the data that was received will have
either been grouped together, altered to meet the requirements of the data mining process, or
removed all together. The data that will be used for the experimentation portion of this research
study is shown in Table 3.
18
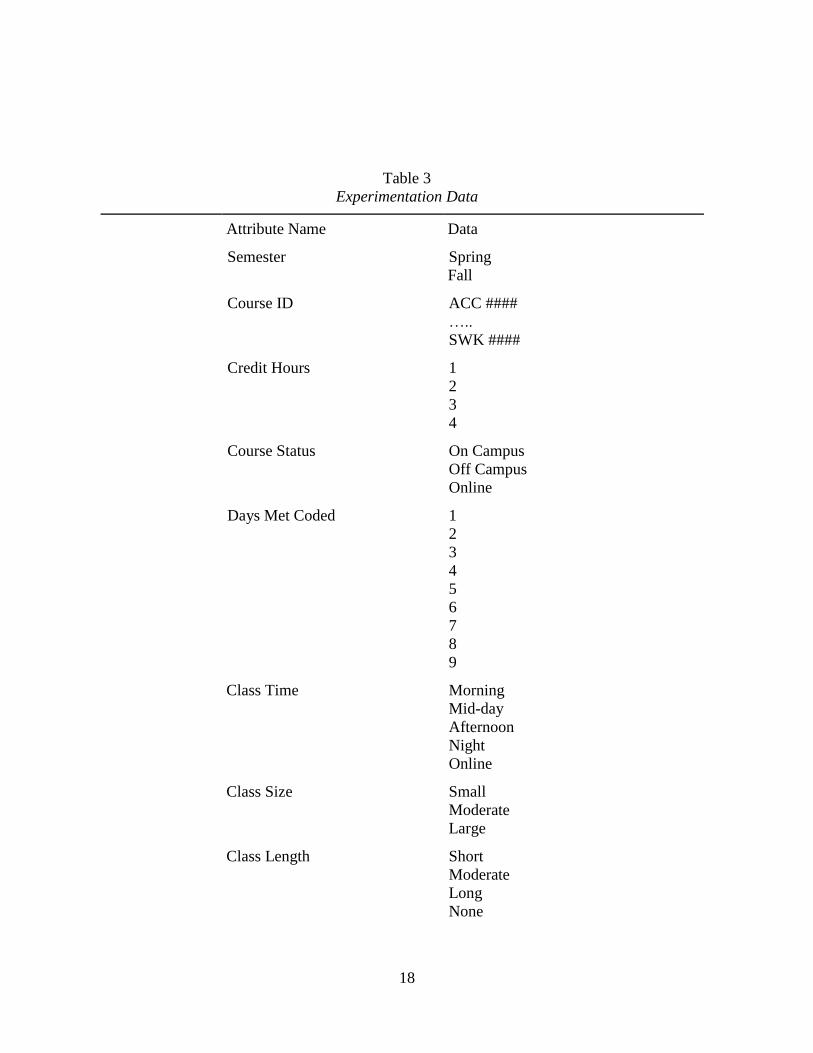
Table 3
Experimentation Data
Attribute Name Data
Semester
Spring
Fall
Course ID
ACC ####
…..
SWK ####
Credit Hours 1
2
3
4
Course Status
On Campus
Off Campus
Online
Days Met Coded 1
2
3
4
5
6
7
8
9
Class Time Morning
Mid-day
Afternoon
Night
Online
Class Size Small
Moderate
Large
Class Length Short
Moderate
Long
None
19
Passing Ranking Good
Moderate
Poor
After the data preprocessing stage of the experimentation the number of data variables
received, and will be used are 3896 lines of data. Each line of data holds nine attributes, which
the primary attribute will be the passing ranking of the course.
Once all of the data that will be used for the testing phase is completed, the next step will
be to start the data mining process. To get the results expected for the experiment, the data
mining processes that will be used in this experiment will include clustering and classification
data mining. The reason the two algorithms are chosen to be used together will be due to getting
a stronger relationship from the classification results as seen in prior research [5].
3.3. EDM Processing
After the collection of data and the data preprocessing procedure the final steps will be to
complete the planned techniques. To receive expected results from the EDM process, the data
mining algorithms will be completed in a specific order. The first method will be the Density-
Based Spatial Clustering of Applications with Noise (DBSCAN) with the purpose to find data
that may be removed to promote a higher relationship between attributes. Not only will the
DBSCAN process help reduce data noise but shall provide an early image of attributes that can
group together based on the success of the students.
The algorithm used next will be to classify all attributes together to see which attribute
may affect the student learning process the most. The C4.5 process would seem to be the better
choice of classification algorithms as the result will be a tree diagram. The data received from
the tree diagram will show those at a higher branch being more affective to the student’s success
compared to those near the leaves. As we are expecting the data collected to hold a large amount
20
of information the use of an automated date mining tool will be used. With the use of Weka the
clustering and classification mining will be able to be completed in a matter of minutes with the
use of required parameters.
3.3.1. Cluster Mining
With the goal of finding the strongest possible influence that an environment can have on
the learning system, using a cluster data mining method such as DBSCAN first should aid in this
process. The way the experiment will take advantage of DBSCAN will be to compare the
different attributes to the course success rates percentage. Not only with the DBSCAN method
be able to aid in removing excess data noise, but by comparing the Eps of different data clusters
data that has a smaller radius with a higher density will be able to inform which attributes may
have a stronger influence.
Starting with a larger radius for a neighborhood and a majority number being the
minimum number of points required it will be expected to generate some form of clustering.
Once the initial clusters have been found the next process will be to lower the maximum radius
with the goal to find the smallest clusters while holding a majority of data points. Data attributes
that hold a cluster with a smaller radius compared to other attributes should have a stronger
affect to the classification method.
If by chance an attribute is not able to generate any type of initial cluster with the
expected guidelines the data may generate too much noise, and may need to be process again in a
uniform way to see if the attribute is useful. Any attribute that cannot generate a cluster through a
second form of preprocessing to reduce noise, it will prove that attribute does not hold any type
of influence to the ability and should be removed from the classification process.

21
3.3.2. Classification Mining
The use of classification mining shall provide to some point a relationship between a
courses environments, and the percentage of students success. After processing the data through
the DBSCAN process we will be sure the attributes used will have a strong relationship with
student success and failure. Using these attributes in the C4.5 method the data tree provided will
be able to rank which attribute has more influence by being closer to the base the of tree.
With the goal all possible outcomes for the influence of course attributes the
classification mining will be completed with different percentages of training to testing data. The
testing will be completed multiple times by using a 60-70% testing data split in hopes to find the
highest possible success rate.

CHAPTER 4 RESULTS
4.1. Cluster Mining Results
When looked at the results of DBSCAN we wanted to break each variable attribute apart
and compare them with the percent of students who enrolled in a class and passed. Looking at
each DBSCAN model it will be expected to provide information on which value of an attribute is
used the most as well as the passing trend each value holds. Based on initial assumption of the
data provided it is expected common course days, times, and hours will make up most of each
respective cluster, but knowing that each model should still show each cluster value shape the
same. As UNCP has an overall student passing rate in undergraduate studies at 78% most
clusters will be between 70-100% of each model. Through the course of this section we will
cover each model, and state what this information will provide.
4.1.1. Credit Hours
As seen below in figure 4 looking at the number of course hours per week compared to
the percentage of passing students the following is noticed in the clusters. The initial thing that
would be noticed is where majority of the data lie, in which this case it will be in the three hour
credit hour range. The second thing to notice is the shape of each group, and in the case of one,
three, and four each cluster will be dense closer to one hundred and trail off to zero. The clusters
for five and two only have what would be considered grouping in a passing rank. When running
the classification algorithm it would be expected that variables that hold two or four hours in the
class hours attribute will lean to passing, but mostly would not be a big factor in the overall
classification.
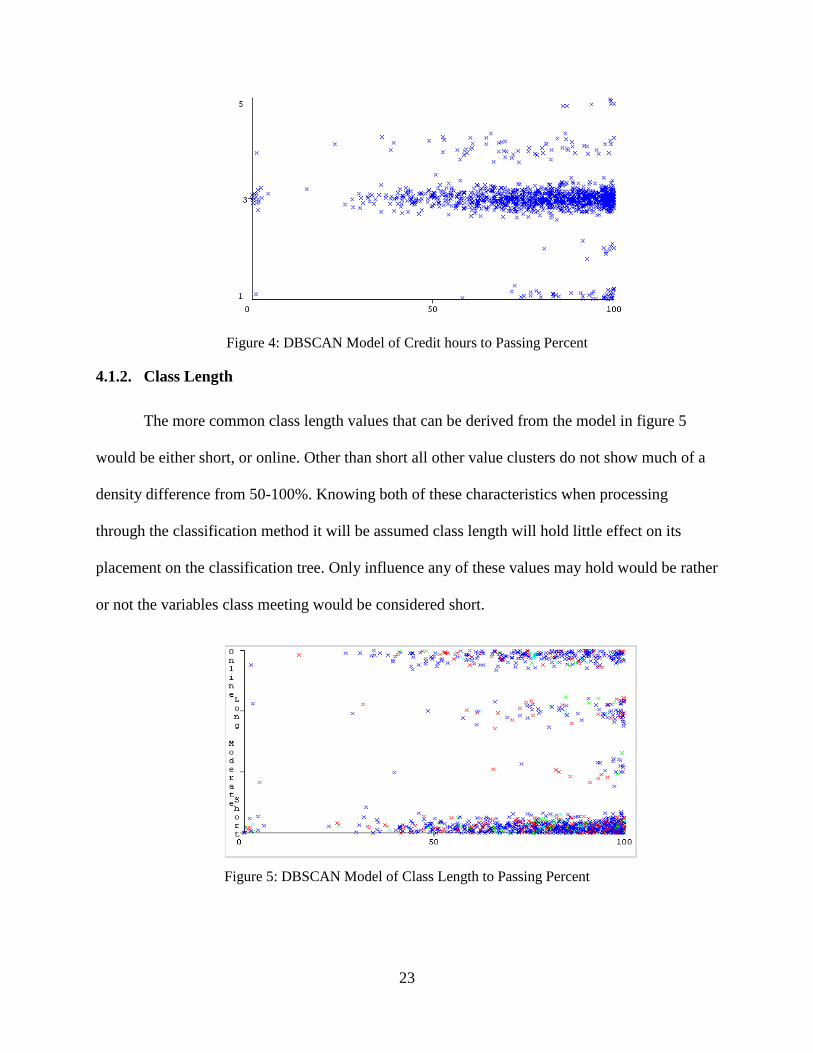
23
Figure 4: DBSCAN Model of Credit hours to Passing Percent
4.1.2. Class Length
The more common class length values that can be derived from the model in figure 5
would be either short, or online. Other than short all other value clusters do not show much of a
density difference from 50-100%. Knowing both of these characteristics when processing
through the classification method it will be assumed class length will hold little effect on its
placement on the classification tree. Only influence any of these values may hold would be rather
or not the variables class meeting would be considered short.
Figure 5: DBSCAN Model of Class Length to Passing Percent
24
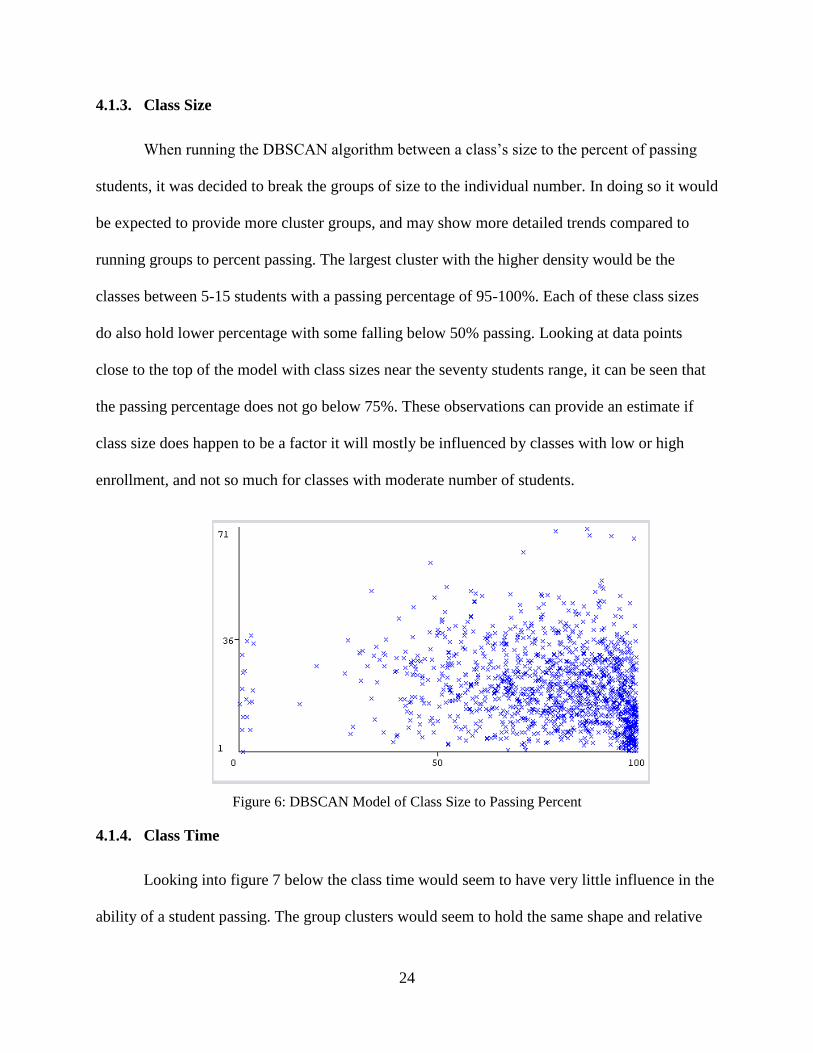
4.1.3. Class Size
When running the DBSCAN algorithm between a class’s size to the percent of passing
students, it was decided to break the groups of size to the individual number. In doing so it would
be expected to provide more cluster groups, and may show more detailed trends compared to
running groups to percent passing. The largest cluster with the higher density would be the
classes between 5-15 students with a passing percentage of 95-100%. Each of these class sizes
do also hold lower percentage with some falling below 50% passing. Looking at data points
close to the top of the model with class sizes near the seventy students range, it can be seen that
the passing percentage does not go below 75%. These observations can provide an estimate if
class size does happen to be a factor it will mostly be influenced by classes with low or high
enrollment, and not so much for classes with moderate number of students.
Figure 6: DBSCAN Model of Class Size to Passing Percent
4.1.4. Class Time
Looking into figure 7 below the class time would seem to have very little influence in the
ability of a student passing. The group clusters would seem to hold the same shape and relative
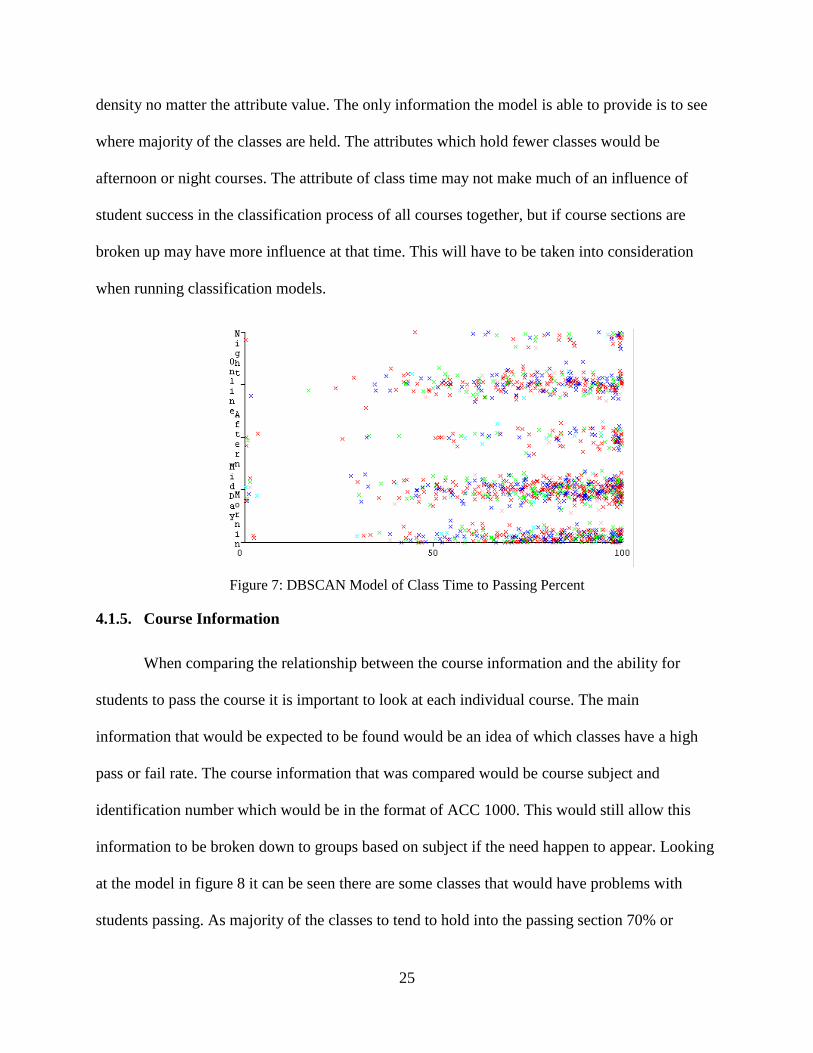
25
density no matter the attribute value. The only information the model is able to provide is to see
where majority of the classes are held. The attributes which hold fewer classes would be
afternoon or night courses. The attribute of class time may not make much of an influence of
student success in the classification process of all courses together, but if course sections are
broken up may have more influence at that time. This will have to be taken into consideration
when running classification models.
Figure 7: DBSCAN Model of Class Time to Passing Percent
4.1.5. Course Information
When comparing the relationship between the course information and the ability for
students to pass the course it is important to look at each individual course. The main
information that would be expected to be found would be an idea of which classes have a high
pass or fail rate. The course information that was compared would be course subject and
identification number which would be in the format of ACC 1000. This would still allow this
information to be broken down to groups based on subject if the need happen to appear. Looking
at the model in figure 8 it can be seen there are some classes that would have problems with
students passing. As majority of the classes to tend to hold into the passing section 70% or
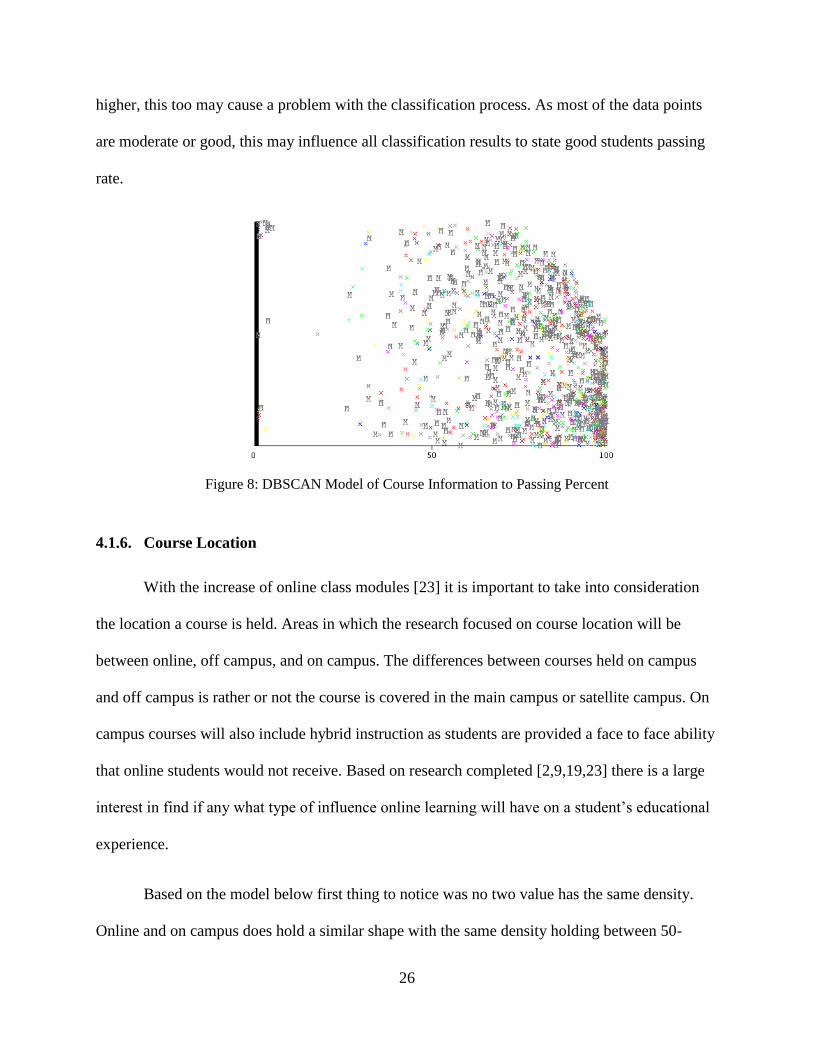
26
higher, this too may cause a problem with the classification process. As most of the data points
are moderate or good, this may influence all classification results to state good students passing
rate.
Figure 8: DBSCAN Model of Course Information to Passing Percent
4.1.6. Course Location
With the increase of online class modules [23] it is important to take into consideration
the location a course is held. Areas in which the research focused on course location will be
between online, off campus, and on campus. The differences between courses held on campus
and off campus is rather or not the course is covered in the main campus or satellite campus. On
campus courses will also include hybrid instruction as students are provided a face to face ability
that online students would not receive. Based on research completed [2,9,19,23] there is a large
interest in find if any what type of influence online learning will have on a student’s educational
experience.
Based on the model below first thing to notice was no two value has the same density.
Online and on campus does hold a similar shape with the same density holding between 50-
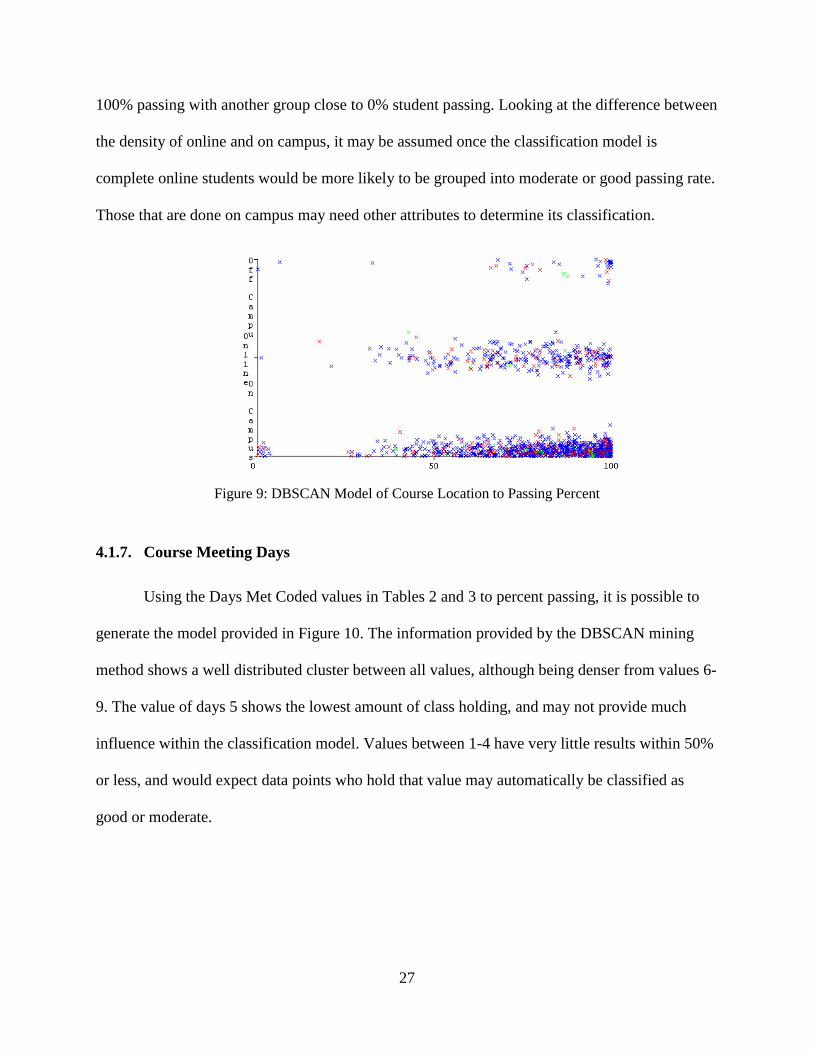
27
100% passing with another group close to 0% student passing. Looking at the difference between
the density of online and on campus, it may be assumed once the classification model is
complete online students would be more likely to be grouped into moderate or good passing rate.
Those that are done on campus may need other attributes to determine its classification.
Figure 9: DBSCAN Model of Course Location to Passing Percent
4.1.7. Course Meeting Days
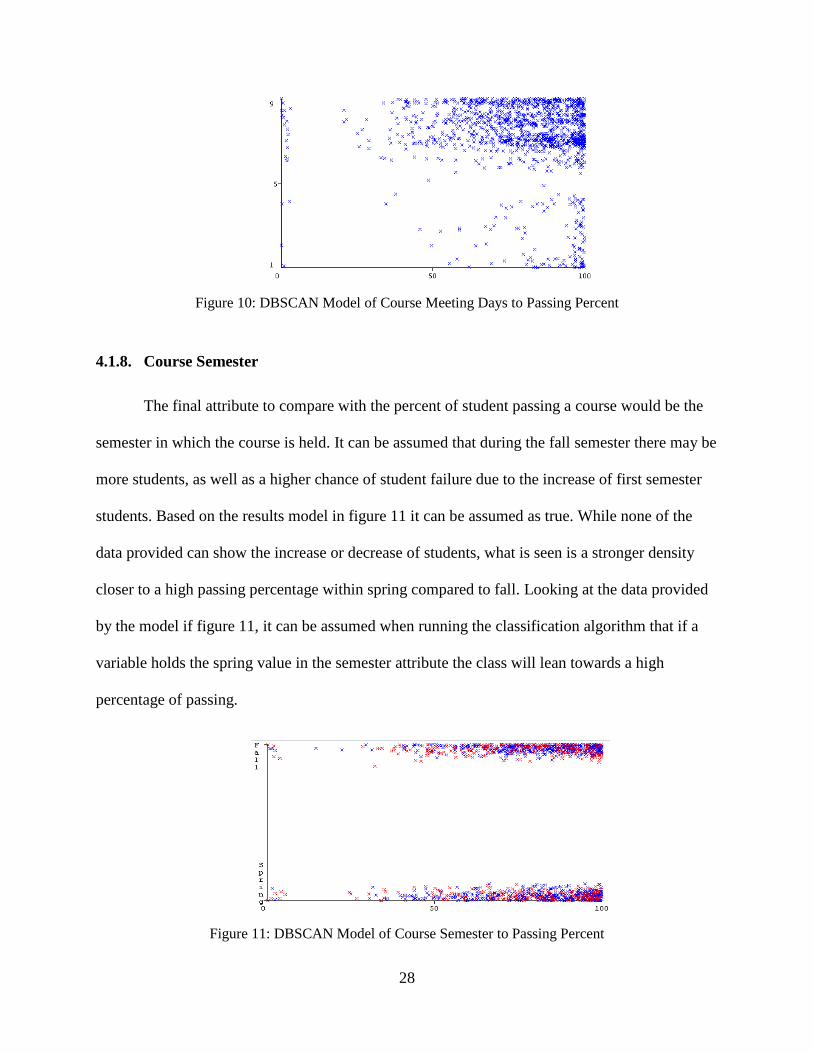
Using the Days Met Coded values in Tables 2 and 3 to percent passing, it is possible to
generate the model provided in Figure 10. The information provided by the DBSCAN mining
method shows a well distributed cluster between all values, although being denser from values 6-
9. The value of days 5 shows the lowest amount of class holding, and may not provide much
influence within the classification model. Values between 1-4 have very little results within 50%
or less, and would expect data points who hold that value may automatically be classified as
good or moderate.
28
Figure 10: DBSCAN Model of Course Meeting Days to Passing Percent
4.1.8. Course Semester
The final attribute to compare with the percent of student passing a course would be the
semester in which the course is held. It can be assumed that during the fall semester there may be
more students, as well as a higher chance of student failure due to the increase of first semester
students. Based on the results model in figure 11 it can be assumed as true. While none of the
data provided can show the increase or decrease of students, what is seen is a stronger density
closer to a high passing percentage within spring compared to fall. Looking at the data provided
by the model if figure 11, it can be assumed when running the classification algorithm that if a
variable holds the spring value in the semester attribute the class will lean towards a high
percentage of passing.
Figure 11: DBSCAN Model of Course Semester to Passing Percent

29
4.2. Classification Mining Results
Discussed within chapter 3 the choice of using a classification method which produces a
tree would be able to display which attributes will have the stronger influence on a student’s
learning ability. The classifiers that will be used in this experimentation would be the number of
students passing a course rather it be good, moderate, or poor. Initially the way the classifiers
were groups were 0-50 would be poor, 51-70 is moderate, and 71-100 would have a respectable
number of students passing. Upon execution it was found this grouping of classes ended up
pushing more result to the good classification and will not provide the type of results expected.
To prevent this issue, the classification testing will be executed with two different classifier
groups. First will be the one stated above, and an alternate classifier of 0-65 for poor, 66-85 for
moderate, and 86-100 for courses with good percentage of students passing.
Other factors that contributed to the problem of all data values being classified into the
good classifier would also be the type of data compared. As stated within 4.1.5, the different type
of classes does show different trends themselves to how a student performs within a class. The
initial idea was to test all the classes the same together to look at only environmental factors that
affects a student’s grade. Beneficial to help prevent incorrect classification into a single classifier
it will be essential to break the overall data up into groups focusing on sections of study. When
breaking up sections for the sake of experimentation, it is important to find sections which may
have a different learning or teaching style. With a concern to cover all areas the following
subjects were tested. In pursuit to cover courses that focus on STEM subjects the use of Biology,
Mathematics, and Computer Science were chosen. In Literature studies English courses were
chosen, and for Humanities Criminal Justice and Sociology are tested.

30
During the experimentation process training/testing percentage were tested between 60-
70% training. While not all results provide a tree to report about, all notable results are provided
within Table 4 below. With the goal to save space, and prevent repeating results only the finding
of the experiment and details of trees are provided within the table below.
Table 4
Experimentation Results
Testing Data 0-50% = Poor
51-70% = Moderate
71-100% = Good
(50/70 split)
0-65% = Poor
66-85% = Moderate
86-100% = Good
(65/85 split)
Notes
All Classes 74% success rate
100% classified into
Good
74% success rate
100% classified into
Good
Execution did not provide a
tree. Upon finding these
results it will aid split data
into subcategories for
experimentation.
Biology 100% classified into
Good
55% success rate.
First attribute will be
rather the class is BIO
1000 or not. Other
course results are
determined by days
met and finally the
course size.
While the 50/70 split have
all courses classified as
successful for students, use
of the 65/85 split is able to
provide a tree in which there
is some possible attributes to
influence student learning.
Computer Science 100% classified into
Good
100% classified into
Good
Execution did not provide a
tree.
Criminal Justice 100% classified into
Good
100% classified into
Good
Execution did not provide a
tree.
English 70% success rate
Majority classified into
Good, 4 courses into
moderate and zero into
poor
49% success rate
Average spread of
classes
With low success rate as
wished the stronger tree is
with the 65/85 split.
Tree first splits looking at
each course offered. Next
tends to be size and finally
rather the course was held on
main campus or not.
31
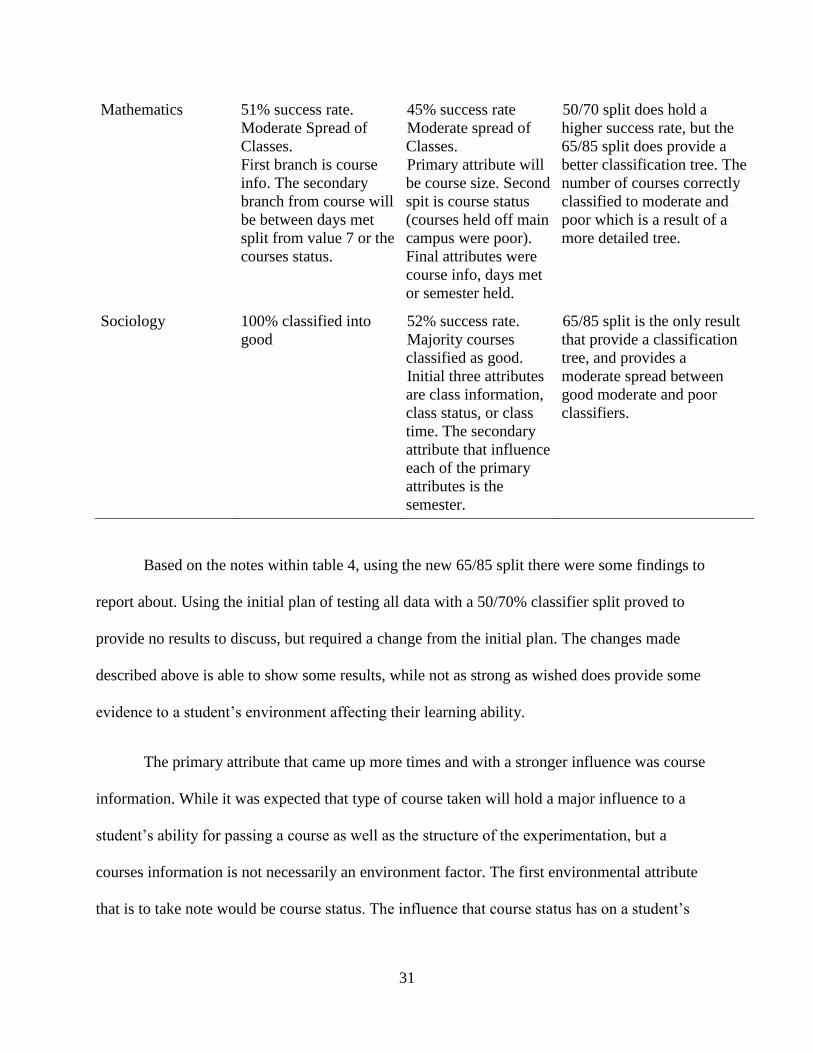
Mathematics 51% success rate.
Moderate Spread of
Classes.
First branch is course
info. The secondary
branch from course will
be between days met
split from value 7 or the
courses status.
45% success rate
Moderate spread of
Classes.
Primary attribute will
be course size. Second
spit is course status
(courses held off main
campus were poor).
Final attributes were
course info, days met
or semester held.
50/70 split does hold a
higher success rate, but the
65/85 split does provide a
better classification tree. The
number of courses correctly
classified to moderate and
poor which is a result of a
more detailed tree.
Sociology 100% classified into
good
52% success rate.
Majority courses
classified as good.
Initial three attributes
are class information,
class status, or class
time. The secondary
attribute that influence
each of the primary
attributes is the
semester.
65/85 split is the only result
that provide a classification
tree, and provides a
moderate spread between
good moderate and poor
classifiers.
Based on the notes within table 4, using the new 65/85 split there were some findings to
report about. Using the initial plan of testing all data with a 50/70% classifier split proved to
provide no results to discuss, but required a change from the initial plan. The changes made
described above is able to show some results, while not as strong as wished does provide some
evidence to a student’s environment affecting their learning ability.
The primary attribute that came up more times and with a stronger influence was course
information. While it was expected that type of course taken will hold a major influence to a
student’s ability for passing a course as well as the structure of the experimentation, but a
courses information is not necessarily an environment factor. The first environmental attribute
that is to take note would be course status. The influence that course status has on a student’s
32
success were different between the different areas of study. Majority of the attribute’s influence
were if a student took a course on the main campus they had a slight higher chance of success.
The second environmental factor to consider would be course size. Courses that had
either below 15 or above 40 students would have a higher chance of more students passing.
Courses that had between 15 and 40 students would be determined based on other sub attributes
such as days met, time course starts, or course semester. The attribute for days met would follow
a trend that if a student is to meet for a class either 3-4 times a week they would have a higher
chance of success, compared to those that met only once or twice a week. The final attribute that
would follow a like trend with all results are the semester a course is held. Courses that are held
in the spring semester do show a higher chance of passing a course compared to those in the fall.
The remaining attributes course length, and course credit hours showed up very little in
the results between any of the trees. If these attributes were removed when testing the
classification algorithms will have very little change to the percentage of success, or the trees
structure.

CHAPTER 5 FUTURE WORK AND CONCLUSION
5.1. Summary
With the competitive status of universities being able to attract new and retain current
students, the ability of being able to construct successful environments shall aid in the overall
success in their institutional programs. Current experimental research studies have focused EDM
techniques on student study habits, as well as problem areas in studies with the goal to improve
learning quality. The use of the data collected in prior studies have been able to aid in
demonstrating the importance of time studying a subject compared to results, as well as finding
problem areas that need more focus in the classroom. With only few research studies focusing
strictly on a comparison to online and traditional classroom settings while even fewer use EDM
techniques, stretching out to other factors such as time, days, and location may generate new
guidelines for course creation and scheduling.
Using the information provided within the results found in Chapter 4 this thesis hopes to
demonstrate:
A new areas that establishes EDM can be used to find problematic areas for
student learning based on environmental factors.
Provide results that prove the hypothesis of environmental factors having an
effect on how successful a course is in regards to the number of students passing.
Provide information that can be grown upon in which future programs can work
with to better develop their program schedule, with the goal to provide low
performance courses the most prosperous learning environment to improve
student success.
34
The use of EDM to remove noisy data, and find stronger patterns shall discover a
correlation between specific environment attributes and the affect it has on a student’s learning
accomplishments. The data received from the proposed research study should aid in struggling
programs to increase average GPA, promote student learning, and in return increase student
population.
What was attained from this research study was that the ability to see if it was possible to
find environmental attributes can have some influence towards a student’s learning ability
through EDM methods and determine which attributes these environmental factors were. While
it is possible to find some influence from the environment, it is also known that each of these are
different depending on the field of study or even looking at single types courses itself. It is
important to note that running this method against all courses will more than likely provide
inconclusive or incorrect data for all the courses being tested.
With an ambition to improve on the current results provided within this research, more
characteristic attributes should be tested. Along with looking at the attributes use within this
research, looking at different student attributes may provide a stronger result of the ability for
students to pass. Information such as the number of credit hours a student is to take a semester,
as well the type of courses completed in the pass and those currently in with focus courses. With
the evidence provided; environment factors affecting a learning capacity; and that of past
research from student and teacher interaction crossing the two may make it possible to find
students who are at risk of taking specific courses even before going into the classroom.
Last but not least, the methodology used focused on two specific data mining algorithms.
It may be possible that use of different algorithms instead of DBSCAN and C4.5 can provide a
stronger result compared to that of the study used.

REFERENCES
1. Admissions and Performance. (n.d.). Retrieved August 30, 2017, from
https://ung4.ondemand.sas.com/SASVisualAnalyticsViewer/guest.jsp?appSwitcherDisabl
ed=true&reportViewOnly=true&reportPath=/UNG/External%20Content/Reports&report
Name=Freshman_performance
2. Altadmri, A., & Brown, N. C. C. (2015). 37 Million Compilations: Investigating Novice
Programming Mistakes in Large-Scale Student Data. In Proceedings of the 46th ACM
Technical Symposium on Computer Science Education (pp. 522–527). New York, NY,
USA: ACM. https://doi.org/10.1145/2676723.2677258
3. Beikzadeh, M. R., Phon-Amnuaisuk, S., & Delavari, N. (2008). Data Mining Application
in Higher Learning Institutions. Informatics in Education - An International Journal,
7(1), 31–54.
4. Berland, M., Baker, R. S., & Blikstein, P. (2014). Educational Data Mining and Learning
Analytics: Applications to Constructionist Research. Technology, Knowledge and
Learning, 19(1–2), 205–220. https://doi.org/10.1007/s10758-014-9223-7
5. Bogarín, A., Romero, C., Cerezo, R., & Sánchez-Santillán, M. (2014). Clustering for
Improving Educational Process Mining. In Proceedings of the Fourth International
Conference on Learning Analytics And Knowledge (pp. 11–15). New York, NY, USA:
ACM. https://doi.org/10.1145/2567574.2567604
6. Borges, L. C., Marques, V. M., & Bernardino, J. (2013). Comparison of Data Mining
Techniques and Tools for Data Classification. In Proceedings of the International C*
Conference on Computer Science and Software Engineering (pp. 113–116). New York,
NY, USA: ACM. https://doi.org/10.1145/2494444.2494451
7. Brown, N. C. C., Kölling, M., McCall, D., & Utting, I. (2014). Blackbox: A Large Scale
Repository of Novice Programmers’ Activity. In Proceedings of the 45th ACM Technical
Symposium on Computer Science Education (pp. 223–228). New York, NY, USA: ACM.
https://doi.org/10.1145/2538862.2538924
8. Ceglar, A., & Roddick, J. F. (2006). Association Mining. ACM Comput. Surv., 38(2).
https://doi.org/10.1145/1132956.1132958
9. Edwards, S. H. (n.d.). Home | The Web-CAT Community. Retrieved June 15, 2017, from
http://web-cat.org/
10. Enrollment. (n.d.). Retrieved August 30, 2017, from
https://ung4.ondemand.sas.com/SASVisualAnalyticsViewer/guest.jsp?appSwitcherDisabl
ed=true&reportViewOnly=true&reportPath=/UNG/External%20Content/Reports&report
Name=EnrollmentReport
36
11. Higher Education Technology | Blackboard. (n.d.). Retrieved June 13, 2017, from
http://www.blackboard.com/higher-education/index.aspx
12. Ihantola, P., Vihavainen, A., Ahadi, A., Butler, M., Börstler, J., Edwards, S. H., … Toll,
D. (2015). Educational Data Mining and Learning Analytics in Programming: Literature
Review and Case Studies. In Proceedings of the 2015 ITiCSE on Working Group Reports
(pp. 41–63). New York, NY, USA: ACM. https://doi.org/10.1145/2858796.2858798
13. Institutional Research. (2014, February 20). Retrieved September 1, 2017, from
http://www.uncp.edu/about-uncp/administration/departments/institutional-research
14. Jain, A. K., Murty, M. N., & Flynn, P. J. (1999). Data Clustering: A Review. ACM
Comput. Surv., 31(3), 264–323. https://doi.org/10.1145/331499.331504
15. Quinlan, J. R. (1986). Induction of Decision Trees. Mach. Learn., 1(1), 81–106.
https://doi.org/10.1023/A:1022643204877
16. Romero, C., & Ventura, S. (2010). Educational Data Mining: A Review of the State of
the Art. IEEE Transactions on Systems, Man, and Cybernetics, Part C (Applications and
Reviews), 40(6), 601–618. https://doi.org/10.1109/TSMCC.2010.2053532
17. Sachin, R. B., & Vijay, M. S. (2012). A Survey and Future Vision of Data Mining in
Educational Field. In 2012 Second International Conference on Advanced Computing
Communication Technologies (pp. 96–100). https://doi.org/10.1109/ACCT.2012.14
18. Sanchez-Santillan, M., Paule-Ruiz, Mp., Cerezo, R., & Nuñez, Jc. (2016). Predicting
Students’ Performance: Incremental Interaction Classifiers. In Proceedings of the Third
(2016) ACM Conference on Learning @ Scale (pp. 217–220). New York, NY, USA:
ACM. https://doi.org/10.1145/2876034.2893418
19. Singley, M. K., & Lam, R. B. (2005). The Classroom Sentinel: Supporting Data-driven
Decision-making in the Classroom. In Proceedings of the 14th International Conference
on World Wide Web (pp. 315–321). New York, NY, USA: ACM.
https://doi.org/10.1145/1060745.1060793
20. University of North Carolina | UNC GA. (n.d.). Retrieved August 25, 2017, from
https://www.northcarolina.edu/
21. Weka 3 - Data Mining with Open Source Machine Learning Software in Java. (n.d.).
Retrieved July 1, 2017, from http://www.cs.waikato.ac.nz/~ml/weka/index.html
22. Witten, I. H., Frank, E., Hall, M. A., & Pal, C. J. (2016). Data Mining: Practical
Machine Learning Tools and Techniques. Morgan Kaufmann.
23. Zhang, M., Zhu, J., Zou, Y., Yan, H., Hao, D., & Liu, C. (2015). Educational Evaluation
in the PKU SPOC Course “Data Structures and Algorithms.” In Proceedings of the
37
Second (2015) ACM Conference on Learning @ Scale (pp. 237–240). New York, NY,
USA: ACM. https://doi.org/10.1145/2724660.2728666

APPENDIX: IRB APPROVAL
39