Leveraged Finance - Fitch Ratings0d840fdc-9163-49a1-ab68... · European Leveraged Loan Chart Book...
25
Leveraged Finance www.fitchratings.com 3 October 2016 EMEA European Leveraged Finance Multiple EV-aluator Special Report In-Depth Review of EV Multiples: Fitch Ratings has updated its analysis of European enterprise valuation (EV) transaction multiples by sector, using data collected over the decade to June 2016. This report gives an overview of sector valuation statistics and changes in distressed multiples, and enables summaries of individual transactions by sector. Refining Scope: The data in this report capture static median values, which we considered the most robust due to the relatively large sample sizes and the presence of outlier values that tended to skew the mean. Outlier multiples were often the result of calculations using unadjusted EBITDA rather than pro forma, post-synergy figures. “Low” and “High” in this report refer to the lowest and highest median values each year during the preceding 10-year period. “Median” refers to the five-year mean value of the annual median multiples (or ratios). EV Multiples At Pre-Crisis Levels: European EV market multiples (EV/EBITDA) remained at a post-crisis high of around 9x in 1H16, in line with 2007 levels, despite the August 2015 market correction. Prolonged global fiscal and monetary stimulus and the ECB’s extension of QE in early 2016 supported multiples expansions despite slow economic recovery and recurring financial market volatility. Monetary stimulus supported IPOs, with leading indices returning to, or setting, all-time highs, braving negative sentiment after the Brexit vote. Sector Multiple Performance Varies: Median M&A and LBO transaction multiples reached 10x for the full year 2015 and remained around 9x in 1H16. Of the 18 sectors we follow, multiples increased in nine in 1H16 compared to 2015. The distribution for 2015 compared to 2014 is similar. Sharp rises in the food, beverage and tobacco sector (to 16.0x in 1H16 from 9.8x in 2015) and natural resources (9.5x against 5.2x) have been offset by significantly lower multiples in the chemicals sector (5.3x against 12.4x), diversified manufacturing (6.8x against 10.4x) and technology (7.3x against 15.2x). High Multiples Belie Top Line: Weak top-line revenue performance since the 2009 financial crisis appears out of sync with high valuations but corporate managers have defended high share price performance metrics by focusing on cost savings and extracting synergies through consolidation while taking advantage of low borrowing costs. Trade Buyers Outbid Sponsors: The post-crisis M&A continues to be led by corporate trade buyers as they seek to buy revenue growth, pursue additional cost cuts in combinations and regain pricing power by taking out excess capacity in their sectors. This is in contrast to the pre-crisis M&A market, where financial sponsors were taking advantage of cheap credit and ample pricing power to drive organic top-line revenue growth and margin expansion. Sponsors Turn Sellers: Financial sponsors have been unable to compete in vendor auctions as their return and leverage requirements put them at a disadvantage to less constrained trade and public-equity investors. However, sponsors have benefited from high valuations as active sellers of assets and have recently turned towards higher equity contribution investments in growth-oriented technology and service sectors. They are also engaging in add-on acquisitions to participate in sector consolidation and thereby support higher exit multiples. Inside This Report Multiples Remain At Pre-Crisis Highs...2 Higher Multiples Support Recovery Rates ....................................................3 Methodology ......................................5 All Sectors..........................................6 Aerospace and Defense.....................7 Auto and Related ...............................8 Chemicals ..........................................9 Consumer Products ......................... 10 Diversified Manufacturing ................. 11 Diversified Services.......................... 12 Energy ............................................. 13 Food, Beverage and Tobacco .......... 14 Gaming, Lodging and Leisure .......... 15 Healthcare ....................................... 16 Homebuilding, Building Materials and Construction .............................. 17 Media and Entertainment ................. 18 Natural Resources ........................... 19 Retail ............................................... 20 Technology ...................................... 21 Telecom and Cable .......................... 22 Transportation.................................. 23 Utilities ............................................. 24 Related Research Fitch 50 Europe (April 2016) European Leveraged Loan Chart Book (July 2016) U.S. Leveraged Finance Multiple EV-aluator (September 2016) European High-Yield Insight (August 2016) Analysts Michal Svantner +44 20 3530 1691 [email protected] Paul-Antoine Conti +44 20 3530 1292 [email protected] Edward Eyerman +44 20 3530 1359 [email protected]
Transcript of Leveraged Finance - Fitch Ratings0d840fdc-9163-49a1-ab68... · European Leveraged Loan Chart Book...

Leveraged Finance
www.fitchratings.com 3 October 2016
EMEA
European Leveraged Finance Multiple EV-aluator Special Report
In-Depth Review of EV Multiples: Fitch Ratings has updated its analysis of European
enterprise valuation (EV) transaction multiples by sector, using data collected over the decade
to June 2016. This report gives an overview of sector valuation statistics and changes in
distressed multiples, and enables summaries of individual transactions by sector.
Refining Scope: The data in this report capture static median values, which we considered the
most robust due to the relatively large sample sizes and the presence of outlier values that
tended to skew the mean. Outlier multiples were often the result of calculations using
unadjusted EBITDA rather than pro forma, post-synergy figures. “Low” and “High” in this report
refer to the lowest and highest median values each year during the preceding 10-year period.
“Median” refers to the five-year mean value of the annual median multiples (or ratios).
EV Multiples At Pre-Crisis Levels: European EV market multiples (EV/EBITDA) remained at
a post-crisis high of around 9x in 1H16, in line with 2007 levels, despite the August 2015
market correction. Prolonged global fiscal and monetary stimulus and the ECB’s extension of
QE in early 2016 supported multiples expansions despite slow economic recovery and
recurring financial market volatility. Monetary stimulus supported IPOs, with leading indices
returning to, or setting, all-time highs, braving negative sentiment after the Brexit vote.
Sector Multiple Performance Varies: Median M&A and LBO transaction multiples reached
10x for the full year 2015 and remained around 9x in 1H16. Of the 18 sectors we follow,
multiples increased in nine in 1H16 compared to 2015. The distribution for 2015 compared to
2014 is similar.
Sharp rises in the food, beverage and tobacco sector (to 16.0x in 1H16 from 9.8x in 2015) and
natural resources (9.5x against 5.2x) have been offset by significantly lower multiples in the
chemicals sector (5.3x against 12.4x), diversified manufacturing (6.8x against 10.4x) and
technology (7.3x against 15.2x).
High Multiples Belie Top Line: Weak top-line revenue performance since the 2009 financial
crisis appears out of sync with high valuations but corporate managers have defended high
share price performance metrics by focusing on cost savings and extracting synergies through
consolidation while taking advantage of low borrowing costs.
Trade Buyers Outbid Sponsors: The post-crisis M&A continues to be led by corporate trade
buyers as they seek to buy revenue growth, pursue additional cost cuts in combinations and
regain pricing power by taking out excess capacity in their sectors. This is in contrast to the
pre-crisis M&A market, where financial sponsors were taking advantage of cheap credit and
ample pricing power to drive organic top-line revenue growth and margin expansion.
Sponsors Turn Sellers: Financial sponsors have been unable to compete in vendor auctions
as their return and leverage requirements put them at a disadvantage to less constrained trade
and public-equity investors.
However, sponsors have benefited from high valuations as active sellers of assets and have
recently turned towards higher equity contribution investments in growth-oriented technology
and service sectors. They are also engaging in add-on acquisitions to participate in sector
consolidation and thereby support higher exit multiples.
Inside This Report
Multiples Remain At Pre-Crisis Highs ...2 Higher Multiples Support Recovery Rates ....................................................3 Methodology ...................................... 5 All Sectors.......................................... 6 Aerospace and Defense ..................... 7 Auto and Related ............................... 8 Chemicals .......................................... 9 Consumer Products ......................... 10 Diversified Manufacturing ................. 11 Diversified Services.......................... 12 Energy ............................................. 13 Food, Beverage and Tobacco .......... 14 Gaming, Lodging and Leisure .......... 15 Healthcare ....................................... 16 Homebuilding, Building Materials and Construction .............................. 17 Media and Entertainment ................. 18 Natural Resources ........................... 19 Retail ............................................... 20 Technology ...................................... 21 Telecom and Cable .......................... 22 Transportation .................................. 23 Utilities ............................................. 24
Related Research
Fitch 50 Europe (April 2016)
European Leveraged Loan Chart Book (July 2016)
U.S. Leveraged Finance Multiple EV-aluator (September 2016)
European High-Yield Insight (August 2016)
Analysts
Michal Svantner +44 20 3530 1691 [email protected] Paul-Antoine Conti +44 20 3530 1292 [email protected] Edward Eyerman +44 20 3530 1359 [email protected]

Leveraged Finance
European Leveraged Finance Multiple EV-aluator
October 2016 2
Multiples Remain At Pre-Crisis Highs
The scarcity of suitable LBO candidates, competition from trade buyers, and buoyant IPO
conditions have pushed EV multiples to post-crisis highs. The number of transactions with
more aggressive EV multiples in Fitch’s European leveraged credit opinion portfolio increased
in 2015. EV multiples in 1H16 continued to rise year on year and have recovered their 2007-
2008 pre-crisis levels. However, median total leverage remains below its 2007 peak.
EV multiples even exceeded their 2007-2008 peak in first-time LBO transactions completed
during the 12 months to June 2016. Leverage multiples applied in such transactions since 2015
matched more established and leverage-tested secondary buyout (SBO) and tertiary buyout
(TBO) transactions, but hit a ceiling at 5.5x total debt to EBITDA.
The increase in valuation multiples since 2012 has primarily resulted from a reduction in the
cost of capital, the search for growth in a lacklustre GDP environment, predominantly in
Europe, and “dry powder” available to private equity funds.
Equity markets at all-time highs have not just decreased the cost of capital but also enabled
trade buyers to use their own high-value stock to purchase a target’s equity. Credit, particularly
in Europe, is still cheap and abundant, with the ECB and BOE pushing down borrowing costs
through their corporate bond-buying programmes. Therefore, corporate bidders have also used
their own balance-sheet strength to raise debt at favourable terms, as in the recent acquisition
of Spain-based hospitals chain Quironsalud by ‘BBB-‘ rated German healthcare group
Fresenius for a multiple close to 11x EBITDA.
Companies are finding it easier to acquire growth through M&A rather than invest and expand
organically due to weak GDP growth globally since 2008.
The competition for suitable assets is high due to record committed reserves waiting to be
deployed at private equity firms and cash-rich trade buyers. However, trade buyers will typically
be able to offer a higher price for a target due to potential synergies, which makes it difficult for
private equity houses to compete for attractive assets. Therefore, in the most recent M&A
cycle, private equity firms have been sellers rather than buyers, exiting older deals.
High equity contributions in immediate post-crisis vintages helped leverage remain moderate,
and reflect large non-sponsor transactions, where strategic buyers continued to outbid
sponsors. However, sponsors embraced high EV growth credits in the fintech, medtech and IT
services sectors. In particular, new primary LBOs with untested business models were more
conservatively structured than SBO and TBO transactions.
Smaller sponsor deals became more popular in 2015 as private equity firms struggled to
compete with strategic trade buyers in large primary transactions (e.g. Holcim and Lafarge
assets bought by CRH, Portugal Telecom bought by Altice). Sponsors accepted larger equity
cushions in transactions with debt below EUR200m reflecting demand for companies in
growing technology and services sectors. However, the difficulties of competing on valuations
for primary assets mean sponsors have increasingly relied on recycling existing credits via
SBOs and TBOs, especially in 1H16.

Leveraged Finance
European Leveraged Finance Multiple EV-aluator
October 2016 3
Underwriting standards have clearly deteriorated since 2011-2012, dovetailing with rising
multiples, and transactions in 2013-2014 have higher median leverage than in 2011-2012.
Leverage continued to rise in 2015, but started to fall in 1H16 due to broader risk aversion and
credit concerns.
Covenant-lite/loose structures have been prevalent in new issuance since 2014. Less than
10% of the transactions completed in 2016 in our portfolio have a full set of covenants. Such
structures apply primarily in transactions where debt exceeds EUR500m and predominantly at
the lower end of the ‘b*’ credit opinion category. In particular, TBOs/QBOs take advantage of
increased risk appetite and investor familiarity with the issuer to remove financial covenants.
Higher Multiples Support Recovery Rates
Fitch’s recorded defaults until 2014 – the last year with a statistically meaningful number of
defaults –indicate that recoveries were broadly in line with those expected by Fitch.
Median Fitch expectations for senior secured debt recovery upon default stabilised around 65%
at end-June 2016 from 70% in August 2014. This is partly because 2015 transactions included
more aggressive senior leverage profiles. New money solutions in the form of debt such as
super senior notes may also reduce long-term recovery prospects for traditional senior secured
debt.
The correlation between above-average senior leverage and below-average senior recovery
expectations is clear in sectors like gaming and leisure. However, senior leverage does not
alone determine Fitch’s senior debt recovery expectations. The distressed multiple Fitch
applies in its bespoke recovery analysis of issuers with a ‘b+*’ and below credit opinion is key
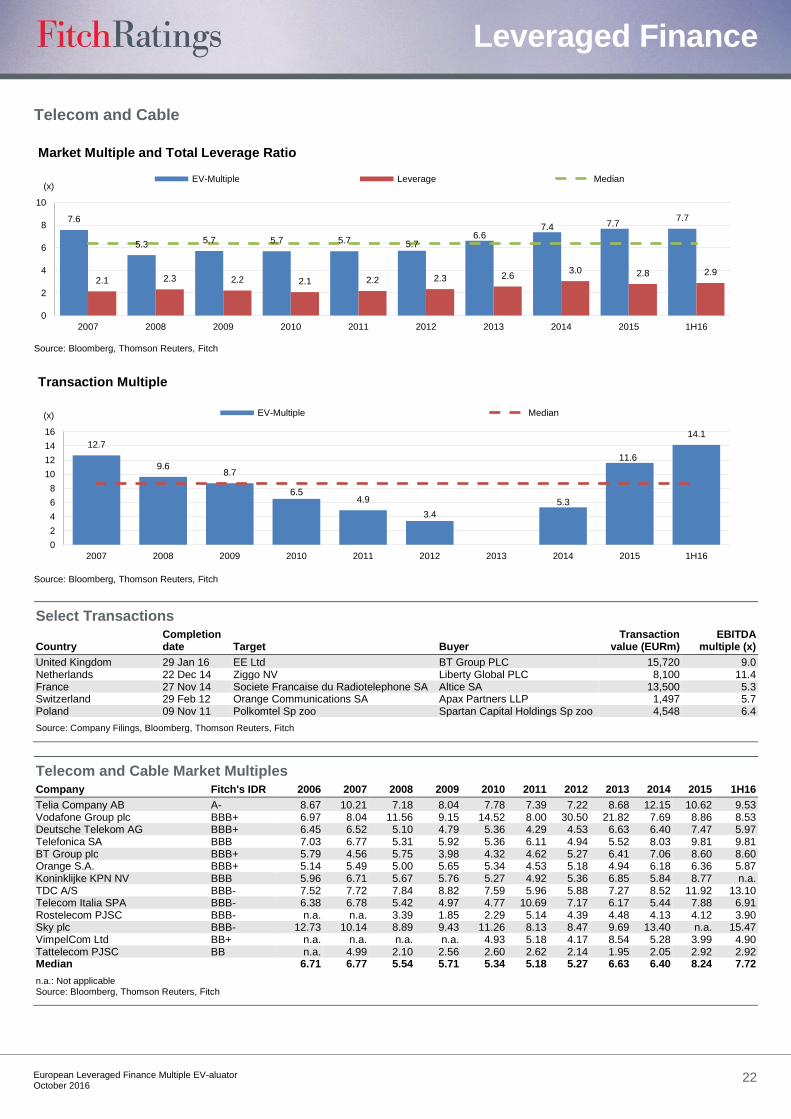
to recoveries. The telecoms and cable sector is a good example where the relatively higher
median distressed multiple used by Fitch to value companies supports higher-than-average
senior recoveries despite senior and total leverage in line with the portfolio median.
7.3 6.6
7.3 6.8
8.1
9.2 9.5 9.7
7.5 8.1
8.6 8.6 9.3
8.8 9.5
10.2 7.3
8.7 7.8 8.0
8.5 9.5
10.3
11.9 11.0
8.7 8.3
9.4 8.6
9.7 9.3 10.3
456789
10111213
2001(56)
2002(68)
2003(51)
2004(96)
2005(102)
2006(124)
2007(132)
2008(34)
2009(9)
2010(34)
2011(35)
2012(21)
2013(42)
2014(60)
2015(49)
LTM2Q16(36)
LBO SBO/TBO
Comparison of Median LBO Multiples vs. SBO/TBO EV MultiplesFor transaction closed in given years
(EBITDA x)
Source: Fitch Credit Opinions
(Year (no. of deals))
4.8
4.2 4.7 4.5
6.0 6.0 6.5
4.8 5.0
4.2 3.9 4.1
4.6 4.7
5.5 5.4
4.9
6.1 5.6
5.3
6.0
6.8 6.7
5.9
5.2
4.3 4.7 4.7
5.2 5.5 5.5
5.3
3
4
5
6
7
2001(56)
2002(68)
2003(51)
2004(96)
2005(102)
2006(124)
2007(132)
2008(34)
2009(9)
2010(34)
2011(35)
2012(21)
2013(42)
2014(60)
2015(49)
LTM2Q16(36)
LBO SBO/TBO
Comparison of Median LBO Multiples vs. SBO/TBO Debt MultiplesFor transaction closed in given years
(EBITDA x)
Source: Fitch Credit Opinions
(Year (no. of deals))
Leveraged Finance
European Leveraged Finance Multiple EV-aluator
October 2016 4
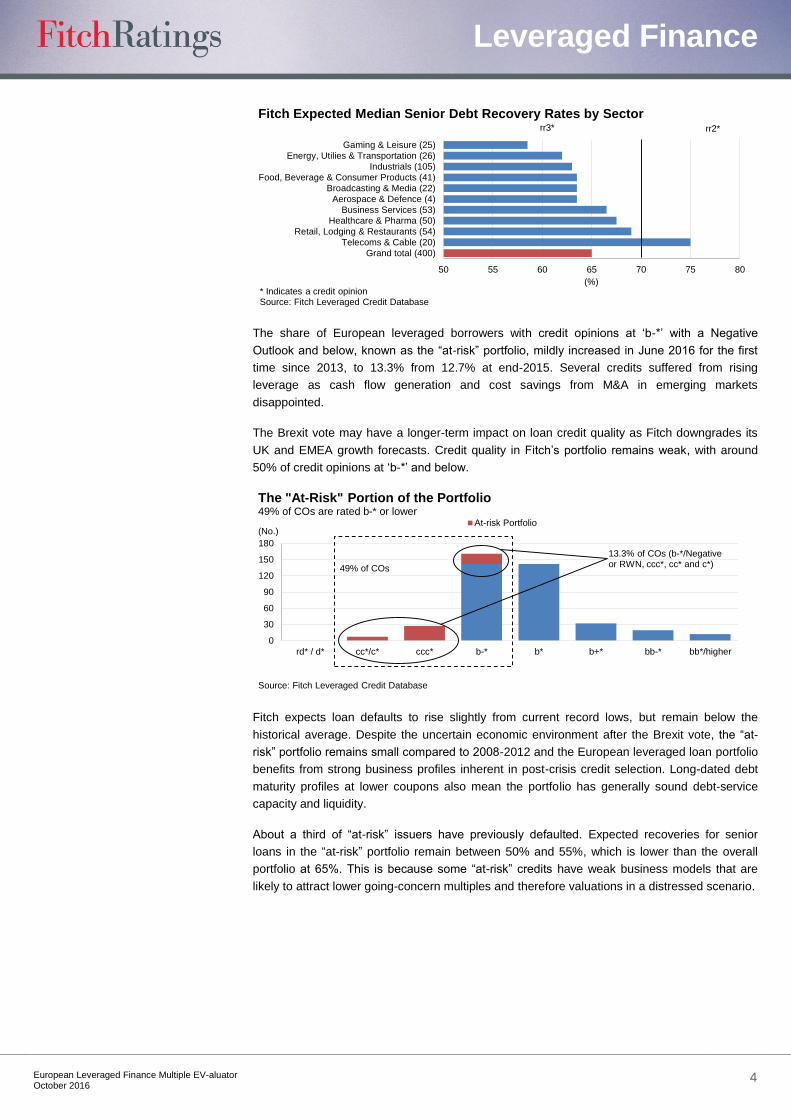
The share of European leveraged borrowers with credit opinions at ‘b-*’ with a Negative
Outlook and below, known as the “at-risk” portfolio, mildly increased in June 2016 for the first
time since 2013, to 13.3% from 12.7% at end-2015. Several credits suffered from rising
leverage as cash flow generation and cost savings from M&A in emerging markets
disappointed.
The Brexit vote may have a longer-term impact on loan credit quality as Fitch downgrades its
UK and EMEA growth forecasts. Credit quality in Fitch’s portfolio remains weak, with around
50% of credit opinions at ‘b-*’ and below.
Fitch expects loan defaults to rise slightly from current record lows, but remain below the
historical average. Despite the uncertain economic environment after the Brexit vote, the “at-
risk” portfolio remains small compared to 2008-2012 and the European leveraged loan portfolio
benefits from strong business profiles inherent in post-crisis credit selection. Long-dated debt
maturity profiles at lower coupons also mean the portfolio has generally sound debt-service
capacity and liquidity.
About a third of “at-risk” issuers have previously defaulted. Expected recoveries for senior
loans in the “at-risk” portfolio remain between 50% and 55%, which is lower than the overall
portfolio at 65%. This is because some “at-risk” credits have weak business models that are
likely to attract lower going-concern multiples and therefore valuations in a distressed scenario.
50 55 60 65 70 75 80
Grand total (400)
Telecoms & Cable (20)
Retail, Lodging & Restaurants (54)
Healthcare & Pharma (50)
Business Services (53)
Aerospace & Defence (4)
Broadcasting & Media (22)
Food, Beverage & Consumer Products (41)
Industrials (105)
Energy, Utilies & Transportation (26)
Gaming & Leisure (25)
(%)
Fitch Expected Median Senior Debt Recovery Rates by Sector
* Indicates a credit opinionSource: Fitch Leveraged Credit Database
rr3* rr2*
0
30
60
90
120
150
180
rd* / d* cc*/c* ccc* b-* b* b+* bb-* bb*/higher
At-risk Portfolio
The "At-Risk" Portion of the Portfolio49% of COs are rated b-* or lower
(No.)
Source: Fitch Leveraged Credit Database
13.3% of COs (b-*/Negative or RWN, ccc*, cc* and c*)49% of COs

Leveraged Finance
European Leveraged Finance Multiple EV-aluator
October 2016 5
Methodology
Fitch has analysed data relating to market multiples, transaction multiples, and leverage ratios
for issuers in each sector using three measures: mean, median, and weighted average.
The results in the tables of this report are based on static median values, which we considered
the most robust due to the relatively large sample sizes and the presence of outlier values that
tended to skew the mean. In most cases, outlier multiples were the result of calculations using
unadjusted EBITDA rather than pro forma, post-synergy figures. “Low” and “High” in this report
refer to the lowest and highest median values each year (during the preceding 10-year period)
for the related sector. “Median” refers to the five-year mean value of the annual median
multiples (or ratios) for that sector. In contrast, the mean was preferred over the median for the
Fitch-employed distressed multiples, due to the relatively low dispersion in values.
Leverage ratios in this report are presented unadjusted due to constraints on verifying certain
leasing obligations among the broad set of issuers. To compare the financial condition of
companies that fund assets with different mixes of debt, capital leases and operating leases,
Fitch adjusts the financial ratios of corporate lessees to capitalise operating lease liabilities as
debt-like obligations. Fitch found that adjustments of these liabilities are significant, resulting in
a difference of 0.5x for about a third of the companies. The distribution largely comprises
issuers such as retailers, manufacturers, telecommunication companies and utilities.
In presenting market multiples, Fitch was challenged by the relatively low number of publicly
traded European leveraged issuers in each sector. Instead of searching for issuers solely within
the “B+ and below” rating range, Fitch selectively composed the peer groups to include highly
leveraged unrated issuers and near-speculative-grade issuers that represent potential
crossover candidates. We aim to further refine the peer group for future editions of this report.
15 20 25 30 35 40 45 50 55 60 65 70 75 80 85 90
Grand Total (53)
Retail, Lodging & Restaurants (12)
Food, Beverage & Consumer Products (4)
Broadcasting & Media (3)
Business Services (7)
Healthcare & Pharma (6)
Industrials (9)
Energy, Utilies & Transportation (5)
Fitch Expected Median Senior Debt Recovery Rates for the 'At-Risk' Portfolio by Sector
* Indicates a credit opinionSource: Fitch Leveraged Credit Database
rr3* rr2*rr4*
(%)
rr5*

Leveraged Finance
European Leveraged Finance Multiple EV-aluator
October 2016 6
All Sectors
9.2
6.0
8.1 7.9
6.7
7.8
9.0 8.6 8.8 8.8
2.22.6 2.8
2.3 2.4 2.6 2.6 2.8 2.8 2.8
0
2
4
6
8
10
2007 2008 2009 2010 2011 2012 2013 2014 2015 1H16
Market Multiple and Total Leverage Ratio
EV-Multiple Leverage Median
Source: Bloomberg, Thomson Reuters, Fitch
(x)
10.7 10.48.6 8.7 9.5
8.1 8.610.1 9.9 9.1
0
2
4
6
8
10
12
2007 2008 2009 2010 2011 2012 2013 2014 2015 1H16
(x)
Transaction Multiple
EV-Multiple Median
Source: Bloomberg, Thomson Reuters, Fitch
0
1
2
3
4
5
6
7
8
9
Aero
sp
ace &
De
fense
Auto
& R
ela
ted
Ch
em
ica
ls
Co
nsu
me
r P
rod
ucts
Div
ers
ifie
d M
anu
factu
rin
g
Div
ers
ifie
d S
erv
ices
Ene
rgy
Foo
d, B
evera
ge &
To
ba
cco
Ga
min
g,
Lo
dg
ing &
Le
isu
re
He
alth
care
Ho
me
bu
ildin
g,
Build
ing
Ma
teria
ls &
Con
str
uctio
n
Med
ia &
En
tert
ain
me
nt
Na
tura
l R
eso
urc
es
Re
tail
Tech
no
log
y
Tele
com
& C
able
Tra
nsp
ort
atio
n
Utilit
ies
(x) Avg. multiple High/low
Source: Fitch
Fitch-Employed Distressed Multiple for Recovery Analysis(Based on developed EU publicly and nonpublicly rated portfolio of 300+ leveraged issuers)
Source: Fitch
Fitch-Employed Distressed Multiple for Recovery Analysis(Based on developed EU publicly and nonpublicly rated portfolio of 300+ leveraged issuers)
Source: Fitch
Fitch-Employed Distressed Multiple for Recovery Analysis(Based on developed EU publicly and nonpublicly rated portfolio of 300+ leveraged issuers)
Source: Fitch
Fitch-Employed Distressed Multiple for Recovery Analysis(Based on developed EU publicly and nonpublicly rated portfolio of 300+ leveraged issuers)
High

Leveraged Finance
European Leveraged Finance Multiple EV-aluator
October 2016 7
Aerospace and Defense
Select Transactions
Country Completion Date Target Buyer Transaction
value (EURm) EBITDA
multiple (x)
United Kingdom 18 Dec 15 Mettis Group Ltd Stirling Square Capital n.a. 9.2 Netherlands 01 Aug 12 Fokker Technologies Group BV Arle Capital Partners Ltd n.a. 8.2 United Kingdom 23 Jul 12 Umeco Ltd Cytec Industries Inc 310 10.1 Denmark 04 Nov 11 Satair A/S Airbus Group NV 334 14.1 Norway 20 Jul 10 Simrad Optronics ASA Rheinmetall AG 79 5.5 United Kingdom 09 Jul 10 Babcock Southern Holdings Ltd Babcock International Group PLC 1694 15.2 United Kingdom 29 Jan 10 Survitec Group Ltd Warburg Pincus LLC n.a. 7.1 Switzerland 18 Dec 06 SR Technics Switzerland AG Mubadala Development Co PJSC n.a. 12.5 Italy 14 Dec 06 Avio Holding SpA Cinven Ltd n.a. 10.0 France 31 Jul 06 TLD Group AXA SA 66 8.2
Source: Company Filings, Bloomberg, Thomson Reuters, Fitch
Aerospace and Defense Market Multiples Company Fitch IDR 2006 2007 2008 2009 2010 2011 2012 2013 2014 2015 1H16
Rolls-Royce Holdings plc A 7.52 12.57 4.63 5.67 7.36 9.36 8.96 10.67 7.74 4.84 4.84 Airbus Group SE A- 10.45 9.58 n.a. 0.30 0.38 1.97 2.71 8.50 4.24 6.85 7.08 Bae Systems plc BBB 9.79 9.33 5.37 5.10 4.89 5.12 5.36 6.99 8.49 9.31 9.31 Mtu Aero Engines AG BBB- 6.33 5.75 2.99 5.40 6.30 5.69 7.97 9.28 10.07 11.15 9.59 Leonardo-Finmeccanica SPA BB+ 6.90 5.93 5.74 5.13 4.81 n.a. 44.90 16.91 7.63 7.32 7.24 Median 7.52 9.33 5.00 5.13 4.89 5.41 7.97 9.28 7.74 7.32 7.24
n.a.: Not applicable Source: Bloomberg, Thomson Reuters, Fitch
8.2
5.2 5.3 5.65.1
6.7
8.9
7.7 7.98.0
1.61.2
2.31.5 1.5 1.3 1.4 1.6 1.9 2.2
0
2
4
6
8
10
2007 2008 2009 2010 2011 2012 2013 2014 2015 1H16
Market Multiple and Total Leverage Ratio
EV-Multiple Leverage Median
Source: Bloomberg, Thomson Reuters, Fitch
(x)
7.1
14.1
9.1 9.2
0
2
4
6
8
10
12
14
16
2007 2008 2009 2010 2011 2012 2013 2014 2015 1H16
(x)
Transaction Multiple
EV-Multiple Median
Source: Bloomberg, Thomson Reuters, Fitch

Leveraged Finance
European Leveraged Finance Multiple EV-aluator
October 2016 8
Auto and Related
Select Transactions
Country Completion date Target Buyer Transaction
value (EURm) EBITDA
multiple (x)
France 25 Feb 16 Montupet Linamar Corp 836 9.1 Germany 01 Nov 14 Jasione GmbH Cinven Ltd n.a. 6.4 Italy 28 Nov 13 Rhiag Inter Auto Parts Italia SpA Apax Partners LLP 558 7.3 Netherlands 23 Oct 13 Transport International Pool Inc HNA Group Co Ltd n.a. 3.8 Germany 31 Jul 13 FTE automotive GmbH Bain Capital Partners LLC 329 4.7 Russia 12 Dec 12 AvtoVAZ OAO Renault-Nissan BV 1763 4.2 Germany 01 Aug 12 Dr Ing hcF Porsche AG Volkswagen AG 6960 3.9 United Kingdom 30 Sep 11 RAC Group Ltd Carlyle Group LP n.a. 11.9 Germany 01 May 08 Stabilus SA Paine & Partners LLC n.a. 6.2
Source: Company Filings, Bloomberg, Thomson Reuters, Fitch
Auto and Related Market Multiples
Company Fitch IDR 2006 2007 2008 2009 2010 2011 2012 2013 2014 2015 1H16
Michelin (CGDE) A- 7.43 5.96 5.35 7.52 3.89 3.41 3.93 4.75 4.66 4.71 4.60 Daimler AG A- 8.18 7.04 7.14 10.23 3.75 1.75 2.47 4.06 3.70 3.35 2.28 Volkswagen AG BBB+ 6.33 6.08 9.41 7.98 2.03 1.81 2.97 3.12 2.40 3.07 2.50 Continental AG BBB 5.94 10.01 5.41 9.19 5.54 4.01 4.75 7.20 7.33 8.02 7.17 Volvo AB BBB 6.44 8.79 7.16 n.a. 10.70 6.00 8.68 11.35 13.30 6.72 8.76 Renault SA BBB- 13.67 12.56 11.42 8.11 4.06 2.07 2.99 4.71 3.88 4.82 4.82 Faurecia BB 5.14 4.68 2.27 6.93 3.84 2.65 3.19 4.47 4.89 4.33 3.36 Peugeot SA BB 8.59 5.63 1.14 3.39 1.71 2.00 n.a. 9.67 3.62 2.35 2.35 Median 7.43 6.08 5.41 7.98 3.84 2.07 3.09 4.71 3.88 4.33 3.36
n.a.: Not applicable Source: Bloomberg, Thomson Reuters, Fitch
6.2
4.94.6
3.4
4.3
6.35.9 6.1
5.6
3.6
2.6
4.3
2.42.0 2.2
2.8 2.92.1 1.8
0
2
4
6
8
2007 2008 2009 2010 2011 2012 2013 2014 2015 1H16
(x)
Market Multiple and Total Leverage Ratio
EV-Multiple Leverage Median
Source: Bloomberg, Thomson Reuters, Fitch
6.9 6.6
10.5
4.2
7.3 6.4 7.29.1
0
2
4
6
8
10
12
2007 2008 2009 2010 2011 2012 2013 2014 2015 1H16
(x)
Transaction Multiple
EV-Multiple Median
Source: Bloomberg, Thomson Reuters, Fitch
Leveraged Finance
European Leveraged Finance Multiple EV-aluator
October 2016 9
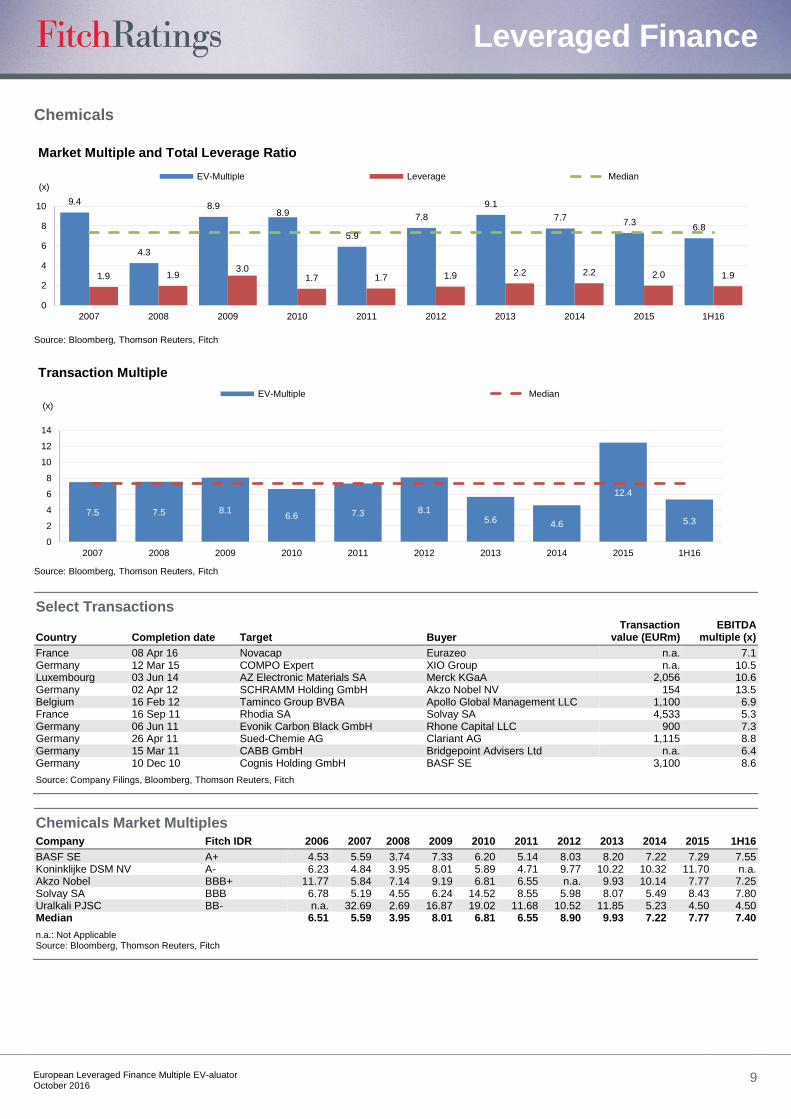
Chemicals
Select Transactions
Country Completion date Target Buyer Transaction
value (EURm) EBITDA
multiple (x)
France 08 Apr 16 Novacap Eurazeo n.a. 7.1 Germany 12 Mar 15 COMPO Expert XIO Group n.a. 10.5 Luxembourg 03 Jun 14 AZ Electronic Materials SA Merck KGaA 2,056 10.6 Germany 02 Apr 12 SCHRAMM Holding GmbH Akzo Nobel NV 154 13.5 Belgium 16 Feb 12 Taminco Group BVBA Apollo Global Management LLC 1,100 6.9 France 16 Sep 11 Rhodia SA Solvay SA 4,533 5.3 Germany 06 Jun 11 Evonik Carbon Black GmbH Rhone Capital LLC 900 7.3 Germany 26 Apr 11 Sued-Chemie AG Clariant AG 1,115 8.8 Germany 15 Mar 11 CABB GmbH Bridgepoint Advisers Ltd n.a. 6.4 Germany 10 Dec 10 Cognis Holding GmbH BASF SE 3,100 8.6
Source: Company Filings, Bloomberg, Thomson Reuters, Fitch
Chemicals Market Multiples Company Fitch IDR 2006 2007 2008 2009 2010 2011 2012 2013 2014 2015 1H16
BASF SE A+ 4.53 5.59 3.74 7.33 6.20 5.14 8.03 8.20 7.22 7.29 7.55 Koninklijke DSM NV A- 6.23 4.84 3.95 8.01 5.89 4.71 9.77 10.22 10.32 11.70 n.a. Akzo Nobel BBB+ 11.77 5.84 7.14 9.19 6.81 6.55 n.a. 9.93 10.14 7.77 7.25 Solvay SA BBB 6.78 5.19 4.55 6.24 14.52 8.55 5.98 8.07 5.49 8.43 7.80 Uralkali PJSC BB- n.a. 32.69 2.69 16.87 19.02 11.68 10.52 11.85 5.23 4.50 4.50 Median 6.51 5.59 3.95 8.01 6.81 6.55 8.90 9.93 7.22 7.77 7.40
n.a.: Not Applicable Source: Bloomberg, Thomson Reuters, Fitch
9.4
4.3
8.98.9
5.9
7.8
9.1
7.77.3
6.8
1.9 1.93.0
1.7 1.7 1.9 2.2 2.2 2.0 1.9
0
2
4
6
8
10
2007 2008 2009 2010 2011 2012 2013 2014 2015 1H16
(x)
Market Multiple and Total Leverage Ratio
EV-Multiple Leverage Median
Source: Bloomberg, Thomson Reuters, Fitch
7.5 7.5 8.16.6 7.3 8.1
5.6 4.6
12.4
5.3
0
2
4
6
8
10
12
14
2007 2008 2009 2010 2011 2012 2013 2014 2015 1H16
(x)
Transaction Multiple
EV-Multiple Median
Source: Bloomberg, Thomson Reuters, Fitch

Leveraged Finance
European Leveraged Finance Multiple EV-aluator
October 2016 10
Consumer Products
Select Transactions
Country Completion date Target Buyer Transaction
value (EURm) EBITDA
multiple (x)
United Kingdom 05 Jan 16 Pace PLC ARRIS Group Inc 1,943 6.8 United Kingdom 24 Sep 15 Aga Rangemaster Group Ltd The Middleby Corp 170 7.3 Spain 09 Feb 15 Grupo Tavex SA Camargo Correa SA 343 8.7 Italy 30 Nov 14 Flos SpA Investindustrial Advisors SpA n.a. 12.2 United Kingdom 27 Oct 14 Office2office PLC Endless LLP 50 4.5 Italy 14 Oct 14 Indesit Co SpA Whirlpool Corp 1,270 9.2 France 01 Apr 14 Orchestra-Premaman SA Yeled Invest SA 58 3.0 Norway 31 Mar 14 Stokke AS NXC Corp n.a. 14.9 United Kingdom 18 Nov 13 Fiberweb Ltd Polymer Group Inc 207 6.2 United Kingdom 10 Feb 13 GHD Ltd Lion Capital LLP n.a. 9.5 Germany 01 Dec 12 LR Health & Beauty Systems GmbH Quadriga Capital Ltd n.a. 7.7 Sweden 01 Feb 12 Securitas Direct AB Bain Capital Partners LLC 2,093 13.2 Switzerland 21 Nov 11 Schulthess Group AG Nibe Industrier AB 482 16.2 Netherlands 31 Aug 11 Scotch & Soda BV Kellwood Co n.a. 7.5 Germany 21 Jul 11 Jack Wolfskin GmbH & Co KG The Blackstone Group LP 694 7.2 Germany 01 Jun 11 SLV Elektronik GmbH Cinven Ltd n.a. 10.1
Source: Company Filings, Bloomberg, Thomson Reuters, Fitch
Consumer Products Market Multiples Company Fitch IDR 2006 2007 2008 2009 2010 2011 2012 2013 2014 2015 1H16
Unilever Plc A+ 10.43 12.16 8.04 11.45 9.72 11.02 11.00 10.74 11.26 13.92 15.02 Henkel AG & CO KGaA A 10.48 9.80 5.92 9.97 9.42 8.23 8.80 11.83 13.18 12.22 11.45 Median 10.45 10.98 6.98 10.71 9.57 9.63 9.90 11.29 12.22 13.07 13.24
n.a.: Not Applicable Source: Bloomberg, Thomson Reuters, Fitch
10.8
7.0
11.5
9.810.3 10.6
11.3 11.3
13.113.8
1.7 1.9 2.1 1.6 1.9 1.9 1.8 1.8 1.7 1.8
0
2
4
6
8
10
12
14
16
2007 2008 2009 2010 2011 2012 2013 2014 2015 1H16
(x)
Market Multiple and Total Leverage Ratio
EV-Multiple Leverage Median
Source: Bloomberg, Thomson Reuters, Fitch
9.0
6.6
3.6
8.6 8.5 8.2 7.3
10.7
8.3 9.1
0
2
4
6
8
10
12
2007 2008 2009 2010 2011 2012 2013 2014 2015 1H16
(x)
Transaction Multiple
EV-Multiple Median
Source: Bloomberg, Thomson Reuters, Fitch

Leveraged Finance
European Leveraged Finance Multiple EV-aluator
October 2016 11
Diversified Manufacturing
Select Transactions
Country Completion date Target Buyer
Transaction value (EURm)
EBITDA multiple (x)
France 17 Dec 15 Saverglass The Carlyle Group LP n.a. 6.3 France 29 Oct 15 Verallia SA Apollo Global Management LLC 2,945 5.1 Switzerland 31 Jul 15 Swisslog Holding AG KUKA AG 275 11.0 Switzerland 13 Mar 15 SIG Combibloc Group AG Onex Corp 3,544 10.4 Germany 23 Dec 14 Wittur GmbH Bain Capital Partners LLC n.a. 8.2 Germany 04 Aug 14 Mauser Holding GmbH Clayton Dubilier & Rice LLC 1,154 7.8 Italy 23 Jun 14 Megadyne SpA Astorg Partners n.a. 11.6 Switzerland 11 Feb 14 VAT Holding AG Partners Group Holding AG n.a. 5.7 United Kingdom 20 Jan 14 Invensys Ltd Schneider Electric SE 3,508 15.5 Netherlands 10 Jan 14 Edwards Group Ltd Atlas Copco AB 969 7.4 Austria 19 Nov 13 AHT Cooling Systems GmbH Bridgepoint Advisers Ltd 585 11.5 Germany 04 Sep 13 CeramTec GmbH Cinven Ltd 1,424 11.1 France 13 Mar 13 Tognum AG Rolls-Royce Holdings PLC 4,271 13.7 Belgium 04 Mar 13 ADB Airfield Solutions PAI Partners SAS 208 8.5 Germany 17 Jul 12 Bartec GmbH Charterhouse Capital Partners LLP n.a. 11.9
Source: Company Filings, Bloomberg, Thomson Reuters, Fitch
Diversified Manufacturing Market Multiples Company Fitch IDR 2006 2007 2008 2009 2010 2011 2012 2013 2014 2015 1H16
Atlas Copco AB A 11.27 9.84 6.48 11.50 12.52 9.38 9.76 11.14 13.68 11.07 11.85 GEA Group AG BBB 7.82 9.75 4.06 7.36 10.54 7.16 11.79 13.47 11.27 14.25 17.26 Smurfit Kappa Group plc BB+ n.a. 2.45 4.03 6.87 6.10 4.10 5.12 6.80 7.09 7.53 7.24 Median 9.55 9.75 4.06 7.36 10.54 7.16 9.76 11.14 11.27 11.07 11.85
n.a.: Not applicable Source: Bloomberg, Thomson Reuters, Fitch
8.0
4.8
8.1
10.4
6.6
8.18.8
9.2 9.09.5
1.6 1.9 2.6 1.9 1.9 2.0 2.1 2.2 2.5 2.7
0
2
4
6
8
10
12
2007 2008 2009 2010 2011 2012 2013 2014 2015 1H16
(x)
Market Multiple and Total Leverage Ratio
EV-Multiple Leverage Median
Source: Bloomberg, Thomson Reuters, Fitch
8.8 8.8 9.1 8.6 8.7 8.9 8.6 7.8
10.4
6.8
0
2
4
6
8
10
12
2007 2008 2009 2010 2011 2012 2013 2014 2015 1H16
(x)
Transaction Multiple
EV-Multiple Median
Source: Bloomberg, Thomson Reuters, Fitch

Leveraged Finance
European Leveraged Finance Multiple EV-aluator
October 2016 12
Diversified Services
Select Transactions
Country Completion date Target Buyer
Transaction value (EURm)
EBITDA multiple (x)
United Kingdom 11 May 16 Penna Consulting PLC Adecco Group AG 117 16.2 Sweden 22 Feb 16 Proffice AB Randstad Holding NV 192 9.1 Netherlands 17 Dec 15 VERMAAT Groep B.V. Partners Group n.a. 11.0 Belgium 30 Jun 15 Azelis Holding SA Apax Partners LLP n.a. 10.0 United Kingdom 02 Apr 15 Networkers International PLC Matchtech Group PLC 85 11.4 United Kingdom 31 Mar 15 Trainline.com Ltd KKR & Co LP n.a. 12.0 United Kingdom 22 Dec 14 Northgate Public Services Ltd Cinven Ltd 413 8.3 United Kingdom 18 Dec 14 Dealogic Holdings PLC Euromoney Institutional Investor PLC 477 14.6 United Kingdom 17 Oct 14 Hyder Consulting PLC Arcadis NV 352 10.1 Netherlands 17 Sep 14 Bureau van Dijk Electronic Publishing BV EQT Partners AB n.a. 15.7 Germany 31 Jul 14 TeamViewer.com Inc Permira Holdings Ltd n.a. 10.1 Denmark 09 Jul 14 Nets Holding A/S ATP Private Equity Partners 2,277 10.8 United Kingdom 04 Dec 13 Cambridge Education Group Ltd Bridgepoint Advisers Ltd 258 23.1 United Kingdom 19 Jul 13 Host Europe Group Ltd Cinven Ltd 603 6.8 Spain 15 Jul 13 Befesa Medio Ambiente SA Triton Advisers Ltd 625 5.1
Source: Company Filings, Bloomberg, Thomson Reuters, Fitch
Diversified Services Market Multiples Company Fitch IDR 2006 2007 2008 2009 2010 2011 2012 2013 2014 2015 1H16
Compass Group plc A- 10.49 9.46 8.53 7.36 8.73 8.42 11.60 14.88 12.53 12.66 14.20 Sodexo BBB+ 9.65 9.86 9.05 8.00 8.08 8.01 8.01 10.52 10.59 9.21 10.80 Rexel SA BB n.a. 7.33 5.16 11.32 10.42 7.30 8.76 12.29 9.75 9.41 10.56 Median 10.07 9.46 8.53 8.00 8.73 8.01 8.76 12.29 10.59 9.41 10.80
n.a.: Not applicable Source: Bloomberg, Thomson Reuters, Fitch
8.7
7.0
8.510.0
8.08.9
12.2
10.2 10.5 11.0
2.4 2.82.8 2.8 2.6 2.8 3.1 3.0 2.8 2.8
0
2
4
6
8
10
12
14
2007 2008 2009 2010 2011 2012 2013 2014 2015 1H16
(x)
Market Multiple and Total Leverage Ratio
EV-Multiple Leverage Median
Source: Bloomberg, Thomson Reuters, Fitch
10.211.9
8.7 9.1
12.9
6.18.1
12.4
9.1
12.6
0
2
4
6
8
10
12
14
2007 2008 2009 2010 2011 2012 2013 2014 2015 1H16
(x)
Transaction Multiple
EV-Multiple Median
Source: Bloomberg, Thomson Reuters, Fitch

Leveraged Finance
European Leveraged Finance Multiple EV-aluator
October 2016 13
Energy
Select Transactions
Country Completion date Target Buyer
Transaction value (EURm)
EBITDA multiple (x)
United Kingdom 29 Oct 15 Alkane Energy PLC Balfour Beatty PLC 99 9.5 United Kingdom 03 Mar 15 Salamander Energy PLC Ophir Energy PLC 796 5.7 Norway 01 Jul 14 Heritage Oil PLC Al Mirqab Capital SPC 1,359 11.4 United Kingdom 09 Jul 14 OEG Offshore Ltd KKR & Co LP n.a. 9.8 Russia 19 Mar 14 Veripos Inc Hexagon AB 143 15.8 Norway 26 Jun 13 Sevan Drilling AS Seadrill Ltd 148 6.1 United Kingdom 11 Oct 12 Melrose Resources PLC Petroceltic International PLC 618 3.1 Russia 08 Mar 11 Wellstream Holdings Ltd General Electric Co 982 14.3 United Kingdom 23 Feb 11 Velosi Ltd Carlyle Group LP/The 79 5.9
Source: Company Filings, Bloomberg, Thomson Reuters, Fitch
Energy Market Multiples Company Fitch IDR 2006 2007 2008 2009 2010 2011 2012 2013 2014 2015 1H16
Royal Dutch Shell plc AA- 4.72 5.04 2.98 7.85 5.69 4.73 4.63 5.42 5.43 7.33 12.98 Total SA AA- 5.15 4.68 3.32 5.58 3.85 3.33 3.49 4.62 6.61 8.23 9.78 BP plc A 7.27 6.90 4.41 6.16 80.22 3.77 6.03 4.28 8.09 18.39 16.17 ENI SPA A- 4.03 4.22 2.98 4.38 3.58 3.69 3.52 4.70 4.41 10.74 14.48 Repsol SA BBB 4.64 4.33 3.50 5.82 3.39 8.77 5.21 12.57 13.69 51.71 60.38 Tatneft PJSC BBB- 4.16 4.11 3.20 4.42 5.48 4.23 4.30 3.81 3.76 4.35 4.75 Weatherford International PL B+ 8.86 12.07 4.84 12.28 12.67 7.46 10.68 10.49 8.52 n.a. n.a. Median 4.72 4.68 3.32 5.82 5.48 4.23 4.63 4.70 6.61 9.49 13.73
n.a.: Not applicable Source: Bloomberg, Thomson Reuters, Fitch
8.6
3.4
6.2 7.0 6.1 6.0
7.26.1
6.7 6.6
1.1 1.1 1.61.8 1.8 1.7 1.9
2.9 3.3 3.4
0123456789
10
2007 2008 2009 2010 2011 2012 2013 2014 2015 1H16
(x)
Market Multiple and Total Leverage Ratio
EV-Multiple Leverage Median
Source: Bloomberg, Thomson Reuters, Fitch
9.7
13.0
4.4
12.3
5.43.1
5.9
10.6
4.25.7
0
2
4
6
8
10
12
14
2007 2008 2009 2010 2011 2012 2013 2014 2015 1H16
(x)
Transaction Multiple
EV-Multiple Median
Source: Bloomberg, Thomson Reuters, Fitch

Leveraged Finance
European Leveraged Finance Multiple EV-aluator
October 2016 14
Food, Beverage and Tobacco
Select Transactions
Country Completion date Target Buyer
Transaction value (EURm)
EBITDA multiple (x)
Slovenia 15 Oct 15 Pivovarna Lasko Heineken NV 339 9.8 Spain 12 Dec 14 Deoleo SA CVC Capital Partners Ltd 837 12.5
Source: Company Filings, Bloomberg, Thomson Reuters, Fitch
Food, Beverage and Tobacco Market Multiples
Company Fitch IDR 2006 2007 2008 2009 2010 2011 2012 2013 2014 2015 1H16
Nestle SA AA 10.94 12.05 10.72 12.36 11.93 12.14 12.77 13.83 17.50 15.69 15.69 British American Tobacco plc A- 10.90 14.07 11.55 10.49 11.01 12.37 12.29 11.82 14.98 17.11 17.11 DIAGEO PLC A- 13.94 12.78 11.60 12.24 14.28 15.40 15.16 19.63 19.17 n.a. 17.67 SabMiller PLC A- 9.96 9.26 7.72 14.98 15.08 13.41 18.35 17.38 17.29 24.22 24.22 Anheuser-Busch Inbev SA/NV BBB+ 8.74 8.39 12.35 9.24 10.01 9.10 11.28 9.22 12.54 14.52 14.52 Carrefour SA BBB+ 8.09 8.98 5.70 9.08 9.14 13.76 6.30 6.71 6.22 6.76 6.76 Koninklijke Ahold Delhaize NV BBB 9.41 7.70 6.10 5.44 5.41 5.39 5.01 5.31 5.98 7.06 6.20 Imperial Brands PLC BBB 11.51 13.59 13.00 9.92 9.07 9.59 9.66 9.94 11.70 15.44 16.11 Pernod Ricard SA BBB- 15.40 12.72 11.73 14.21 13.51 14.90 13.65 15.76 20.29 n.a. 19.80 Casino Guichard Perrachon BBB- 8.31 6.96 6.60 6.76 7.40 7.55 6.33 6.66 8.81 9.90 9.90 Metro AG BBB- 6.54 7.45 4.37 5.96 5.87 3.87 3.37 4.78 5.94 5.05 5.08 TESCO PLC BB+ 12.08 10.30 8.60 8.83 7.57 5.95 9.52 8.30 n.a. 9.23 9.23 Synergy PJSC B+ n.a. 14.17 n.a. 5.91 10.33 4.48 4.15 6.98 7.81 6.93 6.93 Premier Foods plc B 13.78 9.77 7.47 7.78 5.30 n.a. 7.73 9.96 n.a. 9.24 9.24 Median 10.90 10.04 8.60 9.16 9.57 9.59 9.59 9.58 12.12 9.57 12.21
n.a.: Not applicable Source: Bloomberg, Thomson Reuters, Fitch
10.6
7.9
9.39.2
9.3 9.610.9 10.8 10.5
12.0
2.83.4
2.7 2.1 2.2 2.7 3.0 2.9 2.8 2.8
0
2
4
6
8
10
12
14
2007 2008 2009 2010 2011 2012 2013 2014 2015 1H16
(x)
Market Multiple and Total Leverage Ratio
EV-Multiple Leverage Median
Source: Bloomberg, Thomson Reuters, Fitch
11.314.2
7.9 9.0 7.7 8.2 8.9 8.8 9.8
16.0
0
4
8
12
16
20
2007 2008 2009 2010 2011 2012 2013 2014 2015 1H16
(x)
Transaction Multiple
EV-Multiple Median
Source: Bloomberg, Thomson Reuters, Fitch

Leveraged Finance
European Leveraged Finance Multiple EV-aluator
October 2016 15
Gaming, Lodging and Leisure
Select Transactions
Country Completion date Target Buyer
Transaction value (EURm)
EBITDA multiple (x)
Italy 30 May 16 Sisal Group SpA CVC Capital Partners Ltd 1,000 5.7 United Kingdom 02 Feb 16 Betfair Group PLC Paddy Power Betfair PLC 2,869 17.5 United Kingdom 19 Mar 15 Sky Betting & Gaming CVC Capital Partners Ltd 954 12.0 United Kingdom 09 Feb 15 Azzurri Group Ltd Bridgepoint Advisers Ltd 316 2.5 United Kingdom 03 Feb 15 Prezzo PLC TPG Capital Management LP 356 9.7 United Kingdom 18 Aug 14 PizzaExpress Ltd Hony Capital Ltd 1,053 9.5 United Kingdom 31 Aug 13 Vue Entertainment Ltd Alberta Investment Management Corp 1,100 7.7 Norway 30 Jun 13 Oslo Kino AS Egmont International Holding A/S 80 10.9 United Kingdom 20 Mar 13 Sportingbet PLC William Hill PLC 568 7.8 Germany 20 Sep 12 Cinemaxx AG Vue Beteiligungs AG 201 5.1 United Kingdom 27 Sep 11 Holidaybreak Ltd Cox & Kings Ltd 502 7.8 United Kingdom 08 Nov 10 Vue Entertainment Ltd Doughty Hanson & Co Managers Ltd n.a. 7.3
Source: Company Filings, Bloomberg, Thomson Reuters, Fitch
Gaming, Lodging and Leisure Market Multiples
Company Fitch IDR 2006 2007 2008 2009 2010 2011 2012 2013 2014 2015 1H16
Whitbread plc BBB 37.30 11.51 5.96 8.89 8.55 7.71 9.79 15.47 15.31 10.83 10.83 Accor SA BBB- 10.58 8.77 6.61 15.66 9.74 5.70 7.78 9.69 9.70 9.49 9.49 Ladbrokes plc BB 12.00 6.31 5.77 7.11 7.01 7.51 7.75 12.95 9.70 25.57 25.57 Intralot S.A. B+ 8.41 9.14 3.91 6.43 5.73 3.80 4.46 3.97 3.73 4.18 3.95 Thomas Cook Group plc B n.a. 5.64 4.83 8.93 6.88 n.a. 4.55 11.33 7.38 4.92 5.26 NH Hotel Group SA B- 14.81 10.79 8.44 51.23 15.36 9.60 n.a. 20.60 17.50 15.02 15.02 Median 12.00 8.95 5.87 8.91 7.78 7.51 7.75 12.14 9.70 10.16 10.16
n.a.: Not applicable Source: Bloomberg, Thomson Reuters, Fitch
9.1
6.4
8.9 9.37.6 7.8
11.710.5
9.6 9.4
3.44.3
4.2 3.6 3.3 3.03.8
4.6 4.1 3.7
0
2
4
6
8
10
12
14
2007 2008 2009 2010 2011 2012 2013 2014 2015 1H16
(x)
Market Multiple and Total Leverage Ratio
EV-Multiple Leverage Median
Source: Bloomberg, Thomson Reuters, Fitch
11.6
6.37.8 7.3
10.6
5.37.8
9.58.3
9.9
0
2
4
6
8
10
12
14
2007 2008 2009 2010 2011 2012 2013 2014 2015 1H16
(x)
Transaction Multiple
EV-Multiple Median
Source: Bloomberg, Thomson Reuters, Fitch
Leveraged Finance
European Leveraged Finance Multiple EV-aluator
October 2016 16
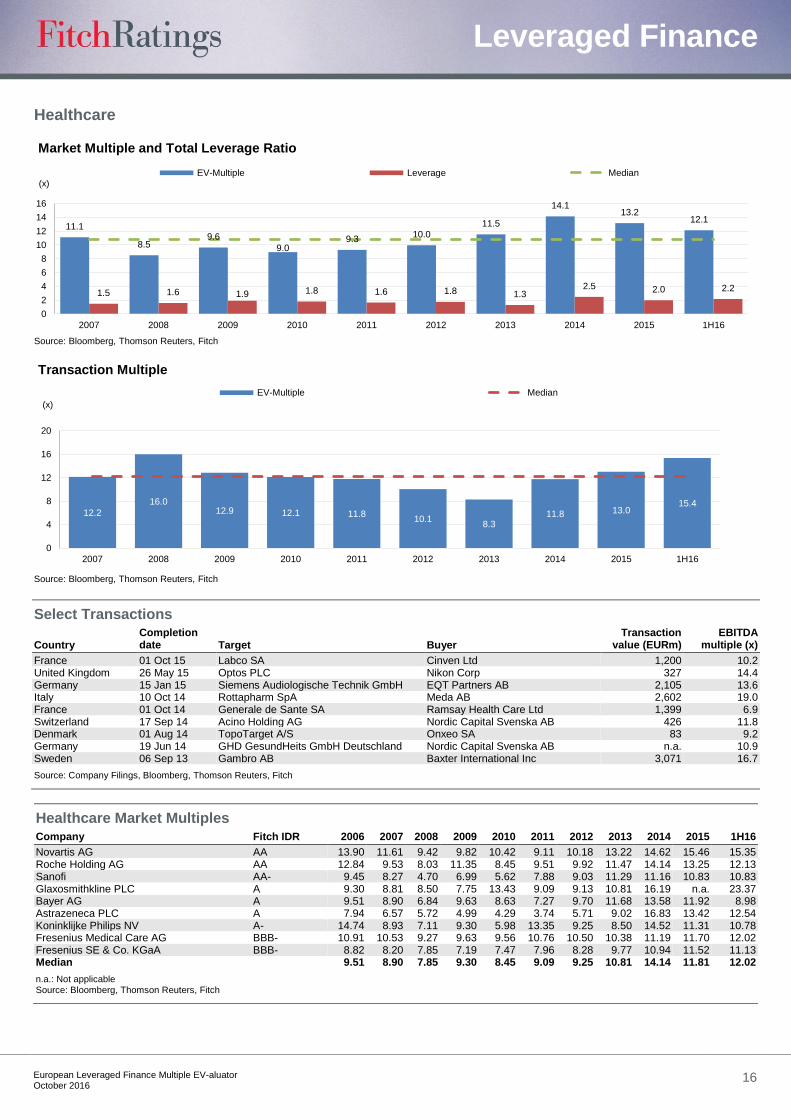
Healthcare
Select Transactions
Country Completion date Target Buyer
Transaction value (EURm)
EBITDA multiple (x)
France 01 Oct 15 Labco SA Cinven Ltd 1,200 10.2 United Kingdom 26 May 15 Optos PLC Nikon Corp 327 14.4 Germany 15 Jan 15 Siemens Audiologische Technik GmbH EQT Partners AB 2,105 13.6 Italy 10 Oct 14 Rottapharm SpA Meda AB 2,602 19.0 France 01 Oct 14 Generale de Sante SA Ramsay Health Care Ltd 1,399 6.9 Switzerland 17 Sep 14 Acino Holding AG Nordic Capital Svenska AB 426 11.8 Denmark 01 Aug 14 TopoTarget A/S Onxeo SA 83 9.2 Germany 19 Jun 14 GHD GesundHeits GmbH Deutschland Nordic Capital Svenska AB n.a. 10.9 Sweden 06 Sep 13 Gambro AB Baxter International Inc 3,071 16.7
Source: Company Filings, Bloomberg, Thomson Reuters, Fitch
Healthcare Market Multiples
Company Fitch IDR 2006 2007 2008 2009 2010 2011 2012 2013 2014 2015 1H16
Novartis AG AA 13.90 11.61 9.42 9.82 10.42 9.11 10.18 13.22 14.62 15.46 15.35 Roche Holding AG AA 12.84 9.53 8.03 11.35 8.45 9.51 9.92 11.47 14.14 13.25 12.13 Sanofi AA- 9.45 8.27 4.70 6.99 5.62 7.88 9.03 11.29 11.16 10.83 10.83 Glaxosmithkline PLC A 9.30 8.81 8.50 7.75 13.43 9.09 9.13 10.81 16.19 n.a. 23.37 Bayer AG A 9.51 8.90 6.84 9.63 8.63 7.27 9.70 11.68 13.58 11.92 8.98 Astrazeneca PLC A 7.94 6.57 5.72 4.99 4.29 3.74 5.71 9.02 16.83 13.42 12.54 Koninklijke Philips NV A- 14.74 8.93 7.11 9.30 5.98 13.35 9.25 8.50 14.52 11.31 10.78 Fresenius Medical Care AG BBB- 10.91 10.53 9.27 9.63 9.56 10.76 10.50 10.38 11.19 11.70 12.02 Fresenius SE & Co. KGaA BBB- 8.82 8.20 7.85 7.19 7.47 7.96 8.28 9.77 10.94 11.52 11.13 Median 9.51 8.90 7.85 9.30 8.45 9.09 9.25 10.81 14.14 11.81 12.02
n.a.: Not applicable Source: Bloomberg, Thomson Reuters, Fitch
11.1
8.59.6
9.09.3
10.011.5
14.113.2
12.1
1.5 1.6 1.9 1.8 1.6 1.8 1.32.5 2.0 2.2
0
2
4
6
8
10
12
14
16
2007 2008 2009 2010 2011 2012 2013 2014 2015 1H16
(x)
Market Multiple and Total Leverage Ratio
EV-Multiple Leverage Median
Source: Bloomberg, Thomson Reuters, Fitch
12.2
16.012.9 12.1 11.8
10.18.3
11.8 13.015.4
0
4
8
12
16
20
2007 2008 2009 2010 2011 2012 2013 2014 2015 1H16
(x)
Transaction Multiple
EV-Multiple Median
Source: Bloomberg, Thomson Reuters, Fitch

Leveraged Finance
European Leveraged Finance Multiple EV-aluator
October 2016 17
Homebuilding, Building Materials and Construction
Select Transactions
Country Completion date Target Buyer Transaction
value (EURm) EBITDA
multiple (x)
Finland 04 Mar 15 Sanitec Oyj Geberit AG 1,220.1 12.0 France 22 Jul 14 ParexGroup SA CVC Capital Partners Ltd 868.0 8.2 France 31 Mar 14 Kerneos SA Astorg Partners 574.9 8.0 Germany 31 Dec 13 Armacell International GmbH Charterhouse Capital Partners LLP 430.0 6.8 Sweden 27 Dec 10 Munters AB Nordic Capital Svenska AB 610.1 13.0 United Kingdom 05 May 10 Kingspan Access Floors Holdings Ltd Sun Capital Partners Inc 129.4 20.6
Source: Company Filings, Bloomberg, Thomson Reuters, Fitch
Homebuilding, Building Materials and Construction Market Multiples Company Fitch IDR 2006 2007 2008 2009 2010 2011 2012 2013 2014 2015 1H16
Sias SPA BBB+ 8.07 10.55 6.26 6.94 7.04 5.56 6.15 6.51 6.59 6.63 6.62 Abertis Infraestructuras SA BBB+ 12.79 12.28 10.28 10.71 10.72 10.22 11.53 10.58 10.93 26.69 n.a. Vinci SA BBB+ 15.82 8.90 6.09 7.16 7.06 6.01 6.21 7.51 6.51 8.52 8.52 CRH plc BBB 8.64 6.40 6.11 9.69 9.17 9.01 9.33 20.18 10.96 13.44 13.44 Lafargeholcim LTD BBB 7.51 7.07 6.66 9.18 8.16 7.65 8.95 8.64 9.72 14.15 12.91 Ferrovial SA BBB 26.19 27.75 10.05 14.99 6.86 13.68 13.91 15.51 19.32 17.80 17.79 EI Towers SPA BBB 35.72 29.24 29.98 10.18 12.01 12.74 8.49 10.38 11.66 16.06 12.93 Compagnie De Saint Gobain BBB 7.02 5.74 4.65 9.09 6.48 5.35 6.56 8.01 7.81 8.23 8.23 Taylor Wimpey plc BBB- 6.56 7.41 8.18 n.a. 33.67 8.55 9.70 10.04 8.75 10.08 10.08 Heidelbergcement AG BB+ 9.23 11.19 5.27 11.28 8.04 6.60 7.13 8.19 9.00 8.41 8.57 Salini Impregilo SPA BB 6.68 9.83 3.17 6.71 4.15 4.87 10.48 10.19 4.62 5.01 5.01 Obrascon Huarte Lain S.A. BB- 9.20 6.71 6.38 8.16 8.18 10.56 8.83 8.13 11.96 8.78 8.78 Median 8.92 9.37 6.32 9.18 8.10 8.10 8.89 9.34 9.36 9.43 8.78
n.a.: Not applicable Source: Bloomberg, Thomson Reuters, Fitch
8.7
6.2
8.9
8.1 7.4
9.1 9.0 8.8 9.0 9.2
2.83.7 3.8
4.1 4.0 4.2 3.8 3.5 3.4 3.4
0
2
4
6
8
10
2007 2008 2009 2010 2011 2012 2013 2014 2015 1H16
(x)
Market Multiple and Total Leverage Ratio
EV-Multiple Leverage Median
Source: Bloomberg, Thomson Reuters, Fitch
9.17.8 7.7
10.6
7.68.6
10.88.9
10.3 9.7
0
2
4
6
8
10
12
2007 2008 2009 2010 2011 2012 2013 2014 2015 1H16
(x)
Transaction Multiple
EV-Multiple Median
Source: Bloomberg, Thomson Reuters, Fitch
Leveraged Finance
European Leveraged Finance Multiple EV-aluator
October 2016 18
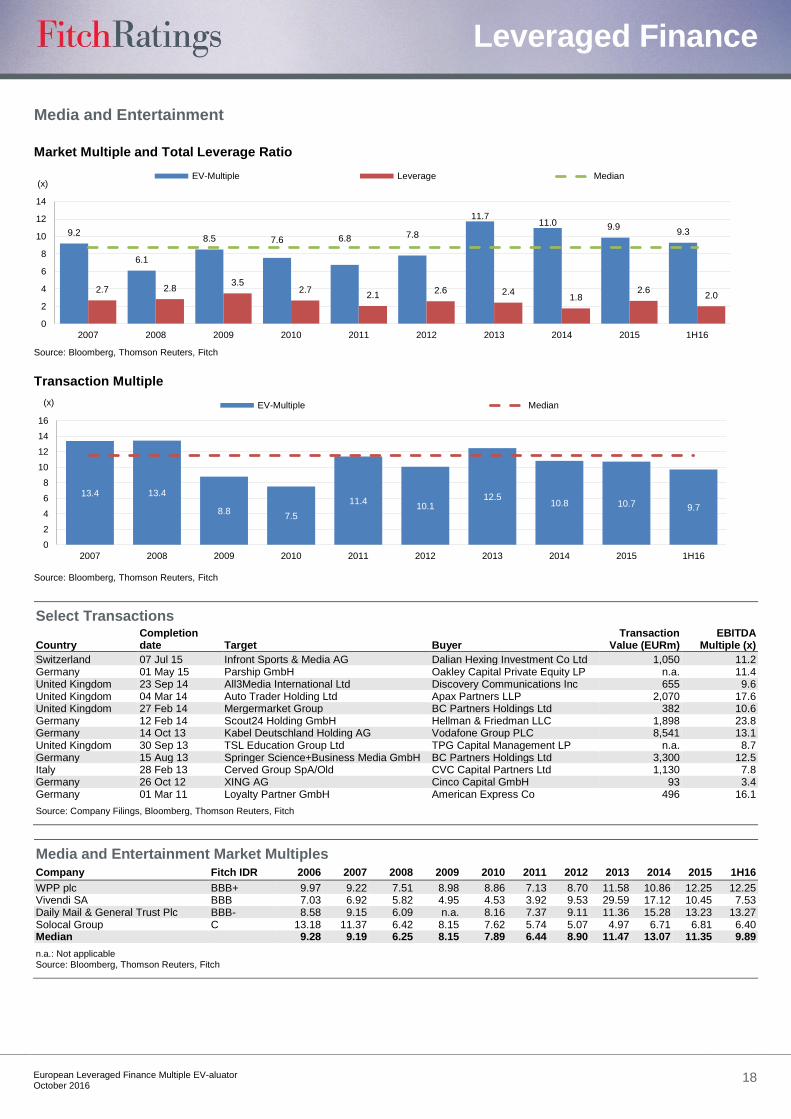
Media and Entertainment
Select Transactions
Country Completion date Target Buyer
Transaction Value (EURm)
EBITDA Multiple (x)
Switzerland 07 Jul 15 Infront Sports & Media AG Dalian Hexing Investment Co Ltd 1,050 11.2 Germany 01 May 15 Parship GmbH Oakley Capital Private Equity LP n.a. 11.4 United Kingdom 23 Sep 14 All3Media International Ltd Discovery Communications Inc 655 9.6 United Kingdom 04 Mar 14 Auto Trader Holding Ltd Apax Partners LLP 2,070 17.6 United Kingdom 27 Feb 14 Mergermarket Group BC Partners Holdings Ltd 382 10.6 Germany 12 Feb 14 Scout24 Holding GmbH Hellman & Friedman LLC 1,898 23.8 Germany 14 Oct 13 Kabel Deutschland Holding AG Vodafone Group PLC 8,541 13.1 United Kingdom 30 Sep 13 TSL Education Group Ltd TPG Capital Management LP n.a. 8.7 Germany 15 Aug 13 Springer Science+Business Media GmbH BC Partners Holdings Ltd 3,300 12.5 Italy 28 Feb 13 Cerved Group SpA/Old CVC Capital Partners Ltd 1,130 7.8 Germany 26 Oct 12 XING AG Cinco Capital GmbH 93 3.4 Germany 01 Mar 11 Loyalty Partner GmbH American Express Co 496 16.1
Source: Company Filings, Bloomberg, Thomson Reuters, Fitch
Media and Entertainment Market Multiples Company Fitch IDR 2006 2007 2008 2009 2010 2011 2012 2013 2014 2015 1H16
WPP plc BBB+ 9.97 9.22 7.51 8.98 8.86 7.13 8.70 11.58 10.86 12.25 12.25 Vivendi SA BBB 7.03 6.92 5.82 4.95 4.53 3.92 9.53 29.59 17.12 10.45 7.53 Daily Mail & General Trust Plc BBB- 8.58 9.15 6.09 n.a. 8.16 7.37 9.11 11.36 15.28 13.23 13.27 Solocal Group C 13.18 11.37 6.42 8.15 7.62 5.74 5.07 4.97 6.71 6.81 6.40 Median 9.28 9.19 6.25 8.15 7.89 6.44 8.90 11.47 13.07 11.35 9.89
n.a.: Not applicable Source: Bloomberg, Thomson Reuters, Fitch
9.2
6.1
8.5 7.6 6.8 7.8
11.711.0 9.9
9.3
2.7 2.83.5
2.72.1
2.6 2.41.8
2.62.0
0
2
4
6
8
10
12
14
2007 2008 2009 2010 2011 2012 2013 2014 2015 1H16
EV-Multiple Leverage Median
Source: Bloomberg, Thomson Reuters, Fitch
(x)
Market Multiple and Total Leverage Ratio
13.4 13.4
8.87.5
11.410.1
12.510.8 10.7 9.7
0
2
4
6
8
10
12
14
16
2007 2008 2009 2010 2011 2012 2013 2014 2015 1H16
EV-Multiple Median
Source: Bloomberg, Thomson Reuters, Fitch
(x)
Transaction Multiple

Leveraged Finance
European Leveraged Finance Multiple EV-aluator
October 2016 19
Natural Resources
Select Transactions
Country Completion date Target Buyer
Transaction value (EURm)
EBITDA multiple (x)
United Kingdom 03 Dec 15 Polyus Gold International Ltd Wandle Holdings Ltd 5,151 9.1 Finland 29 Jul 14 Rautaruukki OYJ SSAB AB 1,811 11.2 United Kingdom 13 Nov 13 Archipelago Resources PLC Rajawali Corp PT 401 5.0 Netherlands 27 Oct 11 Mondo Minerals BV Advent International Corp n.a. 8.7 France 17 Dec 08 Euro Ressources SA IAMGOLD Corp 67 9.7 Belgium 09 Apr 08 Cumerio NV/SA Aurubis AG 903 6.7 Austria 25 Mar 08 Boehler-Uddeholm AG voestalpine AG 3,051 9.1 Germany 31 Dec 07 Almatis GmbH Dubai International Capital LLC n.a. 8.5 United Kingdom 05 Apr 07 Corus Group Ltd Tata Steel Ltd 10,175 7.3
Source: Company Filings, Bloomberg, Thomson Reuters, Fitch
Natural Resources Market Multiples Company Fitch IDR 2006 2007 2008 2009 2010 2011 2012 2013 2014 2015 1H16
Tenaris SA A- 10.45 8.65 3.94 10.95 13.99 9.06 8.47 8.99 6.67 14.97 24.98 Rio Tinto plc A- 7.42 17.58 3.25 11.56 6.45 6.49 52.21 10.57 6.64 8.58 8.58 Novolipetsk Steel PJSC BBB- 5.22 7.31 1.50 13.46 12.79 6.67 8.21 8.47 3.60 3.22 5.27 MMC Norilsk Nickel PJSC BBB- n.a. 6.79 2.97 6.83 5.58 4.69 6.75 9.08 4.75 5.93 5.93 Anglo American plc BB+ 8.16 8.85 4.23 10.81 6.05 4.30 69.64 8.68 15.20 n.a. n.a. Thyssenkrupp AG BB+ 2.78 4.30 2.31 1,403.43 6.89 3.67 8.97 11.01 6.98 5.50 7.13 Arcelormittal BB+ 8.83 7.09 2.55 29.92 10.28 5.72 7.30 8.35 5.33 n.a. n.a. Alrosa PJSC BB n.a. n.a. n.a. n.a. n.a. 5.31 5.45 5.43 7.08 5.36 4.90 Ferrexpo plc CCC n.a. 12.06 1.05 16.78 6.91 3.20 7.27 5.55 3.67 7.62 7.62 Median 7.79 7.98 2.76 12.51 6.90 5.31 8.21 8.68 6.64 5.93 7.13
n.a.: Not applicable Source: Bloomberg, Thomson Reuters, Fitch
8.0
3.5
13.3
8.0
5.5
8.1 8.5
6.76.1
7.5
1.8 1.62.4 2.4 2.2
3.7 3.52.7 2.5 2.2
0
2
4
6
8
10
12
14
2007 2008 2009 2010 2011 2012 2013 2014 2015 1H16
Market Multiple and Total Leverage Ratio
EV-Multiple Leverage Median
Source: Bloomberg, Thomson Reuters, Fitch
(x)
8.59.1
5.3
4.0
8.7
5.3
11.2
5.2
9.5
0
2
4
6
8
10
12
2007 2008 2009 2010 2011 2012 2013 2014 2015 1H16
Transaction Multiple
EV-Multiple Median
Source: Bloomberg, Thomson Reuters, Fitch
(x)

Leveraged Finance
European Leveraged Finance Multiple EV-aluator
October 2016 20
Retail
Select Transactions
Country Completion date Target Buyer
Transaction value (EURm)
EBITDA multiple (x)
United Kingdom 05 Sep 16 Home Retail Group PLC J Sainsbury PLC 1,184 3.9
Germany 31 Aug 15 Douglas Holding AG CVC Capital Partners Ltd 2,869 14.4 Italy 07 Aug 15 World Duty Free SpA Dufry AG 2,277 15.4 United Kingdom 26 Jun 15 New Look Retail Group Ltd Brait SE 2,458 8.6 Germany 31 Dec 14 Christ Juweliere und Uhrmacher seit 1863
GmbH 3i Group PLC 214 10.7
Czech Republic Nov 14 AAA Auto Group NV Abris Capital Partners Sp zoo 220 10.0 United Kingdom 07 Dec 11 Wiggle Ltd Bridgepoint Advisers Ltd 211 12.9 Italy 30 Jun 11 Gruppo Coin SpA BC Partners Holdings Ltd 1,093 6.4 Italy 30 Jun 11 Bulgari SpA LVMH Moet Hennessy Louis Vuitton SE 2,166 26.0 Germany 23 Dec 10 Takko Holding GmbH Apax Partners LLP n.a. 8.3 Netherlands 07 Dec 10 Hunkemoeller Lingerie Unit PAI Partners SAS n.a. 8.2 Germany 24 Nov 10 Puccini Holding GmbH Carlyle Group LP n.a. 9.0 France 14 Oct 10 Histoire d'Or SAS Apax Partners LLP 605 8.1 United Kingdom 02 Jun 10 Net-A-Porter Ltd Cie Financiere Richemont SA 394 50.4 France 12 Sep 08 Leon de Bruxelles SA Eurazeo 53 8.0 United Kingdom 28 Jun 07 Alliance Boots Holdings Ltd KKR & Co LP 17,808 30.8
Source: Company Filings, Bloomberg, Thomson Reuters, Fitch
Retail Market Multiples
Company Fitch IDR 2006 2007 2008 2009 2010 2011 2012 2013 2014 2015 1H16
Kingfisher Plc BBB 11.21 7.27 9.82 6.18 6.73 6.14 7.13 8.68 8.57 9.18 9.18 Marks & Spencer Group Plc BBB- 9.76 5.72 5.30 6.32 5.53 6.44 6.84 7.76 8.42 7.25 7.25 Dufry AG BB- 13.65 9.62 5.95 7.89 12.45 10.95 10.33 14.15 15.30 18.44 17.85 Median 11.21 7.27 5.95 6.32 6.73 6.44 7.13 8.68 8.57 9.18 9.18
n.a.: Not applicable Source: Bloomberg, Thomson Reuters, Fitch
6.7
5.36.0 5.9 6.0
6.97.8 7.7
8.28.2
2.63.2 2.8
2.2 2.4 2.4 2.0 2.0 2.22.8
0
2
4
6
8
10
2007 2008 2009 2010 2011 2012 2013 2014 2015 1H16
Market Multiple and Total Leverage Ratio
EV-Multiple Leverage Median
Source: Bloomberg, Thomson Reuters, Fitch
(x)
11.3
8.0
12.9
8.39.0
7.08.0
10.4
8.6
0
2
4
6
8
10
12
14
2007 2008 2009 2010 2011 2012 2013 2014 2015 1H16
Transaction Multiple
EV-Multiple Median
Source: Bloomberg, Thomson Reuters, Fitch
(x)

Leveraged Finance
European Leveraged Finance Multiple EV-aluator
October 2016 21
Technology
Select Transactions
Country Completion date Target Buyer
Transaction value (EURm)
EBITDA multiple (x)
Ireland 23 Feb 16 King Digital Entertainment Plc Activision Blizzard Inc 4,428 6.6 United Kingdom 19 Nov 15 Innovation Group PLC Carlyle Group LP/The 592 16.4 Germany 29 Apr 15 Senvion SE Centerbridge Capital Partners LLC 1,000 8.4 Netherlands 31 Mar 15 Exact Holding NV Apax Partners LLP 721 15.2 United Kingdom Mar 15 Advanced Computer Software Group PLC Vista Equity Partners LLC 893 10.3 Germany 22 Apr 14 Unit4 NV Advent International Corp 1,257 11.5 Germany 23 Dec 13 P&I Personal & Informatik AG HgCapital LLP 316 14.1 Germany 01 Jun 12 Misys Ltd Vista Equity Partners LLC 1,584 14.6
Source: Company Filings, Bloomberg, Thomson Reuters, Fitch
Technology Market Multiples Company Fitch IDR 2006 2007 2008 2009 2010 2011 2012 2013 2014 2015 1H16
Accenture Plc A+ 10.28 9.64 7.76 6.25 6.15 8.16 7.96 8.72 9.93 11.31 13.62 Siemens AG A 10.64 10.75 8.00 7.14 7.54 6.05 7.94 10.57 10.12 9.64 11.49 TE Connectivity A- n.a. 8.83 5.81 n.a. 6.81 5.95 7.76 10.63 10.77 9.98 9.94 ABB LTD A- 11.92 13.16 5.48 7.85 9.94 7.41 9.40 11.03 9.14 9.84 11.50 ASML Holding NV BBB+ 8.06 9.21 12.42 n.a. 8.11 6.33 13.11 21.98 24.17 17.75 21.95 Ericsson LM BBB+ 9.93 6.80 6.11 8.17 7.52 5.85 5.31 7.58 9.66 7.10 6.01 Relx NV BBB+ 13.41 13.34 11.40 10.29 9.64 8.83 9.43 12.02 13.54 14.23 14.23 Stmicroelectronics NV BBB- 6.66 5.94 4.12 27.01 5.16 3.74 n.a. 14.72 6.22 6.59 5.58 Nokia Corporation BB+ 9.03 10.63 6.15 10.23 6.01 20.02 15.07 16.62 10.65 8.51 14.58 Median 10.28 10.13 6.96 9.20 7.53 6.87 9.40 11.53 10.38 9.91 12.56
n.a.: Not applicable Source: Bloomberg, Thomson Reuters, Fitch
9.7
6.1
10.2
7.5 7.2
9.4
11.410.6 10.3
11.5
1.8 2.02.9
1.7 1.8 1.9 1.7 2.0 1.9 2.0
0
2
4
6
8
10
12
14
2007 2008 2009 2010 2011 2012 2013 2014 2015 1H16
Market Multiple and Total Leverage Ratio
EV-Multiple Leverage Median
Source: Bloomberg, Thomson Reuters, Fitch
(x)
11.9
9.6
7.2
9.0
10.8
9.411.0
13.1
15.2
7.3
0
2
4
6
8
10
12
14
16
2007 2008 2009 2010 2011 2012 2013 2014 2015 1H16
Transaction Multiple
EV-Multiple Median
Source: Bloomberg, Thomson Reuters, Fitch
(x)
Leveraged Finance
European Leveraged Finance Multiple EV-aluator
October 2016 22
Telecom and Cable
Select Transactions
Country Completion date Target Buyer
Transaction value (EURm)
EBITDA multiple (x)
United Kingdom 29 Jan 16 EE Ltd BT Group PLC 15,720 9.0 Netherlands 22 Dec 14 Ziggo NV Liberty Global PLC 8,100 11.4 France 27 Nov 14 Societe Francaise du Radiotelephone SA Altice SA 13,500 5.3 Switzerland 29 Feb 12 Orange Communications SA Apax Partners LLP 1,497 5.7 Poland 09 Nov 11 Polkomtel Sp zoo Spartan Capital Holdings Sp zoo 4,548 6.4
Source: Company Filings, Bloomberg, Thomson Reuters, Fitch
Telecom and Cable Market Multiples Company Fitch's IDR 2006 2007 2008 2009 2010 2011 2012 2013 2014 2015 1H16
Telia Company AB A- 8.67 10.21 7.18 8.04 7.78 7.39 7.22 8.68 12.15 10.62 9.53 Vodafone Group plc BBB+ 6.97 8.04 11.56 9.15 14.52 8.00 30.50 21.82 7.69 8.86 8.53 Deutsche Telekom AG BBB+ 6.45 6.52 5.10 4.79 5.36 4.29 4.53 6.63 6.40 7.47 5.97 Telefonica SA BBB 7.03 6.77 5.31 5.92 5.36 6.11 4.94 5.52 8.03 9.81 9.81 BT Group plc BBB+ 5.79 4.56 5.75 3.98 4.32 4.62 5.27 6.41 7.06 8.60 8.60 Orange S.A. BBB+ 5.14 5.49 5.00 5.65 5.34 4.53 5.18 4.94 6.18 6.36 5.87 Koninklijke KPN NV BBB 5.96 6.71 5.67 5.76 5.27 4.92 5.36 6.85 5.84 8.77 n.a. TDC A/S BBB- 7.52 7.72 7.84 8.82 7.59 5.96 5.88 7.27 8.52 11.92 13.10 Telecom Italia SPA BBB- 6.38 6.78 5.42 4.97 4.77 10.69 7.17 6.17 5.44 7.88 6.91 Rostelecom PJSC BBB- n.a. n.a. 3.39 1.85 2.29 5.14 4.39 4.48 4.13 4.12 3.90 Sky plc BBB- 12.73 10.14 8.89 9.43 11.26 8.13 8.47 9.69 13.40 n.a. 15.47 VimpelCom Ltd BB+ n.a. n.a. n.a. n.a. 4.93 5.18 4.17 8.54 5.28 3.99 4.90 Tattelecom PJSC BB n.a. 4.99 2.10 2.56 2.60 2.62 2.14 1.95 2.05 2.92 2.92 Median 6.71 6.77 5.54 5.71 5.34 5.18 5.27 6.63 6.40 8.24 7.72
n.a.: Not applicable Source: Bloomberg, Thomson Reuters, Fitch
7.6
5.3 5.7 5.7 5.7 5.76.6
7.4 7.77.7
2.1 2.3 2.2 2.1 2.2 2.3 2.63.0 2.8 2.9
0
2
4
6
8
10
2007 2008 2009 2010 2011 2012 2013 2014 2015 1H16
Market Multiple and Total Leverage Ratio
EV-Multiple Leverage Median
Source: Bloomberg, Thomson Reuters, Fitch
(x)
12.7
9.68.7
6.54.9
3.4
5.3
11.6
14.1
0
2
4
6
8
10
12
14
16
2007 2008 2009 2010 2011 2012 2013 2014 2015 1H16
Transaction Multiple
EV-Multiple Median
Source: Bloomberg, Thomson Reuters, Fitch
(x)

Leveraged Finance
European Leveraged Finance Multiple EV-aluator
October 2016 23
Transportation
Select Transactions
Country Completion date Target Buyer
Transaction value (EURm)
EBITDA multiple (x)
France 08 Jun 15 Norbert Dentressangle SA XPO Logistics Inc 1,984 9.0 Norway 11 Feb 15 Hurtigruten ASA Silk Bidco AS 620 7.6 Netherlands 03 Nov 14 HES Beheer NV Hestya Energy BV 479 7.5 United Kingdom 28 Jul 14 ACM Shipping PLC Braemar Shipping Services PLC 56 17.6 Norway 04 Jul 14 Solvtrans ASA Silver Holdings AS 170 9.2 Germany 05 Nov 13 Scandlines GmbH 3i Group PLC 165 7.5 Denmark 05 Apr 13 Unifeeder AS Nordic Capital Svenska AB n.a. 7.0 United Kingdom 28 Feb 13 Stansted Airport Ltd Manchester Airport PLC 1,787 15.9 United Kingdom 31 Aug 10 Arriva PLC Deutsche Bahn AG 2,724 7.4 United Kingdom 08 Dec 09 Marken Ltd Apax Partners LLP n.a. 13.2 United Kingdom 31 Oct 09 Gatwick Airport Ltd Global Infrastructure Partners 1,609 9.1
Source: Company Filings, Bloomberg, Thomson Reuters, Fitch
Transportation Market Multiples Company Fitch IDR 2006 2007 2008 2009 2010 2011 2012 2013 2014 2015 1H16
Aeroports de Paris S.A. A+ 10.83 11.56 8.37 9.30 8.63 7.37 8.62 10.54 11.59 11.35 11.35 Deutsche Post AG BBB+ 23.37 48.45 11.36 10.05 5.84 4.81 5.56 8.05 7.93 8.10 7.60 Ryanair Holdings plc BBB+ 14.53 6.40 13.41 8.87 7.51 6.71 8.18 10.27 10.54 9.52 7.30 Stagecoach Group plc BBB 8.38 8.79 5.12 7.18 7.38 5.81 7.89 8.24 7.99 5.72 5.72 National Express Group Plc BBB- 7.03 9.71 5.59 10.13 7.81 5.55 6.94 8.03 8.05 8.38 8.38 First Group plc BBB- 8.52 9.76 5.53 5.64 5.36 3.86 5.52 5.03 4.05 4.34 4.34 Median 8.52 9.71 7.16 9.09 7.51 5.81 7.89 8.24 8.05 8.10 7.60
n.a.: Not applicable Source: Bloomberg, Thomson Reuters, Fitch
9.7
6.77.7
8.6
6.4 7.18.0 8.1 8.3 7.4
3.1 3.1 3.5 3.1 3.4 3.4 3.83.2
3.6 3.9
0
2
4
6
8
10
12
2007 2008 2009 2010 2011 2012 2013 2014 2015 1H16
Market Multiple and Total Leverage Ratio
EV-Multiple Leverage Median
Source: Bloomberg, Thomson Reuters, Fitch
(x)
8.4
10.5
6.9 6.9
13.5
3.9
7.9 8.99.0
6.7
0
2
4
6
8
10
12
14
16
2007 2008 2009 2010 2011 2012 2013 2014 2015 1H16
Transaction Multiple
EV-Multiple Median
Source: Bloomberg, Thomson Reuters, Fitch
(x)
Leveraged Finance
European Leveraged Finance Multiple EV-aluator
October 2016 24
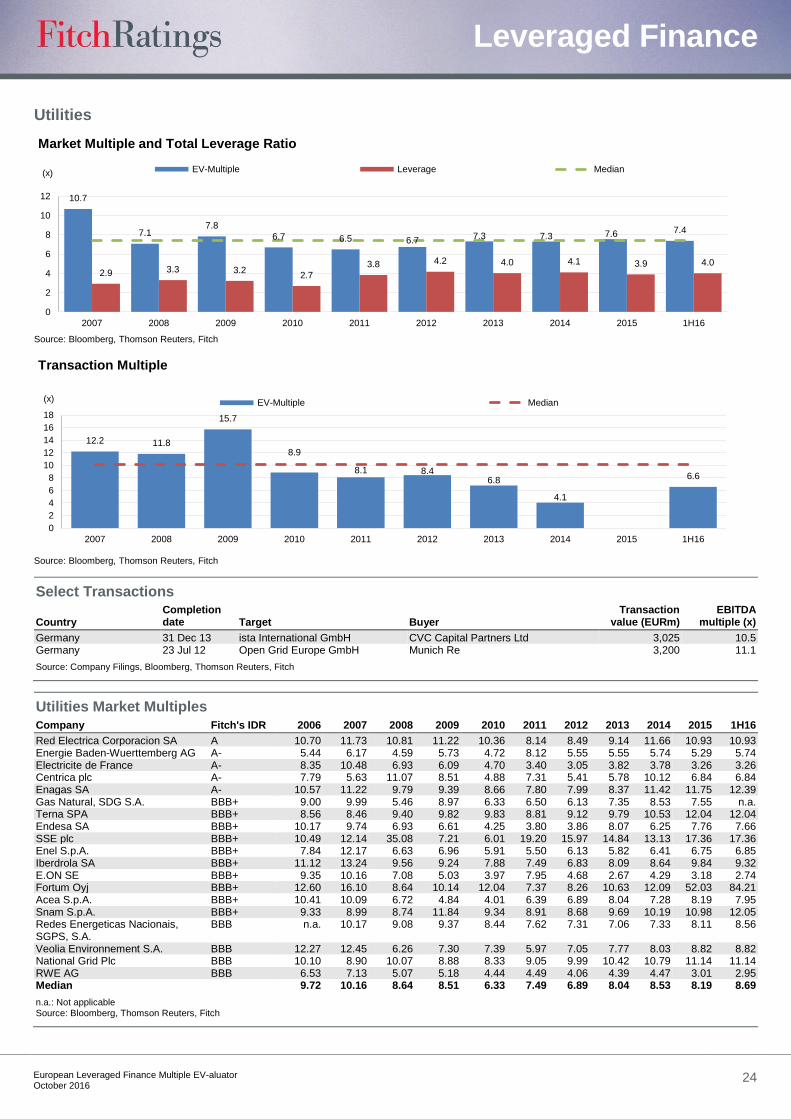
Utilities
Select Transactions
Country Completion date Target Buyer
Transaction value (EURm)
EBITDA multiple (x)
Germany 31 Dec 13 ista International GmbH CVC Capital Partners Ltd 3,025 10.5 Germany 23 Jul 12 Open Grid Europe GmbH Munich Re 3,200 11.1
Source: Company Filings, Bloomberg, Thomson Reuters, Fitch
Utilities Market Multiples
Company Fitch's IDR 2006 2007 2008 2009 2010 2011 2012 2013 2014 2015 1H16
Red Electrica Corporacion SA A 10.70 11.73 10.81 11.22 10.36 8.14 8.49 9.14 11.66 10.93 10.93 Energie Baden-Wuerttemberg AG A- 5.44 6.17 4.59 5.73 4.72 8.12 5.55 5.55 5.74 5.29 5.74 Electricite de France A- 8.35 10.48 6.93 6.09 4.70 3.40 3.05 3.82 3.78 3.26 3.26 Centrica plc A- 7.79 5.63 11.07 8.51 4.88 7.31 5.41 5.78 10.12 6.84 6.84 Enagas SA A- 10.57 11.22 9.79 9.39 8.66 7.80 7.99 8.37 11.42 11.75 12.39 Gas Natural, SDG S.A. BBB+ 9.00 9.99 5.46 8.97 6.33 6.50 6.13 7.35 8.53 7.55 n.a. Terna SPA BBB+ 8.56 8.46 9.40 9.82 9.83 8.81 9.12 9.79 10.53 12.04 12.04 Endesa SA BBB+ 10.17 9.74 6.93 6.61 4.25 3.80 3.86 8.07 6.25 7.76 7.66 SSE plc BBB+ 10.49 12.14 35.08 7.21 6.01 19.20 15.97 14.84 13.13 17.36 17.36 Enel S.p.A. BBB+ 7.84 12.17 6.63 6.96 5.91 5.50 6.13 5.82 6.41 6.75 6.85 Iberdrola SA BBB+ 11.12 13.24 9.56 9.24 7.88 7.49 6.83 8.09 8.64 9.84 9.32 E.ON SE BBB+ 9.35 10.16 7.08 5.03 3.97 7.95 4.68 2.67 4.29 3.18 2.74 Fortum Oyj BBB+ 12.60 16.10 8.64 10.14 12.04 7.37 8.26 10.63 12.09 52.03 84.21 Acea S.p.A. BBB+ 10.41 10.09 6.72 4.84 4.01 6.39 6.89 8.04 7.28 8.19 7.95 Snam S.p.A. BBB+ 9.33 8.99 8.74 11.84 9.34 8.91 8.68 9.69 10.19 10.98 12.05 Redes Energeticas Nacionais, SGPS, S.A.
BBB n.a. 10.17 9.08 9.37 8.44 7.62 7.31 7.06 7.33 8.11 8.56
Veolia Environnement S.A. BBB 12.27 12.45 6.26 7.30 7.39 5.97 7.05 7.77 8.03 8.82 8.82 National Grid Plc BBB 10.10 8.90 10.07 8.88 8.33 9.05 9.99 10.42 10.79 11.14 11.14 RWE AG BBB 6.53 7.13 5.07 5.18 4.44 4.49 4.06 4.39 4.47 3.01 2.95 Median 9.72 10.16 8.64 8.51 6.33 7.49 6.89 8.04 8.53 8.19 8.69
n.a.: Not applicable Source: Bloomberg, Thomson Reuters, Fitch
10.7
7.17.8
6.7 6.5 6.77.3 7.3 7.6 7.4
2.9 3.3 3.22.7
3.8 4.2 4.0 4.1 3.9 4.0
0
2
4
6
8
10
12
2007 2008 2009 2010 2011 2012 2013 2014 2015 1H16
Market Multiple and Total Leverage Ratio
EV-Multiple Leverage Median
Source: Bloomberg, Thomson Reuters, Fitch
(x)
12.2 11.8
15.7
8.9
8.1 8.46.8
4.1
6.6
0
2
4
6
8
10
12
14
16
18
2007 2008 2009 2010 2011 2012 2013 2014 2015 1H16
Transaction Multiple
EV-Multiple Median
Source: Bloomberg, Thomson Reuters, Fitch
(x)

Leveraged Finance
European Leveraged Finance Multiple EV-aluator
October 2016 25
ALL FITCH CREDIT RATINGS ARE SUBJECT TO CERTAIN LIMITATIONS AND DISCLAIMERS. PLEASE READ THESE LIMITATIONS AND DISCLAIMERS BY FOLLOWING THIS LINK: HTTPS://FITCHRATINGS.COM/UNDERSTANDINGCREDITRATINGS. IN ADDITION, RATING DEFINITIONS AND THE TERMS OF USE OF SUCH RATINGS ARE AVAILABLE ON THE AGENCY'S PUBLIC WEB SITE AT WWW.FITCHRATINGS.COM. PUBLISHED RATINGS, CRITERIA, AND METHODOLOGIES ARE AVAILABLE FROM THIS SITE AT ALL TIMES. FITCH'S CODE OF CONDUCT, CONFIDENTIALITY, CONFLICTS OF INTEREST, AFFILIATE FIREWALL, COMPLIANCE, AND OTHER RELEVANT POLICIES AND PROCEDURES ARE ALSO AVAILABLE FROM THE CODE OF CONDUCT SECTION OF THIS SITE. FITCH MAY HAVE PROVIDED ANOTHER PERMISSIBLE SERVICE TO THE RATED ENTITY OR ITS RELATED THIRD PARTIES. DETAILS OF THIS SERVICE FOR RATINGS FOR WHICH THE LEAD ANALYST IS BASED IN AN EU-REGISTERED ENTITY CAN BE FOUND ON THE ENTITY SUMMARY PAGE FOR THIS ISSUER ON THE FITCH WEBSITE.
Copyright © 2016 by Fitch Ratings, Inc., Fitch Ratings Ltd. and its subsidiaries. 33 Whitehall Street, NY, NY 10004. Telephone: 1-800-753-4824, (212) 908-0500. Fax: (212) 480-4435. Reproduction or retransmission in whole or in part is prohibited except by permission. All rights reserved. In issuing and maintaining its ratings and in making other reports (including forecast information), Fitch relies on factual information it receives from issuers and underwriters and from other sources Fitch believes to be credible. Fitch conducts a reasonable investigation of the factual information relied upon by it in accordance with its ratings methodology, and obtains reasonable verification of that information from independent sources, to the extent such sources are available for a given security or in a given jurisdiction. The manner of Fitch’s factual investigation and the scope of the third-party verification it obtains will vary depending on the nature of the rated security and its issuer, the requirements and practices in the jurisdiction in which the rated security is offered and sold and/or the issuer is located, the availability and nature of relevant public information, access to the management of the issuer and its advisers, the availability of pre-existing third-party verifications such as audit reports, agreed-upon procedures letters, appraisals, actuarial reports, engineering reports, legal opinions and other reports provided by third parties, the availability of independent and competent third-party verification sources with respect to the particular security or in the particular jurisdiction of the issuer, and a variety of other factors. Users of Fitch’s ratings and reports should understand that neither an enhanced factual investigation nor any third-party verification can ensure that all of the information Fitch relies on in connection with a rating or a report will be accurate and complete. Ul timately, the issuer and its advisers are responsible for the accuracy of the information they provide to Fitch and to the market in offering documents and other reports. In issuing its ratings and its reports, Fitch must rely on the work of experts, including independent auditors with respect to financial statements and attorneys with respect to legal and tax matters. Further, ratings and forecasts of financial and other information are inherently forward-looking and embody assumptions and predictions about future events that by their nature cannot be verified as facts. As a result, despite any verification of current facts, ratings and forecasts can be affected by future events or conditions that were not anticipated at the time a rating or forecast was issued or affirmed.
The information in this report is provided “as is” without any representation or warranty of any kind, and Fitch does not represent or warrant that the report or any of its contents will meet any of the requirements of a recipient of the report. A Fitch rating is an opinion as to the creditworthiness of a security. This opinion and reports made by Fitch are based on established criteria and methodologies that Fitch is continuously evaluating and updating. Therefore, ratings and reports are the collective work product of Fitch and no individual, or group of individuals, is solely responsible for a rating or a report. The rating does not address the risk of loss due to risks other than credit risk, unless such risk is specifically mentioned. Fitch is not engaged in the offer or sale of any security. All Fitch reports have shared authorship. Individuals identified in a Fitch report were involved in, but are not solely responsible for, the opinions stated therein. The individuals are named for contact purposes only. A report providing a Fitch rating is neither a prospectus nor a substitute for the information assembled, verified and presented to investors by the issuer and its agents in connection with the sale of the securities. Ratings may be changed or withdrawn at any time for any reason in the sole discretion of Fitch. Fitch does not provide investment advice of any sort. Ratings are not a recommendation to buy, sell, or hold any security. Ratings do not comment on the adequacy of market price, the suitability of any security for a particular investor, or the tax-exempt nature or taxability of payments made in respect to any security. Fitch receives fees from issuers, insurers, guarantors, other obligors, and underwriters for rating securities. Such fees generally vary from US$1,000 to US$750,000 (or the applicable currency equivalent) per issue. In certain cases, Fitch will rate all or a number of issues issued by a particular issuer, or insured or guaranteed by a particular insurer or guarantor, for a single annual fee. Such fees are expected to vary from US$10,000 to US$1,500,000 (or the applicable currency equivalent). The assignment, publication, or dissemination of a rating by Fitch shall not constitute a consent by Fitch to use its name as an expert in connection with any registration statement filed under the United States securities laws, the Financial Services and Markets Act of 2000 of the United Kingdom, or the securities laws of any particular jurisdiction. Due to the relative efficiency of electronic publishing and distribution, Fitch research may be available to electronic subscribers up to three days earlier than to print subscribers.
For Australia, New Zealand, Taiwan and South Korea only: Fitch Australia Pty Ltd holds an Australian financial services license (AFS license no. 337123) which authorizes it to provide credit ratings to wholesale clients only. Credit ratings information published by Fitch is not
intended to be used by persons who are retail clients within the meaning of the Corporations Act 2001.