Leveled Literacy Intervention - Heinemann
24
Elizabeth Ward Ph.D., Data Collection Manager (working under the guidance of Irene C. Fountas and Gay Su Pinnell) Research and Data Collection Project 2009-2010 HEINEMANN Leveled Literacy Intervention ©2011 HEINEMANN
Transcript of Leveled Literacy Intervention - Heinemann

Elizabeth Ward Ph.D., Data Collection Manager (working under the guidance of Irene C. Fountas and Gay Su Pinnell)
Research and Data Collection Project 2009-2010
HEInEMann
Leveled Literacy Intervention
©2011 Heinemann
LLI_2009 DataCollReport_FEB20_2013.indd 1 2/21/13 12:46 PM

LLI_2009 DataCollReport_FEB20_2013.indd 2 2/21/13 12:46 PM

1
Contents
Executive summary 2
Introduction 3
What is Leveled Literacy Intervention? 3
Results for all LLI study participants 4
Student characteristics
Teacher characteristics
Participation/delivery rates
How were students’ progress levels assessed?
To what extent did all participating LLI students progress?
Results for students who received LLI as recommended 7
Student characteristics
Participation/delivery rates
To what extent did students progress when they participated in LLI as recommended by the developers?
Grade-level attainment
Key findings 9
Conclusions 9
Illustrations
Reading Progress for English Language Learner LLI students 10
Student Characteristics 10
Results – Reading Progress 10
LLI Groups and Student attendance
Reading Progress
Grade Level attainment
Key findings 14
Conclusions 14
Illustrations
Reading Progress for Special Education LLI students 15
Student Characteristics 15
Results – Reading Progress 15
LLI Groups and Student attendance
Reading Progress
Key findings 19
Conclusions 19
Illustrations
Table 1Table 2Table 3Table 4
Chart 1Chart 2Chart 3
Table 1Table 2Table 3Table 4
Chart 1Chart 2
Table 1Table 2Table 3Table 4Table 5Table 6
Table 7Table 8Table 9Chart 1Chart 2Chart 3
LLI_2009 DataCollReport_FEB20_2013.indd 1 2/21/13 12:46 PM

2
This report summarizes the results of a descriptive study of Leveled Literacy Intervention (LLI) that took place during the 2009-10 school year. The study, commissioned by Heinemann, a publisher of professional resources and a provider of educational services for teachers, was conducted by Elizabeth Ward, Ph.D. under the supervision of Irene C. Fountas and Gay Su Pinnell.
Leveled Literacy Intervention is a supplementary instructional system designed to reduce the gap between struggling students’ current instructional reading levels and their expected instructional reading levels within grades K–2. Developed by Irene Fountas and Gay Su Pinnell and published by Heinemann, the LLI system includes reading, writing, and word study, each used together and systematically in connection with increasingly difficult levels of text.
For this study, benchmark assessment data were collected from 4,881 students enrolled in Leveled Literacy Intervention. The students represented a variety of geographic areas across the U.S. and Canada and were a varied group demographically.
On average, the total sample of 4,881 LLI students demonstrated reading progress over the course of their participation comparable to the reading progress students are expected to achieve over eight months during the school year. The students achieved this progress in an average of 17 weeks, or 4.2 months, of LLI instruction. Also, 68% of the students demonstrated an instructional reading level at least three levels higher than their pre-LLI level and 12.5% raised their reading skills seven or more levels.
Analyses were also conducted for a subset of the students who received full LLI intervention implemented according to the guidelines recommended by the developers. These students achieved greater gains than the sample as a whole. On average, these 1,118 students demonstrated reading progress comparable to the reading progress students are expected to achieve over an average of almost ten months during the school year. The students achieved this progress in an average of 21.1 weeks, or 5.3 months, of LLI instruction. Also, 79.2 of these students were within two text reading levels of grade-level expectation when their LLI instruction ended and 64.8% were at or within one text reading level of grade-level expectation.
These results suggest that Leveled Literacy Intervention works as an effective short-term measure to advance the ability levels of struggling readers who demonstrate below-level performance.
ReseaRCh and data ColleCtion RepoRt summaRy
Leveled Literacy Intervention
LLI_2009 DataCollReport_FEB20_2013.indd 2 2/21/13 12:46 PM

3
This report summarizes the results of a study of Leveled Literacy Intervention that took place during the 2009–10 school year with 4,881 students across the US and Canada. The study, commissioned by Heinemann, a publisher of professional resources and a provider of educational services for teachers, kindergarten through college, was conducted by Elizabeth Ward, LLI Research and Data Collection Manager.
This introduction describes Leveled Literacy Intervention’s goals, design, contents, and instructional structure. The findings section that follows offers two analyses: first, a summary of the impact of LLI on all of the participating students, and second, its impact on a subset of the students who received full LLI intervention as recommended by the developers. The report concludes with a listing of key findings and conclusions.
What Is Leveled Literacy Intervention? Leveled Literacy Intervention is a supplementary instructional system designed to reduce the gap between struggling students’ current instructional reading levels and their expected instructional reading levels within grades K–2.
Developed by Irene Fountas and Gay Su Pinnell and published by Heinemann, the LLI system includes reading, writing, and word study, each used together and systematically in connection with increasingly difficult levels of text. LLI serves the lowest-achieving students who need intensive support to achieve grade-level competency and are not receiving another supplementary intervention. Each lesson in the LLI system also provides specific suggestions for supporting English language learners who are selected for the program.
The LLI system features a collection of new, carefully leveled books that provide enough support, along with a small amount of challenge, so that a reader can learn from the text and make small steps toward grade-level goals. LLI defines difficulty according to the Fountas and Pinnell Text Level Gradient™, ranging from A (the easiest texts) to Z (the most difficult). To date, three LLI systems have been created:
OranGE—for kindergarten, levels A to C (70 titles);
GREEn—for grade 1, levels A to J (110 titles); and
BLUE—for grade 2, levels C to n (120 titles).
LLI provides 14 to 20 weeks of daily, intensive reading lessons beyond classroom service. In groups of three, students participate in daily 30-minute literacy lessons taught by an LLI-trained teacher. The recommended small-group size of three allows teachers to observe students closely and to differentiate their instructional response according to students’ strengths and needs. School districts may increase group size depending on resources, but a commitment to five lessons per week and maintaining a teacher-student ratio of 1:3 are highly recommended for the strongest outcomes.
To identify students for LLI and to measure student progress, teachers use the Fountas & Pinnell Benchmark Assessment System and other reading assessments to evaluate students at the program’s entry and exit points. Students are released if assessment shows that they have reached the targeted grade level. If they have made progress but not yet met grade-level expectations, students might receive additional LLI lessons or a different intervention, such as individual tutoring.
Some students who are taken into the intervention may have achievement levels more than a year below grade level. Though grade-level performance may not be achieved in the short term, steady progress may warrant longer-term service if resources allow.
intRoduCtion
LLI_2009 DataCollReport_FEB20_2013.indd 3 2/21/13 12:46 PM

4
Student characteristicsA total of 4,881 kindergarten through grade 5 students from 238 schools in 34 sites across 19 states and provinces in the United States and Canada participated in the study. The sites include public school districts and individual public, charter, and private schools. They represent urban, suburban, and rural communities. A breakdown of the geographic areas represented is presented in Table 1.
Among the LLI students, 57.4% were male and 41.6% were female; 48.4% were white, 23.4% were Hispanic, 16.6% were black, 2.3% were Asian/Pacific Island, and 2.1% were multiracial. nineteen percent of the children were English language learners. Table 3 provides a summary of the LLI student sample size by grade. Table 4 summarizes student demographics.
Of the LLI students, 10.2% (n = 496) had an individualized education plans (IEPs) that mandated that they receive support for reading and 14.2% (n = 692) had an IEP for other support services. Reading Recovery® (RR) services were provided to 8.4% (n = 410) of the students before they entered LLI. Students for whom RR attendance rates were available received an average of 67.2 RR lessons (n = 236, range: 6-120, SD = 17.5) and 3.1% (n = 152) successfully exited Reading Recovery® prior to receiving LLI lessons.
Teacher characteristicsA total of 487 teachers took part in the study. The LLI system was new to most of those teachers, who were trained (usually in their district) by a variety of sources, including district trainers and consultants provided by Heinemann, The Ohio State University, and Lesley University. On average, teachers received 20.2 hours, or 2.5 days, of training (range: 0-80, SD = 15.4). See Table 2 for details on teacher training.
Results foR all LLI study paRtiCipants
Northeast USMid-Atlantic USSouthwest USSoutheast USMidwest USCanadaPlains States US
Geographic Area % of Students
37.7% (n=1,840)19.8% (n=965)13.7% (n=668)12.5% (n=609)9.3% (n=454)3.8% (n=184)3.3% (n=161)
Distribution of LLI Students (N = 4,881)
Table 1. Geographic Areas represented in LLI Student Data
DistrictHeinemannLesley UniversityHeinemann and DistrictSelf-TaughtDVD/ManualOhio State UniversityOther
Training Source % of Teachers38.0% (n=185)12.1% (n=59)11.1% (n=54)7.2% (n=35)1.6% (n=8)1.8% (n=9)1.6% (n=8)4.1% (n=20)
Table 2 Source of LLI Teacher Training
Kindergarten
11.2% (n=545)
1st Grade
47.4% (n=2,313)
2nd Grade
24.5% (n=1,195)
3rd Grade
11.3% (n=550)
4th Grade
3.7% (n=180)
5th Grade
1.5% (n=71)
Student Sample Size
Table 3 Student Sample Size
% Male
57.4% (n=2,801)
% Female
41.6% (n=2,030)
% White
48.4% (n=2,361)
% Hispanic
23.4% (n=1,140)
% Black
16.6% (n=812)
% Asian/ Paci�c Island
2.3% (n=111)
% Multi-Racial
2.1% (n=104)
Student Demographics% Free/
Reduced Lunch51.0%
(n=2,488)
% English Language Learners
19% (n=925)
Table 4 Student Demographics
LLI_2009 DataCollReport_FEB20_2013.indd 4 2/21/13 12:46 PM

5
Participation/delivery ratesLLI is designed to be delivered in a group of three students with one teacher, five days per week. However, in this study, delivery varied according to school and district limitations. Overall, the LLI groups comprised between one and six students (M = 3.0, SD = .6) and the groups met between one and five days a week (M = 4.6, SD = .6) for 30 minutes per session (see Table 6). Also, 93.9% of the LLI students received additional small-group reading instruction in their classrooms (range: 1-8, M = 4.1 lessons per week, SD = 1.1).
The students received LLI for an average of 17.0 weeks (range: 1-39, SD = 7.8) and 59.9 lessons (range: 2-171, SD = 29.2) (see Table 6). However, many students were not able to receive the full intervention because the school year ended during the study. Their teachers indicated that they would receive more LLI instruction the next year.
How were students’ reading progress levels assessed?
The data were collected for LLI students only. no control group was identified and assessed and therefore, the LLI student growth was compared to Fountas and Pinnell grade level criteria to assess the group’s progress. Reading progress was determined by looking at students’ pre- and post-LLI instructional reading levels (ranging from pre-A to Z) based on teacher reports of results from the Fountas & Pinnell Benchmark
Assessment System or reading records. In some cases, levels were determined by converting the results from other assessments (such as the Dra or Dra2, the Reading Recovery® Observation Survey with Running Records, and the Rigby® Benchmark) to F&P levels.
The levels were then converted to time equivalent (TE) scores. TE scores represent the number of months students, with typical progression, should have completed when they demonstrate the reading behaviors associated with the Fountas and Pinnell levels. The scores represent the usual ten-month school year. If a level is expected to be reached over more than one month, the TE score reflects the middle point of the expected band of time. See Table 5. For example, level C is expected at months eight, nine, and ten during kindergarten and the time equivalent for level C is month nine.
Finally, gain is determined. The difference between the entry and exit TE score reflects the gain (number of months of progress) the student made between entry and exit from LLI. For example, a student who enters LLI at level A and exits at level C has progressed from the expected level at the fourth month of kindergarten to the expected level at the ninth month of kindergarten. The student’s reading gain is five months.
Table 5 Fountas and Pinnell Instructional Level Expectations for Reading and Time Equivalent Scores (months) for each Level.
Kindergarten
1st Grade
2nd Grade
3rd Grade
4th Grade
5th Grade
Kindergarten
2nd Grade
4th Grade
Month 1
Pre-ATE=2C/D
TE=11I/J
TE=21M/N
TE=31P/Q
TE=41S/T
TE=51
Month 2
Pre-ATE=2D
TE=12J
TE=22.5N
TE=33Q
TE=43T
TE=53
Month 3
Pre-ATE=2E
TE=13J
TE=22.5N
TE=33Q
TE=43T
TE=53
Month 4
ATE=4E/F
TE=14J/K
TE=24N
TE=33Q
TE=43T
TE=53
Month 5
A/BTE=5F
TE=15K
TE=25O
TE=36R
TE=46U
TE=56
Month 6
BTE=6.5G
TE=16K/L
TE=26O
TE=36R
TE=46U
TE=56
Month 7
BTE=6.5G/H
TE=17L
TE=27.5O
TE=36R
TE=46U
TE=56
Month 8
CTE=9H
TE=18L
TE=27.5P
TE=39S
TE=49V
TE=59
Month 9
CTE=9I
TE=19.5M
TE=29.5P
TE=39S
TE=49V
TE=59
Month 10
CTE=9I
TE=19.5M
TE=29.5P
TE=39S
TE=49V
TE=59
Fountas and Pinnell Instructional Level Expectations for Reading and Time Equivalent Scores (months) for each Level
LLI_2009 DataCollReport_FEB20_2013.indd 5 2/21/13 12:46 PM
6
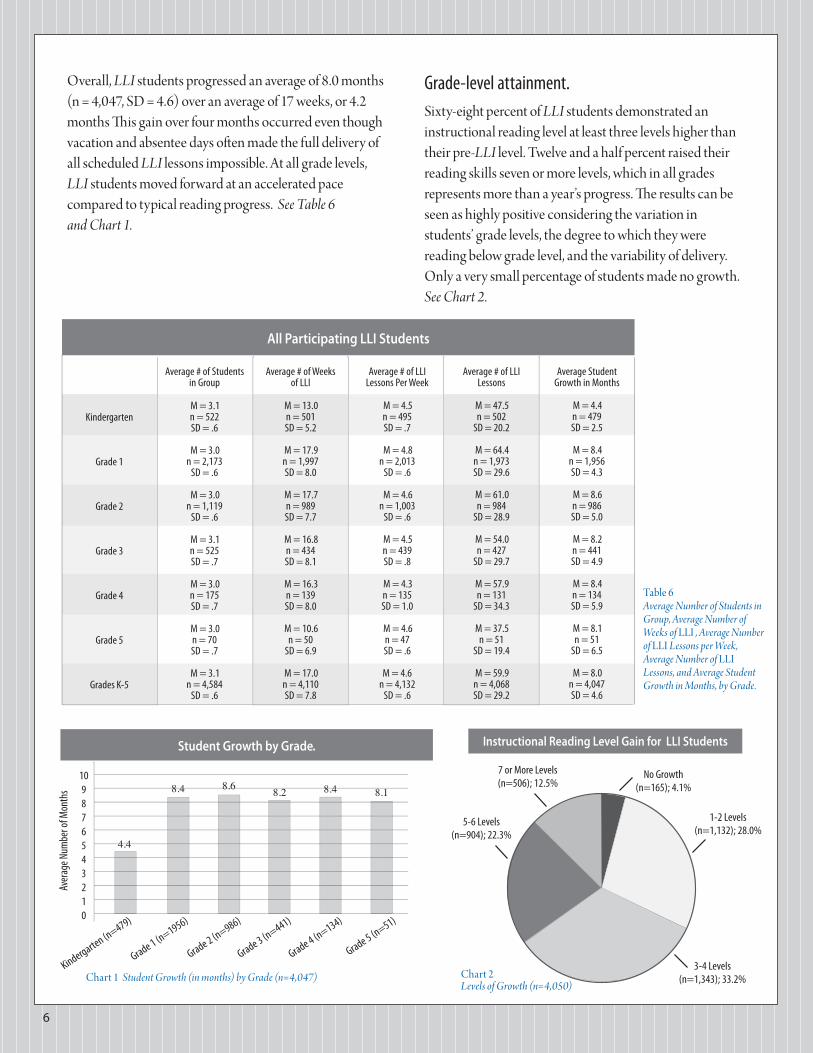
Overall, LLI students progressed an average of 8.0 months (n = 4,047, SD = 4.6) over an average of 17 weeks, or 4.2 months This gain over four months occurred even though vacation and absentee days often made the full delivery of all scheduled LLI lessons impossible. At all grade levels, LLI students moved forward at an accelerated pace compared to typical reading progress. See Table 6 and Chart 1.
Grade-level attainment. Sixty-eight percent of LLI students demonstrated an instructional reading level at least three levels higher than their pre-LLI level. Twelve and a half percent raised their reading skills seven or more levels, which in all grades represents more than a year’s progress. The results can be seen as highly positive considering the variation in students’ grade levels, the degree to which they were reading below grade level, and the variability of delivery. Only a very small percentage of students made no growth. See Chart 2.
Chart 1 Student Growth (in months) by Grade (n=4,047)
All Participating LLI Students
Kindergarten
Grade 1
Grade 2
Grade 3
Grade 4
Grade 5
Grades K-5
M = 3.1n = 522SD = .6
M = 3.0n = 2,173
SD = .6
M = 3.0n = 1,119
SD = .6
M = 3.1n = 525SD = .7
M = 3.0n = 175SD = .7
M = 3.0n = 70SD = .7
M = 3.1n = 4,584
SD = .6
M = 13.0n = 501SD = 5.2
M = 17.9n = 1,997SD = 8.0
M = 17.7n = 989SD = 7.7
M = 16.8n = 434SD = 8.1
M = 16.3n = 139SD = 8.0
M = 10.6n = 50
SD = 6.9
M = 17.0n = 4,110SD = 7.8
M = 4.5n = 495SD = .7
M = 4.8n = 2,013
SD = .6
M = 4.6n = 1,003
SD = .6
M = 4.5n = 439SD = .8
M = 4.3n = 135SD = 1.0
M = 4.6n = 47SD = .6
M = 4.6n = 4,132
SD = .6
M = 47.5n = 502
SD = 20.2
M = 64.4n = 1,973SD = 29.6
M = 61.0n = 984
SD = 28.9
M = 54.0n = 427
SD = 29.7
M = 57.9n = 131
SD = 34.3
M = 37.5n = 51
SD = 19.4
M = 59.9n = 4,068SD = 29.2
M = 4.4n = 479SD = 2.5
M = 8.4n = 1,956SD = 4.3
M = 8.6n = 986SD = 5.0
M = 8.2n = 441SD = 4.9
M = 8.4n = 134SD = 5.9
M = 8.1n = 51
SD = 6.5
M = 8.0n = 4,047SD = 4.6
Average # of Students in Group
Average # of Weeks of LLI
Average # of LLI Lessons Per Week
Average # of LLI Lessons
Average Student Growth in Months
Student Growth by Grade.
109876543210
Grade 2 (n=986)
Grade 1 (n=1956)
Kindergarten (n=479)
Grade 3 (n=441)
Grade 4 (n=134)
Grade 5 (n=51)
Instructional Reading Level Gain for LLI Students
No Growth (n=165); 4.1%
1-2 Levels (n=1,132); 28.0%
3-4 Levels (n=1,343); 33.2%
5-6 Levels (n=904); 22.3%
7 or More Levels (n=506); 12.5%
Table 6 Average Number of Students in Group, Average Number of Weeks of LLI , Average Number of LLI Lessons per Week, Average Number of LLI Lessons, and Average Student Growth in Months, by Grade.
Chart 2 Levels of Growth (n=4,050)
4.4
8.4 8.6 8.2 8.4 8.1
aver
age n
umbe
r of M
onth
s
LLI_2009 DataCollReport_FEB20_2013.indd 6 2/21/13 12:46 PM
7
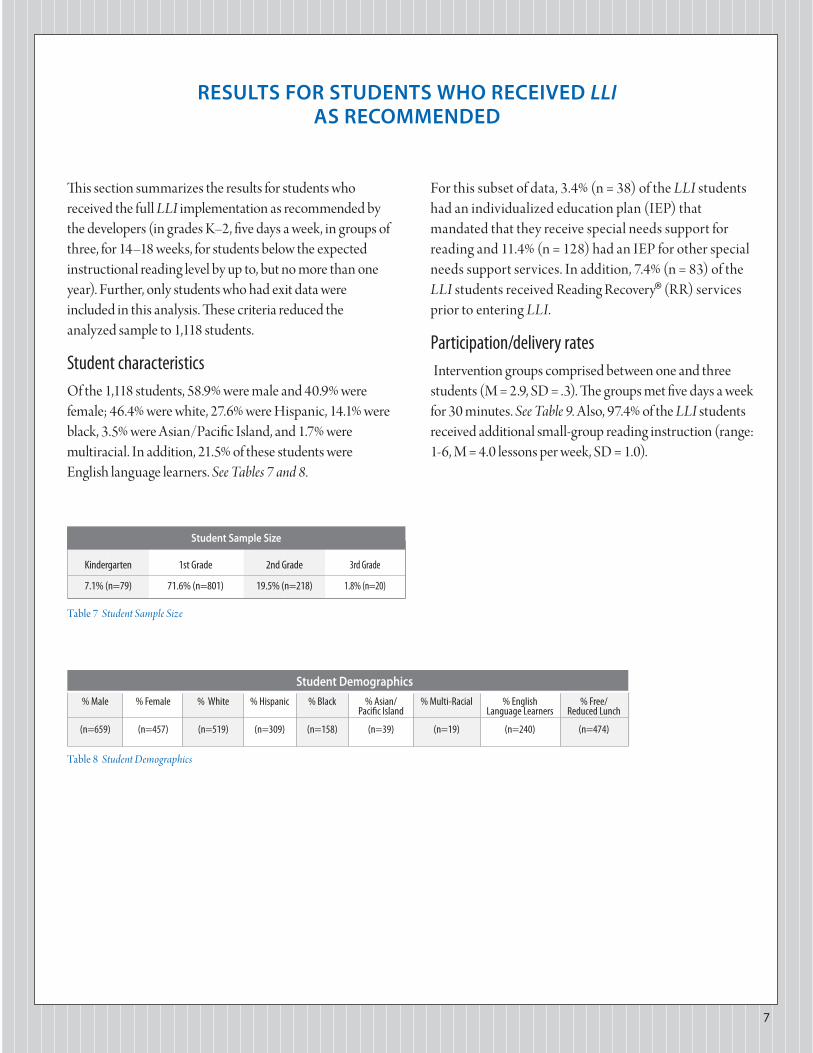
This section summarizes the results for students who received the full LLI implementation as recommended by the developers (in grades K–2, five days a week, in groups of three, for 14–18 weeks, for students below the expected instructional reading level by up to, but no more than one year). Further, only students who had exit data were included in this analysis. These criteria reduced the analyzed sample to 1,118 students.
Student characteristics Of the 1,118 students, 58.9% were male and 40.9% were female; 46.4% were white, 27.6% were Hispanic, 14.1% were black, 3.5% were Asian/Pacific Island, and 1.7% were multiracial. In addition, 21.5% of these students were English language learners. See Tables 7 and 8.
For this subset of data, 3.4% (n = 38) of the LLI students had an individualized education plan (IEP) that mandated that they receive special needs support for reading and 11.4% (n = 128) had an IEP for other special needs support services. In addition, 7.4% (n = 83) of the LLI students received Reading Recovery® (RR) services prior to entering LLI.
Participation/delivery rates Intervention groups comprised between one and three students (M = 2.9, SD = .3). The groups met five days a week for 30 minutes. See Table 9. Also, 97.4% of the LLI students received additional small-group reading instruction (range: 1-6, M = 4.0 lessons per week, SD = 1.0).
Results foR students who ReCeived LLI as ReCommended
% Male
(n=659)
% Female
(n=457)
% White
(n=519)
% Hispanic
(n=309)
% Black
(n=158)
% Asian/ Paci�c Island
(n=39)
% Multi-Racial
(n=19)
Student Demographics% Free/
Reduced Lunch
(n=474)
% EnglishLanguage Learners
(n=240)
Table 7 Student Sample Size
Table 8 Student Demographics
Kindergarten
7.1% (n=79)
1st Grade
71.6% (n=801)
2nd Grade
19.5% (n=218)
3rd Grade
1.8% (n=20)
Student Sample Size
LLI_2009 DataCollReport_FEB20_2013.indd 7 2/21/13 12:46 PM

8
The students participated for an average of 21.1 weeks (range: 10-37, SD = 6.9) and attended an average of 79.8 LLI lessons (range: 50-170, SD = 24.8) (see Table 9). While the LLI teachers for this subset were scheduled to meet with the students five times per week, the average number of lessons (79.8) over 21.1 weeks indicate that holidays and absences made it impossible for the groups to meet this goal (an understandable result given the dynamics of school systems).
To what extent did students progress when they participated in LLI as recommended by the developers?
The students receiving the recommended LLI implementation progressed an average of 9.7 months (n = 1,118, SD = 3.9), over an average of 21.1 weeks, or 5.3 months: a progression of almost ten months in five months’ time. See Table 9.
Grade-level attainmentOverall, 64.8% of students were at or within one text reading level of their expected instructional reading level when their LLI instruction ended and 79.2% were at or within two text reading levels of grade-level expectation. These results indicate accelerated progress even if students only closely approached expected grade-level reading. See Table 5 and Chart 3.
Recommended LLI Implementation Averages
Kindergarten (n=79)
Grade 1 (n=801)
Grade 2 (n=218)
Grade 3 (n=20)
Grades K-3 (n=1,118)
M = 2.8SD = .4
M = 2.9SD = .3
M = 2.8SD = .4
M = 2.8SD = .5
M = 2.9SD = .3
M = 16.9SD = 3.4
M = 21.5SD = 7.1
M = 20.9SD = 6.2
M = 21.7SD = 8.4
M = 21.1SD = 6.9
M = 5.0SD = 0
M = 5.0SD = 0
M = 5.0SD = 0
M = 5.0SD = 0
M = 5.0SD = 0
M = 69.4SD = 11.0
M = 80.7SD = 25.5
M = 78.6SD = 22.1
M = 96.6SD = 42.2
M = 79.8SD = 24.8
M = 5.7SD = 2.7
M = 9.9SD = 3.8
M = 10.6SD = 3.9
M = 9.3SD = 3.6
M = 9.7SD = 3.9
Average # of Students in Group
Average # of Weeks of LLI
Average # of LLI Lessons Per Week
Average # of LLI Lessons
Average Student Growth in Months
Table 9 Average Number of Students in Group, Average Number of Weeks of LLI , Average Number of LLI Lessons per Week, Average Number of LLI Lessons, and Average Student Growth in Months, by Grade
Chart 3 Instructional Reading Level at Entry and Exit
The Percentage of Students Below, At or Above Grade Level at Entry and Exit From LLI
100%90%80%70%60%50%40%30%20%10%0%
61.3%
More than 2 Levels below Expected
Within 2 Levels of Expected Level
Within 1 Levels of Expected Level
At or Above Expected Level
20.8%28.2%
14.4% 10.6%18.2%
0%
46.6%
LLI_2009 DataCollReport_FEB20_2013.indd 8 2/21/13 12:46 PM

9
Key findings• On average, the total sample of 4,881 Leveled Literacy Intervention students demonstrated reading
progress comparable to expected reading progress over eight months during the school year. This progress was achieved during participation in LLI for an average of 17 weeks, or 4.2 months.
• Post-LLI, 68% of the total sample of 4,881 LLI students demonstrated an instructional reading level at least three levels higher than their pre-LLI level and 12.5% raised their reading skills seven or more levels.
• On average, the subset of 1,118 LLI students who received LLI as designed demonstrated reading progress comparable to expected progress over an average of almost ten months. This progress was achieved during participation in LLI for an average of 21.1 weeks, or 5.3 months.
• Post-LLI, 79.2% of the subset of 1,118 LLI students were within two text reading levels of grade-level expectation and 64.8% were at or within one text reading level of grade-level expectation.
ConclusionsThese readers varied widely by geographic area, age, and degree to which they were reading below grade level. The LLI students gained eight months of progress in about 4.2 months, twice the amount of reading progress when compared with typical reading progress over time (Fountas and Pinnell 10-Month Instructional Text Level Goals). At all grade levels, the LLI students moved forward at an accelerated pace.
For the 1,118 students who received full LLI intervention as recommended by the developers, the results were even more positive. They progressed on an average of almost ten months in a little more than five months. At the end of an average of 21.1 weeks, 79.2% were at or within two text reading levels of grade-level expectation.
These results that LLI is an effective short-term intervention to advance the ability levels of struggling readers who demonstrate below-level performance.
LLI_2009 DataCollReport_FEB20_2013.indd 9 2/21/13 12:46 PM

10
HEInEMann
Leveled Literacy Intervention (LLI)Reading Progress for English Language Learner LLI students
2009–2010
Student CharacteristicsOut of the total LLI student sample from Heinemann’s LLI Data Collection Project (2009–2010), 925 of the kinder-garten through fifth-grade students were reported to be English language learners (ELL). Of this group, 57.4% were male and 42.5% were female, 72.9% were Hispanic, 8.4% were Asian/Pacific Island, 7.1% were White, 6.9% were Black, and 1.4% were Multi-Racial. As an indication of students’ economic status, information on free/reduced lunch was collected and 62.8% fell into this category. Refer to Table 1 for a summary of the ELL LLI student sample size by grade and refer to Table 2 for a summary of the student demographics.
Of the total group of ELL LLI students, 7.4% (n = 68) had individualized education plans that mandated that they receive support for reading and 8.5% (n = 79) of the LLI students had an IEP for other support services.
Results – Reading ProgressBelow is a summary of the reading progress of the 925 English language learner students who received LLI during the 2009–2010 school year. Of the total group, 28 of the ELL LLI students did not complete the full set of sessions offered to them because they moved, withdrew or were switched to a different intervention and thus, their data were eliminated from the analyses reported below. Furthermore, some of the data submitted by the LLI teachers contained missing or incomplete information. The reported results below also exclude cases with missing data.
LLI Groups and Student AttendanceLLI was designed to be delivered in a group of three students with one teacher, five days per week; however, delivery varied according to school and district limitations. Overall, each of the ELL LLI groups was comprised of between
Student Sample SizeKindergarten 1st Grade 2nd Grade 3rd Grade 4th Grade 5th Grade
6.8% (n=63) 51.1% (n=473) 27.6% (n=255) 9.7% (n=90) 3.5% (n=32) 1.3% (n=12)
Table 1
Table 2
Student Demographics
% Male % Female % Hispanic % asian/Pacific Island % White % Black % Multi-Racial % Free/Reduced
Lunch
57.4% (n=531) 42.5% (n=393) 72.9% (n=674) 8.4% (n=78) 7.1% (n=66) 6.9% (n=64) 1.4% (n=13) 62.8% (n=581)
LLI_2009 DataCollReport_FEB20_2013.indd 10 2/21/13 12:46 PM

11
1 and 6 students (M = 3.0, SD = .6) and the groups met between 2 and 5 days a week (M = 4.7, SD = .6) for 30 minutes per session (see Table 4).
The ELL LLI students who completed the full set of LLI sessions offered to them and for whom attendance information was available received LLI for an average of 16.9 weeks (range: 3-37, SD = 7.5) and they attended an average of 58.3 LLI lessons (range: 9-140, SD = 26.2) (see Table 4). It should be noted, however, that many students were not able to receive the full intervention as the school year ended and their LLI teachers indicated that they would receive more LLI the following year.
Reading ProgressThe data were collected and reported for ELL LLI students only. no control group was identified and assessed and therefore, the ELL LLI student growth was compared to Fountas and Pinnell grade level criteria (see Table 3) to assess the group’s progress. Each student’s reading progress was determined by looking at their pre- and post- LLI instructional reading levels (ranging from Pre-A to Z) which are based on the F & P Text Level Gradient™.
• Obtaining Fountas and Pinnell Instructional Reading Levels The Fountas and Pinnell instructional reading levels were obtained through the teachers’ reports of their students’ instructional reading levels which were determined by administration of the Fountas & Pinnell Benchmark Assessment System or reading records or by the conversion to Fountas and Pinnell levels of the teacher’s reports of their students’ score on other reading assessments including the DRA or DRA2, the Reading Recovery Observation Survey with Running Records, and the Rigby Benchmark.
• Conversion to Time Equivalent (TE) Score Once each child’s instructional level at entry and exit was obtained, the levels were converted to a Time Equivalent (TE) score which represents the number of months of school a typically progressing student is expected to have completed when they demonstrate the reading behaviors associated with each level according to Fountas and Pinnell guidelines. The TE scores represent the number of months the student was in school and are based on a ten-month school year because children are not in school for two months of each year. If an instructional reading level is expected over more than one month, the TE score reflects the middle point of the expected band of time that the particular level is expected (see Table 3). For example, level C is expected at months eight, nine, and ten during kindergarten and the time equivalent for level C is month nine.
• Calculating Reading GainThe difference between the entry and exit TE score reflects the gain (number of months of progress) the student made between entry and exit from LLI. For example, a student who enters LLI at level A and exits at level C has progressed from what is expected in the fourth month of kindergarten to what is expected in the ninth month of kindergarten and thus, the student’s reading gain is five months.
LLI_2009 DataCollReport_FEB20_2013.indd 11 2/21/13 12:46 PM
12
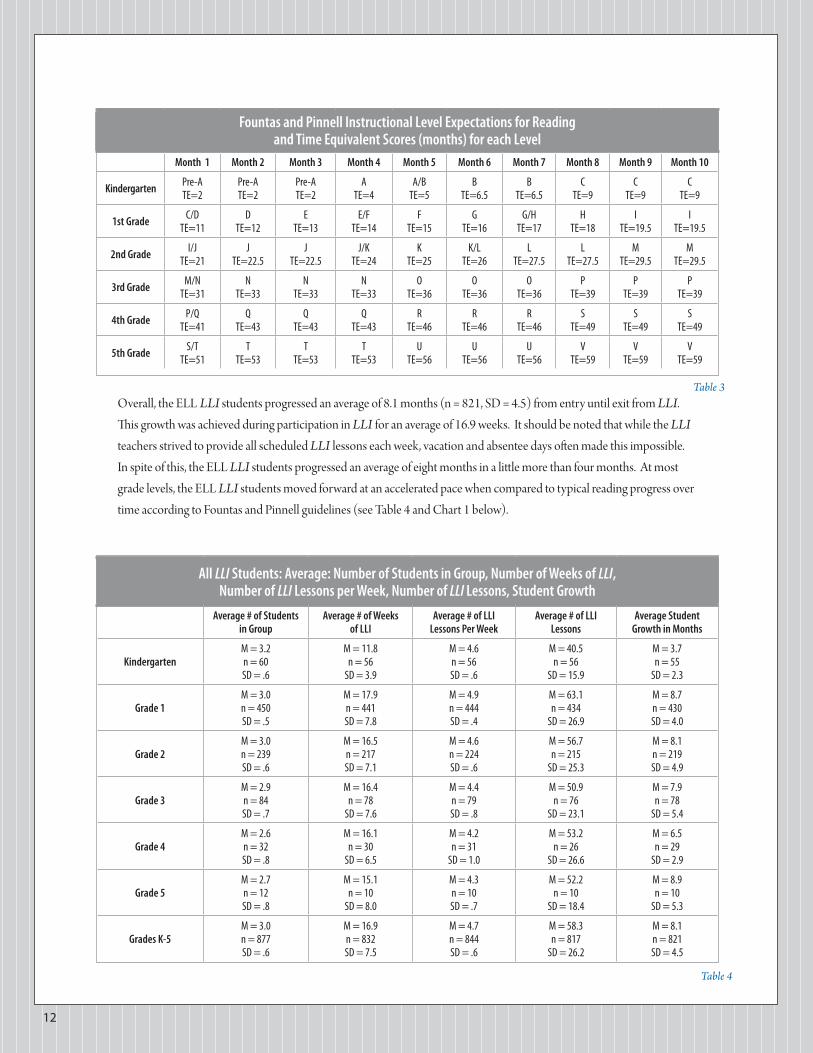
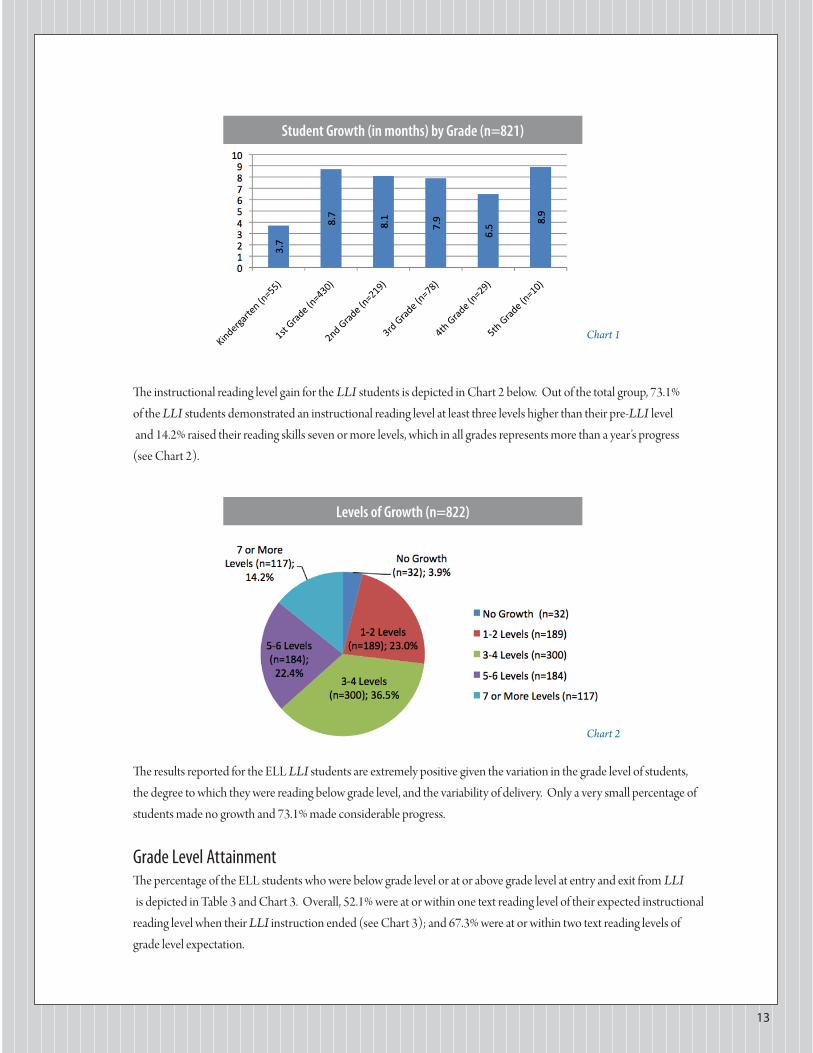
Overall, the ELL LLI students progressed an average of 8.1 months (n = 821, SD = 4.5) from entry until exit from LLI. This growth was achieved during participation in LLI for an average of 16.9 weeks. It should be noted that while the LLI teachers strived to provide all scheduled LLI lessons each week, vacation and absentee days often made this impossible. In spite of this, the ELL LLI students progressed an average of eight months in a little more than four months. At most grade levels, the ELL LLI students moved forward at an accelerated pace when compared to typical reading progress over time according to Fountas and Pinnell guidelines (see Table 4 and Chart 1 below).
Fountas and Pinnell Instructional Level Expectations for Reading and Time Equivalent Scores (months) for each Level
Month 1 Month 2 Month 3 Month 4 Month 5 Month 6 Month 7 Month 8 Month 9 Month 10
Kindergarten Pre-aTE=2
Pre-aTE=2
Pre-aTE=2
aTE=4
a/BTE=5
BTE=6.5
BTE=6.5
CTE=9
CTE=9
CTE=9
1st Grade C/DTE=11
DTE=12
ETE=13
E/FTE=14
FTE=15
GTE=16
G/HTE=17
HTE=18
ITE=19.5
ITE=19.5
2nd Grade I/JTE=21
JTE=22.5
JTE=22.5
J/KTE=24
KTE=25
K/LTE=26
LTE=27.5
LTE=27.5
MTE=29.5
MTE=29.5
3rd Grade M/nTE=31
nTE=33
nTE=33
nTE=33
OTE=36
OTE=36
OTE=36
PTE=39
PTE=39
PTE=39
4th Grade P/QTE=41
QTE=43
QTE=43
QTE=43
RTE=46
RTE=46
RTE=46
STE=49
STE=49
STE=49
5th Grade S/TTE=51
TTE=53
TTE=53
TTE=53
UTE=56
UTE=56
UTE=56
VTE=59
VTE=59
VTE=59
Table 3
All LLI Students: Average: Number of Students in Group, Number of Weeks of LLI, Number of LLI Lessons per Week, Number of LLI Lessons, Student Growth
Average # of Students in Group
Average # of Weeks of LLI
Average # of LLI Lessons Per Week
Average # of LLI Lessons
Average Student Growth in Months
KindergartenM = 3.2n = 60SD = .6
M = 11.8n = 56
SD = 3.9
M = 4.6n = 56SD = .6
M = 40.5n = 56
SD = 15.9
M = 3.7n = 55
SD = 2.3
Grade 1M = 3.0n = 450SD = .5
M = 17.9n = 441SD = 7.8
M = 4.9n = 444SD = .4
M = 63.1n = 434
SD = 26.9
M = 8.7n = 430SD = 4.0
Grade 2M = 3.0n = 239SD = .6
M = 16.5n = 217SD = 7.1
M = 4.6n = 224SD = .6
M = 56.7n = 215
SD = 25.3
M = 8.1n = 219SD = 4.9
Grade 3M = 2.9n = 84SD = .7
M = 16.4n = 78
SD = 7.6
M = 4.4n = 79SD = .8
M = 50.9n = 76
SD = 23.1
M = 7.9n = 78
SD = 5.4
Grade 4M = 2.6n = 32SD = .8
M = 16.1n = 30
SD = 6.5
M = 4.2n = 31
SD = 1.0
M = 53.2n = 26
SD = 26.6
M = 6.5n = 29
SD = 2.9
Grade 5M = 2.7n = 12SD = .8
M = 15.1n = 10
SD = 8.0
M = 4.3n = 10SD = .7
M = 52.2n = 10
SD = 18.4
M = 8.9n = 10
SD = 5.3
Grades K-5M = 3.0n = 877SD = .6
M = 16.9n = 832SD = 7.5
M = 4.7n = 844SD = .6
M = 58.3n = 817
SD = 26.2
M = 8.1n = 821SD = 4.5
Table 4
LLI_2009 DataCollReport_FEB20_2013.indd 12 2/21/13 12:46 PM
13
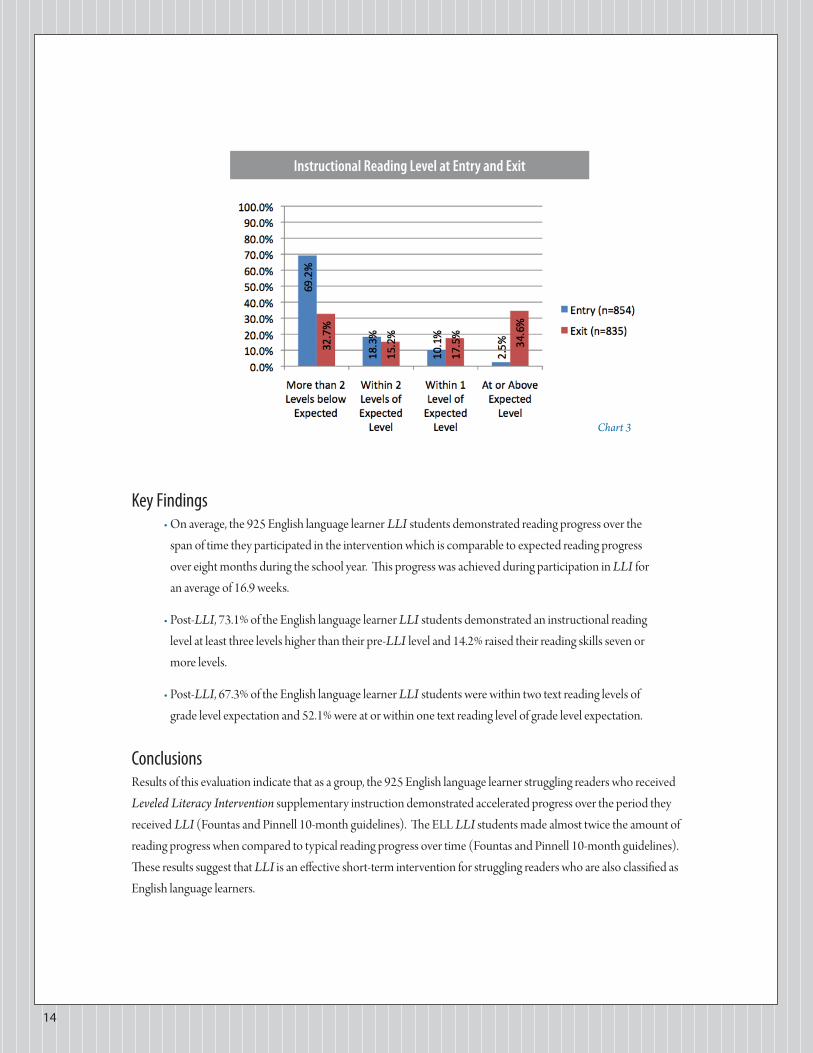
The instructional reading level gain for the LLI students is depicted in Chart 2 below. Out of the total group, 73.1% of the LLI students demonstrated an instructional reading level at least three levels higher than their pre-LLI level and 14.2% raised their reading skills seven or more levels, which in all grades represents more than a year’s progress (see Chart 2).
Student Growth (in months) by Grade (n=821)
Chart 1
The results reported for the ELL LLI students are extremely positive given the variation in the grade level of students, the degree to which they were reading below grade level, and the variability of delivery. Only a very small percentage of students made no growth and 73.1% made considerable progress.
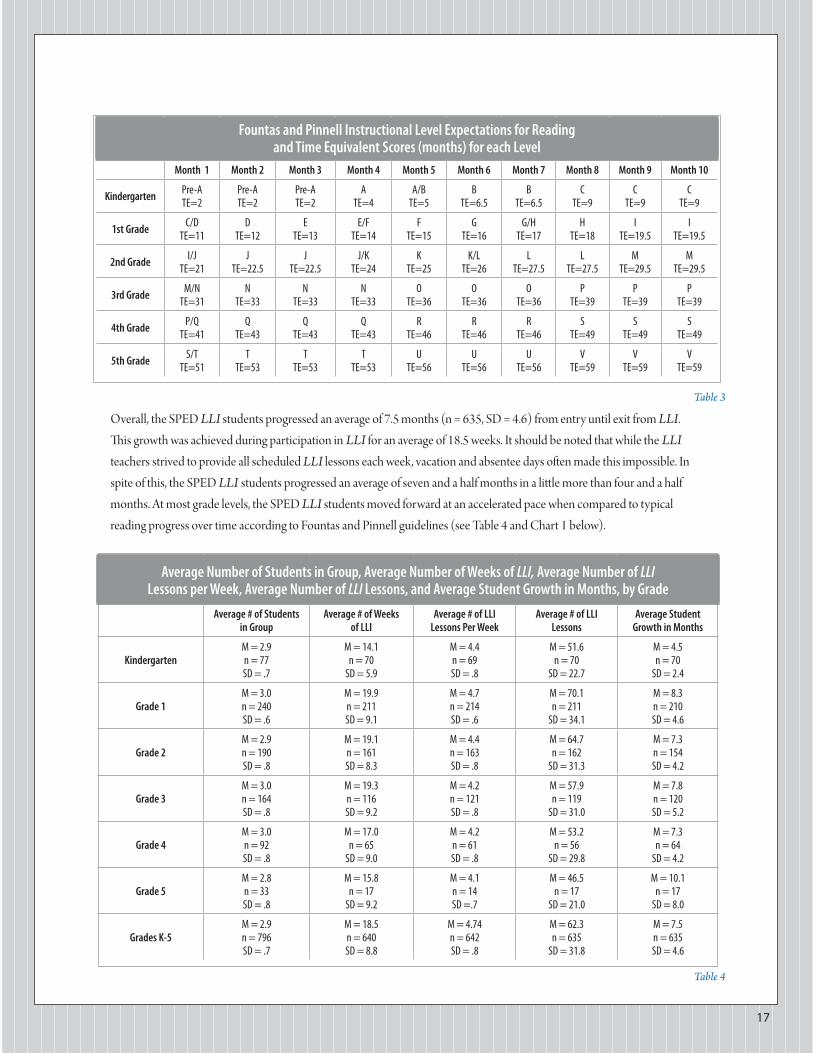
Grade Level attainmentThe percentage of the ELL students who were below grade level or at or above grade level at entry and exit from LLI is depicted in Table 3 and Chart 3. Overall, 52.1% were at or within one text reading level of their expected instructional reading level when their LLI instruction ended (see Chart 3); and 67.3% were at or within two text reading levels of grade level expectation.
Levels of Growth (n=822)
Chart 2
LLI_2009 DataCollReport_FEB20_2013.indd 13 2/21/13 12:46 PM
14
Key Findings• On average, the 925 English language learner LLI students demonstrated reading progress over the
span of time they participated in the intervention which is comparable to expected reading progress over eight months during the school year. This progress was achieved during participation in LLI for an average of 16.9 weeks.
• Post-LLI, 73.1% of the English language learner LLI students demonstrated an instructional reading level at least three levels higher than their pre-LLI level and 14.2% raised their reading skills seven or more levels.
• Post-LLI, 67.3% of the English language learner LLI students were within two text reading levels of grade level expectation and 52.1% were at or within one text reading level of grade level expectation.
ConclusionsResults of this evaluation indicate that as a group, the 925 English language learner struggling readers who received Leveled Literacy Intervention supplementary instruction demonstrated accelerated progress over the period they received LLI (Fountas and Pinnell 10-month guidelines). The ELL LLI students made almost twice the amount of reading progress when compared to typical reading progress over time (Fountas and Pinnell 10-month guidelines). These results suggest that LLI is an effective short-term intervention for struggling readers who are also classified as English language learners.
Instructional Reading Level at Entry and Exit
Chart 3
LLI_2009 DataCollReport_FEB20_2013.indd 14 2/21/13 12:46 PM

15
HEInEMann
Leveled Literacy Intervention (LLI)Reading Progress for Special Education LLI students
2009–2010
Student CharacteristicsOut of the total LLI student sample from Heinemann’s LLI Data Collection Project (2009–2010), 824 of the kindergarten through fifth-grade students were reported to have an IEP for Reading or other categories (SPED). Of this group, 69.9% were male and 30.1% were female, 63.1% were White, 15.9% were Hispanic, 15.5% were Black, 1.7% were Asian/Pacific Island, and 1.6% were Multi-Racial. As an indication of students’ economic status, information on free/reduced lunch was collected and 57.9% fell into this category. 11.9 % of the children were English language learners. Refer to Table 1 for a summary of the SPED LLI student sample size by grade and refer to Table 2 for a summary of the student demographics.
Of the total group of SPED LLI students, 60.2% (n = 496) had individualized education plans that mandated that they receive support for Reading and 84.0% (n = 692) of the LLI students had an IEP for other support services; 44.2% (n = 364) of the SPED LLI students had an IEP for both Reading and other support services.
Results – Reading ProgressBelow is a summary of the reading progress of the 824 students who had an IEP for Reading and/or other categories and received LLI during the 2009–2010 school year. Of the total group, 20 of the SPED LLI students did not complete the full set of sessions offered to them because they moved, withdrew or were switched to a different intervention and thus, their data were eliminated from the analyses reported below. Furthermore, some of the data submitted by the LLI teachers contained missing or incomplete information. The reported results below also exclude cases with missing data.
Student Sample SizeKindergarten 1st Grade 2nd Grade 3rd Grade 4th Grade 5th Grade
9.5% (n=78) 30.2% (n=249) 24.8% (n=204) 20.3% (n=167) 11.2% (n=92) 4.1% (n=34)
Table 1
Table 2
Student Demographics
% Male % Female % White % Hispanic % Black % asian/Pacific Island
% Multi-Racial
% Free/Re-duced Lunch
% English Language Learners
69.9% (n=576)
30.1% (n=248)
63.1% (n=520)
15.9% (n=131)
15.5% (n=128)
1.7% (n=14)
1.6% (n=13)
57.9%(n=477)
11.9%(n=98)
LLI_2009 DataCollReport_FEB20_2013.indd 15 2/21/13 12:46 PM

16
LLI Groups and Student AttendanceLLI was designed to be delivered in a group of three students with one teacher, five days per week; however, delivery varied according to school and district limitations. Overall, each of the SPED LLI groups was comprised of between 1 and 5 students (M = 2.9, SD = .7) and the groups met between 2 and 5 days a week (M = 4.4, SD = .8) for 30 minutes per session (see Table 4).
The SPED LLI students who completed the full set of LLI sessions offered to them and for whom attendance information was available received LLI for an average of 18.5 weeks (range: 2-37, SD = 8.8) and they attended an average of 62.3 LLI lessons (range: 7-167, SD = 31.8) (see Table 4). It should be noted, however, that many students were not able to receive the full intervention as the school year ended and their LLI teachers indicated that they would receive more LLI the following year.
Reading ProgressThe data were collected and reported for SPED LLI students only. no control group was identified and assessed and therefore, the SPED LLI student growth was compared to Fountas and Pinnell grade level criteria (see Table 3) to assess the group’s progress. Each student’s reading progress was determined by looking at their pre- and post- LLI instructional reading levels (ranging from Pre-A to Z) which are based on the Fountas and Pinnell leveled text system.
• Obtaining Fountas and Pinnell Instructional Reading Levels The Fountas and Pinnell instructional reading levels were obtained through the teachers’ reports of their students’ instructional reading levels which were determined by administration of the Fountas & Pinnell Benchmark Assessment System or reading records or by the conversion to Fountas and Pinnell levels of the teacher’s reports of their students’ scores on other reading assessments including the Dra or Dra2, the Reading Recovery® Observation Survey with Running Records, and the Rigby Benchmark.
• Conversion to Time Equivalent (TE) Score Once each child’s instructional level at entry and exit was obtained, the levels were converted to a Time Equivalent (TE) score which represents the number of months of school a typically progressing student is expected to have completed when they demonstrate the reading behaviors associated with each level according to Fountas and Pinnell guidelines. The TE scores represent the number of months the student was in school and are based on a ten-month school year because children are not in school for two months of each year. If an instructional reading level is expected over more than one month, the TE score reflects the middle point of the expected band of ime that the particular level is expected (see Table 5). For example, level C is expected at months eight, nine, and ten during kindergarten and the time equivalent for level C is month nine.
• Calculating Reading GainThe difference between the entry and exit TE score reflects the gain (number of months of progress) the student made between entry and exit from LLI. For example, a student who enters LLI at level A and exits at level C has progressed from what is expected in the fourth month of kindergarten to what is expected in the ninth month of kindergarten and thus, the student’s reading gain is five months.
LLI_2009 DataCollReport_FEB20_2013.indd 16 2/21/13 12:46 PM
17
Overall, the SPED LLI students progressed an average of 7.5 months (n = 635, SD = 4.6) from entry until exit from LLI. This growth was achieved during participation in LLI for an average of 18.5 weeks. It should be noted that while the LLI teachers strived to provide all scheduled LLI lessons each week, vacation and absentee days often made this impossible. In spite of this, the SPED LLI students progressed an average of seven and a half months in a little more than four and a half months. At most grade levels, the SPED LLI students moved forward at an accelerated pace when compared to typical reading progress over time according to Fountas and Pinnell guidelines (see Table 4 and Chart 1 below).
Fountas and Pinnell Instructional Level Expectations for Reading and Time Equivalent Scores (months) for each Level
Month 1 Month 2 Month 3 Month 4 Month 5 Month 6 Month 7 Month 8 Month 9 Month 10
Kindergarten Pre-aTE=2
Pre-aTE=2
Pre-aTE=2
aTE=4
a/BTE=5
BTE=6.5
BTE=6.5
CTE=9
CTE=9
CTE=9
1st Grade C/DTE=11
DTE=12
ETE=13
E/FTE=14
FTE=15
GTE=16
G/HTE=17
HTE=18
ITE=19.5
ITE=19.5
2nd Grade I/JTE=21
JTE=22.5
JTE=22.5
J/KTE=24
KTE=25
K/LTE=26
LTE=27.5
LTE=27.5
MTE=29.5
MTE=29.5
3rd Grade M/nTE=31
nTE=33
nTE=33
nTE=33
OTE=36
OTE=36
OTE=36
PTE=39
PTE=39
PTE=39
4th Grade P/QTE=41
QTE=43
QTE=43
QTE=43
RTE=46
RTE=46
RTE=46
STE=49
STE=49
STE=49
5th Grade S/TTE=51
TTE=53
TTE=53
TTE=53
UTE=56
UTE=56
UTE=56
VTE=59
VTE=59
VTE=59
Table 3
Average Number of Students in Group, Average Number of Weeks of LLI, Average Number of LLI Lessons per Week, Average Number of LLI Lessons, and Average Student Growth in Months, by Grade
Average # of Students in Group
Average # of Weeks of LLI
Average # of LLI Lessons Per Week
Average # of LLI Lessons
Average Student Growth in Months
KindergartenM = 2.9n = 77SD = .7
M = 14.1n = 70
SD = 5.9
M = 4.4n = 69SD = .8
M = 51.6n = 70
SD = 22.7
M = 4.5n = 70
SD = 2.4
Grade 1M = 3.0n = 240SD = .6
M = 19.9n = 211SD = 9.1
M = 4.7n = 214SD = .6
M = 70.1n = 211
SD = 34.1
M = 8.3n = 210SD = 4.6
Grade 2M = 2.9n = 190SD = .8
M = 19.1n = 161SD = 8.3
M = 4.4n = 163SD = .8
M = 64.7n = 162
SD = 31.3
M = 7.3n = 154SD = 4.2
Grade 3M = 3.0n = 164SD = .8
M = 19.3n = 116SD = 9.2
M = 4.2n = 121SD = .8
M = 57.9n = 119
SD = 31.0
M = 7.8n = 120SD = 5.2
Grade 4M = 3.0n = 92SD = .8
M = 17.0n = 65
SD = 9.0
M = 4.2n = 61SD = .8
M = 53.2n = 56
SD = 29.8
M = 7.3n = 64
SD = 4.2
Grade 5M = 2.8n = 33SD = .8
M = 15.8n = 17
SD = 9.2
M = 4.1n = 14SD =.7
M = 46.5n = 17
SD = 21.0
M = 10.1n = 17
SD = 8.0
Grades K-5M = 2.9n = 796SD = .7
M = 18.5n = 640SD = 8.8
M = 4.74n = 642SD = .8
M = 62.3n = 635
SD = 31.8
M = 7.5n = 635SD = 4.6
Table 4
LLI_2009 DataCollReport_FEB20_2013.indd 17 2/21/13 12:46 PM

18
The instructional reading level gain for the LLI students is depicted in Chart 2 below. Out of the total group, 61.4% of the LLI students demonstrated an instructional reading level at least three levels higher than their pre-LLI level and 10.3% raised their reading skills seven or more levels, which in all grades represents more than a year’s progress (see Chart 2).
Student Growth (in months) by Grade (n=635)
Chart 1
The results reported for the SPED LLI students are extremely positive given the variation in the grade level of students, the degree to which they were reading below grade level, and the variability of delivery. Only a small percentage of students made no growth and 61.4% made considerable progress.
Levels of Growth (n=630)
Chart 2
LLI_2009 DataCollReport_FEB20_2013.indd 18 2/21/13 12:46 PM

19
Key Findings• On average, the 824 Special Education LLI students demonstrated reading progress over
the span of time they participated in the intervention which is comparable to expected reading progress over seven and a half months during the school year. This progress was achieved during participation in LLI for an average of 18.5 weeks.
• Post-LLI, 61.4% of the Special Education LLI students demonstrated an instructional reading level at least three levels higher than their pre-LLI level and 10.3% raised their reading skills seven or more levels.
ConclusionsResults of this evaluation indicate that as a group, the 824 Special Education struggling readers who received Leveled Literacy Intervention supplementary instruction demonstrated accelerated progress over the period they received LLI (Fountas and Pinnell 10-month guidelines). These results suggest that LLI is an effective short-term intervention for struggling readers who have an IEP for Reading or other categories.
LLI_2009 DataCollReport_FEB20_2013.indd 19 2/21/13 12:46 PM

LLI_2009 DataCollReport_FEB20_2013.indd 20 2/21/13 12:46 PM

LLI_2009 DataCollReport_FEB20_2013.indd 21 2/21/13 12:46 PM
To order or more informationwww.heinemann.comPhone: 800.225.5800
Fax: 877.231.6980
04453-8 02/2013
ReseaRCh and data ColleCtion pRojeCt
Leveled Literacy Intervention
©2011 Heinemann
2009-2010
LLI_2009 DataCollReport_FEB20_2013.indd 22 2/21/13 12:46 PM