Level threshold tables and KEY STAGE age...
22
Level threshold tables and age standardised scores for key stage 2 tests in English, mathematics and science KEY STAGE 2 2007 National curriculum assessments
Transcript of Level threshold tables and KEY STAGE age...

Level threshold tables andage standardised scoresfor key stage 2 tests in English, mathematics and science
KEY STAGE
2
2007
National curriculum assessments

First published 2007
© Qualifications and Curriculum Authority 2007
ISBN 1 85838 957 7
Reproduction, storage, adaptation or translation, in any form or by any means, of thispublication is prohibited without prior written permission of the publisher, unless withinthe terms of licences issued by the Copyright Licensing Agency. Excerpts may bereproduced for the purpose of research, private study, criticism or review, or byeducational institutions solely for educational purposes, without permission, providingfull acknowledgement is given.
Printed in Great Britain by the Qualifications and Curriculum Authority under the authorityand superintendence of the Controller of Her Majesty’s Stationery Office and Queen’sPrinter of Acts of Parliament.
The Qualifications and Curriculum Authority is an exempt charity under Schedule 2 of theCharities Act 1993.
Qualifications and Curriculum Authority83 PiccadillyLondon W1J 8QAwww.qca.org.uk
The Qualifications and Curriculum Authority (QCA) wishes to make its publicationswidely accessible. Please contact us if you have any specific accessibility requirements.

Contents
1 Introduction 2
1.1 Training and checking marking standards . . . . . . . . . . . . . . . . . . . . . . . . . . . . . . . . . . . . . . . . 2
1.2 What to do when the results are received . . . . . . . . . . . . . . . . . . . . . . . . . . . . . . . . . . . . . . . . 2
2 How the levels are set 4
2.1 Setting draft thresholds . . . . . . . . . . . . . . . . . . . . . . . . . . . . . . . . . . . . . . . . . . . . . . . . . . . . . . . 4
2.2 Setting level thresholds . . . . . . . . . . . . . . . . . . . . . . . . . . . . . . . . . . . . . . . . . . . . . . . . . . . . . . . 4
3 Level thresholds 5
3.1 The English tests . . . . . . . . . . . . . . . . . . . . . . . . . . . . . . . . . . . . . . . . . . . . . . . . . . . . . . . . . . . . . 6
3.2 The mathematics tests . . . . . . . . . . . . . . . . . . . . . . . . . . . . . . . . . . . . . . . . . . . . . . . . . . . . . . . . 8
3.3 The science tests . . . . . . . . . . . . . . . . . . . . . . . . . . . . . . . . . . . . . . . . . . . . . . . . . . . . . . . . . . . . . 8
4 Age standardised scores 9
4.1 Working out age standardised scores . . . . . . . . . . . . . . . . . . . . . . . . . . . . . . . . . . . . . . . . . . . 9
4.2 Making use of age standardised scores . . . . . . . . . . . . . . . . . . . . . . . . . . . . . . . . . . . . . . . . . 9
4.3 National comparisons – using the shaded bands . . . . . . . . . . . . . . . . . . . . . . . . . . . . . . . . 10
4.4 Confidence bands . . . . . . . . . . . . . . . . . . . . . . . . . . . . . . . . . . . . . . . . . . . . . . . . . . . . . . . . . . 11
4.5 Age standardised scores tables . . . . . . . . . . . . . . . . . . . . . . . . . . . . . . . . . . . . . . . . . . . . . . . 12
CONTENTS 1

LEVEL THRESHOLD TABLES AND AGE STANDARDISED SCORES FOR KEY STAGE 2 TESTS IN ENGLISH, 2 MATHEMATICS AND SCIENCE
Introduction
This booklet provides:
tables for converting marks on the key stage 2 tests into national curriculum levels
age standardised scores for the reading test, mathematics test A and test B, and themental mathematics test.
1.1 Training and checking marking standards
All markers undergo training before they are allowed to start marking pupils’ scripts. The training is designed to enable markers to apply the Mark scheme to a key stage /subject-specific national standard. The Mark scheme used by markers is the same as the one that was sent to your school in the mark scheme pack, along with test materials,in April.
All markers are allocated to a team and have a supervisor who checks samples of theirmarking at least twice to ensure they are applying the Mark scheme to the nationalstandard. If the marking is not satisfactory, the marker is stopped from marking and thescripts are allocated to another marker for re-marking.
At the end of the marking period, markers are issued with the level thresholds. Markersare required to revisit their marking for pupils whose total marks fall within specified markranges below the final level subject thresholds; this is known as borderlining. Where thisborderline check has taken place, it will be indicated on the front cover of one of thepupil’s scripts.
1.2 What to do when the results are received
Return of results
Schools will be notified of their pupils’ test results through the return of completedmarksheets by 10 July 2007. If they have not arrived by the end of the day on10 July 2007, please contact the NAA test operations agency on 0870 2413540.
Checking results
The marking of pupils’ tests will have been checked carefully before the papers arereturned to schools. However, schools may wish to undertake their own checks,particularly for any pupil(s) who in the school’s opinion have been awarded an incorrectnational curriculum level. The review process should only be used when, in the opinionof the staff in a school, the pupil(s) concerned have received a national curriculum level above or below that to which their work is entitled in relation to the published Mark scheme.
Guidance on requesting reviews is given in the key stage 2 Information for schoolsbooklet, which was sent to schools at the end of June 2007. It is essential that requestsfor reviews follow the procedures set out in this booklet. This includes clearly identifyingwhere the Mark scheme has not been applied accurately in a question or questions.
Requests for reviews must reach the NAA test operations agency by 20 July 2007 at thelatest. No reviews can be discussed over the telephone and none will be accepted afterthis date.
10

INTRODUCTION 3
Reporting results for key stage 2
The key stage 2 test levels awarded must be reported to pupils’ parents within 15 schooldays of the return of results to schools, alongside the end of key stage teacher assessmentlevels. If the outcome of a review is pending, schools should report test results to parentsas provisional. Parents should also receive a summary giving the proportion of pupilsawarded each level in the school this year and nationally in 2006. Please refer to the 2007 key stage 2 Assessment and reporting arrangements booklet for full information on reporting to parents (pages 75–78). Schools may, if they wish, return the markedscripts to pupils.
Submitting teacher assessment data
The deadline for submitting teacher assessment levels to the NAA test operationsagency is 11 July 2007. The date for submission of this information has been set so thatnational summary data can be made available to schools and local authorities as early as possible. To achieve this, teacher assessment data must be submitted promptly. Any queries regarding the submission of teacher assessment data should be directed to the NAA test operations agency, telephone number 0870 2413540.

LEVEL THRESHOLD TABLES AND AGE STANDARDISED SCORES FOR KEY STAGE 2 TESTS IN ENGLISH, 4 MATHEMATICS AND SCIENCE
How the levels are set
The national curriculum tests are written against the programmes of study and aredesigned to award levels that equate demand to the level descriptions.
QCA has in place a range of procedures as laid out in the Code of practice, bothstatistical and judgemental, to ensure the standards of performance required for theaward of each level are maintained consistently from year to year. These proceduresinclude extensive pretesting of all test papers and obtaining the advice of a panel ofsenior markers including the marking programme leader once the marking is well underway each year. These procedures have enabled QCA to set threshold scores each yearthat have maintained standards since 1996.
2.1 Setting draft thresholds
The NAA sets draft level thresholds with the test development agencies for each subjectin February–March preceding the tests in May. The difficulty of the current test is consideredby looking at pretest data, which includes a number of measures designed to identifyany variation in the underlying difficulty of the test papers from year to year. If a test isdeemed to be more difficult than the previous year’s test, the level thresholds will belower. If a test paper is deemed to be less difficult, the level thresholds will rise. The draft level thresholds are used to inform the next stage of the process.
2.2 Setting level thresholds
Once the test has been taken and marking is under way, samples of marked scripts fromyear 6 pupils are collected from external markers. The scripts, which fall close to the draftlevel thresholds, are scrutinised in detail by senior markers to determine where theybelieve the level thresholds are located.
A final level setting meeting is then convened in June to set the final level thresholdsusing all the evidence available.
The marks obtained by a sample of pupils in the live tests are collected so that the NAA can be aware of the impact of the decisions made in setting the thresholds.
All these measures are taken to ensure standards are maintained and that a pupil whowould have achieved a certain level in last year’s tests will achieve the same level in thenew tests.
2

LEVEL THRESHOLDS 5
The Mark schemes, which are provided in the mark scheme packs sent to schools withthe test materials, give the acceptable answers for test questions and set out the criteriafor the award of marks. They also contain guidance on the general criteria used byexternal markers in the application of the Mark schemes.
Where markers find answers that are not given explicitly in the Mark scheme, they use their professional judgment to decide whether or not an answer is creditworthy.
The following method is used to note the marks awarded for each question:
1 means that a creditworthy response has scored one mark
0 means that a response is not creditworthy.
Half marks are not awarded. Some questions are worth two or more marks.
Some pupils’ test papers may contain two sets of marks – one in red and one in green.This occurs where markers’ work is routinely and randomly checked by their supervisors.In all cases the green marks override the red.
Where a pupil has not attempted a question, the marker will cross through the responsespace with a diagonal line. On the English writing tests, markers are instructed to tickeach page as they mark and to rule a line at the end of the pupil’s writing. Markers arenot required to place any further marks on the scripts.
The total number of marks awarded is recorded on each test paper and on the marksheet.
Pupils who narrowly fail to achieve the lowest level targeted by the levels 3–5 tests areawarded a compensatory level 2. Pupils who score fewer marks than are required for acompensatory award will be awarded N.
To calculate an overall test level for English, mathematics and science, the marksawarded on all the test papers in each subject are added together, then the tables onpages 7 and 8 are used to convert a pupil’s total mark into a test level.
Pupils who were absent for one or more test papers in a subject will be recorded as A for absent for that subject. However, for English, if the pupil sits all reading or allwriting components, they will receive a reading or writing level but be recorded as A for English overall.
Level thresholds3

LEVEL THRESHOLD TABLES AND AGE STANDARDISED SCORES FOR KEY STAGE 2 TESTS IN ENGLISH, 6 MATHEMATICS AND SCIENCE
3.1 The English tests
The following points explain how the Mark scheme is applied by markers.
Reading test
The reading test is marked against the Mark scheme, which includes descriptive criteria.
For the more open questions, which carry several marks, judgements are made about how well a pupil’s response fits these criteria.
The maximum mark available is 50.
Writing test
The longer writing task
The longer writing task is assessed against the following three strands of criteria:
– sentence structure and punctuation (SSP)
– text structure and organisation (TSO)
– composition and effect (C&E).
The maximum mark available is 31 (including a maximum of three marks for handwriting).
The shorter writing task
The shorter writing task is assessed against the following criteria:
– sentence structure, punctuation and text organisation (SSPTO)
– composition and effect (C&E).
The maximum mark available is 12.
Handwriting
Handwriting is assessed through the longer writing task.
Marks are awarded according to the criteria given in the Mark scheme. Pupils who are physically unable to write are awarded two marks.
The maximum mark available is 3.
Spelling test
The Mark scheme gives the correct answers.
The total number of correct spellings is converted to a mark using the table on theback page of the pupil’s script. This ensures that the weighting given to the spellingtest represents seven per cent of the total mark for English.
The maximum mark available is 7.
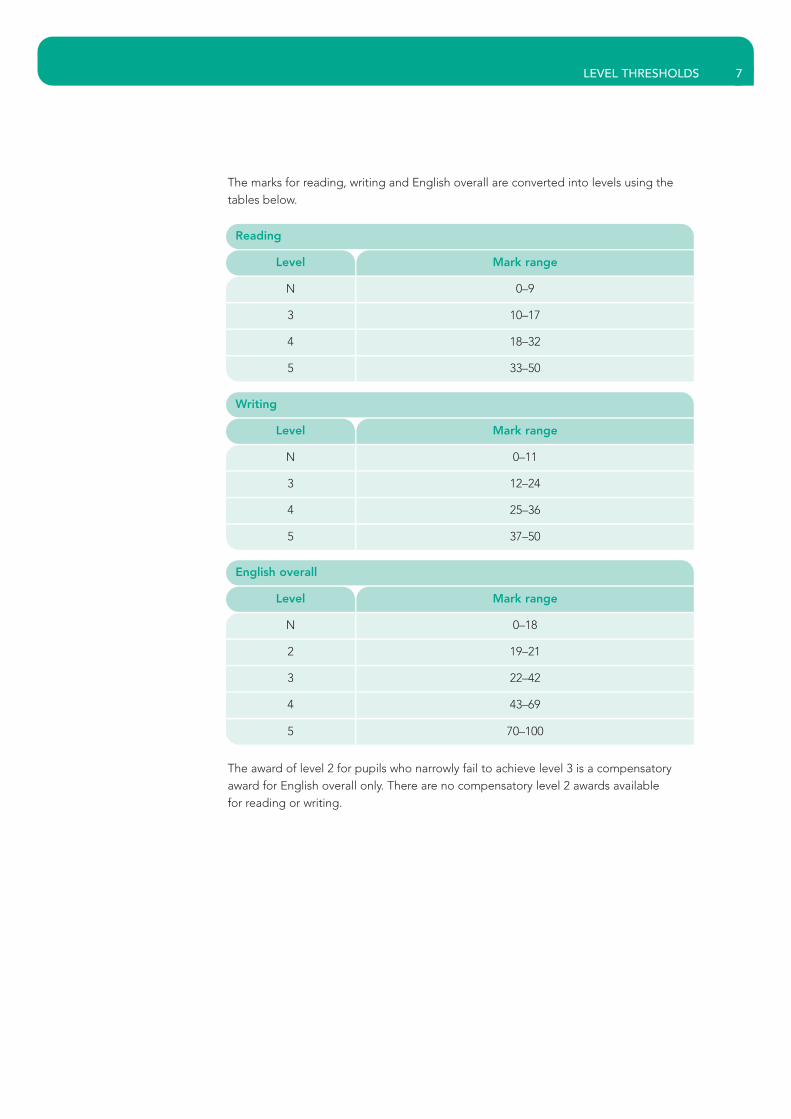
The marks for reading, writing and English overall are converted into levels using thetables below.
The award of level 2 for pupils who narrowly fail to achieve level 3 is a compensatoryaward for English overall only. There are no compensatory level 2 awards availablefor reading or writing.
LEVEL THRESHOLDS 7
0–9
3 10–17
4 18–32
33–50
Reading
5
N
Mark rangeLevel
0–11
3 12–24
4 25–36
37–50
Writing
5
N
Mark rangeLevel
0–18
2 19–21
3 22–42
4 43–69
70–100
English overall
5
N
Mark rangeLevel

LEVEL THRESHOLD TABLES AND AGE STANDARDISED SCORES FOR KEY STAGE 2 TESTS IN ENGLISH, 8 MATHEMATICS AND SCIENCE
3.2 The mathematics tests
Markers record the number of marks awarded in the margin of the test paper. Allquestions, including those not attempted by the pupil, are marked with a 1, 0 or – (for no response).
Most of the questions carry one mark only, although some carry two. In some two-markquestions, if a pupil has not given the right answer, but there is evidence that anappropriate method or working has been used, 1 will be recorded in the appropriatemark space and 0 in the other space.
For the mental mathematics test, where pupils provided the correct answer, a score of 1 will have been recorded.
Marks awarded for test A and test B and the mental mathematics test are totalled toprovide an overall mark.
This table gives the mark ranges for the award of each pupil’s statutory key stage 2mathematics test level.
3.3 The science tests
Markers record the number of marks awarded in the margin of the test paper. All questions, including those not attempted by the pupil, are marked with a 1, 0 or – (for no response).
Most of the questions carry one mark only, although some carry two.
This table gives the mark ranges for the award of each pupil’s statutory key stage 2science test level.
0–15
2 16–18
3 19–45
4 46–78
79–100
Level Mark range
N
0–19
2 20–22
3 23–40
4 41–61
62–80
Level Mark range
N
5
5

AGE STANDARDISED SCORES 9
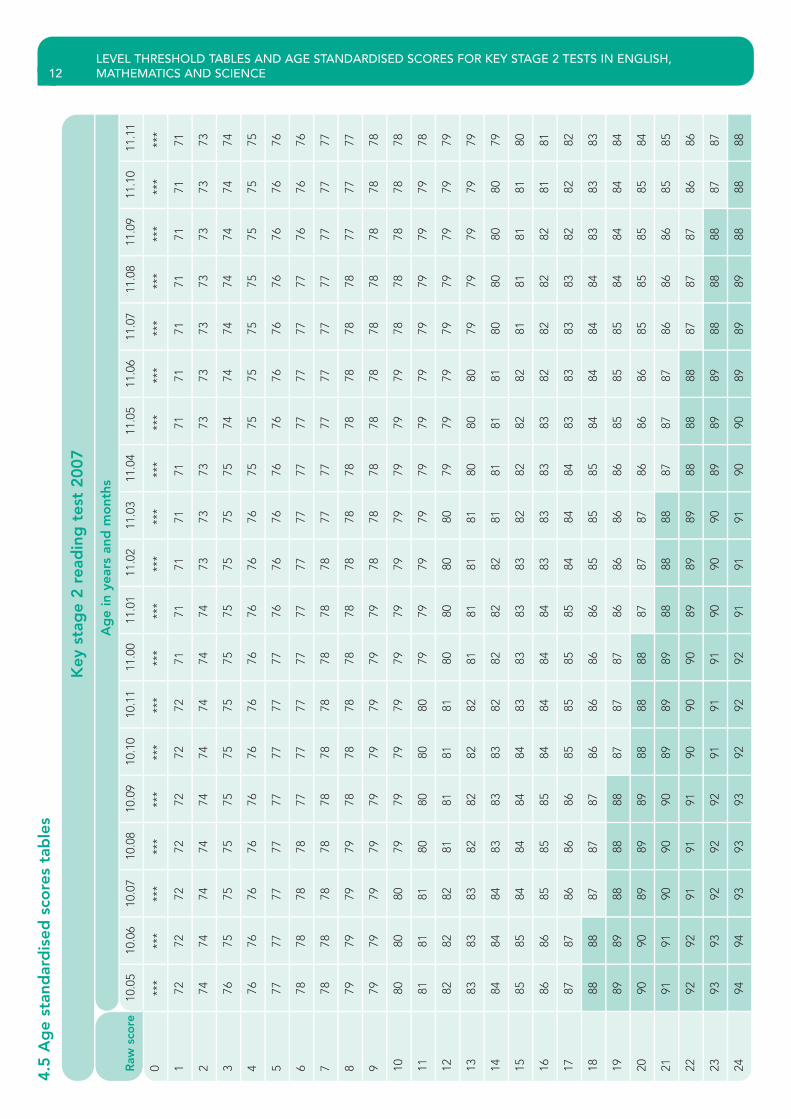
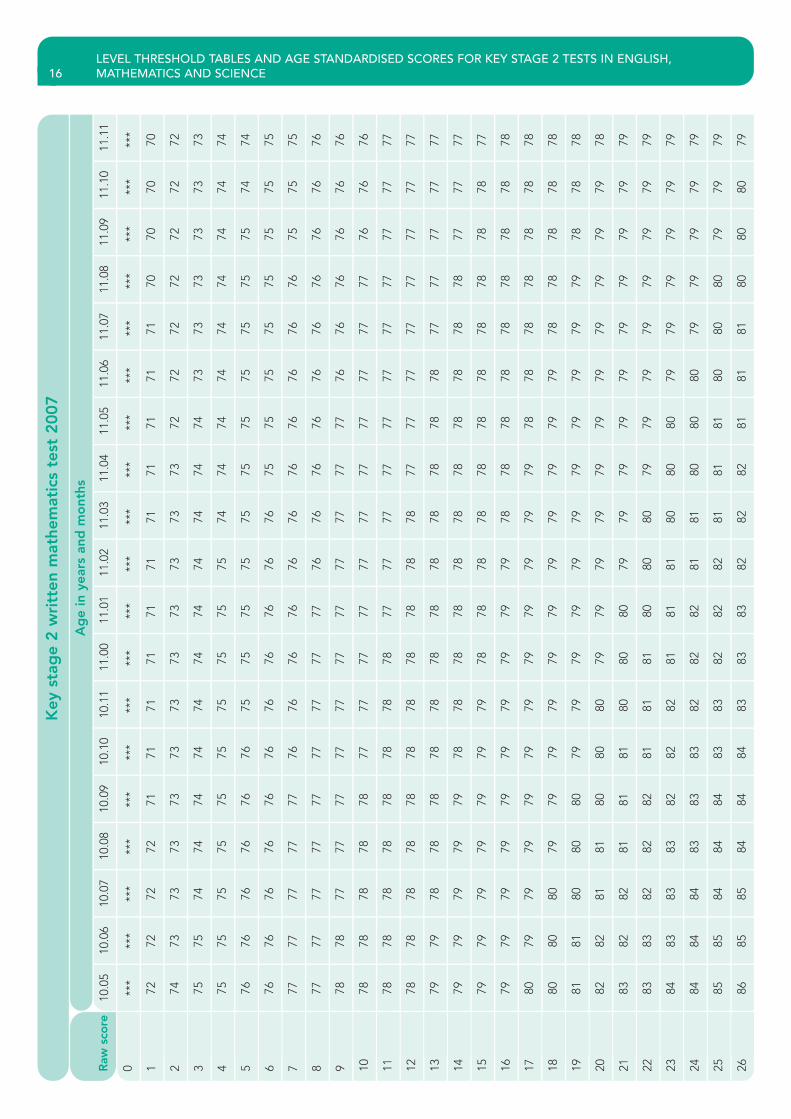
The tables give age standardised scores from the levels 3–5 reading test On DangerousGround, the mathematics test (test A plus test B) and the mental mathematics test. The scores are for optional use. The purpose of the information set out here is to convert the pupil’s actual score in the test, the raw score, to a standardised score.Age standardised scores take into account the pupil’s age in years and months, giving an indication of how each pupil is performing relative to other pupils of the same age.Age standardised scores do not affect the pupil’s test levels.
The tables were calculated from the test results of pupils involved in the levelconfirmation exercise. This involved year 6 pupils who took the tests in May 2007 understatutory conditions, in accordance with the statutory test timetable. The English andmathematics tables are based on between 23,500 and 31,000 pupils’ results.
4.1 Working out age standardised scores
To work out a pupil’s age standardised score, select the table for the relevant test anduse the pupil’s test score and age in years and completed months at the time of testing.For example, a pupil born on 30 March 1996 and tested on 10 May 2007 would be 11 yearsand 1 month old. Where a pupil’s birthday falls between the dates of the two tests in asubject, the pupil’s age at the date of the first test (ie the younger age) should be used.
To convert a raw score into an age standardised score
1. Along the top of the table, locate the pupil’s age in years and months at the time thetest was taken.
2. On the left-hand side of the table, locate the pupil’s raw score.
3. Read off the age standardised score from where the row and the column meet.
Understanding age standardised scores
The average score is 100. A higher score is above average and a lower score is belowaverage. About two-thirds of pupils will have age standardised scores of between 85 and 115, so scores outside this range can be regarded as exceptional.
4.2 Making use of age standardised scores
If you choose to find the age standardised scores, you may use this additionalinformation about the pupils’ performance in any way you wish.
You may decide to inform parents how a pupil’s performance in the test relates to hisor her age at the time the test was taken. For example, ‘An age standardised score of112 shows that the pupil’s test performance was above average for his or her age’.
Age standardised scores42

LEVEL THRESHOLD TABLES AND AGE STANDARDISED SCORES FOR KEY STAGE 2 TESTS IN ENGLISH, 10 MATHEMATICS AND SCIENCE
You could use the information in planning teaching, for example to identify pupilswhose achievement, although in the level 4 range, may have been surprising inrelation to their age at the time of taking the test. For example, ‘These scores werenot particularly good for these pupils once their ages were taken into account –perhaps I should be expecting a bit more from that group’.
You might be able to identify patterns in results that indicate reaching and learningissues to be addressed. For example, ‘The performance of girls in our middle agegroup is consistently better than the boys in that group, but this pattern is notrepeated in the other two age groups. Why might that be? Is there something weneed to think about here?’
Age standardised scores may be averaged across a group, for example the wholeclass or school. In the average class or school, the average score should be close to100; if it is much above or below this, the performance of your class or school variesfrom the national average.
Similarly, age standardised scores could be used to consider differences in pupils’performance in your school in relation to their particular ages, for example betweenboys and girls or between pupils who have English as an additional language. (This willonly give you useful information if the group is reasonably large; the average of just afew pupils is not a reliable indicator.)
4.3 National comparisons – using the shaded bands
The tables of age standardised scores are divided into five bands. These bands give anindication of how the scores relate to the national population. The band nearest the topof the table contains the scores that correspond to the lowest fifth of the population, the next band, the next fifth, and so on. If a pupil has a score in the final band, you knowthat the score is in the top 20 per cent nationally once age has been taken into account.
Very low and very high age standardised scores are printed in the tables as ***. Thismeans that they would be below 70 or above 140, but cannot be calculated with thenecessary degree of statistical reliability. If an exact score is needed, for example, tocalculate an average for the class, 69 or 141 should be used for these pupils.

AGE STANDARDISED SCORES 11
4.4 Confidence bands
As the age standardised scores in the table are derived only from one short test, somemargin of error is inevitable. To indicate how wide this margin of error is likely to be, a 90 per cent confidence band has been calculated. This means that you can have90 per cent certainty that the pupil’s true score lies within the confidence band.
For the reading test, the 90 per cent confidence band is plus or minus 7. So, forexample, if a pupil has an age standardised score of 110, you can be 90 per centcertain that the true score is between 103 and 117.
For mathematics test A and test B, the 90 per cent confidence band is plus or minus 5.So, for example, if a pupil has an age standardised score of 110, you can be90 per cent certain that the true score is between 105 and 115.
For the mental mathematics test, the 90 per cent confidence band is plus or minus 8.So, for example, if a pupil has an age standardised score of 110, you can be90 per cent certain that the true score is between 102 and 118.
LEVEL THRESHOLD TABLES AND AGE STANDARDISED SCORES FOR KEY STAGE 2 TESTS IN ENGLISH, 12 MATHEMATICS AND SCIENCE
10.0
610
.07
10.0
810
.09
10.1
010
.11
11.0
011
.01
11.0
211
.03
11.0
411
.05
11.0
611
.07
11.0
811
.09
11.1
011
.11
1 2 3 4 5 6 7 8 9 10 11 12 13 14 15 16 17 18 19 20 21 22 23 24
Key
sta
ge
2 r
ead
ing
tes
t 2007
Ag
e in
yea
rs a
nd m
ont
hs
Raw
sco
re
0
10.0
5
4.5
Ag
e st
and
ard
ised
sco
res
tab
les
***
***
***
***
***
***
***
***
***
***
***
***
***
***
***
***
***
***
***
7272
7272
7272
7271
7171
7171
7171
7171
7171
71
7474
7474
7474
7474
7473
7373
7373
7373
7373
73
7675
7575
7575
7575
7575
7575
7474
7474
7474
74
7676
7676
7676
7676
7676
7675
7575
7575
7575
75
7777
7777
7777
7777
7676
7676
7676
7676
7676
76
7878
7878
7777
7777
7777
7777
7777
7777
7676
76
7878
7878
7878
7878
7878
7777
7777
7777
7777
77
7979
7979
7878
7878
7878
7878
7878
7878
7777
77
7979
7979
7979
7979
7978
7878
7878
7878
7878
78
8080
8079
7979
7979
7979
7979
7979
7878
7878
78
8181
8180
8080
8079
7979
7979
7979
7979
7979
78
8282
8281
8181
8180
8080
8079
7979
7979
7979
79
8383
8382
8282
8281
8181
8180
8080
7979
7979
79
8484
8483
8383
8282
8282
8181
8181
8080
8080
79
8585
8484
8484
8383
8383
8282
8282
8181
8181
80
8686
8585
8584
8484
8483
8383
8382
8282
8281
81
8787
8686
8685
8585
8584
8484
8383
8383
8282
82
8888
8787
8786
8686
8685
8585
8484
8484
8383
83
8989
8888
8887
8787
8686
8686
8585
8584
8484
84
9090
8989
8988
8888
8787
8786
8686
8585
8585
84
9191
9090
9089
8989
8888
8887
8787
8686
8685
85
9292
9191
9190
9090
8989
8988
8888
8787
8786
86
9393
9292
9291
9191
9090
9089
8989
8888
8887
87
9494
9393
9392
9292
9191
9190
9089
8989
8888
88

AGE STANDARDISED SCORES 13
10.0
610
.07
10.0
810
.09
10.1
010
.11
11.0
011
.01
11.0
211
.03
11.0
411
.05
11.0
611
.07
11.0
811
.09
11.1
011
.11
27 28 29 30 31 32 33 34 35 36 37 38 39 40 41 42 43 44 45 46 47 48 49
Key
sta
ge
2 r
ead
ing
tes
t 2007
50
Ag
e in
yea
rs a
nd m
ont
hs
Raw
sco
re10
.05
262595
9595
9494
9393
9392
9292
9191
9090
9089
8989
9696
9695
9594
9494
9393
9392
9291
9191
9090
90
9897
9796
9696
9595
9494
9493
9393
9292
9191
91
9998
9897
9797
9696
9595
9594
9494
9393
9292
92
100
100
9999
9898
9797
9796
9695
9595
9494
9493
93
101
101
100
100
9999
9998
9897
9797
9696
9595
9594
94
102
102
102
101
101
100
100
9999
9998
9897
9797
9696
9595
104
103
103
102
102
102
101
101
100
100
9999
9998
9897
9797
96
105
105
104
104
103
103
102
102
102
101
101
100
100
9999
9998
9897
107
106
106
105
105
104
104
103
103
103
102
102
101
101
100
100
100
9999
108
108
107
107
106
106
105
105
104
104
104
103
103
102
102
101
101
101
100
110
109
109
108
108
107
107
106
106
106
105
105
104
104
103
103
102
102
102
111
111
110
110
110
109
109
108
108
107
107
106
106
105
105
104
104
104
103
113
113
112
112
111
111
110
110
109
109
108
108
108
107
107
106
106
105
105
115
114
114
114
113
113
112
112
111
111
110
110
109
109
108
108
108
107
107
117
116
116
116
115
115
114
114
113
113
112
112
111
111
110
110
110
109
109
119
119
118
118
117
117
116
116
115
115
114
114
113
113
113
112
112
111
111
121
121
120
120
119
119
119
118
118
117
117
116
116
115
115
114
114
113
113
124
123
123
122
122
121
121
121
120
120
119
119
118
118
117
117
116
116
115
126
126
125
125
125
124
124
123
123
122
122
122
121
121
120
120
119
119
118
129
129
128
128
128
127
127
126
126
125
125
125
124
124
123
123
122
122
122
133
132
132
132
131
131
130
130
129
129
129
128
128
127
127
126
126
126
125
137
137
137
136
136
135
135
134
134
134
133
133
132
132
131
131
131
130
130
***
***
***
***
***
***
***
***
140
140
139
139
139
138
138
137
137
136
136
***
***
***
***
***
***
***
***
***
***
***
***
***
***
***
***
***
***
***
***
***
***
***
***
***
***
***
***
***
***
***
***
***
***
***
***
***
***

LEVEL THRESHOLD TABLES AND AGE STANDARDISED SCORES FOR KEY STAGE 2 TESTS IN ENGLISH, 14 MATHEMATICS AND SCIENCE
10.0
610
.07
10.0
810
.09
10.1
010
.11
11.0
011
.01
11.0
211
.03
11.0
411
.05
11.0
611
.07
11.0
811
.09
11.1
011
.11
1 2 3 4 5 6 7 8 9 10 11 12 13 14 15 16 17 18 19
Key
sta
ge
2 m
enta
l mat
hem
atic
s te
st 2
007
20
Ag
e in
yea
rs a
nd m
ont
hs
Raw
sco
re10
.05
0**
***
***
***
***
***
***
***
***
***
***
***
***
***
***
***
***
***
***
*
7574
7474
7474
7373
7373
7372
7272
7272
7171
71
7878
7878
7777
7777
7776
7676
7676
7575
7575
75
8181
8080
8080
7979
7979
7878
7878
7878
7777
77
8383
8382
8282
8281
8181
8180
8080
7979
7979
79
8585
8584
8484
8483
8383
8282
8282
8181
8181
80
8787
8786
8686
8585
8584
8484
8483
8383
8382
82
8989
8988
8888
8787
8786
8686
8585
8584
8484
84
9191
9090
9089
8989
8888
8887
8787
8686
8685
85
9393
9292
9291
9190
9090
8989
8988
8888
8787
87
9595
9494
9393
9392
9292
9191
9090
9089
8989
88
9797
9696
9595
9594
9493
9393
9292
9291
9190
90
9999
9898
9797
9796
9695
9595
9494
9393
9392
92
101
101
100
100
9999
9998
9898
9797
9696
9695
9594
94
103
103
102
102
102
101
101
100
100
100
9999
9998
9897
9797
96
106
105
105
105
104
104
103
103
103
102
102
101
101
101
100
100
9999
99
108
108
108
107
107
107
106
106
105
105
105
104
104
103
103
103
102
102
101
112
111
111
110
110
110
109
109
109
108
108
108
107
107
106
106
106
105
105
115
115
115
114
114
114
113
113
113
112
112
112
111
111
111
110
110
110
109
121
120
120
120
120
119
119
119
118
118
118
118
117
117
117
117
116
116
116
132
132
132
132
131
131
131
131
131
131
131
131
130
130
130
130
130
130
130

AGE STANDARDISED SCORES 15
This page has been left blank for your notes.
LEVEL THRESHOLD TABLES AND AGE STANDARDISED SCORES FOR KEY STAGE 2 TESTS IN ENGLISH, 16 MATHEMATICS AND SCIENCE
10.0
610
.07
10.0
810
.09
10.1
010
.11
11.0
011
.01
11.0
211
.03
11.0
411
.05
11.0
611
.07
11.0
811
.09
11.1
011
.11
1 2 3 4 5 6 7 8 9 10 11 12 13 14 15 16 17 18 19 20 21 22 23 24 25
Key
sta
ge
2 w
ritt
en m
athe
mat
ics
test
2007
26
Ag
e in
yea
rs a
nd m
ont
hs
Raw
sco
re10
.05
0**
***
***
***
***
***
***
***
***
***
***
***
***
***
***
***
***
***
***
*
7272
7272
7171
7171
7171
7171
7171
7170
7070
70
7473
7373
7373
7373
7373
7373
7272
7272
7272
72
7575
7474
7474
7474
7474
7474
7473
7373
7373
73
7575
7575
7575
7575
7575
7474
7474
7474
7474
74
7676
7676
7676
7575
7575
7575
7575
7575
7574
74
7676
7676
7676
7676
7676
7675
7575
7575
7575
75
7777
7777
7776
7676
7676
7676
7676
7676
7575
75
7777
7777
7777
7777
7776
7676
7676
7676
7676
76
7878
7777
7777
7777
7777
7777
7776
7676
7676
76
7878
7878
7877
7777
7777
7777
7777
7777
7676
76
7878
7878
7878
7878
7777
7777
7777
7777
7777
77
7878
7878
7878
7878
7878
7877
7777
7777
7777
77
7979
7878
7878
7878
7878
7878
7878
7777
7777
77
7979
7979
7978
7878
7878
7878
7878
7878
7777
77
7979
7979
7979
7978
7878
7878
7878
7878
7878
77
7979
7979
7979
7979
7979
7878
7878
7878
7878
78
8079
7979
7979
7979
7979
7979
7878
7878
7878
78
8080
8079
7979
7979
7979
7979
7979
7878
7878
78
8181
8080
8079
7979
7979
7979
7979
7979
7878
78
8282
8181
8080
8079
7979
7979
7979
7979
7979
78
8382
8281
8181
8080
8079
7979
7979
7979
7979
79
8383
8282
8281
8181
8080
8079
7979
7979
7979
79
8483
8383
8282
8281
8181
8080
8079
7979
7979
79
8484
8483
8383
8282
8281
8180
8080
7979
7979
79
8585
8484
8483
8382
8282
8181
8180
8080
7979
79
8685
8584
8484
8383
8382
8282
8181
8180
8080
79

AGE STANDARDISED SCORES 17
10.0
610
.07
10.0
810
.09
10.1
010
.11
11.0
011
.01
11.0
211
.03
11.0
411
.05
11.0
611
.07
11.0
811
.09
11.1
011
.11
27 28 29 30 31 32 33 34 35 36 37 38 39 40 41 42 43 44 45 46 47 48 49 50 51 52
Key
sta
ge
2 w
ritt
en m
athe
mat
ics
test
2007
53
Ag
e in
yea
rs a
nd m
ont
hs
Raw
sco
re10
.05
8686
8585
8584
8484
8383
8382
8281
8181
8080
80
8786
8686
8585
8484
8483
8383
8282
8281
8181
80
8787
8786
8685
8585
8484
8483
8383
8282
8281
81
8888
8787
8686
8685
8585
8484
8383
8382
8282
81
8988
8887
8787
8686
8585
8584
8484
8383
8382
82
8989
8888
8887
8786
8686
8585
8584
8483
8383
82
9090
8989
8888
8787
8786
8685
8585
8484
8483
83
9190
9089
8988
8888
8787
8686
8685
8584
8484
83
9191
9090
8989
8988
8887
8787
8686
8585
8584
84
9291
9191
9090
8989
8888
8887
8786
8686
8585
84
9292
9291
9190
9089
8989
8888
8787
8786
8685
85
9393
9292
9191
9090
9089
8988
8887
8787
8686
86
9493
9392
9292
9191
9090
8989
8888
8887
8786
86
9594
9493
9392
9291
9190
9090
8989
8888
8787
87
9595
9494
9393
9292
9191
9190
9089
8988
8888
87
9695
9594
9493
9393
9292
9191
9090
8989
8988
88
9796
9695
9594
9493
9392
9291
9190
9090
8989
88
9797
9696
9595
9494
9393
9292
9291
9190
9089
89
9897
9797
9696
9595
9494
9393
9292
9191
9090
90
9998
9897
9796
9695
9594
9493
9392
9291
9191
90
9999
9898
9797
9696
9595
9494
9493
9392
9291
91
100
9999
9998
9897
9796
9695
9594
9493
9392
9291
101
100
100
9999
9898
9797
9696
9595
9494
9493
9392
101
101
100
100
9999
9998
9897
9796
9695
9594
9493
93
102
101
101
101
100
100
9999
9898
9797
9696
9595
9494
94
103
102
102
101
101
100
100
9999
9998
9897
9796
9695
9594
103
103
102
102
102
101
101
100
100
9999
9898
9797
9696
9695

AGE STANDARDISED SCORES 18
10.0
610
.07
10.0
810
.09
10.1
010
.11
11.0
011
.01
11.0
211
.03
11.0
411
.05
11.0
611
.07
11.0
811
.09
11.1
011
.11
54 55 56 57 58 59 60 61 62 63 64 65 66 67 68 69 70 71 72 73 74 75 76 77 78 79
Key
sta
ge
2 w
ritt
en m
athe
mat
ics
test
2007
80
Ag
e in
yea
rs a
nd m
ont
hsR
aw s
core
10.0
5
104
104
103
103
102
102
101
101
100
100
100
9999
9898
9797
9696
105
104
104
103
103
103
102
102
101
101
100
100
9999
9898
9897
97
105
105
105
104
104
103
103
102
102
101
101
101
100
100
9999
9898
97
106
106
105
105
104
104
104
103
103
102
102
101
101
100
100
100
9999
98
107
107
106
106
105
105
104
104
103
103
103
102
102
101
101
100
100
9999
108
107
107
106
106
106
105
105
104
104
103
103
102
102
102
101
101
100
100
109
108
108
107
107
106
106
106
105
105
104
104
103
103
102
102
102
101
101
109
109
109
108
108
107
107
106
106
105
105
105
104
104
103
103
102
102
101
110
110
109
109
109
108
108
107
107
106
106
105
105
105
104
104
103
103
102
111
111
110
110
109
109
109
108
108
107
107
106
106
106
105
105
104
104
103
112
112
111
111
110
110
109
109
109
108
108
107
107
106
106
106
105
105
104
113
112
112
112
111
111
110
110
110
109
109
108
108
107
107
107
106
106
105
114
113
113
113
112
112
111
111
111
110
110
109
109
109
108
108
107
107
106
115
114
114
114
113
113
112
112
112
111
111
110
110
110
109
109
108
108
107
116
115
115
115
114
114
113
113
113
112
112
111
111
111
110
110
109
109
109
117
116
116
116
115
115
115
114
114
113
113
113
112
112
111
111
111
110
110
118
118
117
117
117
116
116
115
115
115
114
114
113
113
113
112
112
111
111
119
119
118
118
118
117
117
117
116
116
116
115
115
114
114
114
113
113
112
121
120
120
119
119
119
118
118
118
117
117
117
116
116
115
115
115
114
114
122
122
121
121
121
120
120
120
119
119
118
118
118
117
117
117
116
116
116
124
123
123
123
122
122
122
121
121
121
120
120
119
119
119
118
118
118
117
125
125
125
124
124
124
123
123
123
122
122
122
121
121
121
120
120
120
119
128
127
127
127
126
126
126
125
125
125
124
124
124
123
123
123
122
122
122
131
130
130
130
129
129
129
128
128
128
127
127
127
126
126
126
125
125
125
135
134
134
134
133
133
133
132
132
132
131
131
131
130
130
130
129
129
129
***
***
***
140
140
140
139
139
139
138
138
138
137
137
137
136
136
136
135
***
***
***
***
***
***
***
***
***
***
***
***
***
***
***
***
***
***
***

Fold out this flap to read the full table of age standardised scores for mathematics test A and test B.
AGE STANDARDISED SCORES 2007 19

29 Bolton StreetLondon W1J 8BTTelephone: 08700 60 60 40Minicom: 020 7509 6546Fax: 020 7509 5908Email: [email protected]: www.naa.org.uk/tests
About this publication
Who is it for?Headteachers and English, mathematics and science teachersof year 6 pupils.
What is it for?This booklet provides tables for converting test marks intonational curriculum levels and age standardised scores forthe reading test, mathematics test A and test B and the mental mathematics test.
Related materialsKey stage 2 Assessment and reporting arrangements.
For more copiesA PDF version of this booklet and the related materials listed above can be downloaded from the NAA website at www.naa.org.uk/tests.
QCA/07/3118The National Assessment Agency is part of the Qualifications and Curriculum Authority