
(Level 1 and Level 2) October 2017 - United Nations · ⁻ The basics of the “ecosystem services...
47
Supply of ecosystem services (Level 1 and Level 2) October 2017
-
Upload
truongduong -
Category
Documents
-
view
215 -
download
1
Transcript of (Level 1 and Level 2) October 2017 - United Nations · ⁻ The basics of the “ecosystem services...

Supply of ecosystem services
(Level 1 and Level 2)
October 2017
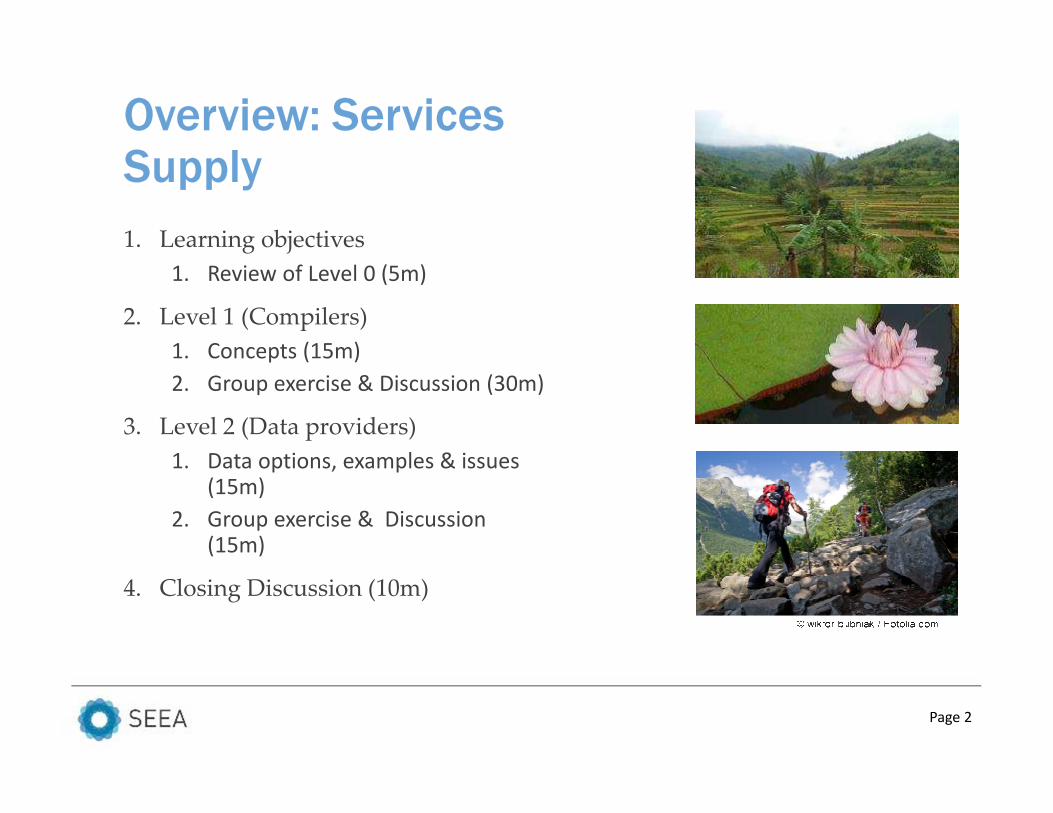
Overview: Services Supply
1. Learning objectives
1. Review of Level 0 (5m)
2. Level 1 (Compilers)
1. Concepts (15m)
2. Group exercise & Discussion (30m)
3. Level 2 (Data providers)
1. Data options, examples & issues (15m)
2. Group exercise & Discussion (15m)
4. Closing Discussion (10m)
Page 2

SEEA-EEA Training Levels 1 and 2
• Learning objectives
> Level 1: To understand:
⁻ Why accounting for Ecosystem Services is important
⁻ The basics of the “ecosystem services cascade” and the
difference between its components
⁻ How Services Supply is treated in the SEEA, including basic
concepts and the structure of the accounts that include
services
⁻ How to start to compile a Services Supply account
> Level 2:
⁻ Understand the data options and sources
⁻ Be aware of how other countries have approached Ecosystem
Services Supply
Page 3

Review of Level 0: Services Supply Account
Page 4

Services Supply
Page 5

Level 0: Account 3: Services Supply
• What?
• Physical flows of “final” ecosystem services from ecosystems to
beneficiaries
• Directly used by (or affect) people
• Why?
• Inform policies of contribution of ecosystems to human well-being
• Assess trade-offs between development and conservation
• Link to standard economic production measures in SNA
• Link to other SEEA-EEA accounts (Condition, Services Use, Monetary
Ecosystem Services; Ecosystem Monetary Asset valuation)
• Indicators:
• Flows of individual services (physical and monetary) � change
• Indices of aggregated services by ecosystem type � change
Page 6

Level 0: Account 3: Services Supply
Source: UK National Ecosystem Assessment (2011) Page 7
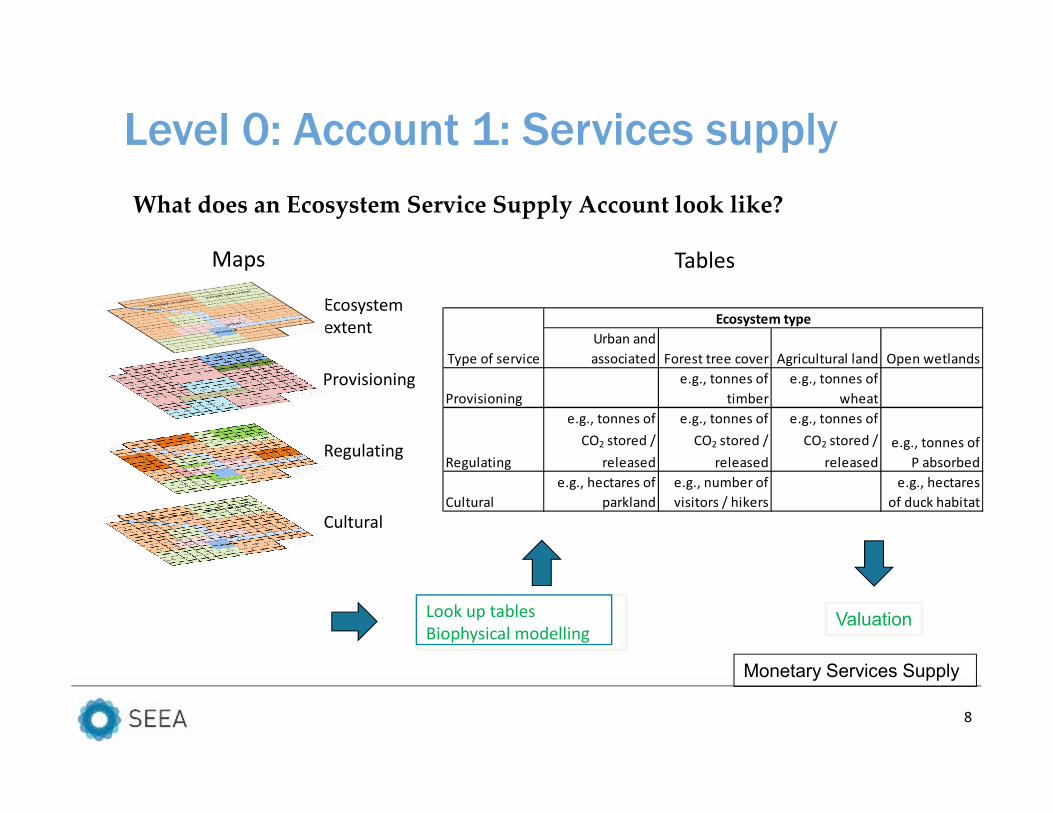
Level 0: Account 1: Services supply
What does an Ecosystem Service Supply Account look like?
Ecosystem
extent
Provisioning
Regulating
Maps Tables
Look up tables
Biophysical modelling
8
Urban and
associated Forest tree cover Agricultural land Open wetlands
Provisioning
e.g., tonnes of
timber
e.g., tonnes of
wheat
Regulating
e.g., tonnes of
CO2 stored /
released
e.g., tonnes of
CO2 stored /
released
e.g., tonnes of
CO2 stored /
released
e.g., tonnes of
P absorbed
Cultural
e.g., hectares of
parkland
e.g., number of
visitors / hikers
e.g., hectares
of duck habitat
Ecosystem type
Type of service
Cultural
Valuation
Monetary Services Supply

Level 0: Account 3: Services Supply
• Example (Services Supply in physical units)
Source: Remme et al., 2014 (Limburg, the Netherlands)
Page 9

Level 0: Account 3: Services Supply
• What does a Services Supply Account look like?
• Spatially-detailed physical measures of “final” services
according to a common Classification:
• Provisioning
• Regulating
• Cultural
• Physical measures (crops, flood control, clean drinking
water, carbon sequestration, recreation, …)
• Services supply account in physical terms forms the basis
for Valuation where appropriate and available
� Monetary Services Supply
Page 10
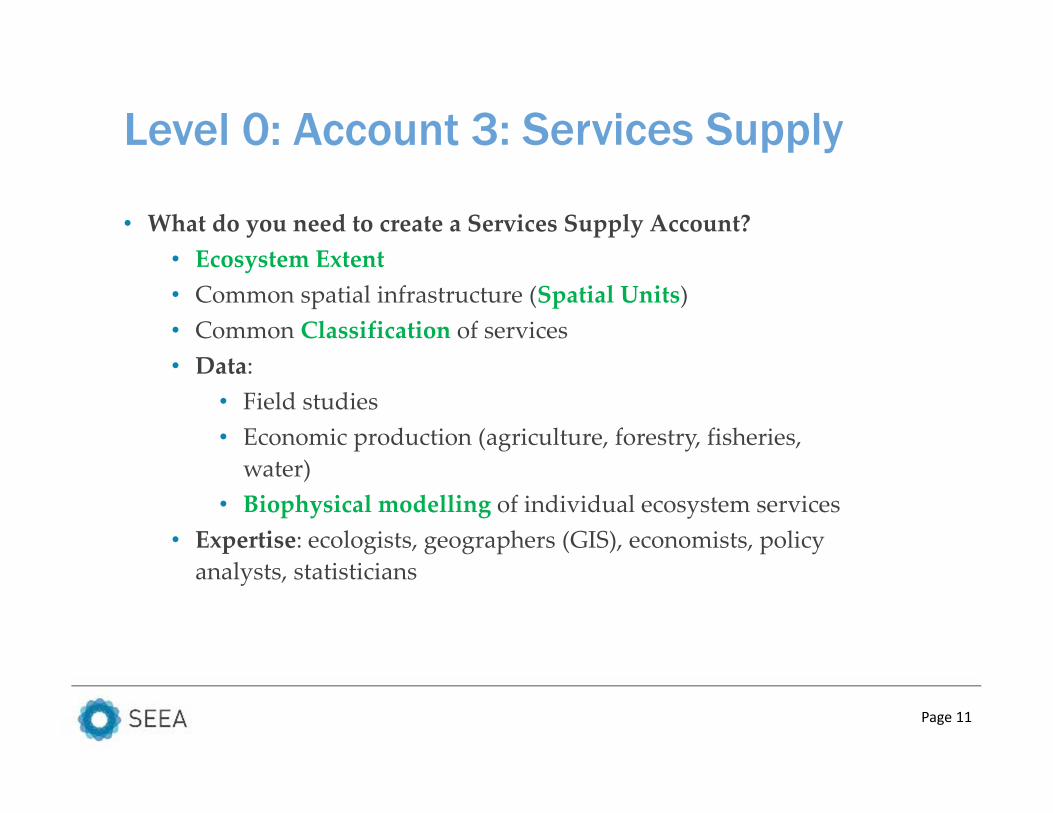
Level 0: Account 3: Services Supply
• What do you need to create a Services Supply Account?
• Ecosystem Extent
• Common spatial infrastructure (Spatial Units)
• Common Classification of services
• Data:
• Field studies
• Economic production (agriculture, forestry, fisheries,
water)
• Biophysical modelling of individual ecosystem services
• Expertise: ecologists, geographers (GIS), economists, policy
analysts, statisticians
Page 11
Level 1: Services Supply Account
Page 12

Level 1: Account 3: Services Supply
• Why Services Supply Accounts?
> Ecosystems provide services that are essential to the economy
and human activities:
⁻ Food supply
⁻ Clean water
⁻ Flood protection
⁻ Carbon sequestration
⁻ Recreation, cultural and religious importance
> Ecosystems are being converted and degraded
⁻ Which ones are most important to conserve?
⁻ How can they best be managed to maintain services?
⁻ Link with national planning and accounting to ensure
ecosystems are mainstreamed in decisions
Page 13
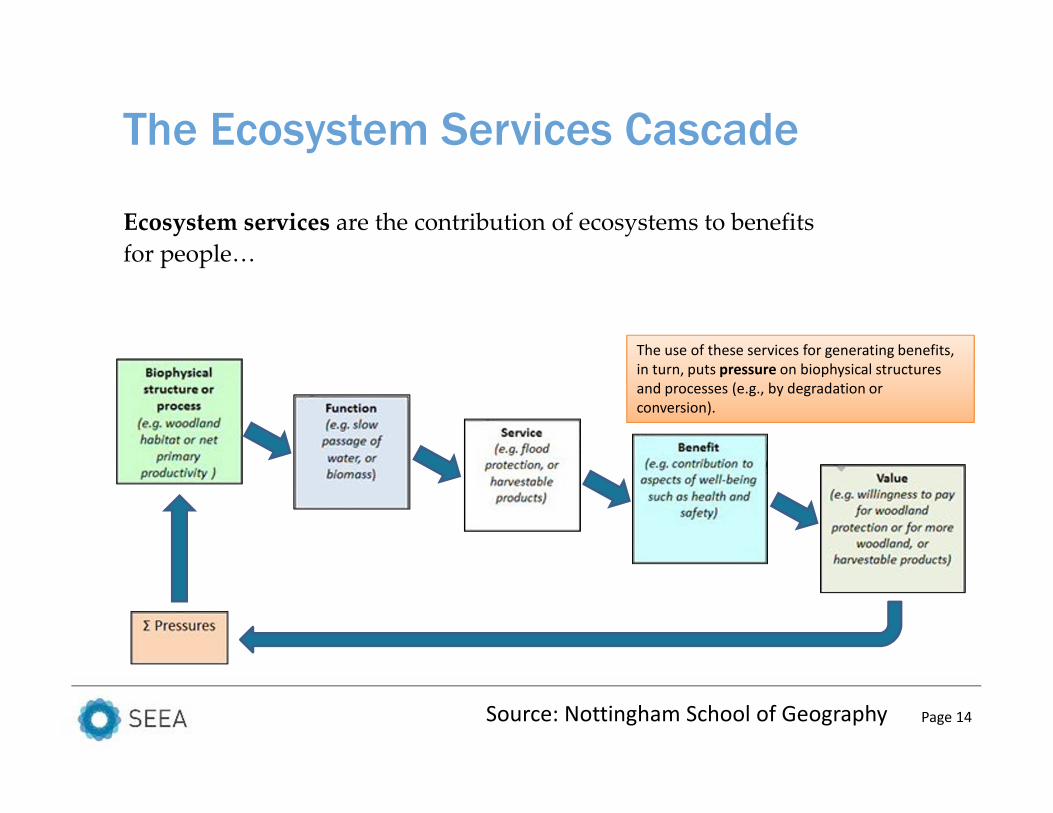
The Ecosystem Services Cascade
Ecosystem services are the contribution of ecosystems to benefits
for people…
The use of these services for generating benefits,
in turn, puts pressure on biophysical structures
and processes (e.g., by degradation or
conversion).
Source: Nottingham School of Geography Page 14

Ecosystem services (are not benefits)
Ecosystem ServiceEcosystem
Produced capital, labour
BenefitBenefits
Ecosystem services are the contribution of
ecosystems to benefits for people.
Beneficiary
Page 15

Level 1: Account 3: Services Supply
• Ecosystem services are the contribution of ecosystem to
benefits for people…
> They are not the benefits; benefits require capital and
labour to use
> We need to calculate the contribution of ecosystems, for
example:
Crops = f(nature, equipment, inputs, labour, energy…)
> To grow crops, nature provides biomass growth, nutrients,
water, flood control, pollination…
> Without these, there would be no crops.
> In the Services Supply Account, we measure the physical
services (e.g., the addition to biomass of the crop).
Page 16
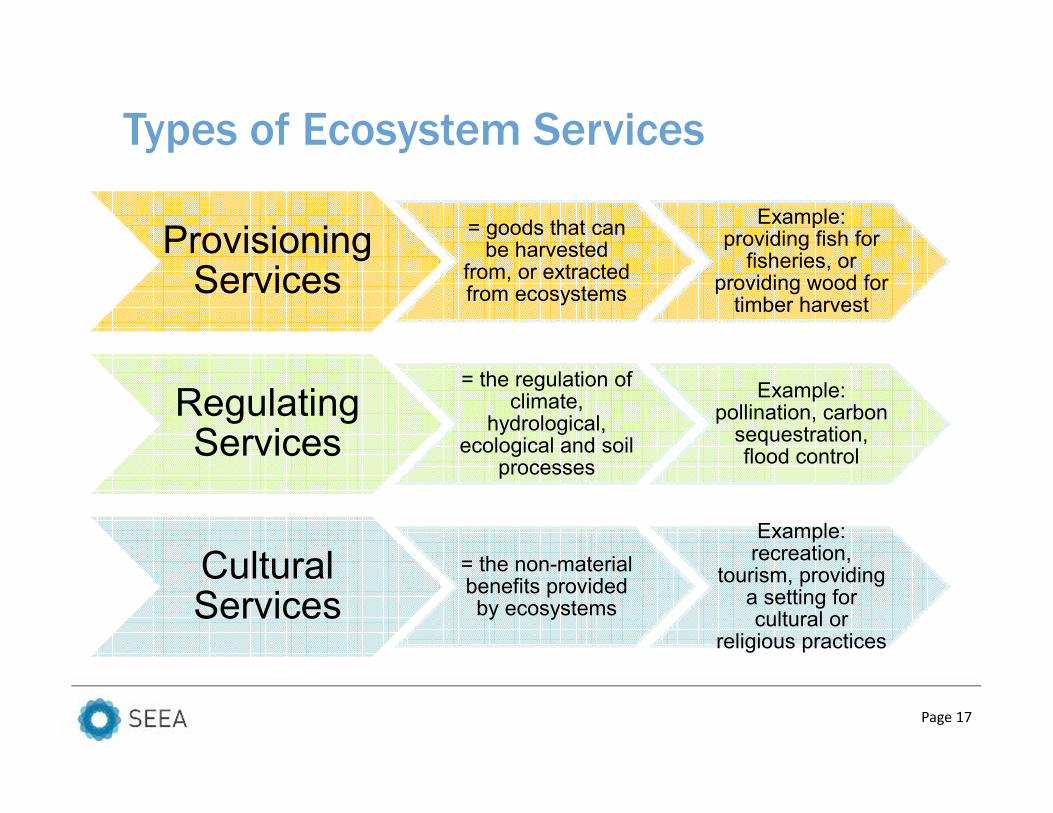
Types of Ecosystem Services
Provisioning Services
= goods that can be harvested
from, or extracted from ecosystems
Example: providing fish for
fisheries, or providing wood for
timber harvest
Regulating Services
= the regulation of climate,
hydrological, ecological and soil
processes
Example: pollination, carbon
sequestration, flood control
Cultural Services
= the non-material benefits provided by ecosystems
Example: recreation,
tourism, providing a setting for cultural or
religious practices
Page 17

Ecosystem services and maps
Hydrological function
Forest
Extensive pasture
Intensive cropland
Wood production
Crops
Carbon sequestration
Livestock production
Carbon sequestration
Carbon sequestration
Recreation and
tourism
Page 18

Level 1: Account 3: Services Supply
• The SEEA-EEA focuses on “final” services
> The point before human involvement transforms the services to
benefits
⁻ biomass � harvesting
⁻ fish � capture
> Ecosystem processes and functions are not final services
⁻ e.g., reproduction, predation, food web, nutrient cycle…
> Biodiversity itself is not a “final” service
⁻ It is an aspect of Ecosystem Condition and is recorded in the
Biodiversity Account.
Page 19
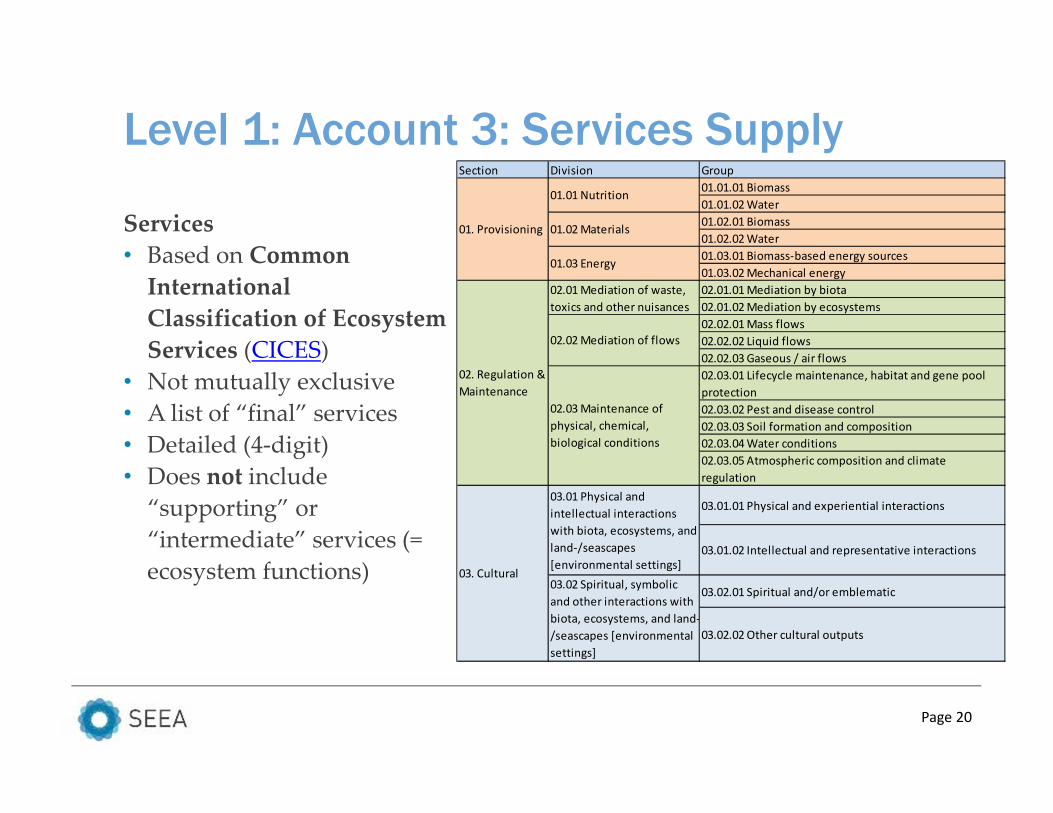
Level 1: Account 3: Services Supply
Services
• Based on Common
International
Classification of Ecosystem
Services (CICES)
• Not mutually exclusive
• A list of “final” services
• Detailed (4-digit)
• Does not include
“supporting” or
“intermediate” services (=
ecosystem functions)
Section Division Group
01.01.01 Biomass
01.01.02 Water
01.02.01 Biomass
01.02.02 Water
01.03.01 Biomass-based energy sources
01.03.02 Mechanical energy
02.01.01 Mediation by biota
02.01.02 Mediation by ecosystems
02.02.01 Mass flows
02.02.02 Liquid flows
02.02.03 Gaseous / air flows
02.03.01 Lifecycle maintenance, habitat and gene pool
protection
02.03.02 Pest and disease control
02.03.03 Soil formation and composition
02.03.04 Water conditions
02.03.05 Atmospheric composition and climate
regulation
03.01.01 Physical and experiential interactions
03.01.02 Intellectual and representative interactions
03.02.01 Spiritual and/or emblematic
03.02.02 Other cultural outputs
01. Provisioning
02. Regulation &
Maintenance
03. Cultural
01.01 Nutrition
01.02 Materials
01.03 Energy
02.01 Mediation of waste,
toxics and other nuisances
02.02 Mediation of flows
02.03 Maintenance of
physical, chemical,
biological conditions
03.01 Physical and
intellectual interactions
with biota, ecosystems, and
land-/seascapes
[environmental settings]
03.02 Spiritual, symbolic
and other interactions with
biota, ecosystems, and land-
/seascapes [environmental
settings]
Page 20

Level 1: Account 3: Services Supply
• How?
> Direct measure (e.g., socio-economic survey on
recreational use, field survey of available fish…)
> Remember Level 0 – Biophysical modelling?
⁻ Lookup tables: Take values from another location
⁻ Statistical approaches: Estimate based on known
explanatory variables
⁻ Geostatistical interpolation: Estimate from nearby
known locations
⁻ Process-based modelling: Use models of processes
(e.g., land cover change, demand for services…)
> The group exercise will use only Lookup Tables…
Page 21
Level 1: Account 3: Services Supply
• Compilation Group Exercise (30m)
• Situation:
• Know total services supply for some EAs
• Need to calculate:
• Missing services supply for missing EAs based on
known data and lookup table
• Objective (Groups of 3-5):
1. Calculate missing services
2. Calculate totals
3. Report and discuss results
Page 22

Level 1: Account 3: Services Supply
Services Supply Database
(C)
Crop
(R)
Recreation
(W)
Water
tonnes/year trips/year m3/year
tonnes
/ha/year
tonnes
/year
EA01 = Herbaceous crops 500.0 18,700.0 500.0 600.0 20
EA02 = Tree covered areas 262.5 0.0 1,500.0 500.0 30
EA03 = Inland water bodies 68.8 0.0 1,600.0 15,000.0 5
EA04 = Herbaceous crops 281.3 20
EA05 = Tree covered areas 75.0 30
EA06 = Artificial surfaces (urban) 56.3 0.0 500.0 500.0 0
EA07 = Artificial surfaces (urban) 68.8 0.0 700.0 400.0 0
EA08 = Shrubs..regularly flooded (wetland) 37.5 700.0 5,000.0 10,000.0 40
EA09 = Inland water bodies 50.0 5
EA10 = Tree covered areas 225.0 30
EA11 = Herbaceous crops 175.0 20
Total 1,800.0 0
Extent
(ha)EU
(S) Carbon
Sequestration
e.g., Crop for EU04 =
(18,700 / 500) * 281.3
e.g., Carbon for EU04 =
(500 * 20)
Group Exercise: Step 1 – Calculate unknown services
Page 23
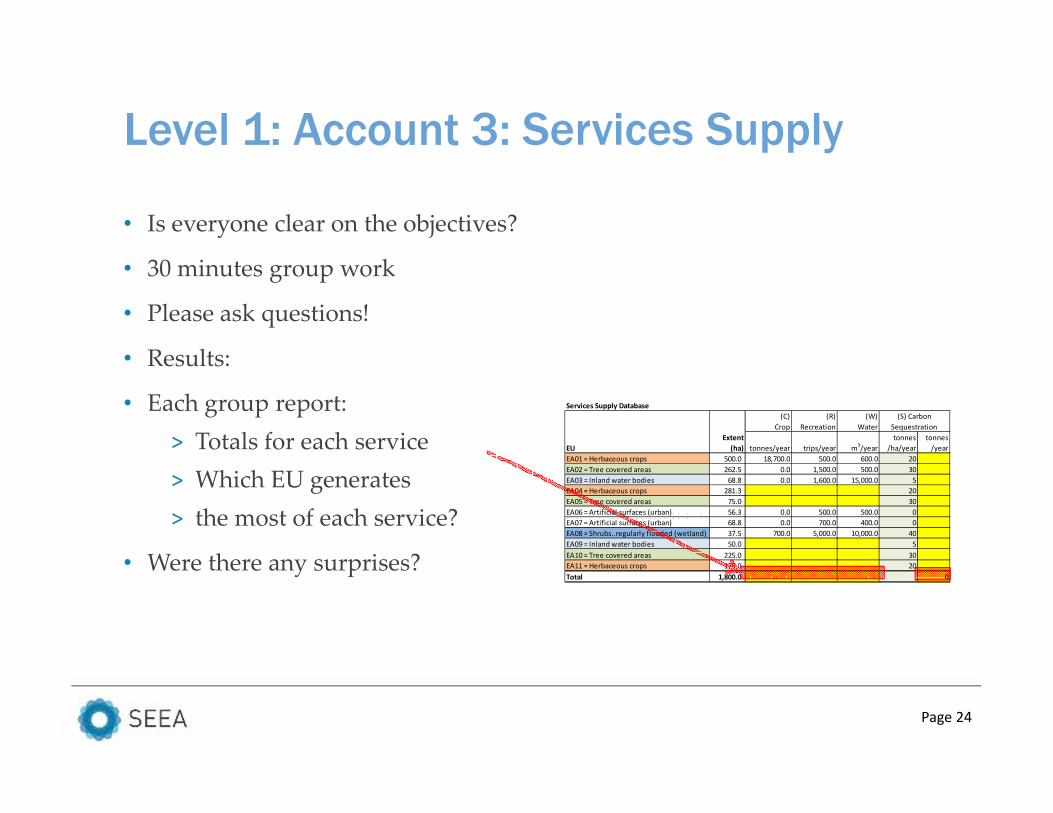
Level 1: Account 3: Services Supply
• Is everyone clear on the objectives?
• 30 minutes group work
• Please ask questions!
• Results:
• Each group report:
> Totals for each service
> Which EU generates
> the most of each service?
• Were there any surprises?
Services Supply Database
(C)
Crop
(R)
Recreation
(W)
Water
tonnes/year trips/year m3/year
tonnes
/ha/year
tonnes
/year
EA01 = Herbaceous crops 500.0 18,700.0 500.0 600.0 20
EA02 = Tree covered areas 262.5 0.0 1,500.0 500.0 30
EA03 = Inland water bodies 68.8 0.0 1,600.0 15,000.0 5
EA04 = Herbaceous crops 281.3 20
EA05 = Tree covered areas 75.0 30
EA06 = Artificial surfaces (urban) 56.3 0.0 500.0 500.0 0
EA07 = Artificial surfaces (urban) 68.8 0.0 700.0 400.0 0
EA08 = Shrubs..regularly flooded (wetland) 37.5 700.0 5,000.0 10,000.0 40
EA09 = Inland water bodies 50.0 5
EA10 = Tree covered areas 225.0 30
EA11 = Herbaceous crops 175.0 20
Total 1,800.0 0
Extent
(ha)EU
(S) Carbon
Sequestration
Page 24

Level 1: Account 3: Services Supply
The answers:
EA01 generates the most services for Crop and Carbon Sequestration.
EA03 generates the most services for Water
EA08 generates the most services for Recreation
Services Supply Database
(C)
Crop
(R)
Recreation
(W)
Water
tonnes/year trips/year m3/year
tonnes
/ha/year
tonnes
/year
EA01 = Herbaceous crops 500.0 18,700.0 500.0 600.0 20 10,000
EA02 = Tree covered areas 262.5 0.0 1,500.0 500.0 30 7,875
EA03 = Inland water bodies 68.8 0.0 1,600.0 15,000.0 5 344
EA04 = Herbaceous crops 281.3 10,518.8 281.3 337.5 20 5,625
EA05 = Tree covered areas 75.0 0.0 428.6 142.9 30 2,250
EA06 = Artificial surfaces (urban) 56.3 0.0 500.0 500.0 0 0
EA07 = Artificial surfaces (urban) 68.8 0.0 700.0 400.0 0 0
EA08 = Shrubs..regularly flooded (wetland) 37.5 700.0 5,000.0 10,000.0 40 1,500
EA09 = Inland water bodies 50.0 0.0 1,163.6 10,909.1 5 250
EA10 = Tree covered areas 225.0 0.0 1,285.7 428.6 30 6,750
EA11 = Herbaceous crops 175.0 6,545.0 175.0 210.0 20 3,500
Total 1,800.0 36,463.8 13,134.2 39,028.0 38,094
Extent
(ha)EU
(S) Carbon
Sequestration
Page 25
Level 2: Services Supply Account
Page 26

Level 2: Account 3: Services Supply
• Learning objectives (Level 2)
> Understand the data options and sources
> Be aware of how other countries have approached Services
Supply Accounting
Page 27

Level 2: Account 3: Services Supply
• A full Services Supply Account is more complex than the
exercise:
> More services (48 “final” services in CICES)
> More types of data (tonnes, risks, visitors, air quality,
cultural significance…)
> Less measured data � need models to estimate
> High variability among ecosystem types and region (e.g.,
salt marsh carbon = 650 to 1750 tCO2/ha/year)
• Do not need to include all services:
> High priority services � measure or estimate
> Get started with available data
Page 28

Example - SA
• Example from South Africa:
Durban area
• Map shows annual sustainable
fuelwood output (m3/ha) from
different habitats
• In the absence of local data,
cubic volume of wood for
estimated using the following
simplified equation
• Volume (m^3/ha) = basal area
(m^2/ha)×canopy height (m)/3
• A sustainable yield of 3% of
standing crop applied for all
vegetation classes
Source: Turpie et al, 2017 Page 29

Example - SA
• Example from South Africa, Durban area
• Estimated annual sustainable hunting
output (kg/ha) across the EMA
• Based on various studies,
• In total: 26 000 kg of wild meat and birds
with a total estimated value of R565 500
• Forest, thicket and woodland habitats are
estimated to be able to supply the
majority of this output.
• Based on sustainable offtake levels, do
not consider illegal hunting
• Highest levels of output associated with
habitats in outer-west and southern
regions where natural habitat patches are
larger, less fragmented and on
communal land
Source: Turpie et al, 2017 Page 30
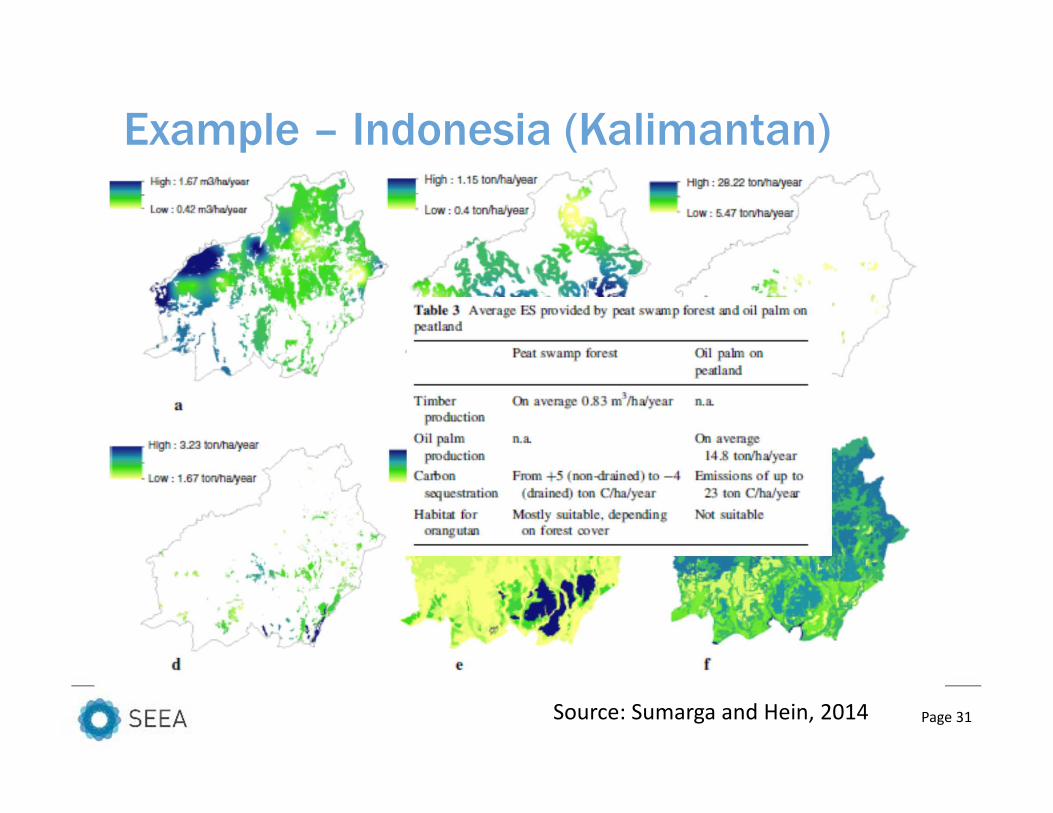
Example – Indonesia (Kalimantan)
Source: Sumarga and Hein, 2014 Page 31

Ecosystem services in an account
• Ecosystem service account developed for Limburg Province,
the Netherlands
• 2200 km2, 1.1 million inhabitants
• Analysis of 7 ecosystem services
Source: Remme et al., 2014 (Limburg, the Netherlands) Page 32

Level 2: Account 3: Services Supply
• Example (services in physical units)
Source: Remme et al., 2014 (Limburg, the Netherlands)
Note: Units of measure are very different
Page 33
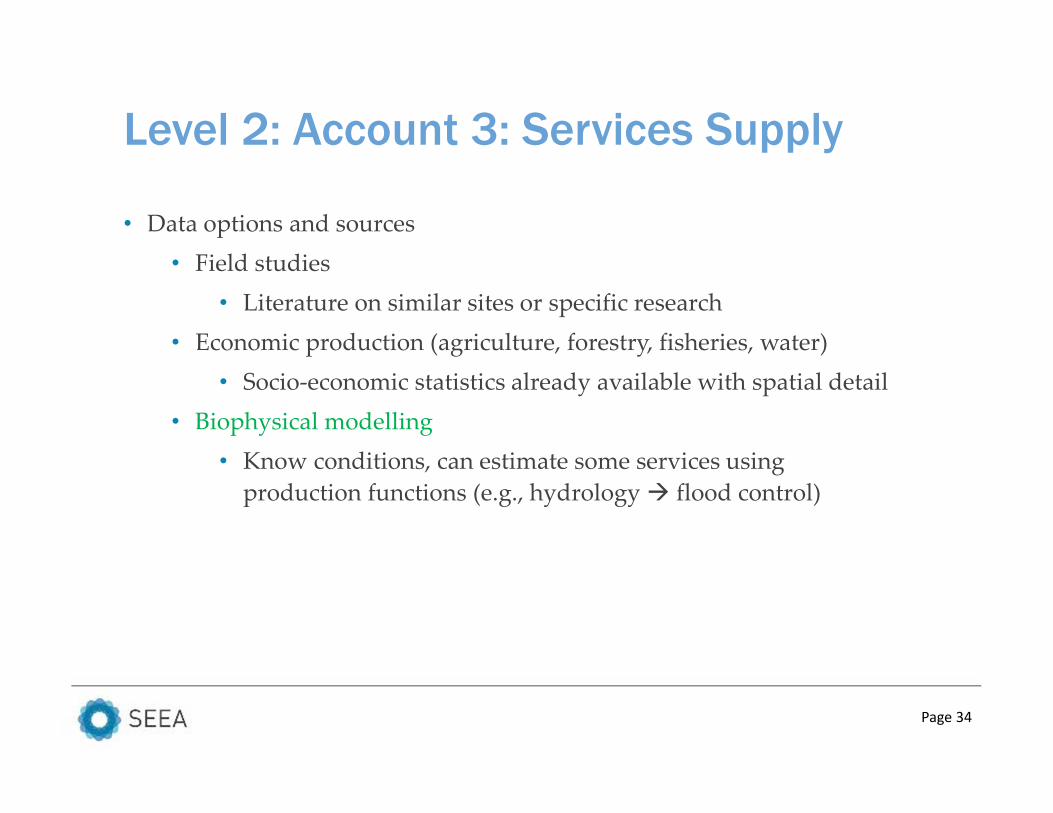
Level 2: Account 3: Services Supply
• Data options and sources
• Field studies
• Literature on similar sites or specific research
• Economic production (agriculture, forestry, fisheries, water)
• Socio-economic statistics already available with spatial detail
• Biophysical modelling
• Know conditions, can estimate some services using
production functions (e.g., hydrology � flood control)
Page 34

Level 2: Account 3: Services Supply
Canada Example
Water purification potential
change by drainage area for
boreal wetlands
Index based on:% forest cover% agricultural land% riparian forest% wetlands% anthropogenic disturbance% burn areaEdge & linear density (fragmentation)Human footprintSlopeNitrogen & Sulphur exceedance (from atmospheric deposition)
Source: Statistics Canada, 2013Page 35

Level 2: Account 3: Services Supply
Canada example
Weight of commercial fish
landings by marine statistical
area
Includes:
• Groundfish
• Pelagic fish
• Shellfish
Also done for west coast
Statistical area defined by Ministry
of Fisheries and Oceans
Level 2: Account 3: Services SupplyPage 36

Level 2: Account 3: Services Supply
• Some services flow data are available
Page 37
Level 2: Account 3: Services Supply
• Data sources: Socio-economic statistics
> Agricultural statistics: crop, livestock production
> Energy statistics: biomass for fuel
> Fisheries statistics: catch, stock
> Forestry statistics: timber stock, harvest
> Park surveys: visitors, use
> Water statistics: withdrawals, consumption
> Natural disasters: incidence of floods, erosion, storms
> Soil inventories: erosion potential
> Health statistics: regulation of biotic environment
• Best if they are national and good quality
Page 38

Level 2: Account 3: Services Supply
• Data sources: Environmental statistics
> Iconic species ranges & habitats
> Land cover � carbon sequestration, air filtration
> Hydrology & weather data: Flow rates, variability � flood risk
> Topography, land cover, soil & weather data � erosion and
landslide risk
> Carbon storage and sequestration (see Carbon Accounts)
> Remote sensing � primary production
• Best if they are national and good quality
Page 39

Level 2: Account 3: Services Supply
• Data sources: Specific studies & models
> These may not be included in valuation databases
> Specific studies:
⁻ National or regional ecosystem assessments (Millennium
Ecosystem Assessment, UK National Ecosystem Assessment)
⁻ Small-area studies (e.g., one park, one region)
⁻ TEEB studies and country studies (multiple ecosystems and
services)
> Decision-support models:
⁻ There are landscape-scale and site-scale models that can help
estimate service flows (AIRES, InVEST, LUCI…)
⁻ See Biophysical Modelling
Page 40

Level 2: Account 3: Services Supply
• Data sources: Special surveys and case studies
> High-priority data gaps may also be addressed by collecting new
data
⁻ Ecological field studies to determine “production functions”
⁻ Socio-economic surveys to determine use of services (e.g.,
water, food, recreation)
⁻ Case-studies for specific locations or social groups (e.g.,
dependence on nature of low-income residents)
> If possible, add questions to existing surveys, for example,
⁻ Households use of water, source of food, incidence of
hazards (flooding, erosion, drought, disease), source of
biomass for fuel
Page 41

Level 2: Account 3: Services Supply
Group exercise (15m)
(Groups of 3-5)
1. In your country (or region), what are three important
ecosystem services that should be included in a Services
Supply Account?
2. Which ecosystem types supply them?
3. What national data are available in your country on the
supply of these services?
4. Report your results
Page 42

Level 2: Account 3: Services Supply
• Concepts Group exercise (15m)
• Group reports
> The ecosystem services you selected
> The main land cover types for each
> Are national data available in your country on the
supply of these services?
• Discussion
> What other ecosystem services would be important to
measure?
> On what topic might a special survey be used to fill
priority data gaps?
Page 43

Level 2: Account 3: Services Supply
• Discussion and questions
• Take home points
> Services Supply in biophysical terms is one of the most
important aspects of ecosystem accounting
> Data on Services Supply are available from many sources
> There are some simple methods and models available to
integrate these data and fill gaps
> Start by focussing on available data and priority services
Page 44

References
• CICES, 2013. www.cices.eu
• European Commission, Organisation for Economic Co-operation and Development, United
Nations and World Bank 2013, SEEA Experimental Ecosystem Accounting,
http://unstats.un.org/unsd/envaccounting/seeaRev/eea_final_en.pdf
• Maes, J., Paracchini, M.L. and Zulian, G., 2011. A European assessment of the provision of ecosystem
services: Towards an atlas of ecosystem services. Luxembourg: European Commission Joint Research
Centre-Institute for Environment and Sustainability.
• Malouin, C., Doyle, M. and Liss, K., 2013. Toward an Ecosystem Potential Index for Canada
(EPIC): A Boreal Case Study. ResearchGate.net.
• Nottingham School of Geography, nd, Nature’s services in decision making.
http://nottingham.ac.uk/geography/research/impact/natures-services.aspx
• Remme, Roy P., Matthias Schröter, and Lars Hein. Developing spatial biophysical accounting for
multiple ecosystem services. Ecosystem Services 10 (2014): 6-18.
• Statistics Canada, 2013. Human Activity and the Environment: Measuring Ecosystem Goods and
Services 2013. 16-201-XWE. Ottawa: Government of Canada.
Page 45

Level 2: Account 3: Services Supply
• Further Information
> SEEA Experimental Ecosystem Accounting (2012)
> SEEA-EEA Technical Guidance
⁻ Detailed supporting documents
⁻ “Linkages between ecosystem service accounts and
ecosystems asset accounts” and
⁻ “Biophysical Modelling and Analysis of Ecosystem
Services in an Ecosystem Accounting Context” by Lars
Hein
Page 46
Acknowledgements
These materials have been developed in partnership with various
organizations including the United Nations Statistics Division,
UN Environment, the Convention on Biological Diversity,
supported by the Norwegian Ministry of Foreign Affairs, and the
European Union.
Page 47


