Lessons L.earned from Modeling the Dynamics of Software
12
ARTICLES Management of Computing Lessons L.earned Robert Zmud Editor from Modeling the Dynamics of Software Development Software systems development has been plagued by cost overruns, late deliveries, poor reliability, and user dissatisfaction. This article presents a paradigm for the study of software project management that is grounded in the feedback systems principles of system dynamics. Tarek K. Abdel-Hamid and Stuart E. Madnick The :impressive improvements that are continuously being made in the cost-effectiveness of computer hard- ware are causing an enormous expansion in the num- ber of applications for which computing is becoming a feasible and economical solution. This, in turn, is plac- ing greater and greater demands for the development and operation of computer software systems. A conser- vative estimate indicates a hundredfold increase in the demand for software in the last two decades [32]. The growth of the software industry has not, how- ever, been painless. The record shows that the develop- ment of software has been marked by cost overruns, late deliveries, poor reliability, and users’ dissatisfac- tion [16, 34, 411. In an effort to bring discipline to the development of software systems, attempts have been made since the early 1970s to apply the rigors of science and engineer- ing to the software production process. This led to sig- nificant advances in the technology of software production (e.g., structured programming, structured design, formal verification, language design for more relia’ble coding, diagnostic compilers). The managerial aspects of software development, on the other hand, have attracted much less attention from the research community [51]. Cooper [17] pro- vides an insightful explanation for the reasons why: Perhaps this is so because computer scientists believe that management per se is not their business, and the management professionals assume that it is the com- puter scientists’ responsibility. This “deficiency” in the field’s research repertoire may account for the persistence of the difficulties in producing software systems. A chief concern expressed is that, as of yet, we still lack a fundamental under- O1989ACM 0001.0782/R9/~200-1426 51.50 1426 Comlnunications of the ACM standing of the software development process. Without such an understanding the possibility or 1ikeIihood of any significant gains on the managerial front is ques- tionable [13, 301. This article reports on a stream of research designed to address these concerns. Specifically, our goal is to develop a comprehensive model of the dymnnics of software development that enhances our understanding of, provides insight into, and makes predictions about the process by which software development is man- aged. The following examples illustrate some of the critical management decisions that have been ad- dressed in this research effort: I. A project is behind schedule. Possible manage- ment actions include: revise completion date; hold to planned completion date, but hire more staff; hold to planned completion date, but work current staff overtime, etc. What are the implications of these alternatives? 2. How much of the development effort should be expended on quality assurance and how does that affect completion time and total cost? 3. What is the impact of different effort distributions among project phases (e.g., should the ratio cd effort between development and testing be 80 : 20 or 60 : 40)? 4. What are the reasons for and implications of the differences between potential productivity, actual pro- ductivity, and perceived productivity? 5. Why does the “90% completion syndrome” chroni- cally recur? In the rest of this article we discuss the integrative dynamic model of software project managem.ent that has been developed. We will provide an overview of both the model’s structure and its behavior followed by a discussion of the insights gained. We begin our pre- December 1989 Volume 32 Number 12
Transcript of Lessons L.earned from Modeling the Dynamics of Software
ARTICLES
Management of Computing Lessons L.earned Robert Zmud Editor from Modeling the
Dynamics of Software Development Software systems development has been plagued by cost overruns, late deliveries, poor reliability, and user dissatisfaction. This article presents a paradigm for the study of software project management that is grounded in the feedback systems principles of system dynamics.
Tarek K. Abdel-Hamid and Stuart E. Madnick
The :impressive improvements that are continuously being made in the cost-effectiveness of computer hard- ware are causing an enormous expansion in the num- ber of applications for which computing is becoming a feasible and economical solution. This, in turn, is plac- ing greater and greater demands for the development and operation of computer software systems. A conser- vative estimate indicates a hundredfold increase in the demand for software in the last two decades [32].
The growth of the software industry has not, how- ever, been painless. The record shows that the develop- ment of software has been marked by cost overruns, late deliveries, poor reliability, and users’ dissatisfac- tion [16, 34, 411.
In an effort to bring discipline to the development of software systems, attempts have been made since the early 1970s to apply the rigors of science and engineer- ing to the software production process. This led to sig- nificant advances in the technology of software production (e.g., structured programming, structured design, formal verification, language design for more relia’ble coding, diagnostic compilers).
The managerial aspects of software development, on the other hand, have attracted much less attention from the research community [51]. Cooper [17] pro- vides an insightful explanation for the reasons why:
Perhaps this is so because computer scientists believe that management per se is not their business, and the management professionals assume that it is the com- puter scientists’ responsibility.
This “deficiency” in the field’s research repertoire may account for the persistence of the difficulties in producing software systems. A chief concern expressed is that, as of yet, we still lack a fundamental under-
O1989ACM 0001.0782/R9/~200-1426 51.50
1426 Comlnunications of the ACM
standing of the software development process. Without such an understanding the possibility or 1ikeIihood of any significant gains on the managerial front is ques- tionable [13, 301.
This article reports on a stream of research designed to address these concerns. Specifically, our goal is to develop a comprehensive model of the dymnnics of software development that enhances our understanding of, provides insight into, and makes predictions about the process by which software development is man- aged. The following examples illustrate some of the critical management decisions that have been ad- dressed in this research effort:
I. A project is behind schedule. Possible manage- ment actions include: revise completion date; hold to planned completion date, but hire more staff; hold to planned completion date, but work current staff overtime, etc. What are the implications of these alternatives?
2. How much of the development effort should be expended on quality assurance and how does that affect completion time and total cost?
3. What is the impact of different effort distributions among project phases (e.g., should the ratio cd effort between development and testing be 80 : 20 or 60 : 40)?
4. What are the reasons for and implications of the differences between potential productivity, actual pro- ductivity, and perceived productivity?
5. Why does the “90% completion syndrome” chroni- cally recur?
In the rest of this article we discuss the integrative dynamic model of software project managem.ent that has been developed. We will provide an overview of both the model’s structure and its behavior followed by a discussion of the insights gained. We begin our pre-
December 1989 Volume 32 Number 12

sentation, however, by first presenting arguments for the necessity of an integrative and dynamic modeling approach in the study of software project management.
THE HIGH COMPLEXITY OF THE SOFTWARE PROJECT MANAGEMENT PROCESS A simple view of the dynamics of project management is illustrated by the single-loop model shown in Fig- ure 1 [45]. The model portrays how project work is accomplished through the use of project resources (manpower, facilities, equipment; see item 1 in Fig- ure I). As work (2) is accomplished on the project, it is reported (3) through some project control system. Such reports cumulate and are processed to create the proj- ect’s forecast completion time (4) by adding to the cur- rent date the indicated time remaining on the job. As- sessing the job’s remaining time involves figuring out the magnitude of the effort (e.g., in man-days) believed by management to be remaining to complete the proj- ect, the level of manpower working on the project, and the perceived productivity of the project team. The feedback loop is completed (closed) as the difference, if any, between the scheduled completion date (5) and the forecast completion date (4) causes adjustments (6) in the magnitude or allocation of the project’s resources (1). This new level of resources results in a new work rate (2) and the loop is repeated again.
What is attractive about the above model is that it is reasonable, simple, and manageable. It is the mental model that many project managers rely on [45]. But is it an adequate model of the dynamics of software project management?
The software project management system is a far more complex conglomerate of interdependent vari- ables that are interrelated in various nonlinear fash- ions. By excluding vital aspects of the real software project environment, the model depicted in Figure 1 could seriously misguide the unsuspecting software manager. To see how, let us consider just a few of the many typical decisions pondered in a software project environment.
Adding More People to a Late Project. The mental pic- ture of Figure 1 suggests a direct relationship between adding people resources and increasing the rate of work on the project, i.e., the higher the level of project re- sources, the higher the work rate. This ignores one vital aspect of software project dynamics, namely, that add- ing more people often leads to higher communication and training overheads on the project, which can in turn dilute the project team’s productivity. Lower pro- ductivity translates into lower progress rates, which can, therefore, delay the late project even further. This, in turn, can trigger an additional round of work force additions and another pass around this vicious cycle. These dynamic forces create the phenomenon often re- ferred to as Brooks’ Law, i.e., adding more people to a late software project makes it later [Is]. In Figure 2a we, therefore, amend Figure 1 by incorporating the vi- tal link between the work force level and productivity.
0 5 SCHEOULED COidPlEllON DATE 0 1
0 1
6 RESouRCE cHANGE ’ PEOPLE (I OTHER
ALLOCATION DECtSlON - PROjECt RESOURCES
A
0 +
2 WORKRATE
3 0 4 FORECASTCOMPLETION 01 DATE .p REPORTEO PROGRESS
FIGURE 1. A Model of Software Project Management
Adjusting the Schedule of a Late Project. Another part of the real system that is ignored by Figure 1 concerns the impact of schedule pressures on the software devel- opers’ actions and decisions. For example, when faced with schedule pressures that arise as a project falls be- hind schedule, software developers typically respond by putting in longer hours and by concentrating more on the essential tasks of the job [25]. In one experi- ment, Boehm [14] found that the number of man-hours devoted to project work increased by as much as 100 percent. This additional link between schedule pres- sure and productivity is captured in Figure 2b.
The impact of schedule pressures on software devel- opment, however, is not limited to the above relatively direct role. Schedule pressures can also play less visible roles. For example, as Figure 2c suggests, schedule pressures can increase the error rate of the project team and thus the amount of rework on the project [31,40].
People under time pressure don’t work better, they just work faster. . . . In the struggle to deliver any software at all, the first casuality has been consid- eration of the quality of the software delivered [19, p. 341.
The rework necessary to correct such software errors obviously diverts the project team’s effort from making progress on new project tasks, and thus can have a significant negative impact on the project’s progress rate.
How Late is a Late Software Project? Because software remains largely intangible during most of the develop- ment process, it is often difficult for project managers to assess real progress on the project [12]. To the extent that the perceived progress rate differs from the real progress rate, an error in perceived cumulative progress will gradually accumulate (Figure 2d). Furthermore, bias, often in the form of overoptimism, and delay in gathering and processing control information addition- ally distorts the reported progress. This undoubtedly
Articles
December 1989 Volume 32 Number 12 Communications of the ACM 1427

Articles
RESOURC ALLOartt
WORk RATE
HlREcAsl COMPI DATE
RESOURCI +AP ALLOCAfk OEf
I FORECAST ( IPL
OATE
-
SCHtOUlEDCOMPLETION OAtE
I ’ \
RESOURC ALLOCATI
* :E: c ION
PEOPLE L OTMR PRO%? RESOURCES
-, REAL PROGRESS
I .-
PERCElVEO r t
PR6GRESS ‘nt FORECASTCOMPLETION up REPORTEOPROCRESS DATE l
‘.-* REPORTED PROG2ESS
.-’ *
BIAS~OELAY e* j
(c) .,’
IX ‘. _’ (4
FIGURE 2. Amendments to the Project Management Model
poses yet another complication that is too real for the software project manager to exclude from a model of the process.
AN INTEGRATIVE SYSTEM DYNAMICS PERSPECTIVE OF SOFTWARE DEVELOPMENT While the preceding discussion is still far less than a complete picture, it does illustrate that many variables, both tangible and intangible, impact the software devel- opment process. Furthermore, these variables are not
independent, but are related to one another in complex fashions. Perhaps most importantly, understanding the behavior of such systems is complex far beyond the capacity of human intuition [45].
A major deficiency in much of the resea& to date on software project management has been thfa inability to integrate our knowledge of the microcomponents of the software development process such as scheduling, productivity, and staffing to derive implications about the behavior of the total socio-technical system. In the
1420 Communications of the ACM December 1989 Volume 32 Number 12

Articles
research effort described in this article we build upon and extend what has been learned about the micro- components, to construct a holistic model of the soft- ware development process. It integrates the multiple functions of software development, including both the management-type functions (e.g., planning, controlling, staffing) as well as the software production-type activi- ties (e.g., designing, coding, reviewing, testing).
A second unique feature of our modeling approach is the use of the feedback principles of system dynamics to structure and clarify the complex web of dynami- cally interacting variables. Feedback is the process in which an action taken by a person or thing will eventu- ally affect that person or thing. Examples of such feed- back systems in the software project environment have already been demonstrated in the preceding discussion and are evident in Figures 1 and 2.
The significance and applicability of the feedback systems concept to managerial systems has been sub- stantiated by a large number of studies [45]. For exam- ple, Weick [49, p. 71 observes that
The cause-effect relationships that exist in organiza- tions are dense and often circular. Sometimes these causal circuits cancel the influences of one variable on another, and sometimes they amplify the effects of one variable on another. It is the network of causal relationships that impose many of the controls in organizations and that stabilize or disrupt the orga- nization. It is the patterns of these causal links that account for much of what happens in organizations. Though not directly visible, these causal patterns account for more of what happens in organizations than do some of the more visible elements such as machinery, timeclocks, . . . ,
One of the pioneering works in the field is Roberts’ [44] published doctoral dissertation, which involved the development of a comprehensive system dynamics model of R&D project management. The model traces the full life cycle of a single R&D project and incorpo- rates the interactions between the R&D product, the firm, and the customer. Roberts’ work spurred a large number of system dynamics studies of project manage- ment phenomena. For example, Nay [33] and Kelly [26] extended Roberts’ work in their research on multi- project environments. Richardson [42] took a different tack, focusing on the development group. His model reproduces the dynamics of a development group over an eight-year period as a continuous stream of products are developed and placed into production.
While the bulk of the system dynamics modeling work in the project management area has been devoted to the R&D environment, the applicability of the meth- odology to the domain of software production has been alluded to in the literature (e.g., [24, 28, 391). Perhaps this should come as no surprise, since “the stages of research and development are similar in many respects to the stages of software analysis and design” [23]. In the remainder of this section we describe how the sys-
tem dynamics modeling technique was extended to the software project domain.
Model Development and Structure The model was developed on the basis of a field study of software project managers in five organizations. The process involved three information gathering steps:
First, we conducted a series of interviews with soft- ware development project managers in three organiza- tions. The purpose of this set of interviews was to pro- vide us with a first-hand account of how software projects are currently managed in software developing organizations. The information collected in this phase, complemented with our own software development ex- perience, formed the basis for formulating a skeleton system dynamics model of software project manage- ment.
The second step was to conduct an extensive review of the literature. The skeleton model served as a useful road map in carrying out this literature review. When this exercise was completed, many knowledge gaps were filled, giving rise to a second much more detailed version of the model.
In the third, and final step:
The model is exposed to criticism, revised, exposed again and so on in an iterative process that continues as it proves to be useful. Just as the model is im- proved as a result of successive exposures to critics a successively better understanding of the problem is achieved by the people who participated in the process [45, p. 61.
The setting for this was a second series of intensive interviews with software project managers at three organizations (only one of which was included in the first group).
Figure 3 depicts a highly aggregated view of the mod- el’s four subsystems, namely: (1) the human resource management subsy-stem; (2) the software production subsystem; (3) the controlling subsystem; and (4) the planning subsystem. The figure also illustrates some of the interrelationships among the four subsystems. Simi- larities to Figure 2d can be recognized. Since the actual model is very detailed, containing over a hundred causal links, only a high-level description of the model can be presented in the limited space of this article. For a full discussion of the model’s structure and its mathe- matical formulation the reader is referred to [l, 91.
Human Resource Management Subsystem The human resource management subsystem captures the hiring, training, assimilation, and transfer of the human resource. The project’s total work force is segre- gated into different types of employees, e.g., newly hired work force and experienced work force. Segregat- ing the work force into such categories is necessary for two reasons. First, newly added team members are nor- mally less productive (on the average) than the “old
December 1989 Volume 32 Number 12 Communications of the ACM 1429

Articles
- --
SOF WARE PRODVCfiON
WORKFORCE LEVEL PERCEIVED
NEEDED
EFFORT +..---..^..I*-*_--m-.
LEVEL 01: ACCURACY IN
MEASURING PROGRESS
ADJUSTMENTS TO WORKFORCE
M-C AND SCHEDULE -
PLANNtNG
-----__-_----------------------.--------! :- ____r___Pb_-i-----------~-*~------
t I
.!
FIGURE 3. Model Structure
timers” [la]. Secondly, it allows us to capture the train- ing processes involved in assimilating the new mem- bers into the project team.
On. deciding upon the total work force level needed, project managers consider a number of factors. One important factor, of course, is the project’s completion date. As part of the planning subsystem (to be discussed later:), management determines the work force level that it believes is necessary to complete the project on time. In addition, though, consideration is also given to the stability of the work force. Thus, before adding new project members, management contemplates the dura- tion for which the new members will be needed. In general, the relative weights given to work force stabil- ity v’ersus on-time completion is dynamic, i.e., will change with the stage of project completion. For example, toward the end of the project there could be considerable reluctance to bring in new people. This reluctance arises from the realization that there just woulldn’t be enough time to acquaint the new people with the mechanics of the project, integrate them into the project team, and train them in the necessary tech:nical areas.
Software Production Subsystem This software production subsystem models the soft- ware development process. The operation and mainte- nance phases of the software life cycle are, thus, not included. The development life cycle phases incorpo- rated include the designing, coding, and testing phases. Notice that the initial requirements definition phase is also excluded. There are two reasons for this. The pri- mary reason relates to the desire to focus this study on the endogenous software development organi.zation, i.e., the project managers and the software develop- ment professionals, and how their policies, decisions, actions, etc., affect the success/failure of software de- velopment. The requirements definition phase was, thus, excluded since in many environments .the defini- tion of user requirements is not totally within the con- trol of the software development group [29]. As soft- ware is developed, it is also reviewed to detect any errors, e.g., using quality assurance activities such as structured walkthroughs. Errors detected through such activities are reworked.
The formulation of software productivity is based on the work of the psychologist Ivan Steiner [4~7]. Steiner’s model can simply be stated as follows:
1430 Communications of the ACM December 1989 Volume 3;’ Number 12

Actual Productivity
= Potential Productivity
- Losses Due to Faulty Process
Potential productivity is defined as “the maximum level of productivity that can occur when an individual or group . . . makes the best possible use of its re- sources.” It is a function of two sets of factors, the na- ture of the task (e.g., product complexity, database size) and the group’s resources (e.g., personnel capabilities, experience level, software tools). Losses due to faulty process refer to the losses in productivity incurred as a result of the communication and coordination overheads and/or low motivation.
Control Subsystem Decisions made in any organizational setting are based on what information is actually available to the deci- sion maker(s). Often, this available information is inac- curate. Apparent conditions may be far removed from the actual or true state, depending on the information flows that are being used and the amount of time lag and distortion in these information flows. Thus, system dynamicists go to great lengths to differentiate between actual and perceived model variables [21].
True productivity of a software project team is a good example of a variable that is often difficult to assess. To know what the true value of productivity is at a partic- ular point in time requires accurate knowledge regard- ing the rates of accomplishment and resources ex- pended over that period of time. However, because software is basically an intangible product during most of the development process, “It is difficult to measure performance in programming . . . It is difficult to evalu- ate the status of intermediate work such as undebugged programs or design specification and their potential value to the complete project” [31, p. 671.
How, then, is progress measured in a software proj- ect’s control system? Our own field study findings cor- roborate those reported in the literature, namely, that progress, especially in the earlier phases of software development, is typically measured by the actual ex- penditure of budgeted resources rather than by some count of accomplishments [19]. Baber [12, p. 1881 explains:
It is essentially impossible for the programmers to estimate the fraction of the program completed. What is 45% of a program? Worse yet, what is 45% of three programs? How is he to guess whether a program is 46% or 50% complete? The easiest way for the pro- grammer to estimate such a figure is to divide the amount of time actually spent on the task to date by the time budgeted for that task. Only when the pro- gram is almost finished or when the allocated time budget is almost used up will he be able to recognize that the calculated figure is wrong.
When progress in software development is measured solely by the expenditure of budgeted resources, status
Articles
reporting ends up being nothing more than an echo of the original plan.
As the project advances toward its final stages, work accomplishments become relatively more visible and project members become increasingly more able to per- ceive how productive the work force has actually been. As a result, perceived productivity gradually ceases to be a function of projected productivity and is deter- mined instead on the basis of actual tasks developed.
Planning Subsystem In the planning subsystem, initial project estimates (e.g, for completion time, staffing, man-days) are made at the beginning of the project using a variety of techniques [u]. These estimates are then revised, as necessary, throughout the project’s life. For example, to handle a project that is perceived to be behind schedule, plans can be revised to add more people, extend the sched- ule, or do a little of both. Such planning decisions are driven by variables that can change dynamically throughout the project life cycle. For example, while it is common for management to respond to a delay in the early stages of the project by increasing staff level, there is often great reluctance to do that later in the life cycle. This reluctance arises from the realization that there just wouldn’t be enough time to acquaint the new people with the mechanics of the project, integrate them into the project team, and train them in the necessary technical areas.
MODEL VALIDATION Validation Tests Performed The process of judging the validity of a system dynam- ics model includes a number of objective tests [43] all of which were performed to validate this model:
Face validity. To test the fit between the rate/level/ feedback structure of the model and the essential characteristics of the real system. This was confirmed by the software project managers involved in the study. Replication of referetice modes. To test whether the model can endogenously reproduce the various refer- ence behavior modes characterizing the system under study. Reference modes are the observed behavior patterns over time of important variables characteriz- ing the system under study, including problematic behavior patterns and observed responses to past pol- icies [43]. Reference modes reproduced by the model include: work force staffing patterns in the human resource management area [6], the “66% syndrome” in the control area [a], the impact of schedule com- pression on project cost and schedule in the planning area [6], and the deadline effect on software produc- tivity in the software production area [lo]. Extreme condition simulations. To test whether the model behaves reasonably under extreme conditions or extreme policies. As noted by Forrester and Senge [22, p. 2031.
December 1989 Volume 32 Number 12 Communications of the ACM 1431
Articles
It is not an acceptable counterargument to assert Once an original estimate is made, it’s all too tempt- that particular extreme conditions do not occur in ing to pass up subsequent opportunities t’o estimate real life and should not occur in the model; the by simply sticking with your previous numbers. This nonlinearities introduced by approaches to extreme often happens even when you know your old esti- condition can have important effect in normal op- mates are substantially off. There are a few different erating ranges. Cjften the nonlinearities in the tran- possible explanations for this effect: It’s too early to sition from normal to extreme conditions are the show slip . . . If I re-estimate now, I risk having to do very mechanisms that keep the extreme conditions it again later (and looking bad twice). . . . As you can from being reached. see, all such reasons are political in nature.
To make the extre,me condition tests, we examined each policy, represented by a rate equation in the model, traced it back through any auxiliary equations to the state variables, represented as state variables, on which the rate depends, and tested the implica- tions of imaginary maximum and minimum values of each state variable and combination of state variables to (determine the plausibility of the resulting rate equations. Examples of extreme conditions examined include: if the work force level reaches zero, then the software production rate must be zero; even if the turnover rate is set to extremely high values, the work force level should never become negative; if the sizse of the project is suddenly and dramatically in- creased, then adjustments in the work force level and/or the schedule will not be instantaneous (de- lays will be incu.rred); if the error generation rate is set to zero, then no rework effort will be incurred but effort would still be allocated to QA and testing.
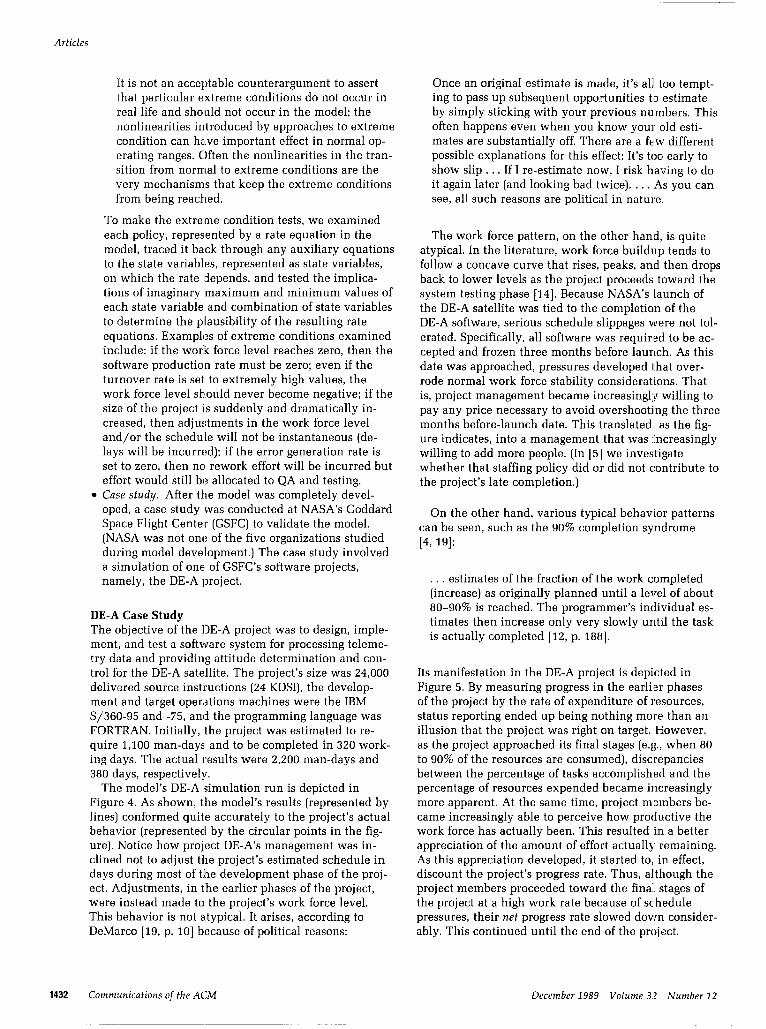
l Case study. After the model was completely devel- oped, a case study was conducted at NASA’s Goddard Space Flight Center (GSFC) to validate the model. (NASA was not one of the five organizations studied during model development.) The case study involved a simulation of one of GSFC’s software projects, namely, the DE-A project.
DE-A Case Study The objective of the DE-A project was to design, imple- ment, and test a software system for processing teleme- try data and providing attitude determination and con- trol for the DE-A satellite. The project’s size was 24,000 delivlared source instructions (24 KDSI), the develop- ment and target operations machines were the IBM S/360-95 and -75, and the programming language was FORTRAN. Initially, the project was estimated to re- quire 1,100 man-days and to be completed in 320 work- ing days. The actual results were 2,200 man-days and 380 days, respectively.
The model’s DE-A simulation run is depicted in Figure 4. As shown, the model’s results (represented by lines) conformed quite accurately to the project’s actual behavior (represented by the circular points in the fig- ure). Notice how project DE-A’s management was in- clined not to adjust the project’s estimated schedule in days during most of the development phase of the proj- ect. Adjustments, in the earlier phases of the project, were instead made to the project’s work force level. This behavior is not atypical. It arises, according to DeMarco [19, p. lo] because of political reasons:
The work force pattern, on the other hand, is quite atypical. In the literature, work force buildup tends to follow a concave curve that rises, peaks, and then drops back to lower levels as the project proceeds toward the system testing phase [14]. Because NASA’s launch of the DE-A satellite was tied to the completion of the DE-A software, serious schedule slippages were not tol- erated. Specifically, all software was requirfecl to be ac- cepted and frozen three months before launch. As this date was approached, pressures developed that over- rode normal work force stability considerations. That is, project management became increasinglyy willing to pay any price necessary to avoid overshooting the three months before-launch date. This translated. as the fig- ure indicates, into a management that was increasingly willing to add more people. (In [5] we investigate whether that staffing policy did or did not c:ontribute to the project’s late completion.)
On the other hand, various typical behavior patterns can be seen, such as the 90% completion syndrome [4, 191:
. . . estimates of the fraction of the work completed (increase) as originally planned until a level of about 80-90% is reached. The programmer’s individual es- timates then increase only very slowly unt:l the task is actually completed [12, p. 1881.
Its manifestation in the DE-A project is depici.ed in Figure 5. By measuring progress in the earl& phases of the project by the rate of expenditure of resources, status reporting ended up being nothing more than an illusion that the project was right on target. fiowever, as the project approached its final stages (e.g., when 80 to 90% of the resources are consumed), discrepancies between the percentage of tasks accomplished and the percentage of resources expended became increasingly more apparent. At the same time, project members be- came increasingly able to perceive how productive the work force has actually been. This resulted in a better appreciation of the amount of effort actually remaining. As this appreciation developed, it started to, in effect, discount the project’s progress rate. Thus, although the project members proceeded toward the final stages of the project at a high work rate because of sc:hedule pressures, their net progress rate slowed down consider- ably. This continued until the end of the project.
1432 Communications of the ACM December 1989 Volume 32 Number 12

Articles
Perceived project size
(3)--f--- ,-9’” ----- l
~&L---‘- (5) I
-c- ~++.-p----(4) ;P . ‘
Actual @action of, ,{I 1, ,I--
.’ Workforce / man-aay on propc5/
Gf (People) L 4’
.s( CM ‘\\,
CD \ ooood -C-- -k ‘-.- ,.’
/
0 100 200 300 380 (ia;,
b--Design phase --Coding phase +Testing 4
9 DE-A’s Actual Estimated Schedule in Days 0 DE-A’s Actual Estimated Project Cost in Man-Days 8 DE-A’s Actual Workforce (full-time-equivalent people)
FIGURE 4. Model Simulation of the DE-A Project
EXPERIMENTS UNDERTAKEN AND IMPLICATIONS OF RESULTS “In software engineering it is remarkably easy to pro- pose hypotheses and remarkably difficult to test them” [SO, p. 571. Many in the field have, thus, argued for the desirability of having a laboratory tool for testing ideas and hypotheses in software engineering [46].
making (e.g., on the allocation of the quality assurance effort); and (3) provided insight into software project phenomena (e.g., 60% syndrome and Brooks’ Law].
Dysfunctional Consequences of Some Current Policies
The computer simulation tools of system dynamics provide us with such an experimentation vehicle. The effects of different assumptions and environmental fac- tors can be tested. In the model system, unlike the real systems, the effect of changing one factor can be ob- served while all other factors are held unchanged. Internally, the model provides complete control of the system’s organizational structure, its policies, and its sensitivities to various events.
Currently, the model is being used to study and pre- dict the dynamic implications of managerial policies and procedures on the software development process in a variety of areas. This has produced three kinds of results: (1) Uncovered dysfunctional consequences of some currently adopted policies (e.g., in the scheduling area); (2) Provided support for managerial decision
We investigated the project scheduling practices in a major U.S. minicomputer manufacturer [Z]. In the par- ticular organization, software project managers use Boehm’s [14] COCOMO model to determine initial project estimates, which are then adjusted upward us- ing a judgmental safety factor to come up with the project estimates actually used. In this organization, project managers were rewarded based upon how closely their project estimates matched actual project results. The purpose of the experiment was to investi- gate the implications of this safety factor policy.
To test the efficacy of various safety factor policies, we ran a number of simulations on a prototypical soft- ware project that we will call project Example. Project Example’s actual size is 64,000 DSI. At its initiation, however, it was incorrectly estimated to be 42.88 KDSI in size (that is, 33 percent smaller than 64 KDSI). This
December 1989 Volume 32 Number 12 Communications of the ACM 1433

Articles
(D 006
0 100 200 300 380
k-Design phase +-Coding phase ATesting +/
Time (days)
FIGURE 5. Reported Percentage of Work Completed
incorrectly perceived project size of 42.88 KDSI was the input used in COCOMO’s estimation equations. We ex- perimented with safety factor values ranging from 0 (the base run) to 100 percent. For a 50 percent safety factor, for example, the actual estimate used on the project would be (1. + 50/100) * COCOMO’s estimates.
In Figure 6, the percent relative error in estimating man-days, defined as 100 x 1 Actual - Estimate j Actual, is plotted against different values of the safety factor. Notice that the safety factor policy seems to be work- ing-the larger the safety factor, the smaller the estima- tion error.
The rationale for using a safety factor is based on the following assumptions:
1. Past experience indicates a strong bias among soft- ware developers to underestimate the scope of software projects [14].
2. One might think biases are the easiest of estimat- ing problems to correct since they involve errors mov- ing always in the same direction. But as [19] suggests, biases are almost by definition invisible; the same psy- chological mechanism that creates the bias (for exam- ple, the optimism of software developers) works to conceal it.
3. To rectify such bias, project managers often use a safety factor. Pietrasanta [37] observes that when proj-
ect managers add contingency factors (ranging, say, from 25 to 100 percent), they are saying in essence: I don’t know all that is going to happen, so I’ll estimate what I don’t know as a percentage of what I do know.
In other words, the assumption is that safety factors are simply mechanisms to bring initial man-day esti- mates closer to true project size in man-days (see Fig- ure 7a). Such an assumption cannot be contested solely on the basis of Figure 6 which provides only part of the story. Figure 7b presents a more complete pjcture; here, we used the model to calculate the actual man-days consumed by the project Example when different safety factors were applied to its initial estimate. The Figure ?‘a assumption is obviously invalidated. As we use higher safety factors, leading to increasingly generous initial man-days allocations, the actual amount of man- days consumed does not remain at some inherently de- fined value. In the base run, for example, project Exam- ple would be initiated with a man-day estimate of 2,359 man-days and would consume 3,795 man-da.ys. When a 50 percent safety factor is used, leading to a 3,538 man- day initial estimate, Example ends up consuming not 3,795 man-days but 5,080 man-days.
These results clearly indicate that by imposing differ- ent estimates on a software project we would, in a real sense, be creating different projects. This can be ex-
1434 Communications of the ACM December 1989 Volume 32 Number 12

Articles
0 1 i + 1 I * 0 25 so 75 100
Safety factor percent
FIGURE 6. Percentage of Relative Error in Estimating Actual Man-Days
plained by realizing that schedules have a direct influ- ence on decision-making behavior throughout a soft- ware project’s life. In TRW’s COCOMO model [la], for example, the project’s average staff size would be deter- mined by dividing the man-day estimate by the devel- opment time estimate (TDEV). Thus, a tight time sched- ule means a larger work force. Also, scheduling can dramatically change manpower loading throughout the life of a project. For example, the work force level in some environments shoots upward toward the end of a late project when there are strict constraints on the extent to which the project’s schedule is allowed to slip. Through its effects on the work force level, a proj- ect’s schedule also affects productivity (as illustrated in Figure 3). For example, a higher work force level means more communication and training overhead, affecting productivity negatively.
Productivity is also influenced by how tight or slack a project schedule is. If a project falls behind under a tight schedule, software developers often decide to work harder in an attempt to compensate for the per-
I I I I I e 0 25 50 7s 100
Safety factor percent
(a)
ceived shortage and bring the project back on schedule. Conversely, man-day excesses could arise if project management initially overestimates a project; as a re- sult, the project would be perceived ahead of schedule. When such a situation occurs, “Parkinson’s law indi- cates that people will use the extra time for. . . per- sonal activities, catching up on the mail, etc.” [la]. Of course, this means that they become less productive.
One important managerial lesson learned from the above experiment is this: more accurate estimates are not necessarily “better” estimates. An estimation method should not be judged only on how accurate it is; it should also be judged on how costly the projects it creates are. For example, in one situation studied, we found that the estimation error which would have been 38 percent had been reduced to 9 percent by the safety factor policy. But, that policy resulted in a 43 percent cost increase in the project. For the first time manage- ment had a realization of the cost of their more accu- rate schedule estimation policy.
Provide Support for Management Decision Making The quality assurance (QA) function has, in recent years, gained the recognition of being a critical factor in the successful development of software systems. How- ever, because the use of QA tools and techniques can add significantly to the cost of developing software, the cost effectiveness of QA has been a pressing concern to the software quality manager. As of yet, though, this concern has not been adequately addressed in the literature.
We have investigated the tradeoffs between the eco- nomic benefits and costs of QA in [6] and [8]. To do this, we used the model as a laboratory vehicle to con- duct controlled experiments on QA policy. Effects con- sidered in this experiment included error generation rate factors, such as schedule pressures and phase of project, and error detection factors, such as productiv- ity, error types, error density. The results showed that
A Mawdays
Actual 5000 - man-days
Estimated mawdays
4000 -
2000 I I 0
I I l
25 50 75 100 Safety factor percent
FIGURE 7. Differences between Assumed Man-Days and Actual Man-Days: (a) Comparison of Assumed Man-Days with Estimated Man-Days; (b) Comparison of Actual Man-Days with Estimated Man-Days
December 1989 Volume 32 Number 12 Communications of the ACM 1435

Articles
Articles
element of the decision making, so that such knowl- edge may be approp:riately reflected in the model” [%I.
The management of software projects is such an ap- plication area. Capturing the decision-making process (e.g., in the staffing area) in a rule-based knowledge base, rather than using the traditional representation in procedural code has a number of benefits. For example, it allows for the incorporation of an explanation capa- bilit:y to the model.
The experiments that have been performed already, described in the previous section, illustrate the insights that can be gained from applying this paradigm to the myrjad of concerns facing software development man- agers. Further work in these directions will help to resolve many more of these concerns.
Acknowledgments. We appreciate the contribution of each of the individuals in the organizations providing perspectives and data to this research effort. In addi- tion, we thank Robert Zmud and Chris Kemerer, whose suggestions have improved this article’s organization and readability. Work reported herein was supported, in part, by NASA research grant NAGW-448.
REFERENCES 1.
2,
3.
4.
5.
6.
7.
6.
9.
10.
11.
12. 13.
14.
Abdel-Hamid, T.K. The dynamics of software development project management: An integrative system dynamics perspective. Ph.D. dissertation. Sloan School of Management, MIT, 1984. Abdel-Hamid, T.K., and Madnick, S.E. Impact of schedule estimation on software project behavior. IEEE Softw. 3, 4 (July, 1986). Abdel-Hamid, T.K. The economics of software quality assurance: A simulation-based case study. MIS Q.. in press, 1988b. Abdel-Hamid, T.K. Understanding the ‘90% syndrome’ in software project management: A simulation-based case study. I. Syst. Softw., in press, 1988c. Abdel-Hamid, T.K. The dynamics of software project staffing: A sys- tem dynamics based simulation approach. IEEE Trans. So@. Eng. 15, 2 (Feb. 1989a). Abdel-Hamid, T.K. Investigating the cost schedule tradeoff in soft- ware development. IEEE Soffw,, in press, 1989b. Abdel-Hamid, T.K., and Madnick, S.E. On the porrtability of quanti- talive software estimation models. If. Manag. 13, 1 (Aug. 1987a), l-10. Abdel-Hamid, T.K., and Madnick, SE. The economics of software quality assurance: A systems dynamics based simulation approach. Annals of the Society of Logistics Eng. 1, 2 (October 1987b). 8-32. Abdel-Hamid, T.K., and Madnick, SE. Dynamics of Soffzoare Project Management. Prentice-Hall. Englewood Cliffs, N.J.: in press, 1990. Abdel-Hamid, T.K.. and Madnick, SE. Software productivity: Poten- tial, actual, and perceived. Sysf. Dynamics Rev. 5, 2 (Sum. 1969), 93-113. Abdel-Hamid. T.K., and Sivasankaran, T.R. Incorporating expert sys- tem technology into simulation modeling: An expert-simulator for project management. In Proceedings of the 1988 Society for Computer Simulafion Mulficonferertce, February, 3-5, 1988, pp. X8-274. Baber, R.L. Soffware Reflected. North Holland, New York, 1982. Baili, V.R. Improving methodology and productivity through practi- cal measurement. Lecture at the Wang Institute of Graduate Studies, Lowell, Mass., November, 1982. Boehm, B.W. Software Engineering Economics, Prentice-Hall, Engle- ._.^^ wood Clitts, N.J., 1981.
15. Brooks, F.P. The Mythicof Man Month. Addison-Wesley, Reading, Mass., 1978.
16. Buckley, F., and Poston. R. Software quality assurance. IEEE Trans. Soffw. Eng. IO, 1 (Jan. 19841, 36-41.
17. Cooper, I.D. Corporate level software management. IEEE Trans. Soffw. Eng. SE-4, No. 4 (July 1978), 319-325.
18. Cougar, I.D., and Zawxki, R.A. Motivating and Managing Computer Personnel. John Wiley, New York, 1980.
19. DeMarco, T. Confroliing Software Projects. Yourdon Press. New York, 1982.
20.
21.
22.
23.
24.
25.
26.
27.
26.
29.
30.
31.
Devenny, T.J. An exploration study of software cost estimating at the electronics systems division. U.S. Department of Commerce, July, 1976. Forrester. J.W. Industrial Dynamics. MIT Press, Cambridge, Mass.. 1961. Forrester, J.W., and Senge. P.M. Tests for Building Corfidence in System Dynamics Models. In A.A. Legato et al., Eds., Studies in the Manngemenf Sciences: Sysfem Dynamics, North-Holland, Amsterdam, 1980. Gehring, P.F., and Pooch, V.W. Software development management, Data Manag. (Feb. 1977), 14-38. Graham, A.K. Software design: Breaking the bottlenec:c. IEEE Spectrum 19, 3 (Mar. 1982), 43-50. Ibrahim, R.L. Software development information system. I. Syst. Mnnag. 29,12 (Dec. 1978), 34-39. Kelly, T.J. The dynamics of R&D project management. Master’s the- sis, Sloan School of Management, MIT, 1970. Kemerer, C.F. An empirical validation of software cost estimation models. Commun. ACM 30, 5 (May 1987), 416-428. Lehman, M.M. Laws and conservation in large program evaluation. In Proceedings of the Second Software Lifecycle Managemcnf Workshop (Atlanta, Ga., Aug. 1978), pp. 21-22. McGowan, CL., and McHenry, R.C. Software Management. In P. Wegner, Ed., Research Directions in Software Technolcgy. MIT Press, Cambridge, Mass.. 1980. McKeen, J.D. Successful development strategies for business applica- tion systems. MIS Q. 7, 3 (Sept. 1983). Mills, H.D. Software Productivity. Little, Brown & Co., Boston, 1983.
32. Muss, J.D. Software engineering: The future of a pmhssion. IEEE Soffw. (Jan. 1985), 55-62.
33. Nay, J.N. Choice and allocation in multiple markets: A research and development systems analysis. Master’s thesis, Department of Elec- trical Engineering, MIT, 1965.
34. Newport, J.P., Jr. A growing gap in software. Fortune [Apr. 28, 1986), 132-142.
35. Nielsen. N.R. Knowledae-based simulation uroarammina. In Proceed-
36.
37,
36.
39.
40.
41.
42.
43.
44.
45.
46.
47.
46.
49.
50.
51.
ings of the Nafional Computer Conference (June 16-19, 1!386), pp. 126-136. Oliver, P. Estimating the Cost of Software. In J. Hannan, Ed., Com- puter Programming Managemenf. Auerbach Publisher:;, .Pennsauken, N.J., 1982. Pietrasanta, A.M. Managing the Economics of Computer Program- ming. In National Conference Proceedings of the ACM, 1986. Pressman, R.S. Software Engineering: A Practitioner’s Approach. McGraw-Hill, New York, 1982. Putnam, L.H. The Real Metrics of Software Development. EASCCJN 80, 1980. Radice. A. Productivity Measures in Software. In R. Gcldberg, Ed., The Economics of lnformafion Processing: Operations, P.~ogramming, and Software Models. Volume II. Wiley, New York, 1982. Ramamoorthy. C.V. et al. Software engineering: Problems and per- spectives. IEEE Compuf. 17, 10 (Oct. 1984), 191-210. Richardson, G.P. Sources of rising product development times. Tech. Rep. D-3321-1, SD Group. MIT, 1982. Richardson, G.P., and Pugh, G.L. III. Introducfion to Sysfem Dynamics Modeling with Dynnmo. The MIT Press, Cambridge, Mass.. 1981. Roberts, E.B. The Dynamics of Research and Developmenf. Harper and Row, New York, 1964. Roberts, E.B., Ed. Managerial Applicafions of System Dynmics. The MIT Press, Cambridge, Mass.. 1981. Shooman. M.L. Software Engineering-Design, Reliability and Mannge- menf. McGraw-Hill, New York, 1983. Steiner, I.D. Group Process nnd Productivity. Academic: Press, New York, 1972. Thayer, R.H. Modeling a software engineering project management system. Ph.D. Dissertation, Dept. of Computer Science, University of California, Santa Barbara, 1979. Weick, K.E. The Social Psychology of Organization. 2nd ed. Addison- Wesley, Reading, Mass, 1979. Weiss, D.M. Evaluating software development by error analysis. r. Syst. SOffW. I, 1 (1979), 57-70. Zmud, R.W. Management of large software development efforts. MIS Q. 4. 2 (June l!l80), 45-56.
CR Categories and Subject Descriptors: D.2.9 [Software Engineer- ing]: Management: D.2.5 [Software Engineering]: Testing and Debug- ging: K.6 [Management of Computing and Information Systems]: Proj- ect and People Management-systems development
General Terms: Design, Management Additional Key Words and Phrases: Brooks’ Law, 90 percent syn-
drome, software project teams
(continued on p. 2455)

Articles
knowledge in expert systems, the design of therapy planning computer programs, and man-machine interface questions. Dr. Fagan received his B.S. from MIT, Ph.D. in Computer Science from Stanford, and M.D. degree from the University of Miami.
JAY C. FERGUSON is a senior knowledge engineer at the Xerox Knowledge Based Systems Competency Center. Ferguson has been involved with artificial intelligence and relational data- base systems for the past 11 years. His research interests in- clude the development of a semantically sound epistemological framework for knowledge representation, model-based repre- sentations and reasoning systems, self-organizing systems and the application of objectivism to the theoretical foundations of machine intelligence. Author’s Present Address: Knowledge Based Systems Competency Center, Xerox Corporation, 800 Phillips Road, Building 897-OlC, Webster, NY 14580.
MICHAEL G. KAHN is an assistant professor in Internal Medi- cine at Washington University School of Medicine. He received a B.S. in Biological Sciences and a B.A. in Chemistry from the University of California-Irvine in 1975 and an M.D. degree from the University of California-San Diego in 1979. He com- pleted specialty training in Internal Medicine in 1983. His research interests include temporal reasoning and temporal representation in medical expert systems, Author’s Present Address: Washington University School of Medicine, Dept. of Medicine, Box 8121, St. Louis, MO 63110.
MARK A. MUSEN is an assistant professor of Medicine and Computer Science at Stanford University. He received Sc.B. and M.D. degrees from Brown University in 1977 and 1980,
respectively. He pursued clinical training in Internal Medicine at Stanford University Hospital from 1980 to 1983. In 1988, he received his Ph.D. from Stanford University. His current re- search continues to concentrate on the development of auto- mated tools that facilitate the construction and maintenance of knowledge-based systems.
EDWARD H. SHORTLIFFE is an associate professor of Medi- cine and Computer Science at Stanford University. He re- ceived an A.B. in Applied Mathematics (Harvard, 1970) a Ph.D. in Medical Information Sciences (Stanford, 1975) and an M.D. (Stanford, 1976). He was principal developer of the MYCIN expert system, for which he received the ACM’s Grace Murray Hopper Award in 1976.
SAMSON W. TU is a scientific programmer on the ONCOCIN project at the Stanford Medical School. He is responsible for developing the ONCOCIN Reasoner and knowledge base. He received an MS. degree in computer engineering from Stan- ford in 1985, and his research interests primarily lie in design- ing planning systems for medical therapy.
Mailing Address for Tu, Musen, Shortliffe and Fagan is Med- ical Computer Science, Medical School Office Bldg., X15, De- partments of Medicine and Computer Science, Stanford Uni- versity School of Medicine, Stanford, CA 94305-5479.
Permission to copy without fee all or part of this material is granted provided that the copies are not made or distributed for direct commer- cial advantage, the ACM copyright notice and the title of the publication and its date appear, and notice is given that copying is by permission of the Association for Computing Machinery. To copy otherwise, or to republish. requires a fee and/or specific permission.
AbdeCHamid (continued from p. 1438)
ABOUT THE AUTHORS:
TAREK K. ABDEL-HAMID is an assistant professor of informa- tion systems in the Department of Administrative Science at the Naval Postgraduate School. His research interests focus on software project management, system dynamics, expert simu- lators, and management information systems. Author’s Present Address: Dept. of Administrative Sciences, Naval Postgraduate School, Monterey, CA 93943.
STUART E. MADNICK is a professor of management science/ information technologies at MIT’s Sloan School of Manage-
ment. His current research interests include connectivity among disparate distributed information systems, database technology, and software project management. Author’s Pres- ent Address: Center for Information Systems Research, Sloan School of Management, MIT, E53-321, 50 Memorial Dr., Cam- bridge, MA 02139. [email protected].
Permission to copy without fee all or part of this material is granted provided that the copies are not made or distributed for direct commer- cial advantage, the ACM copyright notice and the title of the publication and its date appear, and notice is given that copying is by permission of the Association for Computing Machinery. To copy otherwise, or to republish, requires a fee and/or specific permission.
December 1989 Volume 32 Number 12 Communications of the ACM 1455