Lesson Title: Resource Packet and Teaching Prompts to ...
37
Harvard LTER Schoolyard Program ------------------------------------------------------- Lessons and Documents that integrate Harvard Forest Schoolyard Ecology themes into the curriculum. Lesson Title: Resource Packet and Teaching Prompts to Support the “Dirty Water ” Data Nugget Author: Amanda Suzzi, University of Massachusetts—Amherst Level: High School Date: September 2021
Transcript of Lesson Title: Resource Packet and Teaching Prompts to ...

Harvard LTER Schoolyard Program-------------------------------------------------------Lessons and Documents that integrate Harvard Forest Schoolyard Ecology themes into the curriculum.
Lesson Title: Resource Packet and Teaching Prompts to Support the “Dirty Water” Data Nugget
Author: Amanda Suzzi, University of Massachusetts—Amherst
Level: High School
Date: September 2021

Supported MA Education Frameworks2016 MA STE Standards:
1. HS-ESS2-2. Analyze geoscience data to make the claim that one change to Earth’s hydrosphere can create feedbacks that cause changes to other Earth systems.
2. HS-ESS3-1. Construct an explanation based on evidence for how the availability of key natural resources and changes due to variations in climate have influenced human activity.
3. [HS.LS.2.7] - Analyze direct and indirect effects of human activities on biodiversity and ecosystem health, specifically habitat fragmentation, introduction of non-native or invasive species, overharvesting, pollution, and climate change. Evaluate and refine a solution for reducing the impacts of human activities on biodiversity and ecosystem health.
4. VANR.VENVR.2.B.02.07. Distinguish categories and sources of water pollution.
5. VANR.VENVR.2.C.01.03. Define a watershed.
Connections to AP and Environmental Science Topics:
1. Unit 1: The living World: Ecosystems- the water cycle
2. Unit 4: Earth Systems and Resources- watersheds
3. Unit 5: Land and water use- impacts of urbanization, methods to reduce runoff
4. Unit 8: Aquatic and Terrestrial Pollution: Sources of pollution, impacts on ecosystems

Land AcknowledgementWe collectively acknowledge that the Merruasquamack (Merrimack
River) watershed is located on the traditional, ancestral, and contemporary lands of the Pennacock, Wobanaki, and Massachusett
peoples. We also recognize the continuing presence of the neighboring Wampanoag and Nipmuc peoples. We acknowledge the
painful history of genocide and forced removal from this territory and honor, respect, and celebrate the many Indigenous peoples still connected to this land and this community. Let us take a moment of
silence to pay respect to their Elders and to all local Indigenous people, past and present.

Love that Dirty WaterTHE CONNECTION BETWEEN LAND AND WATER IN THE MERRIMACK RIVER WATERSHED
Photo Source: Christopher Evans

Building background understanding and knowledge

What is a watershed?
Image Source: Michigan Sea Grant

Forests soak up rainfall, reducing runoff
Removal of forest cover increases stormwater runoffImage Source: Unknown

GREEN FILTER OR GRAY FUNNEL?
Runoff Picks Up:• Pet Waste• Fertilizers• Motor Oil• Detergents• Chemicals• Litter
Which will send more pollutants into the river?
Image Source: Unknown

~ two-thirds of water-cycle-regulating forests
worldwide are degraded
~ water pollution
has increased in most African, Asian, and Latin American
rivers since the 1990s.

The Global Issue

Statistics about the water crisis
Data Source: World Bank and FAO

Communities of color, low-income
communities, or Indigenous communities
or populations that experience
disproportionate environmental harms
and risks, compared to communities with more white or affluent people
Image Source: AP; Data Source: NPR
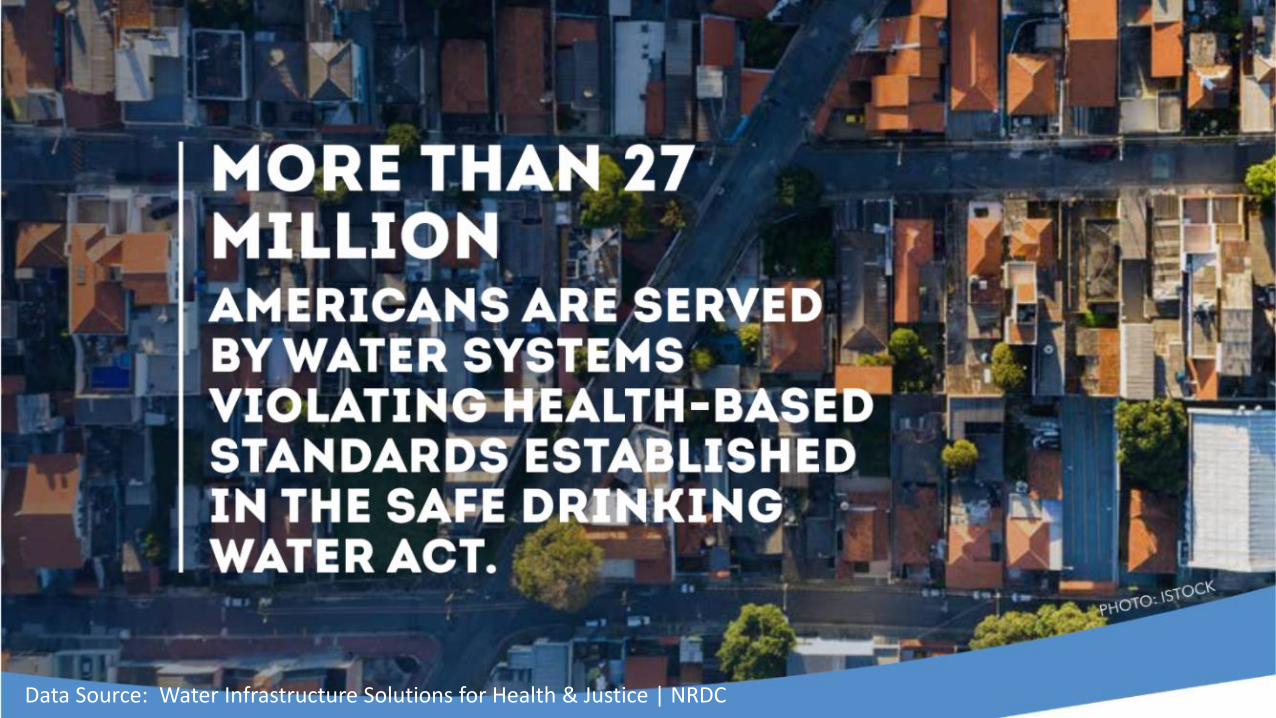
Data Source: Water Infrastructure Solutions for Health & Justice | NRDC

If the city of Flint, MI were rich and mostly white,
would the state government have responded more
quickly and aggressively to
complaints about its polluted water?
Image Source: Max Ortiz, The Detriot News; Data Source: Clean Water and the EJ Movement | sharedjustice.org

Video Source: Cynthia Wilson, Traditional Food Director for UDB; Camera/Sound/Editing by Angelo Baca
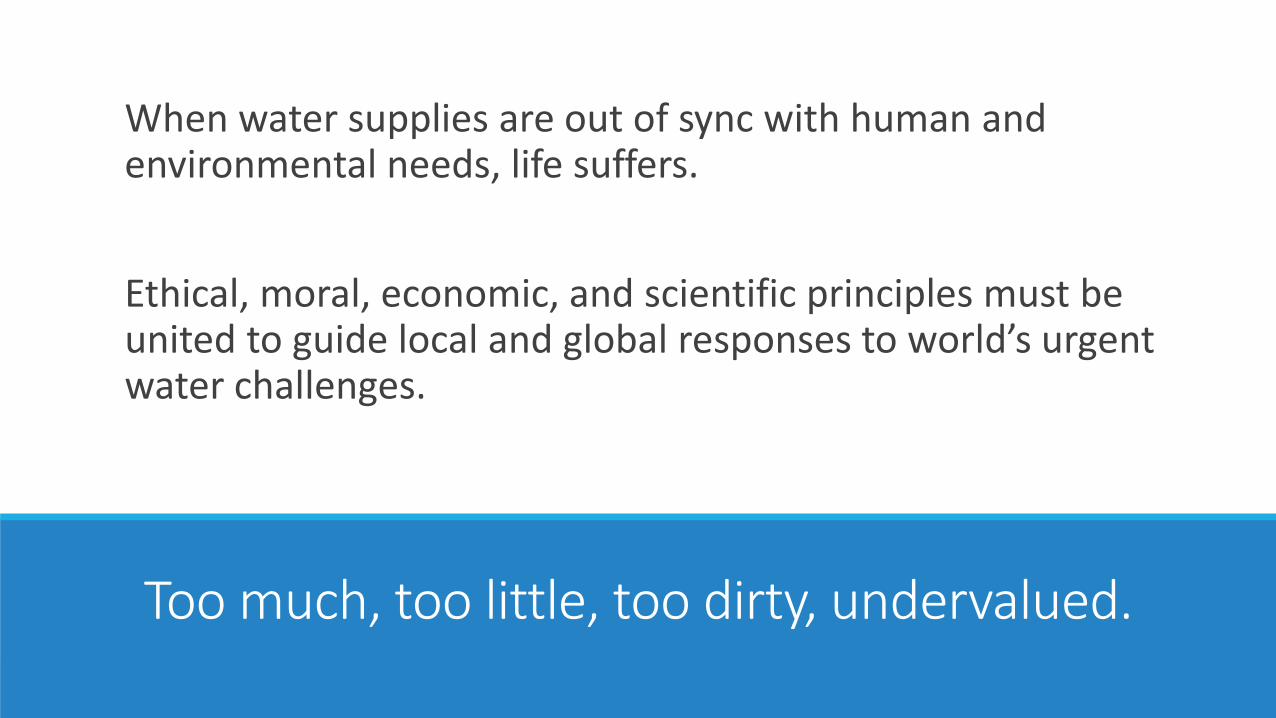
When water supplies are out of sync with human and environmental needs, life suffers.
Ethical, moral, economic, and scientific principles must be united to guide local and global responses to world’s urgent water challenges.
Too much, too little, too dirty, undervalued.

The local connection

Where Does Your Drinking Water Come From?
Image Source: EPA
The only water supply for Lowell's Water Treatment Plant is the surface water
from the Merrimack River.
Lowell Regional Water purifies more than 4.6 billion gallons (4,633,279,000) of drinking water delivering to approximately 135,000
residents and businesses in the communities of Lowell, Dracut, Tyngsboro, and
Chelmsford.

Photo Source: Tom Hinkle

Massachusetts has some of the highest quality drinking water in the country and some of the strictest standards....and yet 44% of MA schools that were tested have lead > 1 ppb.
Data Source: Clean Water Action

Urban Water Issues: MERRIMACK RIVER
Then
Pennacook people met at the Pawtucket Falls on the banks of the Merrimack to fish salmon and sturgeon during the day and conduct business at night.
Later
The growth of Lowell and other industrial cities on the Merrimack dramatically changed the river's ecosystem.
Now
The river is still afflicted with pollution problems. Salt, grease, trash, and pesticides run off into the river from cities.
It is the MOST impaired drinking water source in New England (EPA).
Data Source: National Park Service

Urban Water Issues: CHARLES RIVER
Then
Charles was a tidal river, surrounded by hundreds of acres of salt marshes and mudflats.
Later
In the nineteenth century, the basin was damned for mills and filled for industrial, commercial, and residential purposes, including two prisons, three coal-burning power plants, and several gas works.
Recent
By the mid 1960s, major industrial activities along the Charles had ceased and an environmental movement emerged advocating for improved water quality and ecological health of the Charles River.
Now
The water quality of the Charles has improved from a grade of “D” in 1995 to a “A-” in 2018. People can now swim in it, if they don't touch the bottom.
Data Source: Conservation Law Foundation

NONPOINT SOURCE SUCCESS STORY:Eliminating Stormwater Runoff Restores Shellfishing Area in Fisherman’s Cove,Bourne, MA
Data Source: EPA

NONPOINT SOURCE SUCCESS STORY:Installing Rain Gardens, Permeable Pavers and a Pocket WetlandRestores Recreational Uses to Sunset Lake
Data Source: EPA

NONPOINT SOURCE SUCCESS STORY:Addressing Agricultural Runoff Restored Martin’s Pond Brook
Data Source: EPA

How's My Waterway?Activity
mywaterway.epa.gov
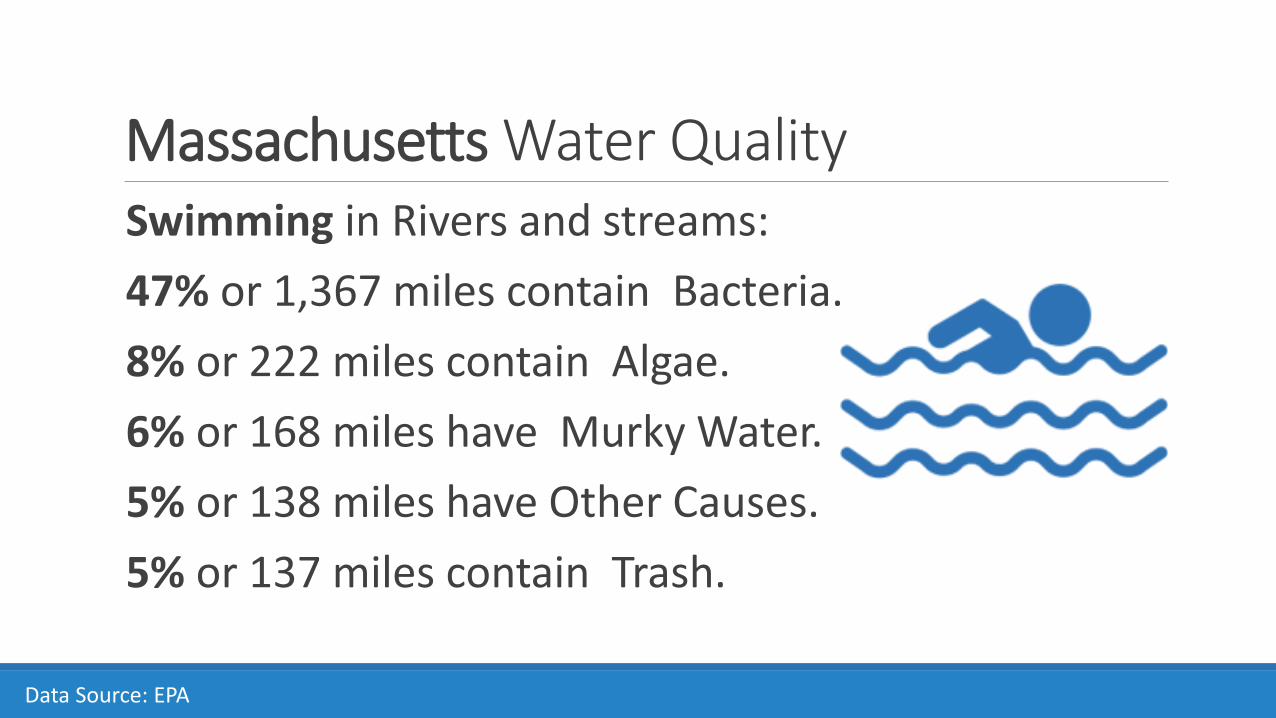
Massachusetts Water QualitySwimming in Rivers and streams:
47% or 1,367 miles contain Bacteria.
8% or 222 miles contain Algae.
6% or 168 miles have Murky Water.
5% or 138 miles have Other Causes.
5% or 137 miles contain Trash.
Data Source: EPA

Massachusetts Water Quality
Eating Fish from Rivers and streams:
57% or 361 miles contain PCBs.
32% or 203 miles contain Mercury.
23% or 147 miles contain Pesticides.
< 1% or 5 miles contain Toxic Organic Chemicals.
< 1% or 5 miles contain Dioxins.
< 1% or 5 miles contain Metals.
Data Source: EPA
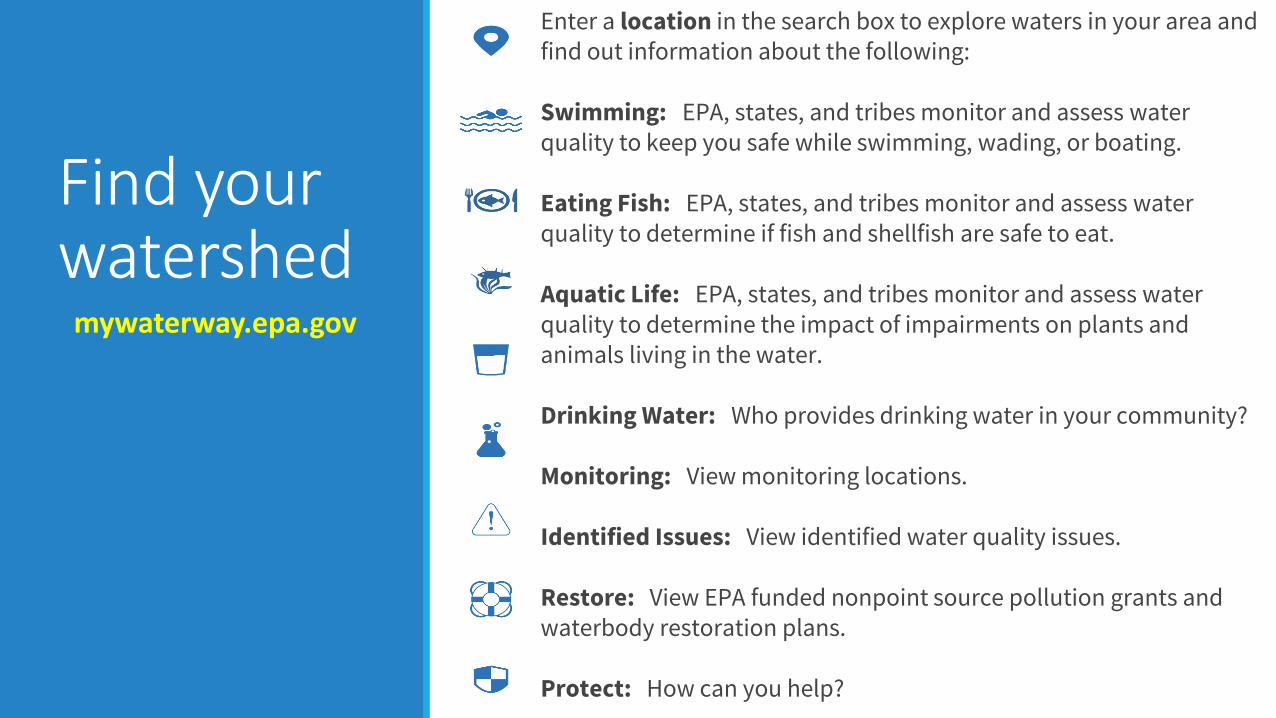
Find your watershed
mywaterway.epa.gov
Enter a location in the search box to explore waters in your area and find out information about the following:
Swimming: EPA, states, and tribes monitor and assess water quality to keep you safe while swimming, wading, or boating.
Eating Fish: EPA, states, and tribes monitor and assess water quality to determine if fish and shellfish are safe to eat.
Aquatic Life: EPA, states, and tribes monitor and assess water quality to determine the impact of impairments on plants and animals living in the water.
Drinking Water: Who provides drinking water in your community?
Monitoring: View monitoring locations.
Identified Issues: View identified water quality issues.
Restore: View EPA funded nonpoint source pollution grants and waterbody restoration plans.
Protect: How can you help?

Your Water QualityWHAT ARE THE RESULTS FOR YOUR WATERSHED?

Connection to the New England Landscape Futures (NELF) explorer tool and Dirty Water Data Nugget

The NELFExplorer
The NELF Explorer helps us understand long-term consequences of land-use decisions we make today, via maps, graphs, and scenario narratives.
This tool can be used by land-users and landowners, including conservationists, planners, developers, government leaders, and citizens who want to explore possible futures of our land.

Dirty Water Data Nugget
How will development decisions impact the future of the Merrimack River and the health of humans that rely on it?

In what ways can youth and climate crisis activists advocate for sustainable water resilience?

Data Source: http://www.susted.com/

AUTUMN PELTIERAutumn is a Canadian water activist and she advocates for clean drinking in First Nations communities and across Mother Earth. She comes from Wikwemikong First Nation/Manitoulin Island and is from Ojibway/Odawa heritage. Autumn has travelled far and wide to carry the message of the importance of clean water and the Sacredness of Water.
Data Source: http://www.susted.com/

Water is a necessary element for human survival.
Image Source: Creator: Robert Mills | Credit: Lowell Sun