
LESSON 6: NUCLEAR INSTRUMENTATION MODULE 1: LOG … Library/20041606.pdf · IAEA - CANDU I&C...
23
IAEA - CANDU I&C SNERDI, Shanghai Lesson 6: Nuclear Instrumentation Module 1: Log and Linear Ranges page 6 - 1 - 1 LESSON 6: NUCLEAR INSTRUMENTATION MODULE 1: LOG AND LINEAR RANGES MODULE OBJECTIVES: At the end of this module, you will be able to: 1. Explain why it is not practicable to control a reactor based on thermal power measurements 2 . State the approximate range of neutron flux to full power operation from initial fuel load 3 . Explain, with the aid of a sketch, why a linear range measurement is not adequate for low reactor power monitoring 4 . Explain, with the aid of a sketch, why a log range measurement is not sufficiently sensitive for high reactor power monitoring 5 . Sketch a reactor neutronic flux scale to show seven decades of flux from first fuel load to full power 6 . Overlay a log amplifier output on the seven decade flux scale (use 2.0 volts per decade) 7 . Overlay a linear scale output on the seven decade flux scale (use 2.0 volts per 10% flux) 8 . Show the log to linear transition region on the seven decade flux scale.
Transcript of LESSON 6: NUCLEAR INSTRUMENTATION MODULE 1: LOG … Library/20041606.pdf · IAEA - CANDU I&C...

IAEA - CANDU I&CSNERDI, Shanghai
Lesson 6: Nuclear InstrumentationModule 1: Log and Linear Ranges
page 6 - 1 - 1
LESSON 6: NUCLEAR INSTRUMENTATION
MODULE 1: LOG AND LINEAR RANGESMODULE OBJECTIVES:
At the end of this module, you will be able to:
1. Explain why it is not practicable to control a reactor based on thermal power measurements
2 . State the approximate range of neutron flux to full power operation from initial fuel load
3 . Explain, with the aid of a sketch, why a linear range measurement is not adequate for low reactorpower monitoring
4 . Explain, with the aid of a sketch, why a log range measurement is not sufficiently sensitive for highreactor power monitoring
5 . Sketch a reactor neutronic flux scale to show seven decades of flux from first fuel load to full power
6 . Overlay a log amplifier output on the seven decade flux scale (use 2.0 volts per decade)
7 . Overlay a linear scale output on the seven decade flux scale (use 2.0 volts per 10% flux)
8 . Show the log to linear transition region on the seven decade flux scale.

IAEA - CANDU I&CSNERDI, Shanghai
Lesson 6: Nuclear InstrumentationModule 1: Log and Linear Ranges
page 6 - 1 - 2
Introduction Nuclear Instrumentation Log & Linear Range
• Any reactor generates thermaI power from the heat produced by nuclear fission.
• Measurements of the actual thermal power output respond too slowly to neutronic power level changesfor the purpose of controlling the reactor (there is a time lag of about 25 sec between a neutron fluxchange and its associated detection by the thermal measurement means).
• To control the reactor flux adequately, it is necessary to have fast responding instrumentation (oneneutron lifetime is approxximately 0.1 seconds)
• The method of measuring reactor power by observing the radiation directly associated with thefission process is used.
• Each time a fission occurs, radiation (neutron, beta, gamma or alpha) is produced. The magnitude ofthis radiation is directly proportional to the number of fissions, which is in turn directly determinesthe resultant reactor power level.
• The most appropriate radiation to select for monitoring is neutron flux. By measuring the neutron flux,we can accurately estimate the corresponding thermal power output of the reactor.
• In addition, monitoring neutron flux acts as a safeguard means against the possibility of losingcontrol of the reactor.
• If the neutron flux exceeds a predetermined power limit or rate of power change, shutdown systems canbe triggered by the independently sensed protection system neutron signals.
IAEA - CANDU I&CSNERDI, Shanghai
Lesson 6: Nuclear InstrumentationModule 1: Log and Linear Ranges
page 6 - 1 - 3
Linear Measurement Range
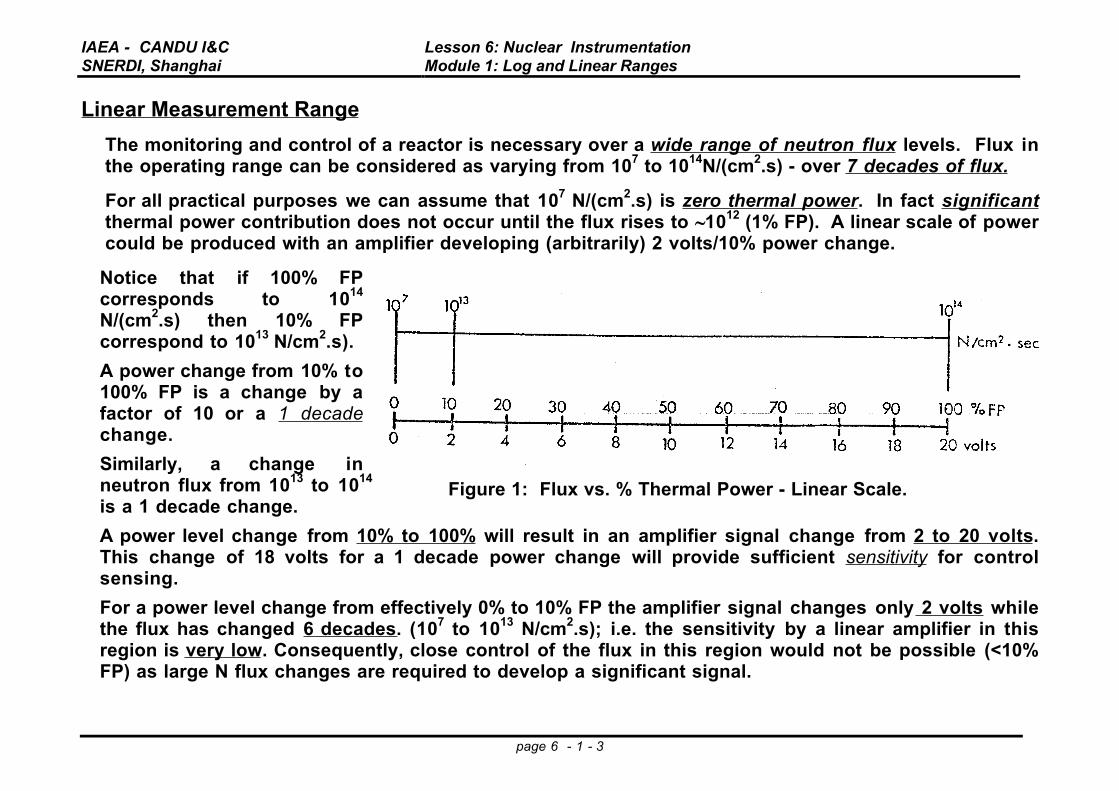
• The monitoring and control of a reactor is necessary over a wide range of neutron flux levels. Flux inthe operating range can be considered as varying from 107 to 1014N/(cm2.s) - over 7 decades of flux.
• For all practical purposes we can assume that 107 N/(cm2.s) is zero thermal power. In fact significantthermal power contribution does not occur until the flux rises to ~1012 (1% FP). A linear scale of powercould be produced with an amplifier developing (arbitrarily) 2 volts/10% power change.
• Notice that if 100% FPcorresponds to 1014
N/(cm2.s) then 10% FPcorrespond to 1013 N/cm2.s).
• A power change from 10% to100% FP is a change by afactor of 10 or a 1 decadechange.
• Similarly, a change inneutron flux from 1013 to 1014
is a 1 decade change.
• A power level change from 10% to 100% will result in an amplifier signal change from 2 to 20 volts.This change of 18 volts for a 1 decade power change will provide sufficient sensitivity for controlsensing.
• For a power level change from effectively 0% to 10% FP the amplifier signal changes only 2 volts whilethe flux has changed 6 decades. (107 to 1013 N/cm2.s); i.e. the sensitivity by a linear amplifier in thisregion is very low. Consequently, close control of the flux in this region would not be possible (<10%FP) as large N flux changes are required to develop a significant signal.
Figure 1: Flux vs. % Thermal Power - Linear Scale.

IAEA - CANDU I&CSNERDI, Shanghai
Lesson 6: Nuclear InstrumentationModule 1: Log and Linear Ranges
page 6 - 1 - 4
Log Measurement Range
• If a log amplifier was used, 2 volts/decade (illustrative value) could be developed so that as the fluxlevel changes one decade, a recognizable signal change of 2 volts will occur:
Voltage signal = 2 log10 (%FP)
% FP Voltage Signal100 10 1
0.1 0.01
0.001
420-2-4-6
Table 1: Log Voltage Signals Relative to % Thermal Power.
Figure 2: Log Voltage Scale Relative to % Thermal Power.
Now if the power level only changes from 10-3 to 10-2 %FP, the log amplifier voltage will change from -6 to-4 volts, a much more readable voltage signal amount.
IAEA - CANDU I&CSNERDI, Shanghai
Lesson 6: Nuclear InstrumentationModule 1: Log and Linear Ranges
page 6 - 1 - 5
Log Measurement Range
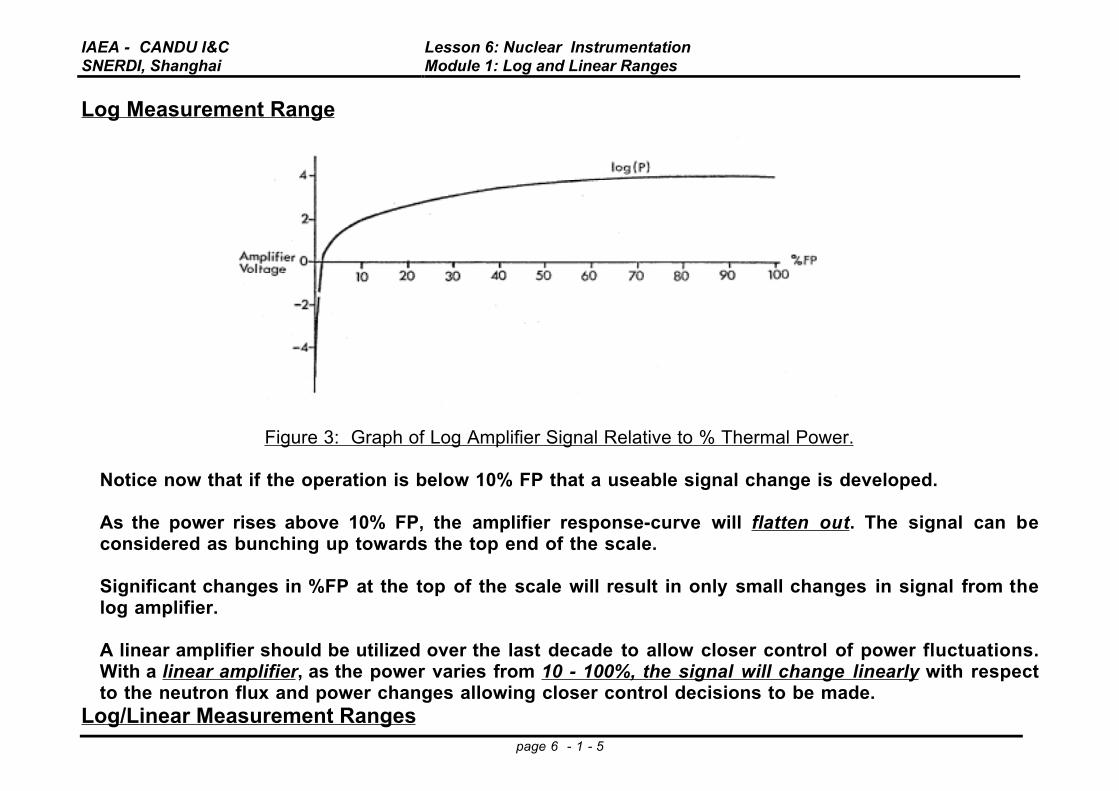
Figure 3: Graph of Log Amplifier Signal Relative to % Thermal Power.
• Notice now that if the operation is below 10% FP that a useable signal change is developed.
• As the power rises above 10% FP, the amplifier response-curve will flatten out. The signal can beconsidered as bunching up towards the top end of the scale.
• Significant changes in %FP at the top of the scale will result in only small changes in signal from thelog amplifier.
• A linear amplifier should be utilized over the last decade to allow closer control of power fluctuations.With a linear amplifier, as the power varies from 10 - 100%, the signal will change linearly with respectto the neutron flux and power changes allowing closer control decisions to be made.
Log/Linear Measurement Ranges

IAEA - CANDU I&CSNERDI, Shanghai
Lesson 6: Nuclear InstrumentationModule 1: Log and Linear Ranges
page 6 - 1 - 6
• Log control: used over the lower 6 decades as the thermal power is raised to about 10% FP
• Log Range: 107 to 1013 N/cm2/sec
• Linear control: used over the last decade where useful power production occurs.
• Linear Range: 1013 to 1014 N/cm2/sec
• Transition Region: 0.5 x 10¹³ to 1.5 x 10¹³ N/cm2/sec [5% to 15 %FP - Log to Linear range transition region]
IAEA - CANDU I&CSNERDI, Shanghai
Lesson 6: Nuclear InstrumentationModule 1: Log and Linear Ranges
page 6 - 1 - 7
Module #1 - Log/Linear Measurements Module ASSIGNMENT
1. Explain why it is not practicable to control a reactor based on thermal power measurements
2 . State the approximate range of neutron flux to full power operation from initial fuel load
3 . Explain, with the aid of a sketch, why a linear range measurement is not adequate for low reactorpower monitoring
4 . Explain, with the aid of a sketch, why a log range measurement is not sufficiently sensitive for highreactor power monitoring
5 . Sketch a reactor neutronic flux scale to show seven decades of flux from first fuel load to full power
6 . Overlay a log amplifier output on the seven decade flux scale (use 2.0 volts per decade)
7 . Overlay a linear scale output on the seven decade flux scale (use 2.0 volts per 10% flux)
8 . Show the log to linear transition region on the seven decade flux scale.

IAEA - CANDU I&CSNERDI, Shanghai
Lesson 6: Nuclear InstrumentationModule 2: Log Range Detectors
page 6 - 2 - 1
LESSON 6: NUCLEAR INSTRUMENTATION
MODULE 2: LOG RANGE DETECTORS
MODULE OBJECTIVES:
At the end of this module, you will be able to:
1. Sketch and label a typical ion chamber assembly
2 . Briefly describe the principle of operation for an ion chamber
3 . State the internal ion chamber ionizing reaction equation involving the Boron lining
4 . Sketch and label a typical ion chamber housing installation to show the housing location withrespect to the reactor core.
5 . Sketch a typical ion chamber housing to show the two ion chambers (RRS & SDS) and the borontest shutter.
6 . State the approximate ion chamber signal current range over seven decades of flux.
7. State why it is important to monitor the ion chamber polarizing voltage closely and to alarm on anysignificant deviation
8. Explain why it is important, from an operations perspective, to operate only one boron test shutterat a time.
IAEA - CANDU I&CSNERDI, Shanghai
Lesson 6: Nuclear InstrumentationModule 2: Log Range Detectors
page 6 - 2 - 2
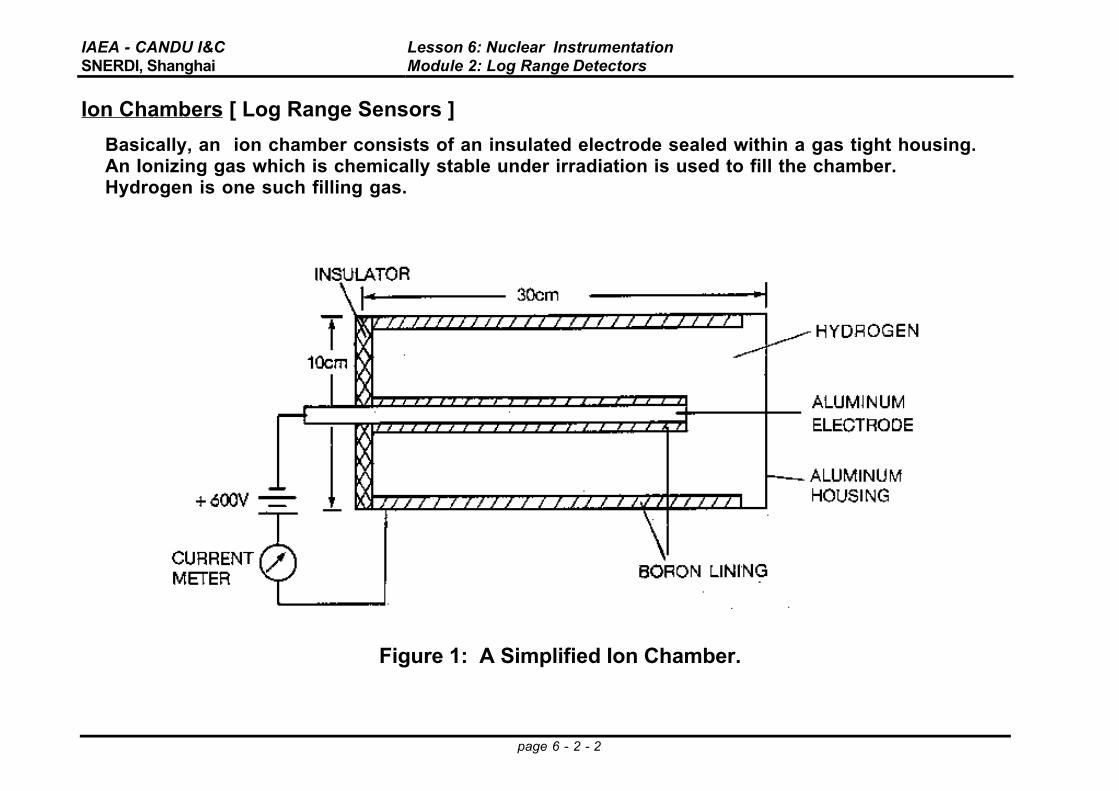
Ion Chambers [ Log Range Sensors ]
• Basically, an ion chamber consists of an insulated electrode sealed within a gas tight housing.• An Ionizing gas which is chemically stable under irradiation is used to fill the chamber. • Hydrogen is one such filling gas.
Figure 1: A Simplified Ion Chamber.
IAEA - CANDU I&CSNERDI, Shanghai
Lesson 6: Nuclear InstrumentationModule 2: Log Range Detectors
page 6 - 2 - 3
Ion Chambers
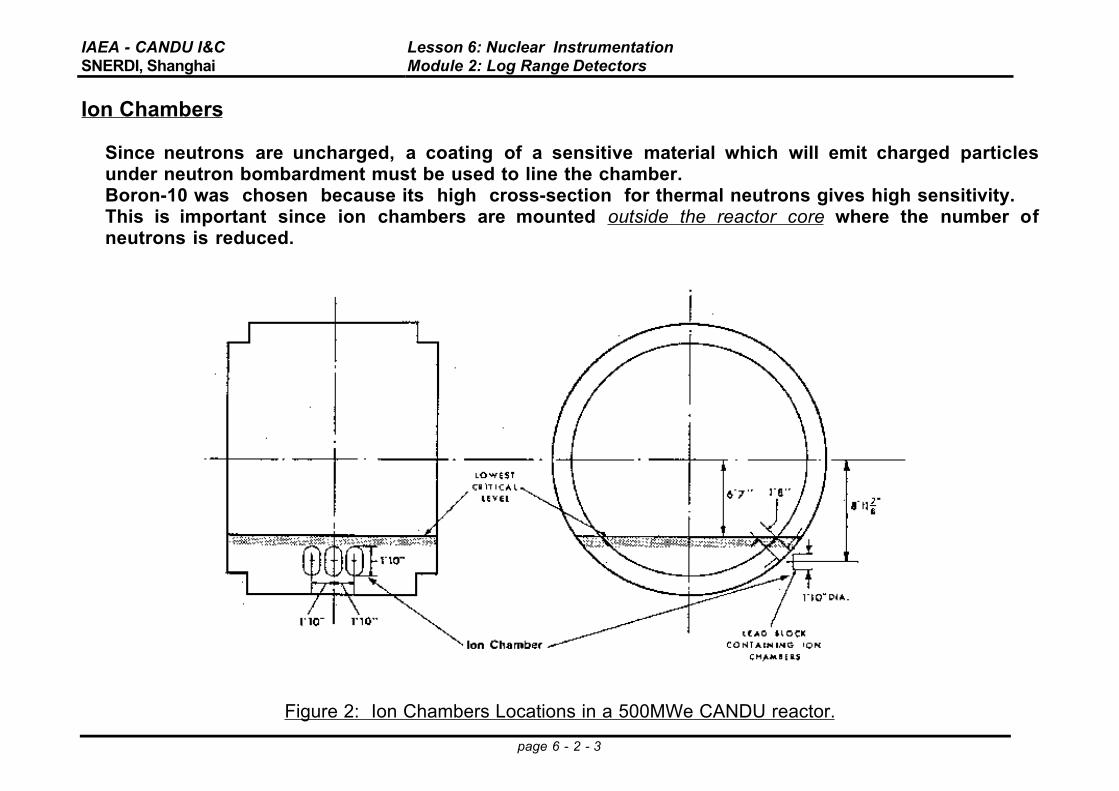
• Since neutrons are uncharged, a coating of a sensitive material which will emit charged particlesunder neutron bombardment must be used to line the chamber.
• Boron-10 was chosen because its high cross-section for thermal neutrons gives high sensitivity.• This is important since ion chambers are mounted outside the reactor core where the number of
neutrons is reduced.
Figure 2: Ion Chambers Locations in a 500MWe CANDU reactor.
IAEA - CANDU I&CSNERDI, Shanghai
Lesson 6: Nuclear InstrumentationModule 2: Log Range Detectors
page 6 - 2 - 4
Ion Chamber Construction
• Ion chambers are modified versions of a gas ionization detector
• The electrodes are closely spaced as parallel cylinders.
• The electrodes are coated with B-10 to provide neutron sensitivity
• Boron absorbs a neutron and releases an ionizing alpha particle
• A polarizing voltage supply ( 600 Volts) is applied across the electrodes.
• The relatively large surface area for the electrodes, small plate separation distance, and highmeasured flux levels combine to produce a DC micro-amp signal as a function of the flux level.
IAEA - CANDU I&CSNERDI, Shanghai
Lesson 6: Nuclear InstrumentationModule 2: Log Range Detectors
page 6 - 2 - 5
Principle of Operation
• The metal used for the construction of the housing and electrode is usually pure aluminum becauseof its low residual activity as a result of neutron bombardment.
• A high polarizing voltage (typically +600 V) is applied to the aluminum housing, while the centerelectrode is normally kept at ground potential (see Figure 1).
• When the boron lining is bombarded by neutrons, alpha (a) particles are emitted:
5B10 + 0n
1 → 3 Li7 + 2He4 (α).
• Both Li7 and alpha particles are positively charged. They ionize the hydrogen gas fill atoms andthereby produce free electrons and positive ions.
• As the free electrons are formed, they are attracted to the housing due to the positive polarizingvoltage.
• This creates a current flow pulse which is detected by an external circuit.
• One of the problems with the ion chamber is that the detector does not discriminate against types ofionizing radiation and is affected by other incident ionizing radiation, especially gamma. (The externalalpha and most beta radiation cannot penetrate the housing.)
• Since Gamma rays can also produce subsequent ionization, it is important to ensure both at powerand after shutdown, when fission product gamma radiation is predominant, that gamma radiationdoes not give a false (high) indication of reactor power.

IAEA - CANDU I&CSNERDI, Shanghai
Lesson 6: Nuclear InstrumentationModule 2: Log Range Detectors
page 6 - 2 - 6
Regulating and Shutdown System Ion Chambers
• Ion chambers are used for the Reactor Regulating System (RRS) and Shut Down Systems (SDS)because of their measurement range and fast response time.
• In a typical CANDU ion chamber installation, a total of 6 ion chambers are provided - 3 for RRS(Channels A, B & C) and 3 for SDS (Channels D, E & F).
• At low reactor power level, say below 15% full power, control of bulk reactor power is important. Ionchambers, because of their fast response time, and high sensitivity are used for low power neutronflux detection.
• The ion chamber are located outside of the fuelled region of the reactor (hence their reading is oftenreferred to as “out of core”) and will generate a signal in the range from 10-5 to 100 µA over sevendecades of flux.
• Loss of polarizing voltage at the ion chamber causes the instrumentation to read zero reactor powerregardless of the actual power (an unsafe failure condition).
• The voltage monitor is set to alarm if the measured voltage at the ion chamber drops 5% below theoperating voltage (i.e. below 570 Volts for a 600 volt supply).

IAEA - CANDU I&CSNERDI, Shanghai
Lesson 6: Nuclear InstrumentationModule 2: Log Range Detectors
page 6 - 2 - 7
ION CHAMBER HOUSING and SHUTTER
• The Ion Chamber Housing has three chambers - 2 for Ion Chambers and 1 for a test shutter.
• There are two ion chambers in each ion chamber housing; one for the RRS and one for the SDS1.
• The regulating channels must be completely independent of each other and of the shutdown systemchannels.
• There is also a pneumatically operated boron test shutter located in each housing to introduce achange in flux to the pair of ion chambers in that housing.
• The shutter is withdrawn at a set speed to simulate a rate of change of flux to test the trip systemfrom the ion chamber right through to the final trip relay.
• The testing of the shutdown system by operating the shutter will also affect the regulating systemsince the flux variations will be sensed by both ion chambers in that housing.
• The test circuits are interlocked to allow the operation of only one shutter at a time.
• Similarly, maintenance would be carried out on one channel at time, and at full power when practicalso that any changes and effects can be fully tested before returning the loop to service.
IAEA - CANDU I&CSNERDI, Shanghai
Lesson 6: Nuclear InstrumentationModule 2: Log Range Detectors
page 6 - 2 - 8
Module #2 - Ion Chamber Module Assignment
1. Sketch and label a typical ion chamber assembly.
2 . Briefly describe the principle of operation for an ion chamber.
3 . State the internal ion chamber ionizing reaction equation involving the Boron lining.
4 . Sketch and label a typical ion chamber housing installation to show the housing location withrespect to the reactor core.
5 . Sketch a typical ion chamber housing to show the two ion chambers (RRS & SDS) and the borontest shutter locations.
6 . State the approximate ion chamber signal current range over seven decades of flux.
7. State why it is important to monitor the ion chamber polarizing voltage closely and to alarm on anysignificant deviation.
8. Explain why it is important, from a continued operations perspective, to operate only one borontest shutter at a time.
IAEA - CANDU I&CSNERDI, Shanghai
Lesson 6: Nuclear InstrumentationModule 3: Linear Range Detectors
page 6 - 3 - 1
LESSON 6: NUCLEAR INSTRUMENTATION
MODULE 3: LINEAR RANGE DETECTORS
MODULE OBJECTIVES:
At the end of this module, you will be able to:
1. State three reasons why ion chambers are not used as in-core detectors.
2. Sketch and label a typical In-Core Flux Detector (ICFD) construction.
3. Describe the principle of operation for an ICFD.
4. State the approximate ICFD signal value at 100 %FP.
5. Provide a 3-D sketch of the core to show the approximate locations for the 28 RRS ICFDs.
6. Explain why it is necessary to correct the signals read from an ICFD.
7. Sketch and explain the general method of determining and applying thermal power corrections for
ICFD signals.

IAEA - CANDU I&CSNERDI, Shanghai
Lesson 6: Nuclear InstrumentationModule 3: Linear Range Detectors
page 6 - 3 - 2
Introduction
• Although ion chambers are very accurate neutron detectors, their relatively large size, requirement forpolarizing voltage and delicate construction make them impractical to be used to detect fluxdistribution inside the reactor.
• For this purpose, simple and relatively inexpensive in-core flux detectors (ICFD) have beendeveloped.
Linear Range Detectors
• In-core flux detectors (ICFD) are self-powered devices which produce a micro-amp current signalproportional to the fissionrate within the reactor.
• This detector is selectedfor use over the lastdecade of flux to provide alinear measurement signalfrom approximately 5% to100% FP.
The in-core or Hilborndetector (inventor), consists of :
• an Inconel outer sheath• an inner emitter wire,
(Various materials can be used for the emitter wire, the most common being vanadium andplatinum)• separated by a layer of insulation (usually magnesium oxide, MgO).
Figure 1: Simplified In-Core Flux Detector Construction.

IAEA - CANDU I&CSNERDI, Shanghai
Lesson 6: Nuclear InstrumentationModule 3: Linear Range Detectors
page 6 - 3 - 3
Operation of an In-core Flux Detector
• When a thermal neutron is absorbed by the emitter, an energetic electron is released which hasenough energy to exceed the dielectric strength of the insulator.
• The electron migrates to the collector producing a net positive charge on the emitter.
• The potential difference which exists between the emitter and collector will cause a micro-amp currentflow through a connected external circuit.
• A current of approximately one micro-amp will flow at 100% FP
• It should be noted that some types of ICFD's are gamma sensitive which will affect readingsconsiderably at low power levels where fission gammas are predominant.
• Problems with the ICFD are related to a gradual degradation of the insulating layer effectivenesswhich eventually will require the replacement of the faulty ICFD.

IAEA - CANDU I&CSNERDI, Shanghai
Lesson 6: Nuclear InstrumentationModule 3: Linear Range Detectors
page 6 - 3 - 4
Location in the Core
• In a 500 MWe CANDU reactor the Hilborndetectors are wound on a zircalloy guide tubeover a vertical distance of 55 cm and arelocated two per zone to provide a total of 28ICFD's for the RRS.
• The incore detectors generate a low-levelcurrent signal that must be amplified andconverted into a voltage. This voltage is thenfed into the control computer multiplexers asflux measurement inputs for the RRS.
Figure 2:In-Core Flux Detectors (500MW CANDU).

IAEA - CANDU I&CSNERDI, Shanghai
Lesson 6: Nuclear InstrumentationModule 3: Linear Range Detectors
page 6 - 3 - 5
Detector Calibration
• It is not possible to use a thermal power measurement as a means of reactor control due to the lags(≈25 seconds) existing between changes in neutron flux levels and the sensing of the associatedtemperature change at the reactor outlet headers.
• Temperature control is inherently slow and cannot be used as a practical method of reactor control.
• At low power, the decay heat from fission products effectively masks small changes in heat outputdue to changes in neutron flux - operation would be effectively blind for power changes up to about2% FP (i.e about 6 decades of neutronic change).
• Measurements of neutron flux are prompt (approximately 90%) and wide ranging (7 decades) but it isimportant to establish the correct steady-state relationship between neutron flux levels and thermaloutput.
• For in-core flux detectors, this steady state correlation is achieved by taking measurements of reactorthermal power output and correcting the steady state neutronic signals.
IAEA - CANDU I&CSNERDI, Shanghai
Lesson 6: Nuclear InstrumentationModule 3: Linear Range Detectors
page 6 - 3 - 6
Reactor Thermal Power Measurement
• In the 500 MWe CANDU, 22 fuel channels are fully instrumented with flow (venturis) and temperature(RTDs) sensing instrumentation.
• The power produced in these channels ( proportional to core flow and ∆ T ) when calculated can beaveraged and then can be multiplied by the total number of fuel channels to provide a relativelyaccurate figure for total reactor thermal power.
• ICFD's also require calibration because they suffer burn-up under irradiation, although, with the useof platinum emitter detectors, this is a relatively minor factor being limited to approximately 1% peryear. In addition ICFD's are only 80 - 88% prompt when responding to a change in flux level.
• At stations where partial boiling is permitted in some channels the channel power is not directlyproportional to mass flow and to ∆T. For these channels we need to know the proportion of steam (iesteam quality). This is determined by using venturis on both ends of the fuel channel to measureinlet and outlet volume flows.
• Reactor thermal power can also be determined by monitoring secondary side parameters such as thefeedwater flow and feedwater entry temperature to the boilers along with the resultant steam flow andsteam pressure. The energy needed to warm this feedwater and then convert it to steam at thesaturated conditions is an accurate indicator of reactor thermal power.

IAEA - CANDU I&CSNERDI, Shanghai
Lesson 6: Nuclear InstrumentationModule 3: Linear Range Detectors
page 6 - 3 - 7
REACTOR THERMAL POWER CALCULATIONS
Figure 3. Reactor Thermal Power Correction Routine (ZOTPR)
IAEA - CANDU I&CSNERDI, Shanghai
Lesson 6: Nuclear InstrumentationModule 3: Linear Range Detectors
page 6 - 3 - 8
Module#3 - In-Core Flux Detectors Module Assignment
1. State three reasons why ion chambers are not used as in-core detectors.
2. Sketch and label a typical In-Core Flux Detector (ICFD) construction.
3. Describe the principle of operation for an ICFD.
4. State the approximate ICFD signal value at 100 %FP.
5. Provide a 3-D sketch of the core to show the approximate locations for the 28 RRS ICFDs.
6. Explain why it is necessary to correct the signals read from an ICFD.
7. Sketch and explain the general method of determining and applying thermal power corrections for
ICFD signals.