Lesson 4 - Topics Creating new variables in the data step SAS Functions.
21
Lesson 4 - Topics • Creating new variables in the data step • SAS Functions
-
Upload
lucy-jacobs -
Category
Documents
-
view
234 -
download
5
Transcript of Lesson 4 - Topics Creating new variables in the data step SAS Functions.

Lesson 4 - Topics
• Creating new variables in the data step
• SAS Functions

Creating New Variables
• Direct assignments(formulas):c = a + b ;d = 2*a + 3*b + 7*c ;bmi = weight/(height*height);
• Indirect assignments (if/then/else)if age < 50 then young = 1; else young = 2;
if income < 15 then tax = 1; elseif income < 25 then tax = 2; elseif income >=25 then tax = 3;
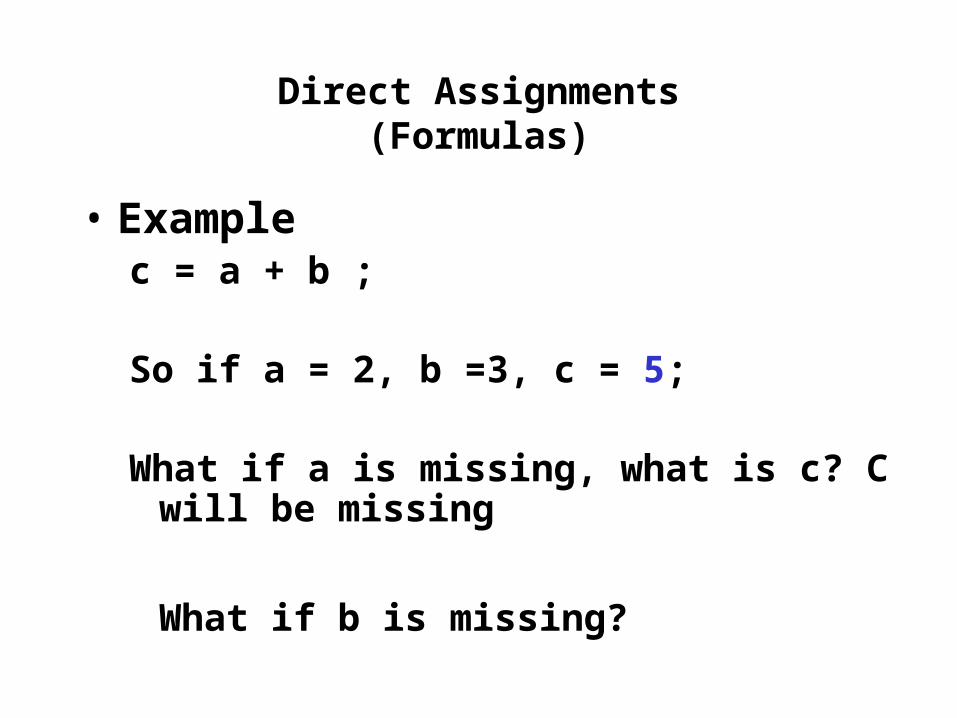
Direct Assignments(Formulas)
• Examplec = a + b ;
So if a = 2, b =3, c = 5;
What if a is missing, what is c? C will be missing
What if b is missing?
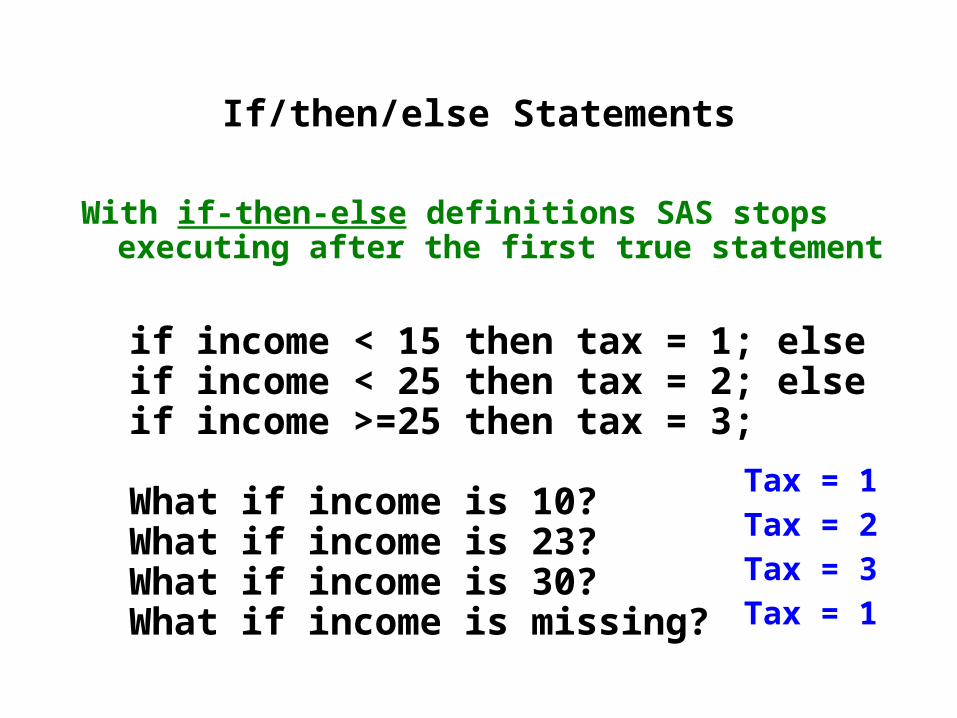
If/then/else Statements
With if-then-else definitions SAS stops executing after the first true statement
if income < 15 then tax = 1; elseif income < 25 then tax = 2; elseif income >=25 then tax = 3;
What if income is 10?What if income is 23?What if income is 30?What if income is missing?
Tax = 1Tax = 2Tax = 3Tax = 1

Create a new variable with 2 levels, one for college graduates and one for non-college graduates.
Creating New Variables

Program 5DATA tdata;INFILE ‘C:\SAS_Files\tomhs.data' ;INPUT @ 1 ptid $10. @ 49 educ 1. @123 sbp12 3. ;
* This way will code missing values to the value 2;if educ < 7 then grad1 = 2 ; elseif educ >=7 then grad1 = 1 ;
* The next two ways are equivalent and are correct;if educ < 7 and educ ne . then grad2 = 2; elseif educ >=7 then grad2 = 1;
* IN is a useful function in SAS ;if educ IN(1,2,3,4,5,6) then grad3 = 2; elseif educ IN(7,8,9) then grad3 = 1;
New variable defines go after the input statement
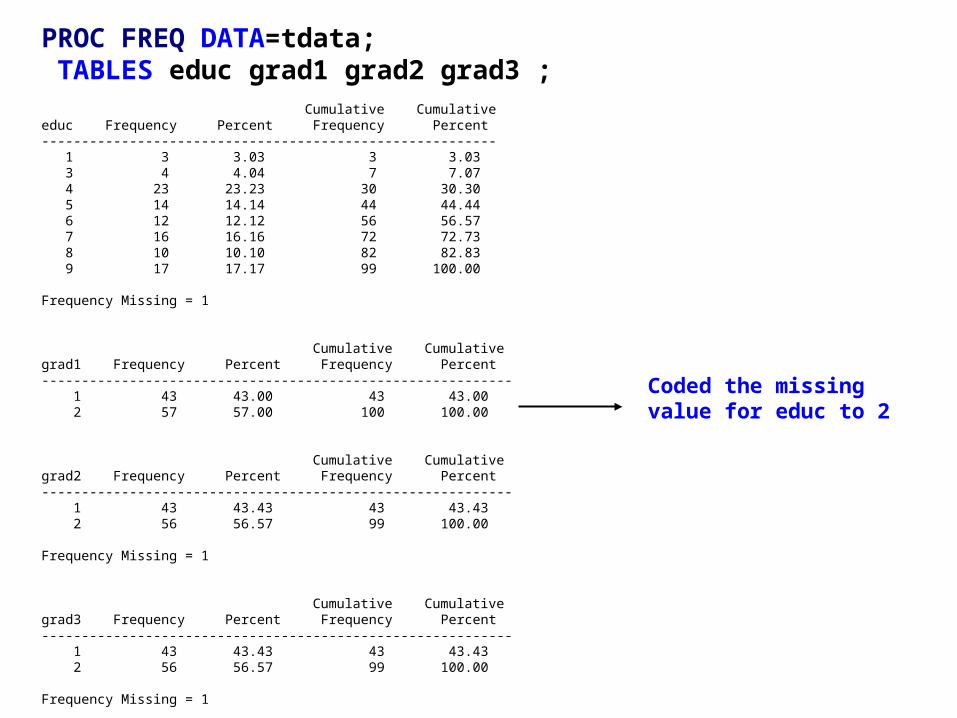
PROC FREQ DATA=tdata; TABLES educ grad1 grad2 grad3 ; Cumulative Cumulativeeduc Frequency Percent Frequency Percent--------------------------------------------------------- 1 3 3.03 3 3.03 3 4 4.04 7 7.07 4 23 23.23 30 30.30 5 14 14.14 44 44.44 6 12 12.12 56 56.57 7 16 16.16 72 72.73 8 10 10.10 82 82.83 9 17 17.17 99 100.00
Frequency Missing = 1
Cumulative Cumulativegrad1 Frequency Percent Frequency Percent----------------------------------------------------------- 1 43 43.00 43 43.00 2 57 57.00 100 100.00
Cumulative Cumulativegrad2 Frequency Percent Frequency Percent----------------------------------------------------------- 1 43 43.43 43 43.43 2 56 56.57 99 100.00
Frequency Missing = 1
Cumulative Cumulativegrad3 Frequency Percent Frequency Percent----------------------------------------------------------- 1 43 43.43 43 43.43 2 56 56.57 99 100.00
Frequency Missing = 1
Coded the missing value for educ to 2
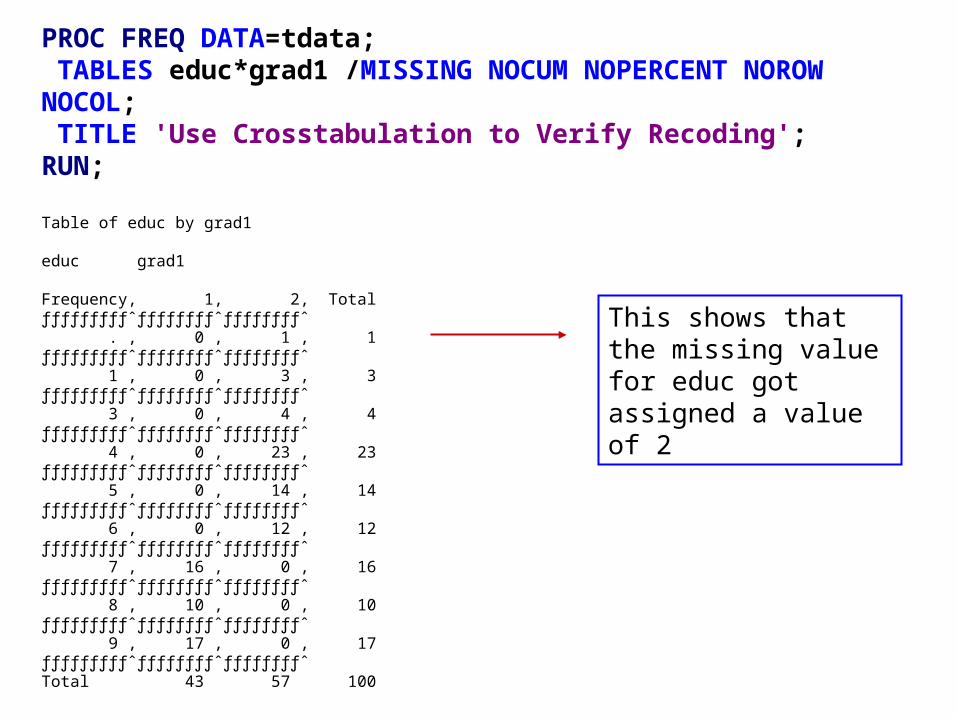
PROC FREQ DATA=tdata; TABLES educ*grad1 /MISSING NOCUM NOPERCENT NOROW NOCOL; TITLE 'Use Crosstabulation to Verify Recoding'; RUN;
Table of educ by grad1
educ grad1
Frequency‚ 1‚ 2‚ Totalƒƒƒƒƒƒƒƒƒˆƒƒƒƒƒƒƒƒˆƒƒƒƒƒƒƒƒˆ . ‚ 0 ‚ 1 ‚ 1ƒƒƒƒƒƒƒƒƒˆƒƒƒƒƒƒƒƒˆƒƒƒƒƒƒƒƒˆ 1 ‚ 0 ‚ 3 ‚ 3ƒƒƒƒƒƒƒƒƒˆƒƒƒƒƒƒƒƒˆƒƒƒƒƒƒƒƒˆ 3 ‚ 0 ‚ 4 ‚ 4ƒƒƒƒƒƒƒƒƒˆƒƒƒƒƒƒƒƒˆƒƒƒƒƒƒƒƒˆ 4 ‚ 0 ‚ 23 ‚ 23ƒƒƒƒƒƒƒƒƒˆƒƒƒƒƒƒƒƒˆƒƒƒƒƒƒƒƒˆ 5 ‚ 0 ‚ 14 ‚ 14ƒƒƒƒƒƒƒƒƒˆƒƒƒƒƒƒƒƒˆƒƒƒƒƒƒƒƒˆ 6 ‚ 0 ‚ 12 ‚ 12ƒƒƒƒƒƒƒƒƒˆƒƒƒƒƒƒƒƒˆƒƒƒƒƒƒƒƒˆ 7 ‚ 16 ‚ 0 ‚ 16ƒƒƒƒƒƒƒƒƒˆƒƒƒƒƒƒƒƒˆƒƒƒƒƒƒƒƒˆ 8 ‚ 10 ‚ 0 ‚ 10ƒƒƒƒƒƒƒƒƒˆƒƒƒƒƒƒƒƒˆƒƒƒƒƒƒƒƒˆ 9 ‚ 17 ‚ 0 ‚ 17ƒƒƒƒƒƒƒƒƒˆƒƒƒƒƒƒƒƒˆƒƒƒƒƒƒƒƒˆTotal 43 57 100
This shows that the missing value for educ got assigned a value of 2

* Recode sbp12 into 3 levels;
if sbp12 = . then sbp12c = . ; elseif sbp12 < 120 then sbp12c = 1 ; elseif sbp12 < 140 then sbp12c = 2 ; elseif sbp12 >=140 then sbp12c = 3 ; With if-then-else definitions SAS stops executing after the first true statement
Values < 120 will be assigned value of 1
Values 120-139 will be assigned value of 2
Values >=140 will be assigned value of 3
Missing values will be assigned to missing
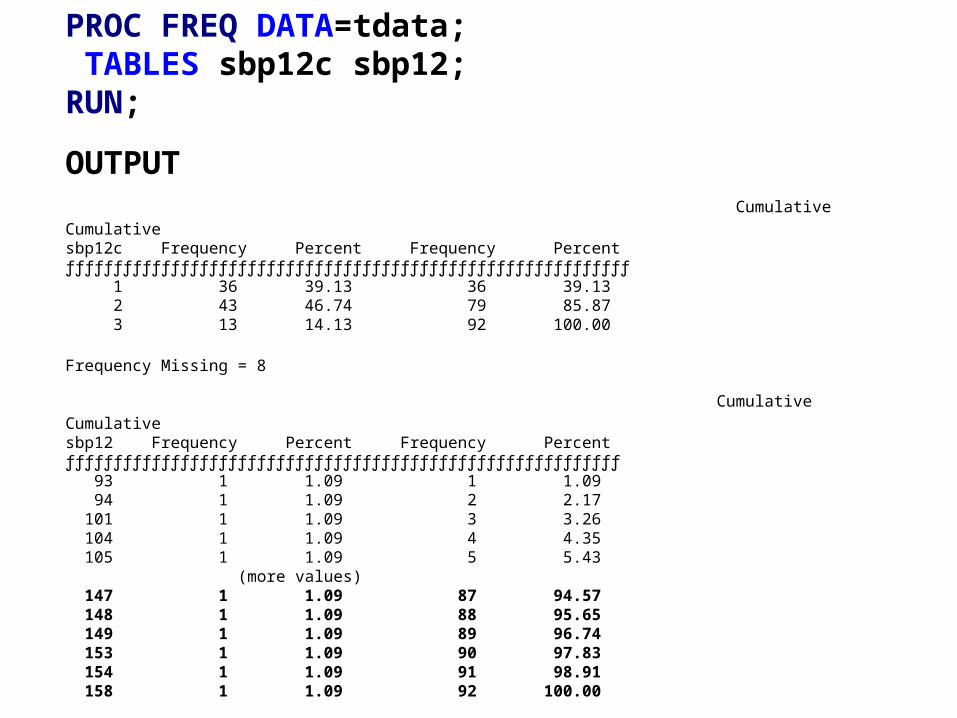
PROC FREQ DATA=tdata; TABLES sbp12c sbp12;RUN;
OUTPUT Cumulative Cumulativesbp12c Frequency Percent Frequency Percentƒƒƒƒƒƒƒƒƒƒƒƒƒƒƒƒƒƒƒƒƒƒƒƒƒƒƒƒƒƒƒƒƒƒƒƒƒƒƒƒƒƒƒƒƒƒƒƒƒƒƒƒƒƒƒƒƒƒƒ 1 36 39.13 36 39.13 2 43 46.74 79 85.87 3 13 14.13 92 100.00
Frequency Missing = 8
Cumulative Cumulativesbp12 Frequency Percent Frequency Percentƒƒƒƒƒƒƒƒƒƒƒƒƒƒƒƒƒƒƒƒƒƒƒƒƒƒƒƒƒƒƒƒƒƒƒƒƒƒƒƒƒƒƒƒƒƒƒƒƒƒƒƒƒƒƒƒƒƒ 93 1 1.09 1 1.09 94 1 1.09 2 2.17 101 1 1.09 3 3.26 104 1 1.09 4 4.35 105 1 1.09 5 5.43 (more values) 147 1 1.09 87 94.57 148 1 1.09 88 95.65 149 1 1.09 89 96.74 153 1 1.09 90 97.83 154 1 1.09 91 98.91 158 1 1.09 92 100.00
Frequency Missing = 8

* Easy but costly error to make;
if sbp12 = . then sbp12c = . ; elseif sbp12 < 120 then sbp12c = 1 ; elseif sbp12 < 140 then sbp12 = 2 ; elseif sbp12 >=140 then sbp12c = 3 ;
PROC FREQ DATA=tdata; TABLES sbp12c;RUN;
The FREQ Procedure
Cumulative Cumulativesbp12c Frequency Percent Frequency Percentƒƒƒƒƒƒƒƒƒƒƒƒƒƒƒƒƒƒƒƒƒƒƒƒƒƒƒƒƒƒƒƒƒƒƒƒƒƒƒƒƒƒƒƒƒƒƒƒƒƒƒƒƒƒƒƒƒƒƒƒƒ 1 36 73.47 36 73.47 3 13 26.53 49 100.00
Frequency Missing = 51
How come no values of 2 and why so many missing?
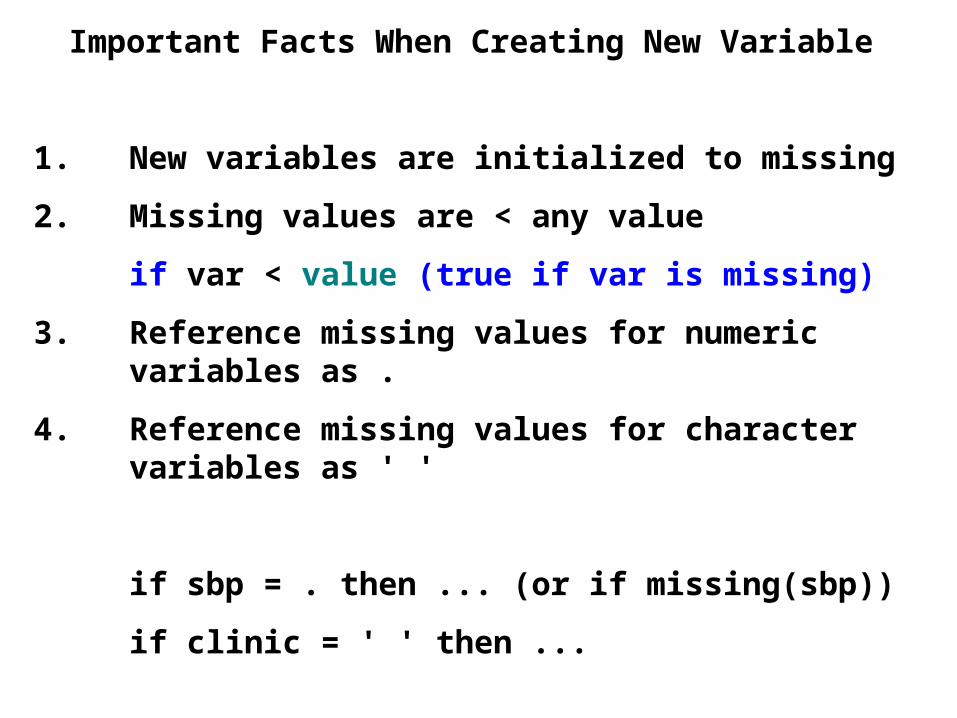
Important Facts When Creating New Variable
1. New variables are initialized to missing
2. Missing values are < any value
if var < value (true if var is missing)
3. Reference missing values for numeric variables as .
4. Reference missing values for character variables as ' '
if sbp = . then ... (or if missing(sbp))
if clinic = ' ' then ...

SAS Handling of Missing Data When Creating New Variables
• Direct assignments(formulas):c = a + b ;d = 2*a + 3*b + 7*c ;bmi = weight/(height*height);
If any variable on the right-hand side is missing then the new variable will be missing
• Indirect assignmentsif age < 50 then young = 1; else young=2;
New variables are initialized to missing but may be given a value if any of the IF statements are true

What Value to Set New Variable
if age < 20 then teenager = 1; elseif age >=20 then teenager = 2;
if age < 20 then teenager = 1; elseif age >=20 then teenager = 0;
if age < 20 then teenager = ‘YES’; elseif age >=20 then teenager = ‘NO’;

* Program 6 SAS Functions ;
DATA example;INFILE ‘C:\SAS_Files\tomhs.data' ;INPUT @058 height 4.1 @085 weight 5.1 @172 ursod 3. @236 (se1-se10) (1.0 + 1); bmi = (weight*703.0768)/(height*height);rbmi1 = ROUND(bmi,1);lursod = LOG(ursod);
seavg = MEAN (OF se1-se10); semax = MAX (OF se1-se10);semin = MIN (OF se1-se10);

* Use of dash notation ;
seavg = MEAN (OF se1-se10);
This is the same as
seavg = MEAN (se1,se2,se3,se4,se5,se6,se7,se8,se9,se10);
The OF is very important. Otherwise SAS thinks you are subtracting se10 from se1.
To use this notation the ROOT of the name must be the same.

* Two ways of computing average ;
seavg = MEAN (se1,se2,se3,se4,se5,se6,se7,se8,se9,se10);
Versus
seavg = (se1+se2+se3+se4+se5+se6+se7+se8+se9+se10)/10;
Using mean function computes the average of non-missing values. Result is missing only if all values all missing.
Using + formula requires all values be non-missing otherwise result will be missing
if N(of se1-se10) > 5 then seavg = MEAN(of se1-se10);
What does this statement do?

PROC PRINT DATA = example (OBS=15); VAR bmi rbmi1 rbmi2 seavg semin semax ; TITLE 'Listing of Selected Data for 15 Patients ';RUN;
PROC FREQ DATA = example; TABLES semax; TITLE 'Distribution of Worse Side Effect Value'; TITLE2 'Side Effect Scores Range from 1 to 4';RUN;
ods graphics on;PROC UNIVARIATE DATA = example ; VAR ursod lursod; QQPLOT ursod lursod; TITLE 'Quantile Plots for Urine Sodium Data';RUN;

Listing of Selected Data for 10 Patients
Obs bmi rbmi1 seavg semin semax
1 28.2620 28 1.1 1 2
2 35.9963 36 1.0 1 1
3 27.0489 27 1.0 1 1
4 28.2620 28 1.1 1 2
5 33.2008 33 1.0 1 1
6 27.7691 28 1.2 1 2
7 32.6040 33 1.0 1 1
8 22.4057 22 1.2 1 2
9 37.2037 37 1.1 1 2
10 33.1717 33 1.7 1 3

Distribution of Worse Side Effect ValueSide Effect Scores Ranges from 1 to 4
The FREQ Procedure
Cumulative Cumulative
semax Frequency Percent Frequency Percent
----------------------------------------------------------
1 33 33.00 33 33.00
2 52 52.00 85 85.00
3 13 13.00 98 98.00
4 2 2.00 100 100.00
2 patients had at least 1 severe side effect

Log transformed value shows a better linear pattern