Lesson 3 - Troubleshooting and Debugging VIs
24
TOPICS ni.com/ training Lesson 3 Troubleshooting and Debugging VIs A. LabVIEW Help Utilities B. Correcting Broken VIs C. Debugging Techniques D. Undefined or Unexpected Data E. Error Checking and Error Handling
-
Upload
cuenca0089 -
Category
Documents
-
view
85 -
download
6
Transcript of Lesson 3 - Troubleshooting and Debugging VIs
TOPICS
ni.com/training
Lesson 3Troubleshooting and Debugging VIs
A. LabVIEW Help UtilitiesB. Correcting Broken VIsC. Debugging TechniquesD. Undefined or Unexpected DataE. Error Checking and Error Handling
ni.com/training
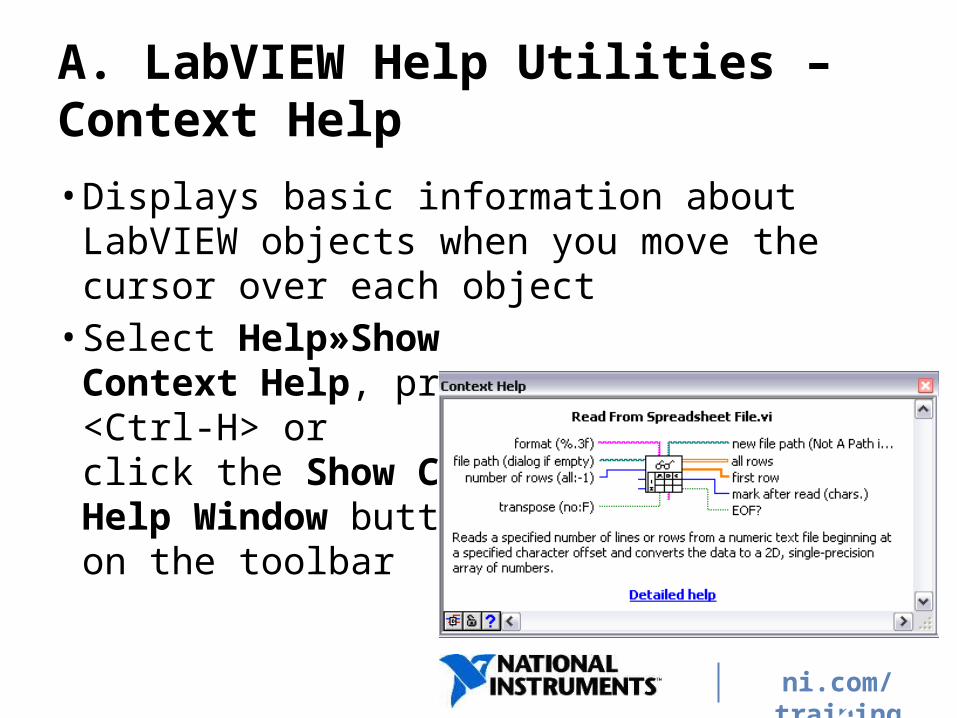
A. LabVIEW Help Utilities – Context Help
• Displays basic information about LabVIEW objects when you move the cursor over each object• Select Help»Show
Context Help, press <Ctrl-H> or click the Show Context Help Window button on the toolbar
2

ni.com/training
A. LabVIEW Help Utilities – LabVIEW Help
• Detailed descriptions of most palettes, menus, tools, VIs, and functions and instructions for using LabVIEW features• Accessing the LabVIEW Help:
− Select Help»Search the LabVIEW Help− Use the Detailed help
link or button in the Context Help window
− Right-click an object and select Help from the shortcut menu
3
ni.com/training
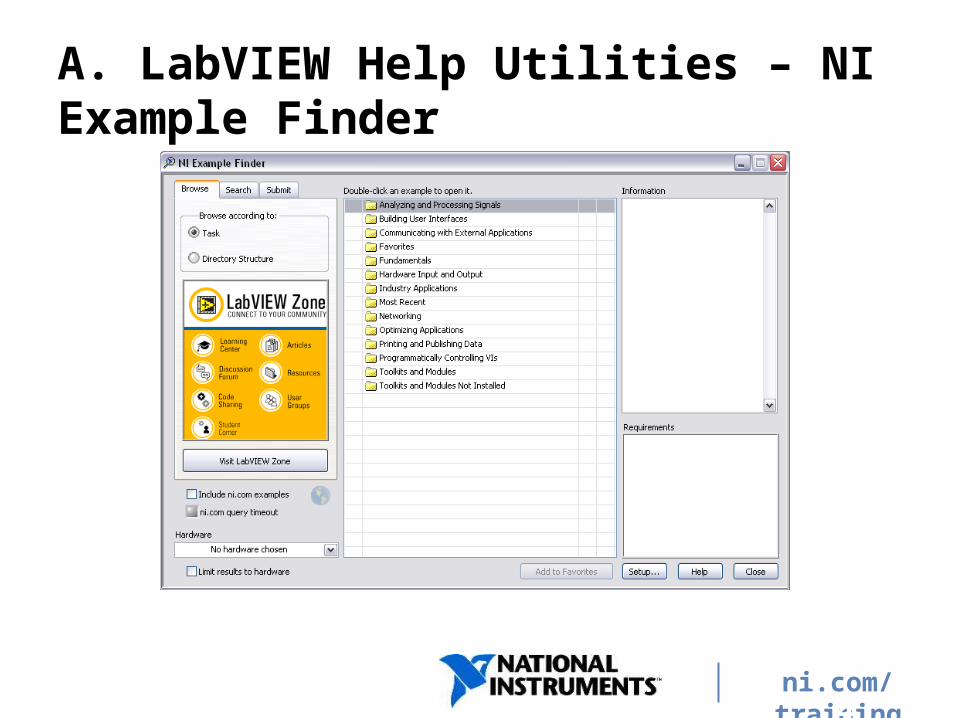
A. LabVIEW Help Utilities – NI Example Finder
4
GOAL
Exercise 3-1Concept: Using Help
Become familiar with using the Context Help window, the LabVIEW Help, and the NI Example Finder.
5
DISCUSSION
Exercise 3-1Concept: Using Help
• You are given a VI containing unfamiliar functions. How do you determine the functionality in the block diagram?
ni.com/training
B. Correcting Broken VIs
7

ni.com/training
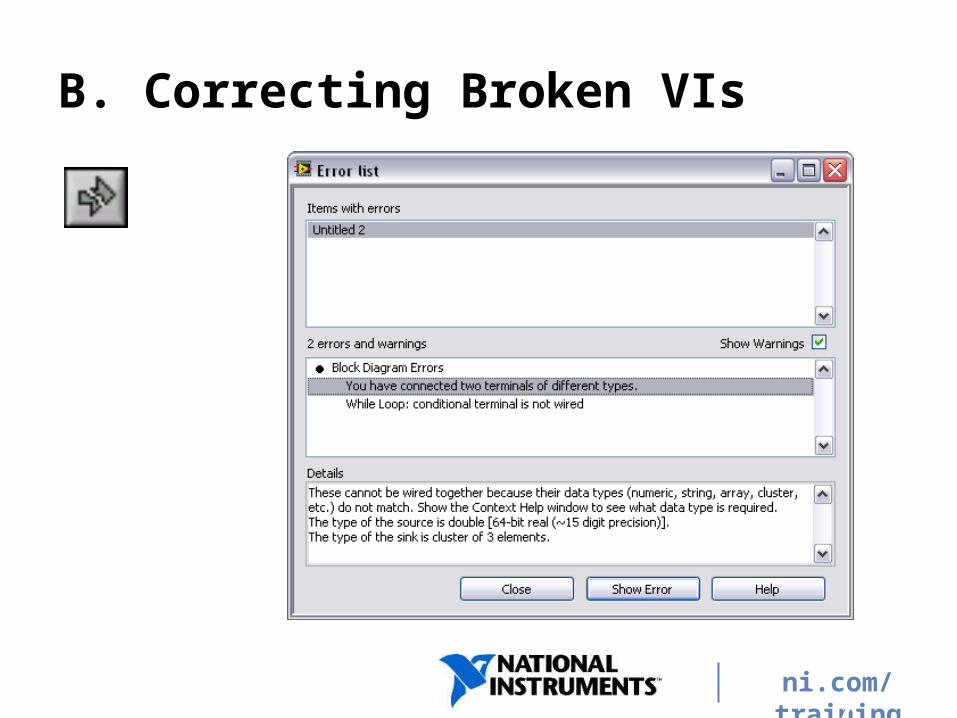
B. Correcting Broken VIs
Common Issues• Broken wire
− You wired a Boolean control to a String indicator
− You wired a Numeric control to a Numeric control
• A required block diagram terminal is unwired• A subVI is broken or you edited its connector pane after you
placed its icon on the block diagram of the VI
8
ni.com/training
C. Debugging Techniques
Your VI isn’t broken, but you are getting unexpected data or behavior• Any unwired or hidden subVIs?• Incorrect default data being used?• Undefined data being passed?• Numeric representation correct?• Node execution order correct?
9

ni.com/training
C. Debugging Techniques – Execution Highlighting
• Use execution highlighting to watch the data flow through the block diagram• If the VI runs more slowly than expected, confirm that you
turned off execution highlighting in subVIs
10

ni.com/training
C. Debugging Techniques – Single Stepping
Single-step through the VI to view each action of the VI on the block diagramSuspend the execution of a subVI to edit values of controls and indicators, to control the number of times it runs, or to go back to the beginning of the execution of the subVI• Open subVI and select Operate»Suspend When Called
from the shortcut menu
11
ni.com/training
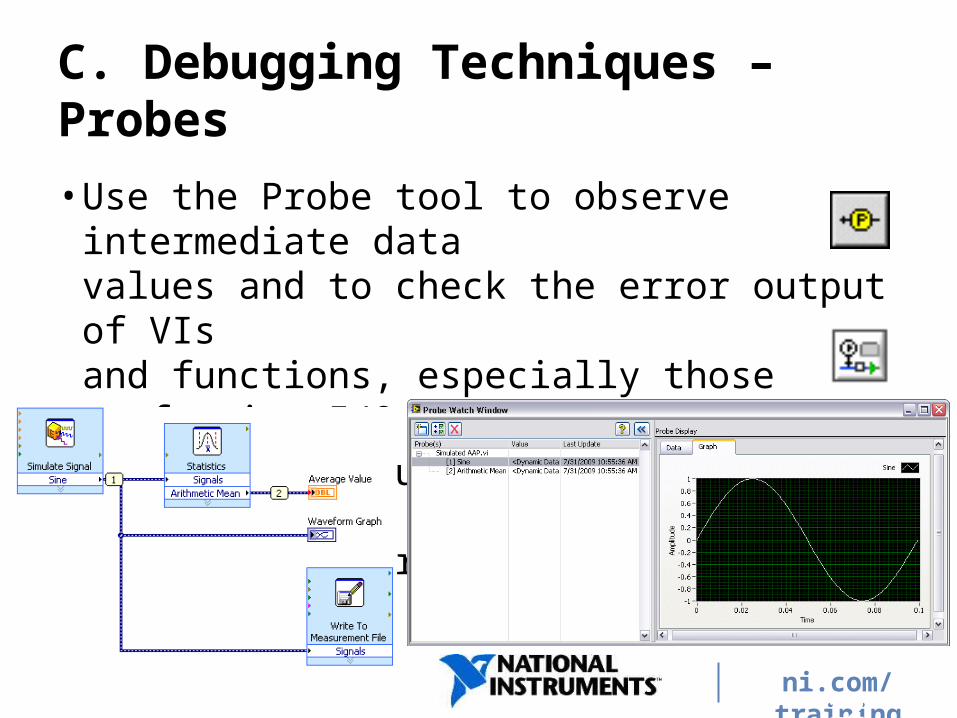
C. Debugging Techniques – Probes
• Use the Probe tool to observe intermediate data values and to check the error output of VIs and functions, especially those performing I/O• Retain the values in the wires so that you can
probe wires for data after execution has finished
12
ni.com/training
C. Debugging Techniques – Breakpoints
• When you reach a breakpoint during execution, the VI pauses and the Pause button appears red• You can take the following actions at a breakpoint:
− Single-step through execution using the single-stepping buttons
− Probe wires to check intermediate values− Change values of front panel controls − Click the Pause button to continue running to the next
breakpoint or until the VI finishes running
13
ni.com/training
D. Undefined or Unexpected Data
• ∞ (Inf)− Infinity− Divided a number by zero?• NaN
− Not a number− Produced by invalid operations, such as taking the square root
of a negative number• Check for unexpected Inf values or NaN values in your
mathematical operations
14
ni.com/training
E. Error Checking and Error Handling
• No matter how confident you are in the VI you create, you cannot predict every problem a user can encounter• Without a mechanism to check for errors, you know only that
the VI does not work properly• Error checking tells you why and where errors occur
− Automatic error handling− Manual error handling
15
ni.com/training
E. Error Checking and Error Handling – Automatic Error Handling
• LabVIEW automatically handles any known error when a VI runs by: − suspending execution,− highlighting the subVI or function where the error occurred,− and displaying the Error dialog box• Select File»VI Properties and select Execution from the
Category pull-down menu to disable automatic error handling for a specific VI
16

ni.com/training
E. Error Checking and Error Handling – Manual Error Handling
• To disable automatic error handling for a subVI or function, wire its error out cluster to the error in cluster of another subVI or function or to an error out indicator• Use the LabVIEW error handling VIs,
functions, and parameters to manage errors
17

ni.com/training
E. Error Checking and Error Handling – Error Clusters
• Use the error cluster controls and indicators to create error inputs and outputs in subVIs• The error in and error out clusters include the following
components of information:− Status − Code − Source
18
GOAL
Exercise 3-2Concept: Debugging
Use the debugging tools built into LabVIEW.
19

DISCUSSION
Exercise 3-2Concept: Debugging
• If you have a VI with a broken Run arrow, what should you do first?• After you fixed your broken Run arrow, your VI results show
unexpected data. What can you do next?

ni.com/training
Summary—Quiz
1. How do you disable automatic error handling?a) Enable execution highlightingb) Wire the error out cluster of a subVI to the error in
cluster of another subVIc) Place a checkmark in the Show Warnings checkbox of
the Error List dialog box
21
ni.com/training
Summary—Quiz Answer
1. How do you disable automatic error handling?a) Enable execution highlightingb) Wire the error out cluster of a subVI to the error in
cluster of another subVIc) Place a checkmark in the Show Warnings checkbox of
the Error List dialog box
22
ni.com/training
Summary—Quiz
2. Which of the following are the contents of the error cluster? a) Status: Booleanb) Error: Stringc) Code: 32-bit integerd) Source: String
23
ni.com/training
Summary—Quiz Answer
2. Which of the following are the contents of the error cluster? a) Status: Booleanb) Error: Stringc) Code: 32-bit integerd) Source: String
24