LESSON 14: TOPOGRAPHIC MAPS Key Concepts -...
21
LESSON 14: TOPOGRAPHIC MAPS Key Concepts In this lesson we will focus on summarising what you need to know about: Locating exact position (degrees, minutes and seconds) Relative position, direction and magnetic bearing Scale: word, ratio and line scale Distance: Measuring distances and converting to ground distance along a straight line Calculating area Using the Index Locating places on different maps using degrees and minutes Comparing information from different maps Contours and Landforms Cross Sections – 1:50000 Topographical Maps Vertical Exaggeration Intervisibility Gradient X-planation Topographic Map Skills Remember in some sections e.g. landforms and features we do not look at the map in isolation. We use the topographic map with the photograph. This section also involves calculations and drawing of cross sections, make sure you have all the necessary equipment available. Coordinates (Grid Reference) Look at the latitudes and longitudes. Their intersections give the position (Grid Reference) of a place on the map in degrees (°), minutes (‘) and seconds (‘’). The coordinates (where two lines intersect) usually give the position of a place. The coordinates we use are lines of latitude and longitude. Lines of latitude measure the distance north and south of the equator (0°). In SA, lines of latitude tell us in degrees how far south of the equator a place is. For example, 30°S means thirty degrees south of the equator. Lines of longitude measure the distance west or east of the Greenwich Meridian (0°). All places in SA will be east, for example, 30°E means thirty degrees east of Greenwich.
Transcript of LESSON 14: TOPOGRAPHIC MAPS Key Concepts -...
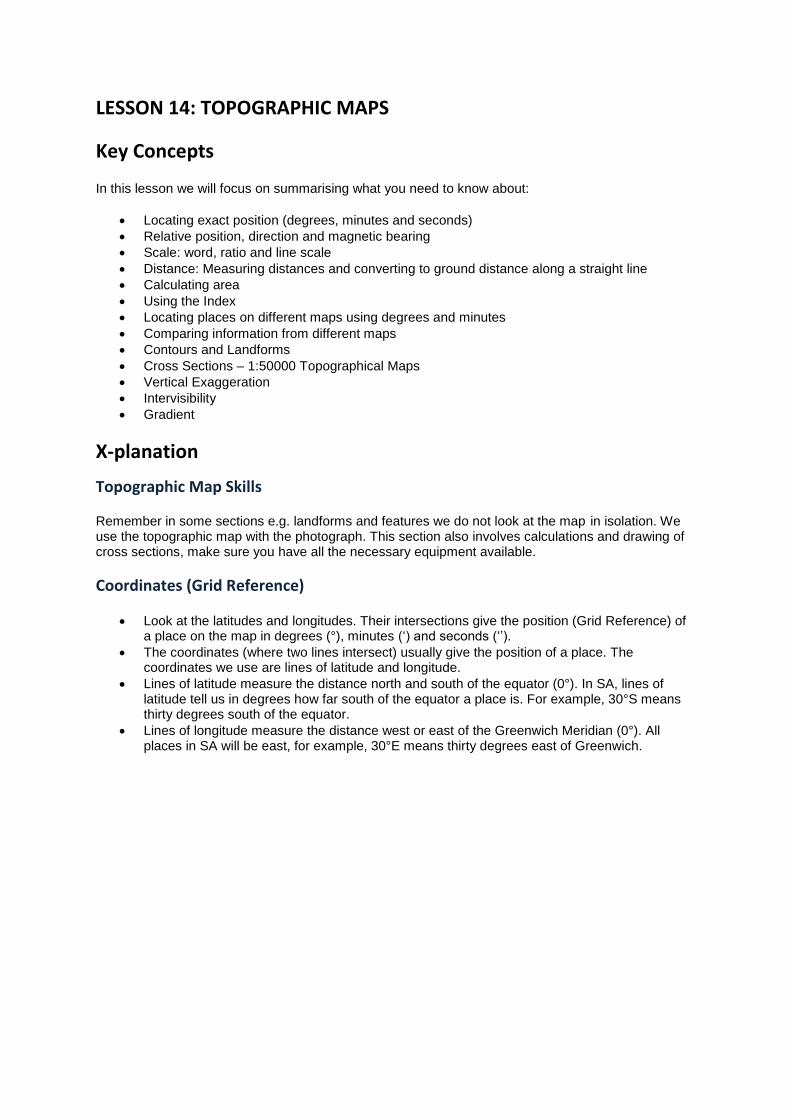
LESSON 14: TOPOGRAPHIC MAPS
Key Concepts
In this lesson we will focus on summarising what you need to know about:
Locating exact position (degrees, minutes and seconds)
Relative position, direction and magnetic bearing
Scale: word, ratio and line scale
Distance: Measuring distances and converting to ground distance along a straight line
Calculating area
Using the Index
Locating places on different maps using degrees and minutes
Comparing information from different maps
Contours and Landforms
Cross Sections – 1:50000 Topographical Maps
Vertical Exaggeration
Intervisibility
Gradient
X-planation
Topographic Map Skills
Remember in some sections e.g. landforms and features we do not look at the map in isolation. We use the topographic map with the photograph. This section also involves calculations and drawing of cross sections, make sure you have all the necessary equipment available.
Coordinates (Grid Reference)
Look at the latitudes and longitudes. Their intersections give the position (Grid Reference) of a place on the map in degrees (°), minutes (‘) and seconds (‘’).
The coordinates (where two lines intersect) usually give the position of a place. The coordinates we use are lines of latitude and longitude.
Lines of latitude measure the distance north and south of the equator (0°). In SA, lines of latitude tell us in degrees how far south of the equator a place is. For example, 30°S means thirty degrees south of the equator.
Lines of longitude measure the distance west or east of the Greenwich Meridian (0°). All places in SA will be east, for example, 30°E means thirty degrees east of Greenwich.
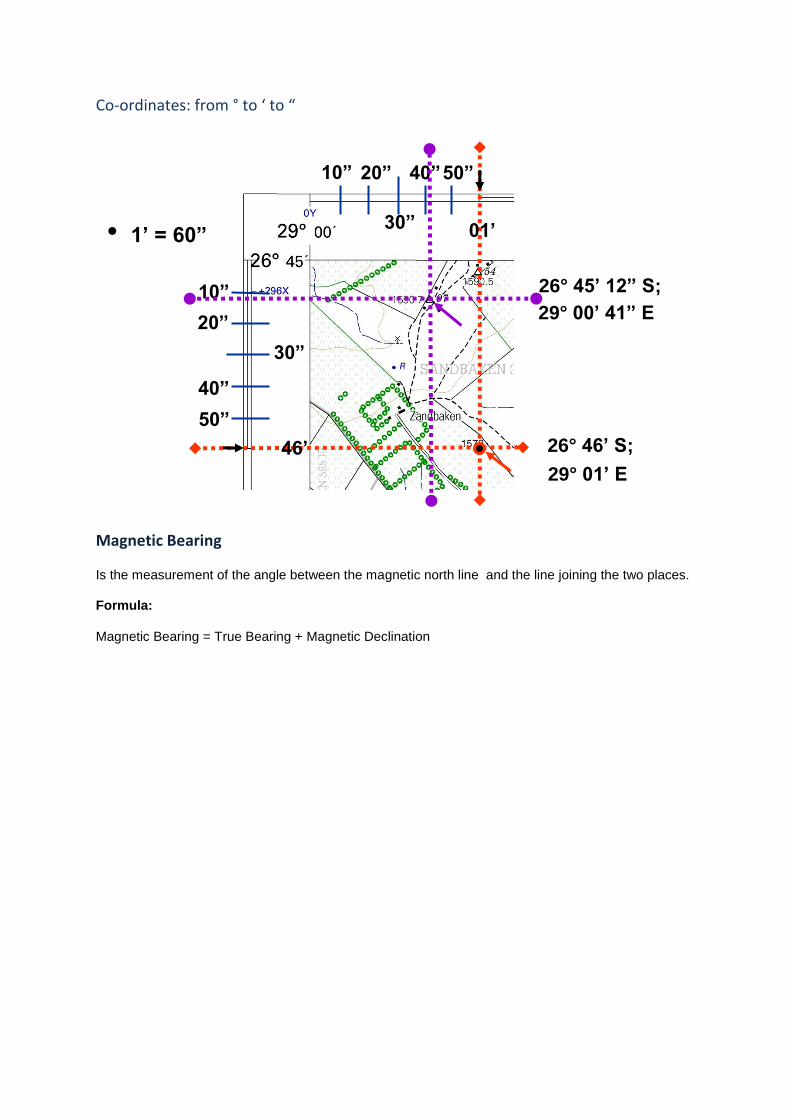
Co-ordinates: from ° to ‘ to “
Magnetic Bearing
Is the measurement of the angle between the magnetic north line and the line joining the two places. Formula:
Magnetic Bearing = True Bearing + Magnetic Declination
• 1’ = 60” 30”
20” 10” 40” 50”
30”
10”
20”
40”
50”
01’
46’ 26° 46’ S;
29° 01’ E
26° 45’ 12” S;
29° 00’ 41” E

True Bearing
Magnetic Declination
302º
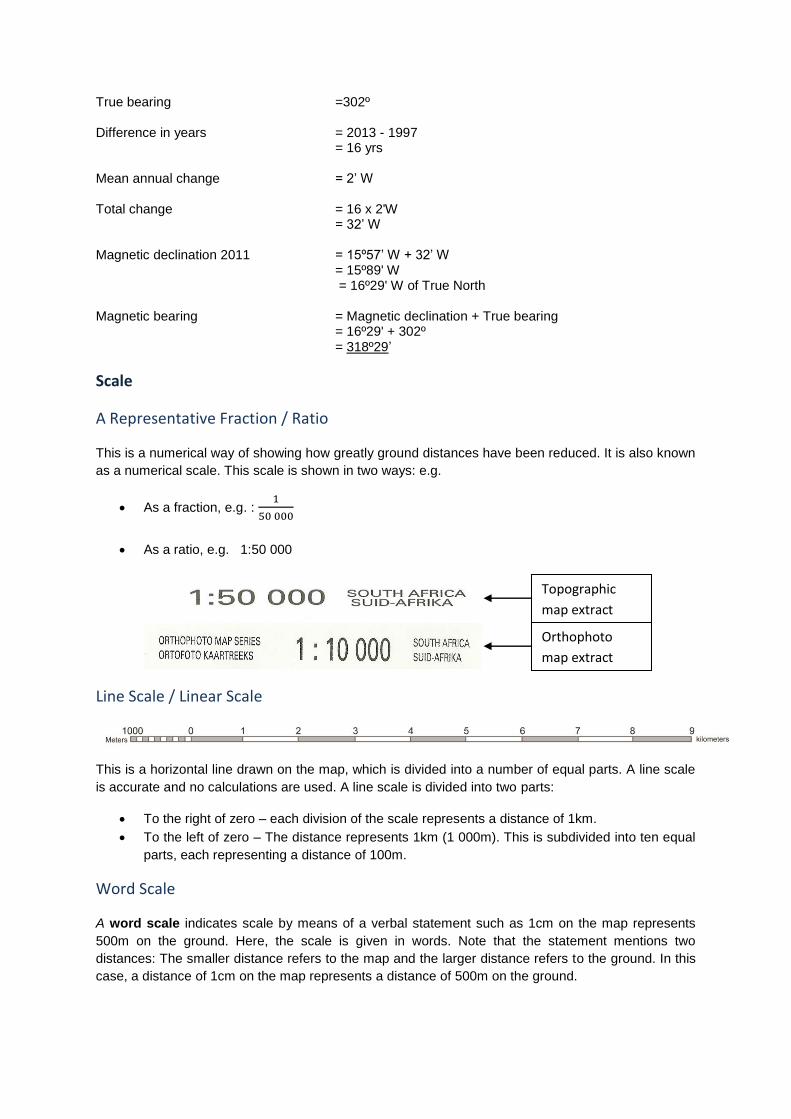
True bearing =302º Difference in years = 2013 - 1997
= 16 yrs Mean annual change = 2’ W
Total change = 16 x 2'W
= 32’ W
Magnetic declination 2011 = 15º57’ W + 32’ W = 15º89' W = 16º29' W of True North
Magnetic bearing = Magnetic declination + True bearing = 16º29' + 302º
= 318º29’
Scale
A Representative Fraction / Ratio
This is a numerical way of showing how greatly ground distances have been reduced. It is also known
as a numerical scale. This scale is shown in two ways: e.g.
As a fraction, e.g. :
As a ratio, e.g. 1:50 000
Line Scale / Linear Scale
This is a horizontal line drawn on the map, which is divided into a number of equal parts. A line scale
is accurate and no calculations are used. A line scale is divided into two parts:
To the right of zero – each division of the scale represents a distance of 1km.
To the left of zero – The distance represents 1km (1 000m). This is subdivided into ten equal
parts, each representing a distance of 100m.
Word Scale
A word scale indicates scale by means of a verbal statement such as 1cm on the map represents
500m on the ground. Here, the scale is given in words. Note that the statement mentions two
distances: The smaller distance refers to the map and the larger distance refers to the ground. In this
case, a distance of 1cm on the map represents a distance of 500m on the ground.
Topographic
map extract
Orthophoto
map extract
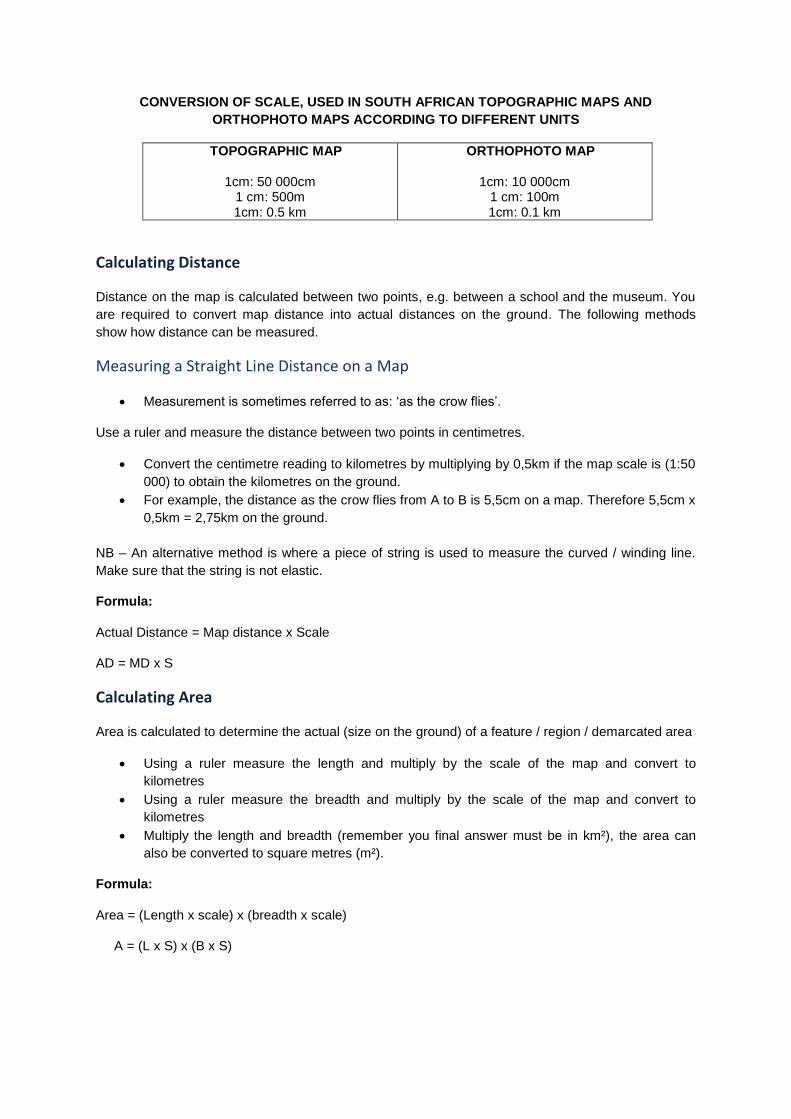
CONVERSION OF SCALE, USED IN SOUTH AFRICAN TOPOGRAPHIC MAPS AND
ORTHOPHOTO MAPS ACCORDING TO DIFFERENT UNITS
TOPOGRAPHIC MAP
1cm: 50 000cm 1 cm: 500m 1cm: 0.5 km
ORTHOPHOTO MAP
1cm: 10 000cm 1 cm: 100m 1cm: 0.1 km
Calculating Distance
Distance on the map is calculated between two points, e.g. between a school and the museum. You
are required to convert map distance into actual distances on the ground. The following methods
show how distance can be measured.
Measuring a Straight Line Distance on a Map
Measurement is sometimes referred to as: ‘as the crow flies’.
Use a ruler and measure the distance between two points in centimetres.
Convert the centimetre reading to kilometres by multiplying by 0,5km if the map scale is (1:50
000) to obtain the kilometres on the ground.
For example, the distance as the crow flies from A to B is 5,5cm on a map. Therefore 5,5cm x
0,5km = 2,75km on the ground.
NB – An alternative method is where a piece of string is used to measure the curved / winding line.
Make sure that the string is not elastic.
Formula:
Actual Distance = Map distance x Scale
AD = MD x S
Calculating Area
Area is calculated to determine the actual (size on the ground) of a feature / region / demarcated area
Using a ruler measure the length and multiply by the scale of the map and convert to
kilometres
Using a ruler measure the breadth and multiply by the scale of the map and convert to
kilometres
Multiply the length and breadth (remember you final answer must be in km²), the area can
also be converted to square metres (m²).
Formula:
Area = (Length x scale) x (breadth x scale)
A = (L x S) x (B x S)

Map Index
Is there a title and a code? Look at the top of the map. A map code always appears next to the title,
e.g. 2527 CA Rustenburg West. In this case Rustenburg West n is the title and 2527 CA is the code.
The map code shows that the map is in the vicinity of the coordinates 25°S; 27°E. CA is used to
distinguish all maps within the area of 1°latitude X 1°longitude. Each small square represents a map
sheet. Therefore, an area of 1°latitude X 1°longitude is covered by 16 map sheets. SA as a whole is
covered by 1 916 map Sheets.
Latitude Longitude
Photo Number
Topographic
map extract
Orthophoto
map extract
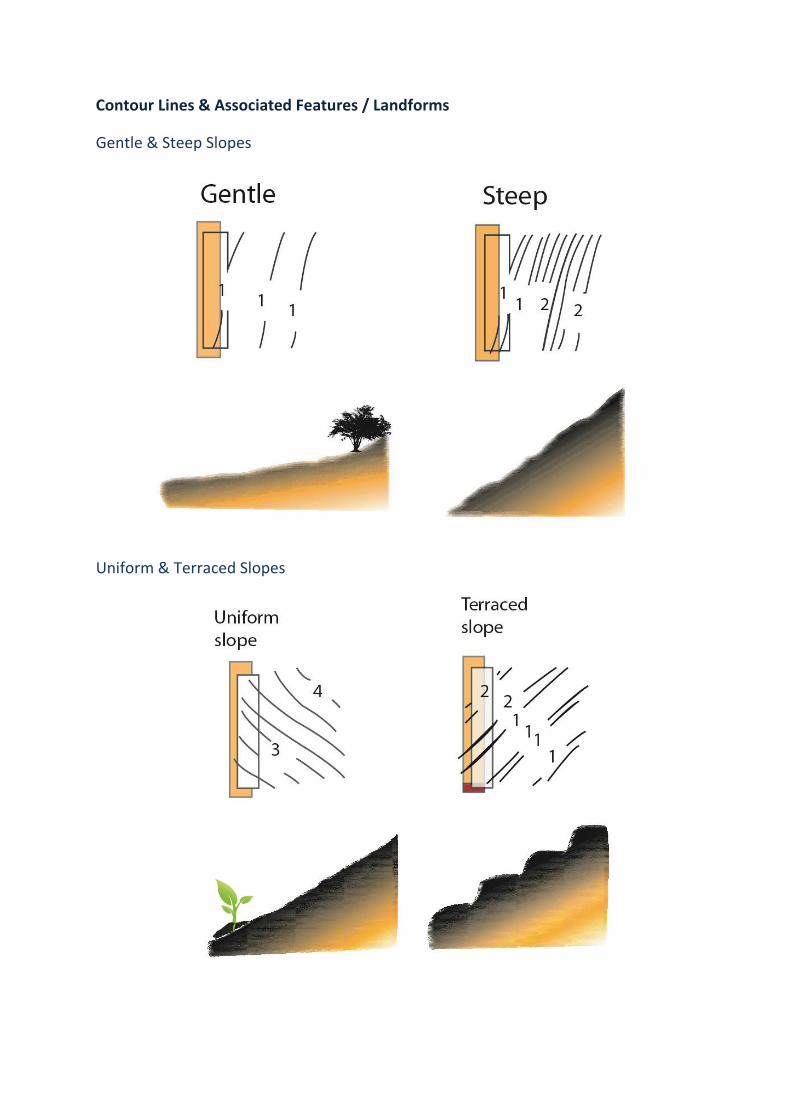
Contour Lines & Associated Features / Landforms
Gentle & Steep Slopes
Uniform & Terraced Slopes
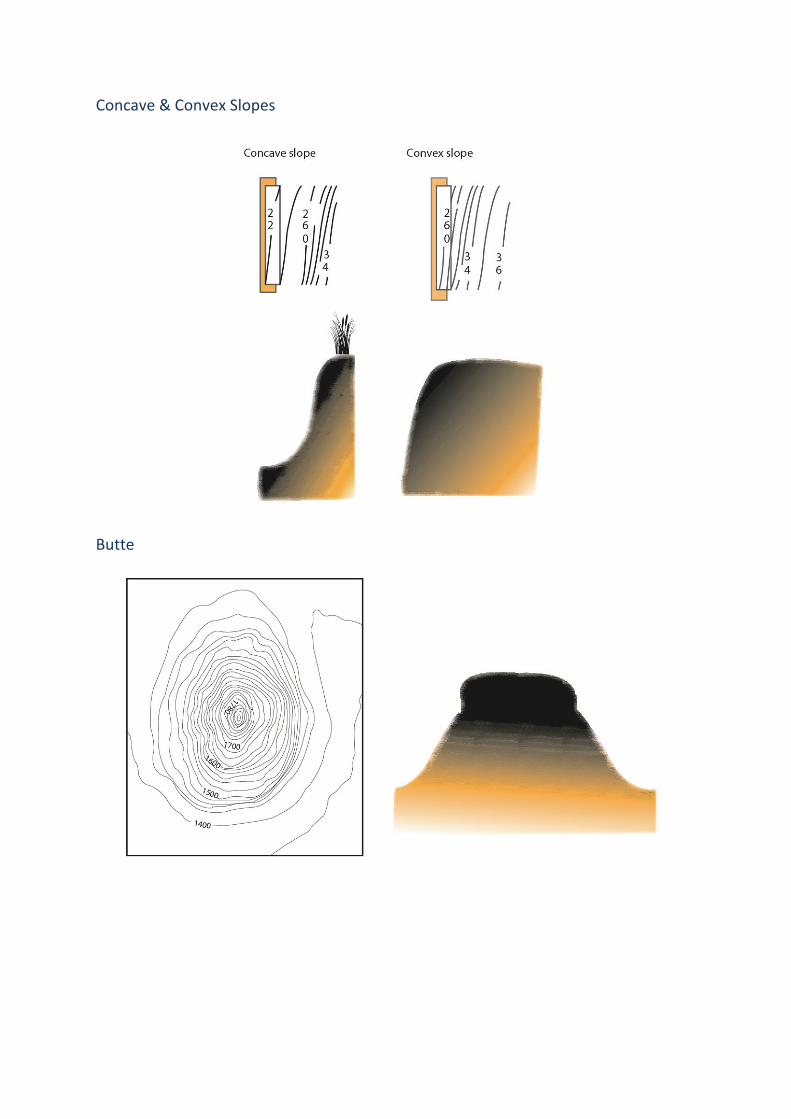
Concave & Convex Slopes
Butte
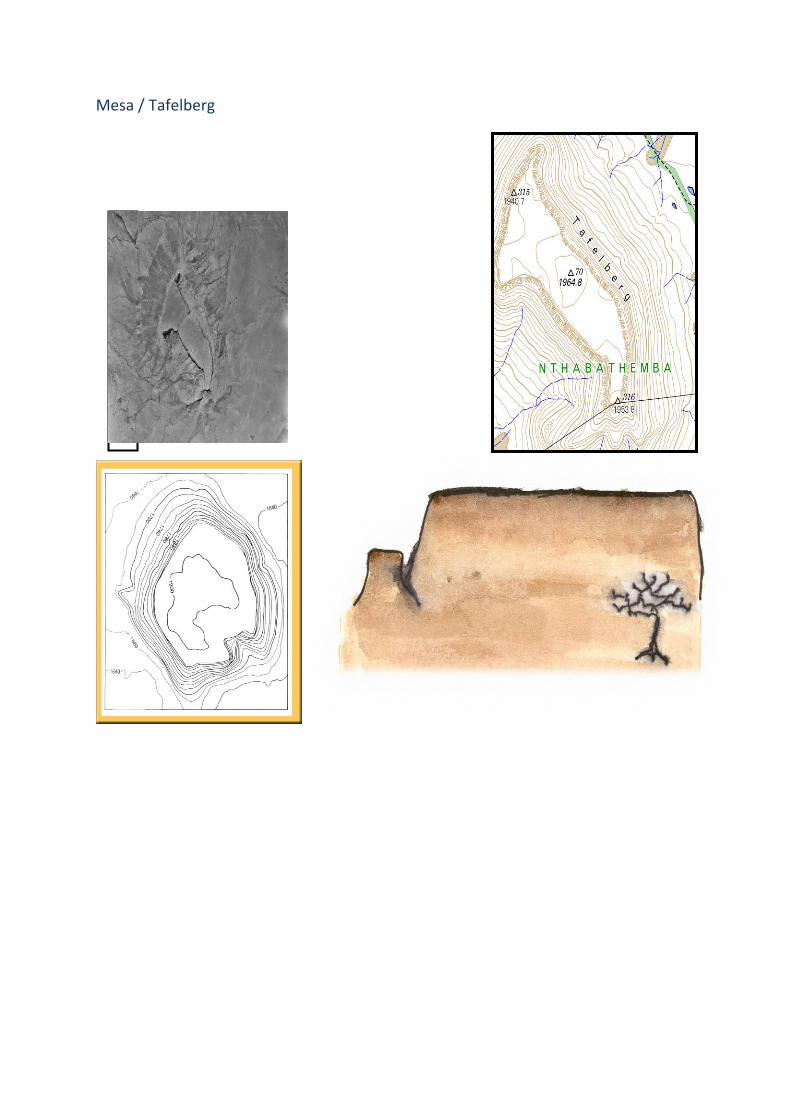
Mesa / Tafelberg

Poort / Gap
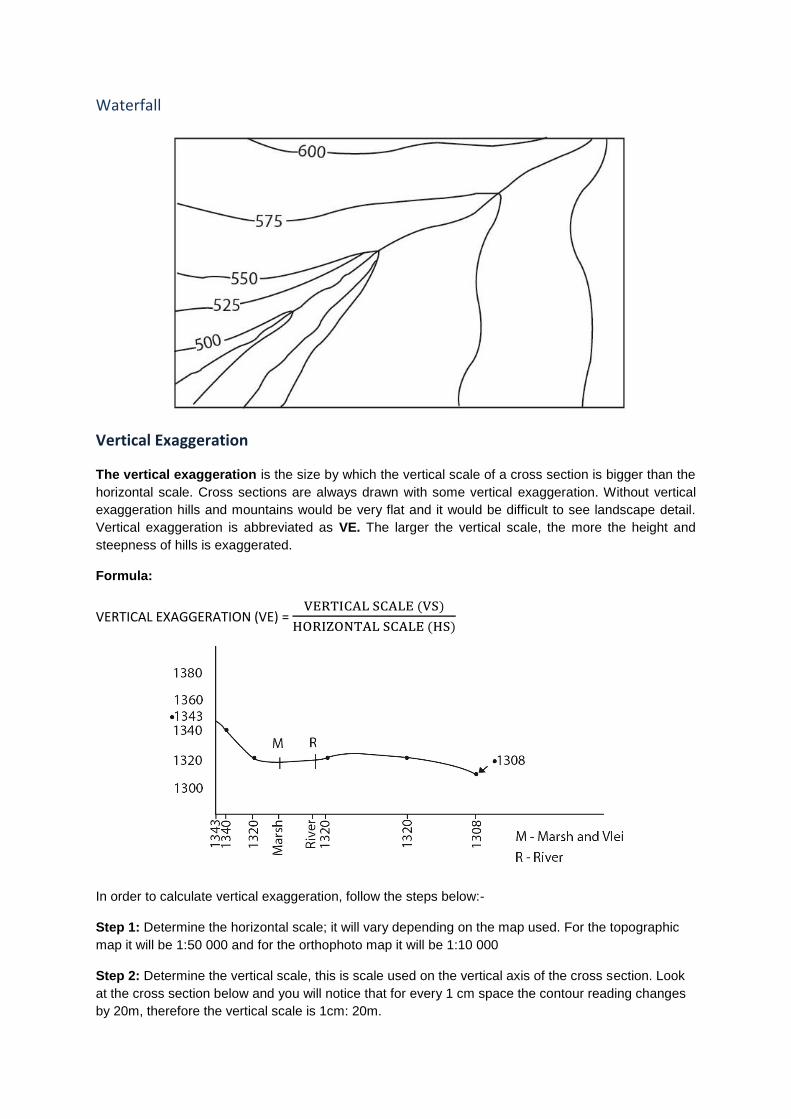
Waterfall
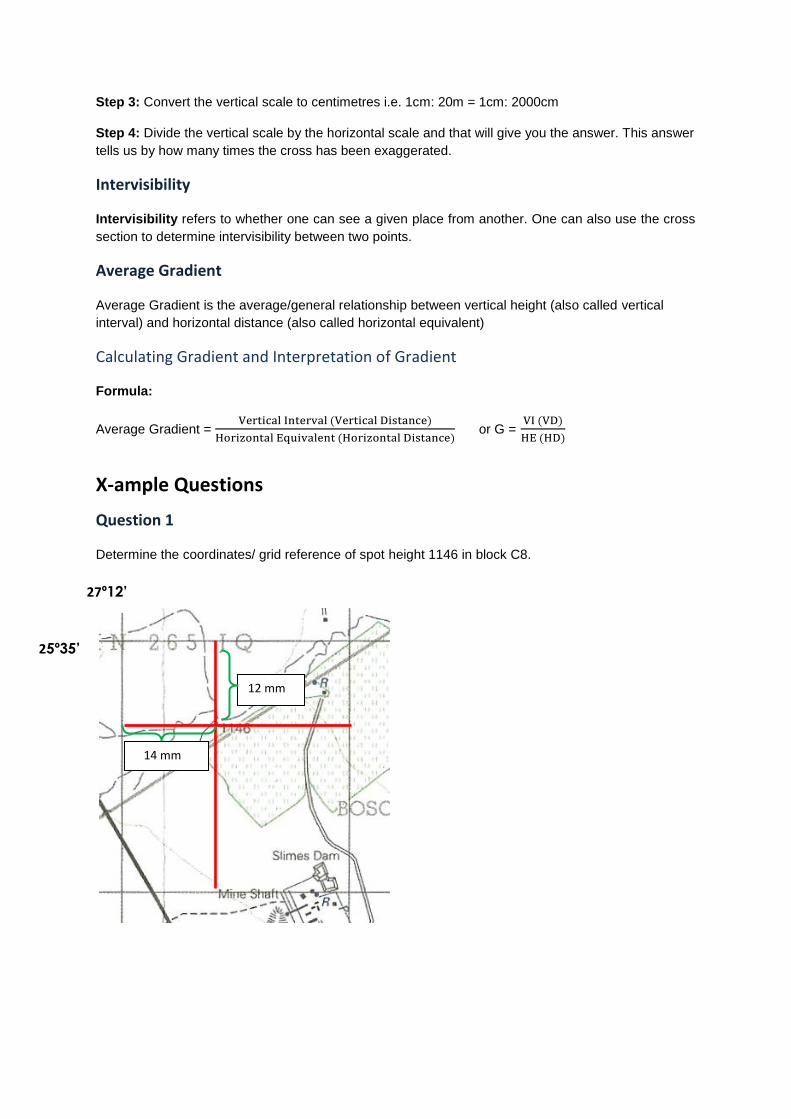
Vertical Exaggeration
The vertical exaggeration is the size by which the vertical scale of a cross section is bigger than the
horizontal scale. Cross sections are always drawn with some vertical exaggeration. Without vertical
exaggeration hills and mountains would be very flat and it would be difficult to see landscape detail.
Vertical exaggeration is abbreviated as VE. The larger the vertical scale, the more the height and
steepness of hills is exaggerated.
Formula:
VERTICAL EXAGGERATION (VE) =
In order to calculate vertical exaggeration, follow the steps below:-
Step 1: Determine the horizontal scale; it will vary depending on the map used. For the topographic
map it will be 1:50 000 and for the orthophoto map it will be 1:10 000
Step 2: Determine the vertical scale, this is scale used on the vertical axis of the cross section. Look
at the cross section below and you will notice that for every 1 cm space the contour reading changes
by 20m, therefore the vertical scale is 1cm: 20m.
Step 3: Convert the vertical scale to centimetres i.e. 1cm: 20m = 1cm: 2000cm
Step 4: Divide the vertical scale by the horizontal scale and that will give you the answer. This answer
tells us by how many times the cross has been exaggerated.
Intervisibility
Intervisibility refers to whether one can see a given place from another. One can also use the cross
section to determine intervisibility between two points.
Average Gradient
Average Gradient is the average/general relationship between vertical height (also called vertical
interval) and horizontal distance (also called horizontal equivalent)
Calculating Gradient and Interpretation of Gradient
Formula:
Average Gradient =
or G =
X-ample Questions
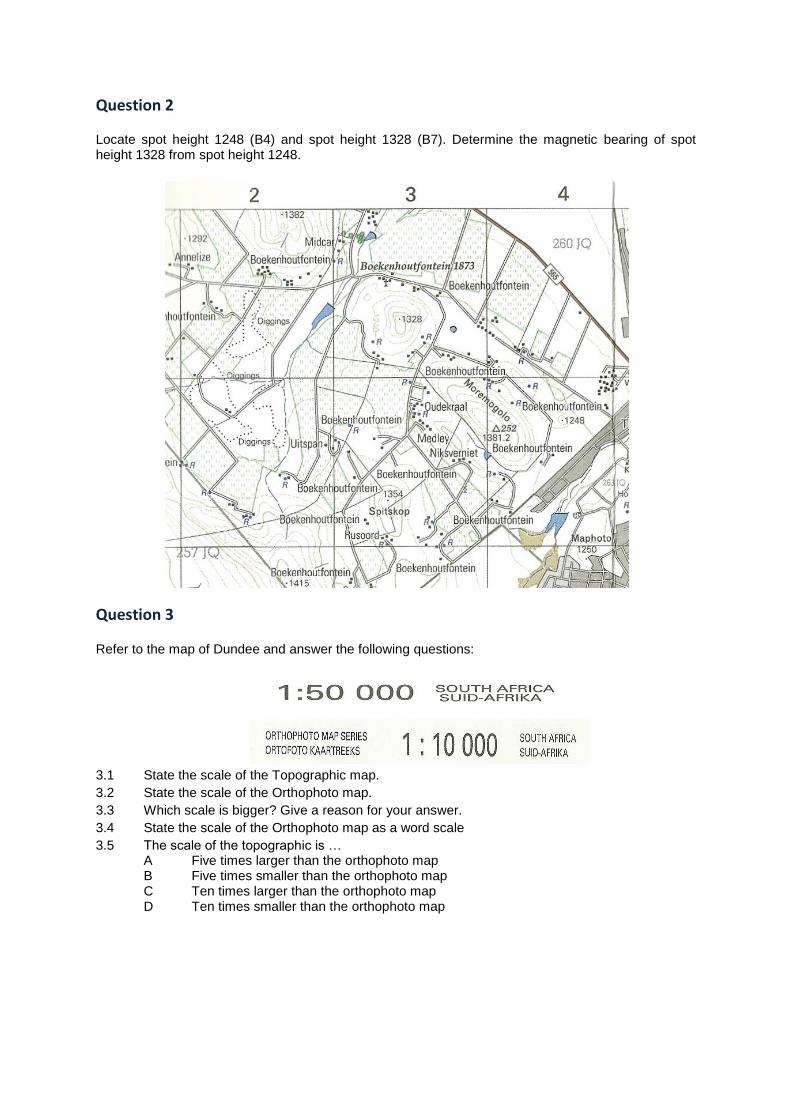
Question 1
Determine the coordinates/ grid reference of spot height 1146 in block C8.
12 mm
14 mm
27º12’
25º35’
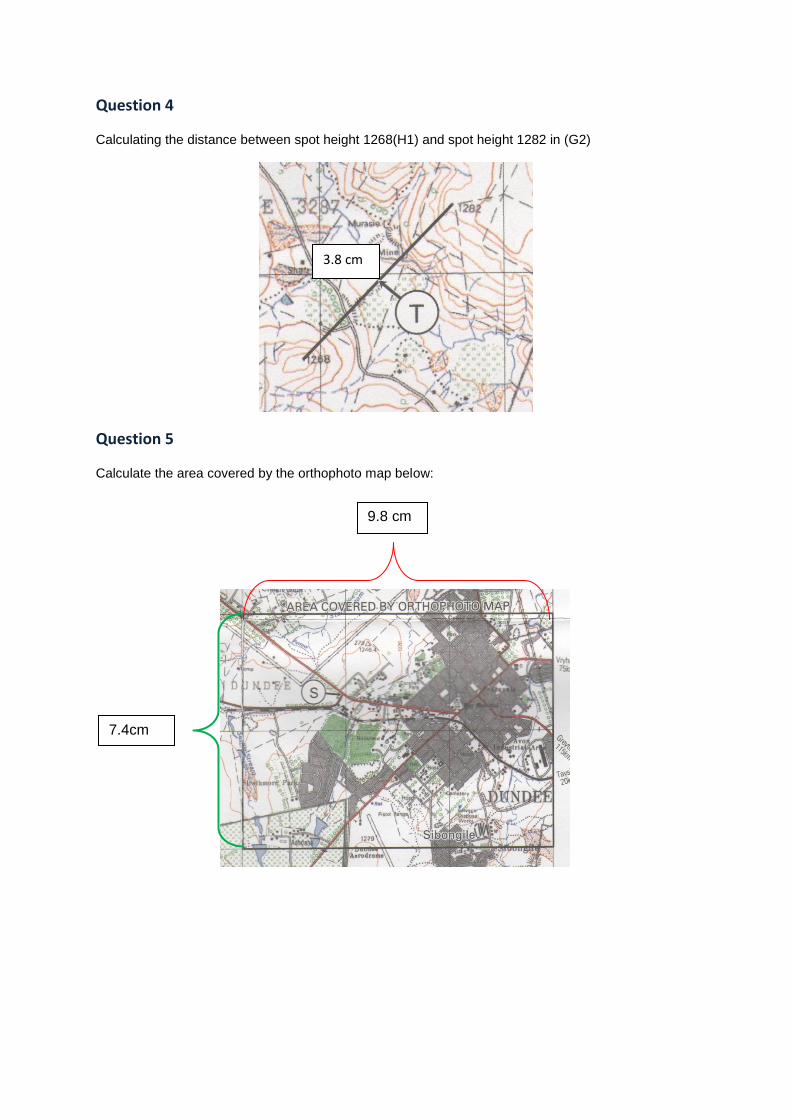
Question 2
Locate spot height 1248 (B4) and spot height 1328 (B7). Determine the magnetic bearing of spot height 1328 from spot height 1248.
Question 3
Refer to the map of Dundee and answer the following questions:
3.1 State the scale of the Topographic map.
3.2 State the scale of the Orthophoto map.
3.3 Which scale is bigger? Give a reason for your answer.
3.4 State the scale of the Orthophoto map as a word scale
3.5 The scale of the topographic is … A Five times larger than the orthophoto map B Five times smaller than the orthophoto map C Ten times larger than the orthophoto map D Ten times smaller than the orthophoto map
Question 4
Calculating the distance between spot height 1268(H1) and spot height 1282 in (G2)
Question 5
Calculate the area covered by the orthophoto map below:
3.8 cm
7.4cm
9.8 cm
.
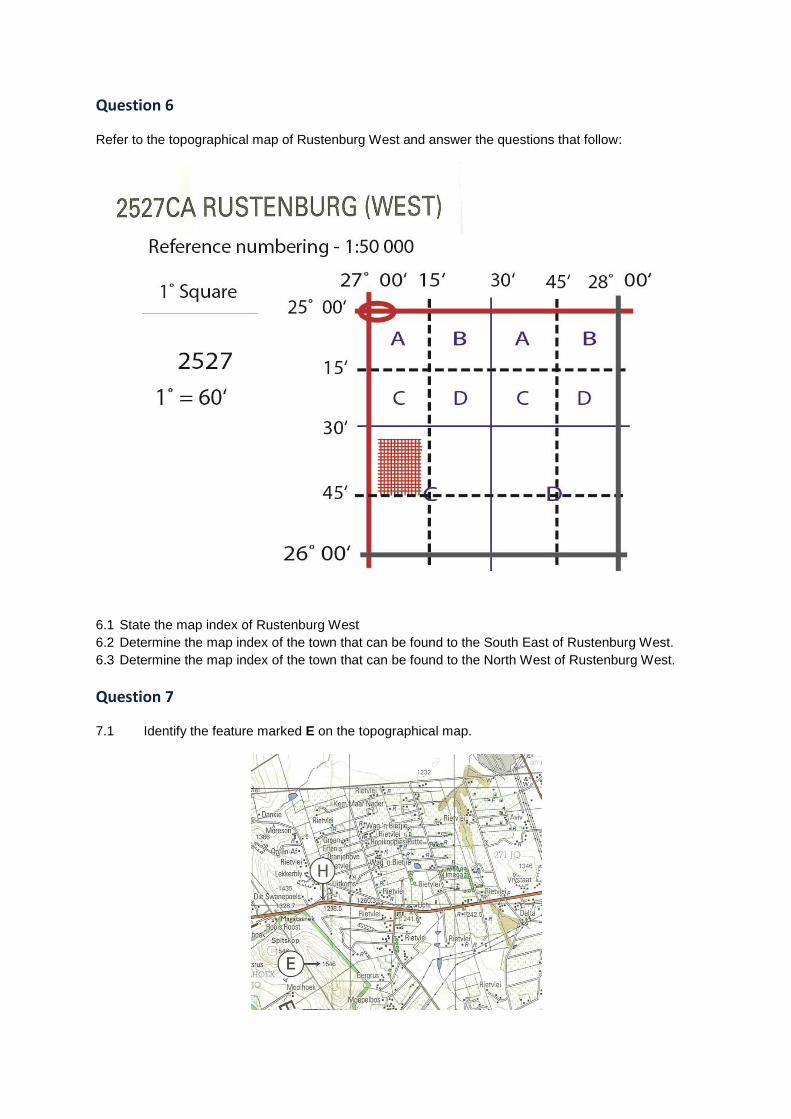
Question 6
Refer to the topographical map of Rustenburg West and answer the questions that follow:
6.1 State the map index of Rustenburg West
6.2 Determine the map index of the town that can be found to the South East of Rustenburg West.
6.3 Determine the map index of the town that can be found to the North West of Rustenburg West.
Question 7
7.1 Identify the feature marked E on the topographical map.
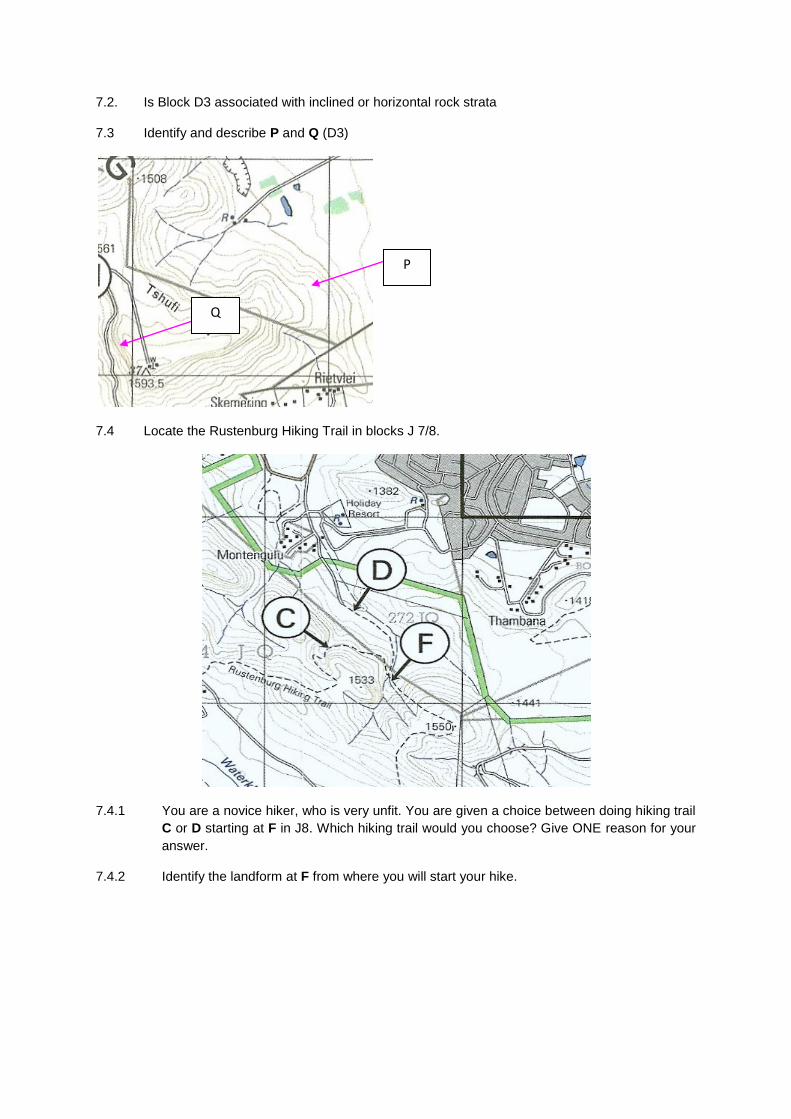
7.2. Is Block D3 associated with inclined or horizontal rock strata
7.3 Identify and describe P and Q (D3)
7.4 Locate the Rustenburg Hiking Trail in blocks J 7/8.
7.4.1 You are a novice hiker, who is very unfit. You are given a choice between doing hiking trail
C or D starting at F in J8. Which hiking trail would you choose? Give ONE reason for your
answer.
7.4.2 Identify the landform at F from where you will start your hike.
P
Q
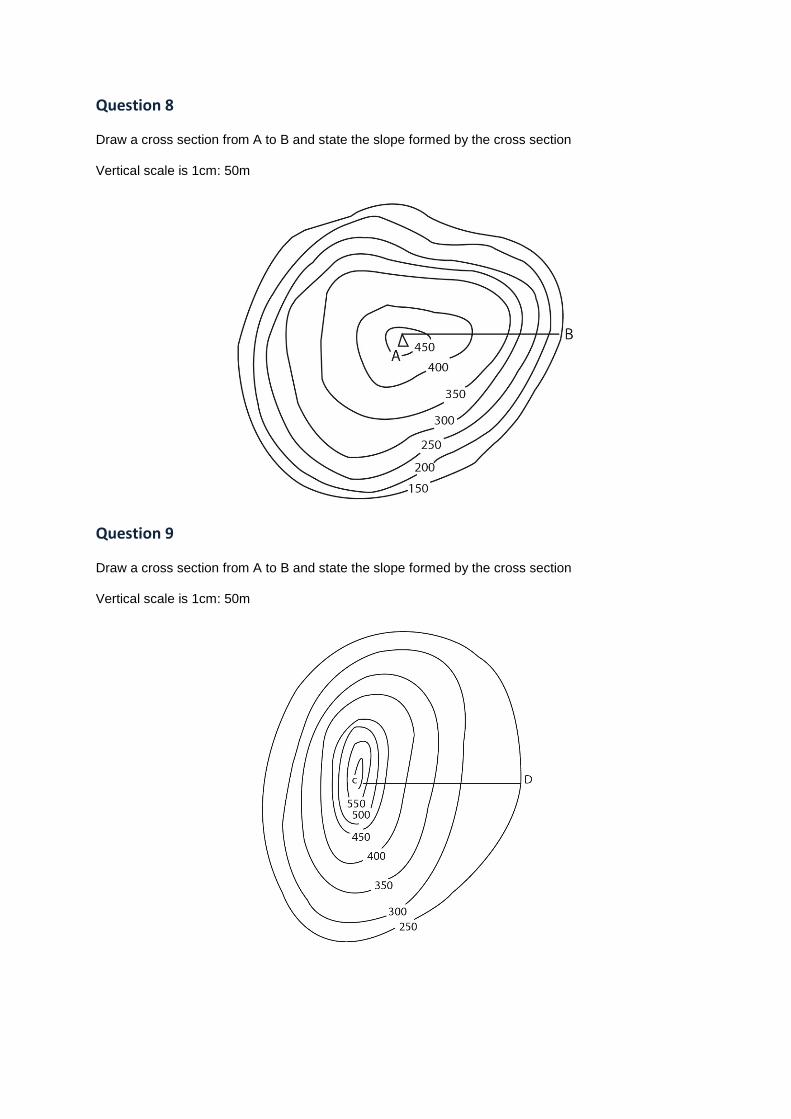
Question 8
Draw a cross section from A to B and state the slope formed by the cross section
Vertical scale is 1cm: 50m
Question 9
Draw a cross section from A to B and state the slope formed by the cross section
Vertical scale is 1cm: 50m

Question 10
Draw a cross section from A to B and show the cliff and the river on the cross section
Vertical scale is 1cm: 100m
Question 11
Calculate the vertical exaggeration of the cross section between 1343 and 1308.
(Vertical scale - 1cm: 20m)
Question 12
Determine the intervisibility of D from S and R from S on the cross section provided.
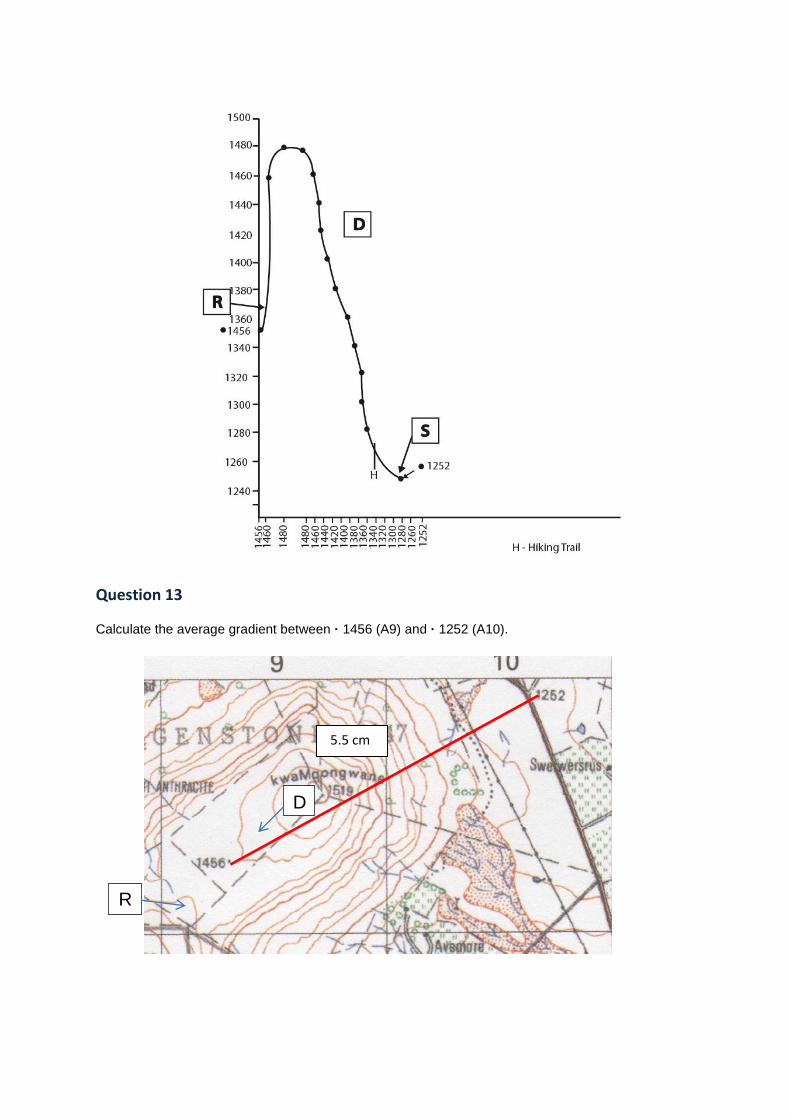
Question 13
Calculate the average gradient between · 1456 (A9) and · 1252 (A10).
D
R
5.5 cm
X-ercise Questions
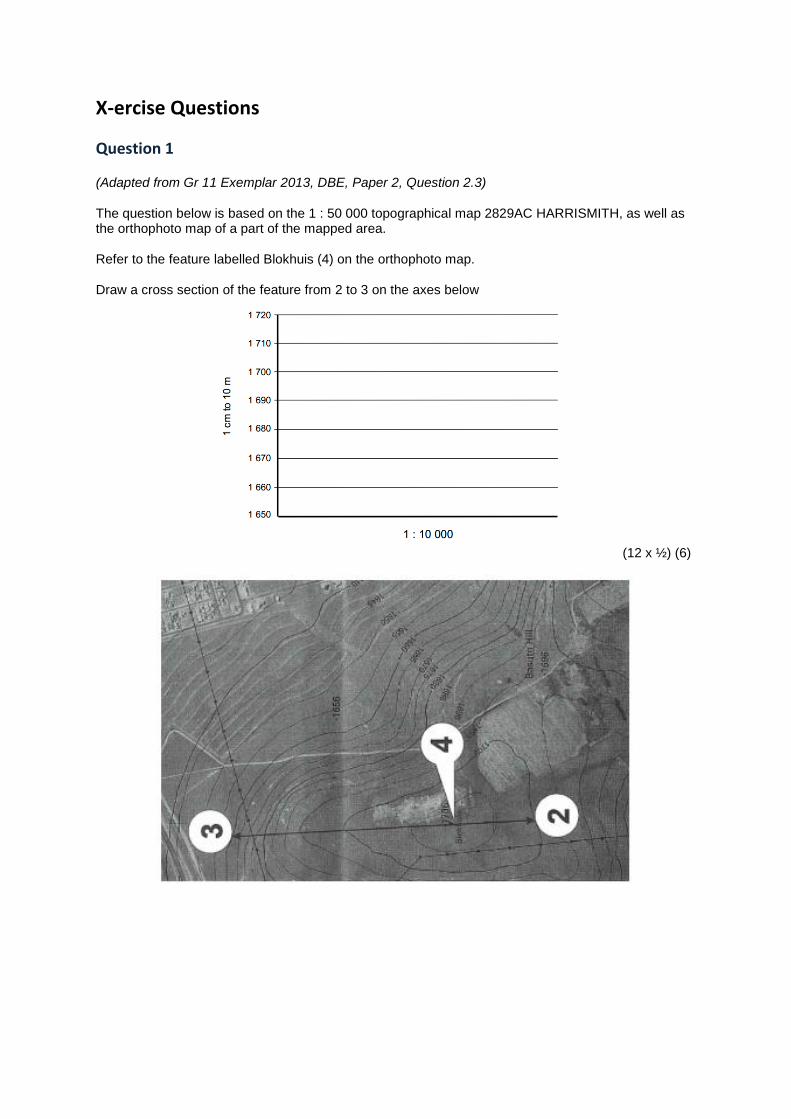
Question 1
(Adapted from Gr 11 Exemplar 2013, DBE, Paper 2, Question 2.3) The question below is based on the 1 : 50 000 topographical map 2829AC HARRISMITH, as well as the orthophoto map of a part of the mapped area. Refer to the feature labelled Blokhuis (4) on the orthophoto map. Draw a cross section of the feature from 2 to 3 on the axes below
(12 x ½) (6)

Solutions to X-ercise Questions
Question 1
(Adapted from Gr 11 Exemplar 2013, DBE, Paper 2, Question 2.3)