Lesson 1 Introduction to DNA...
22
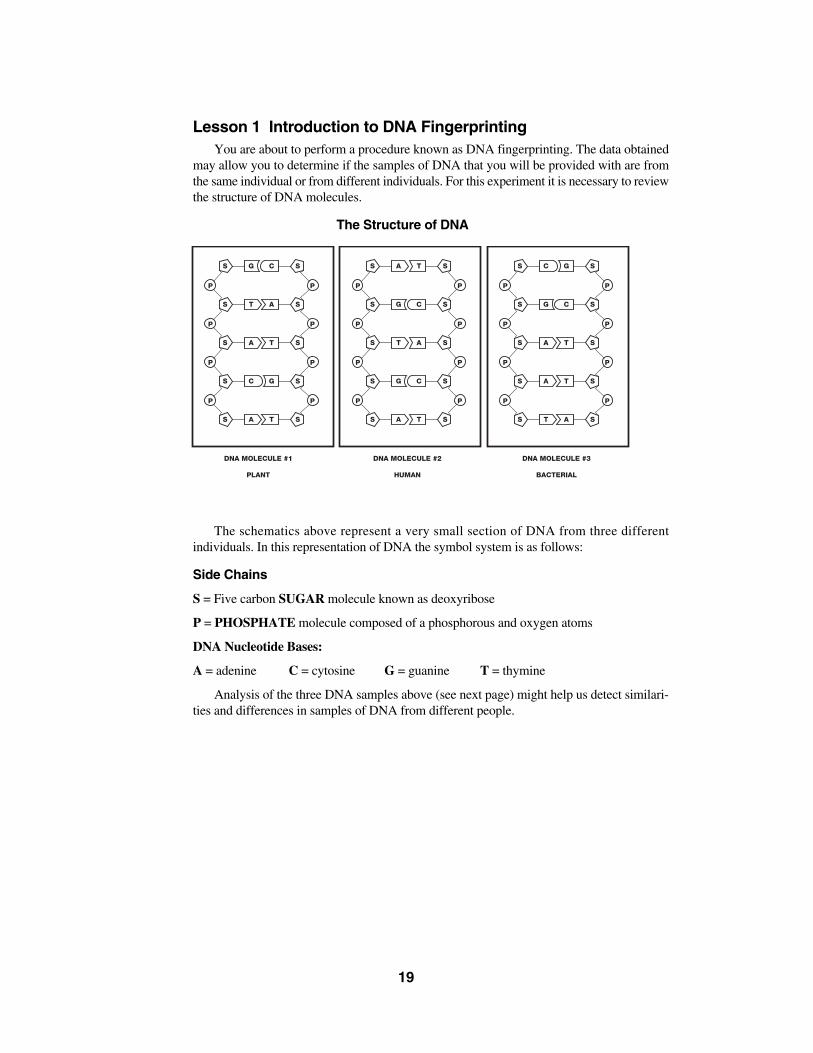
Lesson 1 Introduction to DNA Fingerprinting You are about to perform a procedure known as DNA fingerprinting. The data obtained may allow you to determine if the samples of DNA that you will be provided with are from the same individual or from different individuals. For this experiment it is necessary to review the structure of DNA molecules. The Structure of DNA The schematics above represent a very small section of DNA from three different individuals. In this representation of DNA the symbol system is as follows: Side Chains S = Five carbon SUGAR molecule known as deoxyribose P = PHOSPHATE molecule composed of a phosphorous and oxygen atoms DNA Nucleotide Bases: A = adenine C = cytosine G = guanine T = thymine Analysis of the three DNA samples above (see next page) might help us detect similari- ties and differences in samples of DNA from different people. 19
Transcript of Lesson 1 Introduction to DNA...
Lesson 1 Introduction to DNA FingerprintingYou are about to perform a procedure known as DNA fingerprinting. The data obtained
may allow you to determine if the samples of DNA that you will be provided with are fromthe same individual or from different individuals. For this experiment it is necessary to reviewthe structure of DNA molecules.
The Structure of DNA
The schematics above represent a very small section of DNA from three differentindividuals. In this representation of DNA the symbol system is as follows:
Side Chains
S = Five carbon SUGAR molecule known as deoxyribose
P = PHOSPHATE molecule composed of a phosphorous and oxygen atoms
DNA Nucleotide Bases:
A = adenine C = cytosine G = guanine T = thymine
Analysis of the three DNA samples above (see next page) might help us detect similari-ties and differences in samples of DNA from different people.
19
Lesson 1 Introduction to DNA Fingerprinting
Consideration 1 What is the structure of DNA?
1. Compare the “backbone” of the sugar-phosphate arrangement in the side chains of allthree figures. Are there any differences?
2. In the above figure, do all three samples contain the same bases? Describe your obser-vations.
3. Are the bases paired in an identical manner in all three samples? Describe the pattern ofthe base pair bonding.
4. In your attempt to analyze DNA samples from three different individuals, what conclu-sions can you make about the similarities and differences of the DNA samples?
5. What will you need to compare between these DNA samples to determine if they areidentical or non-identical?
20
Lesson 2 Restriction Digests of DNA Samples
Consideration 2 How can we detect differences in base sequences?
At first sight, your task might seem rather difficult. You need to determine if the linearbase pair sequence in the DNA samples is identical or not! An understanding of some rela-tively recent developments in recombinant DNA technology might help you to develop aplan.
In 1968, Dr. Werner Arber at the University of Basel, Switzerland and Dr. HamiltonSmith at the Johns Hopkins University, Baltimore, discovered a group of enzymes in bacte-ria, which when added to any DNA will result in the breakage [hydrolysis] of the sugar-phosphate bond between certain specific nucleotide bases [recognition sites]. This causesthe double strand of DNA to break along the recognition site and the DNA molecule becomesfractured into two pieces. These molecular scissors or “cutting” enzymes are restrictionendonucleases.
[Can you figure out why they are called restriction endonucleases?]
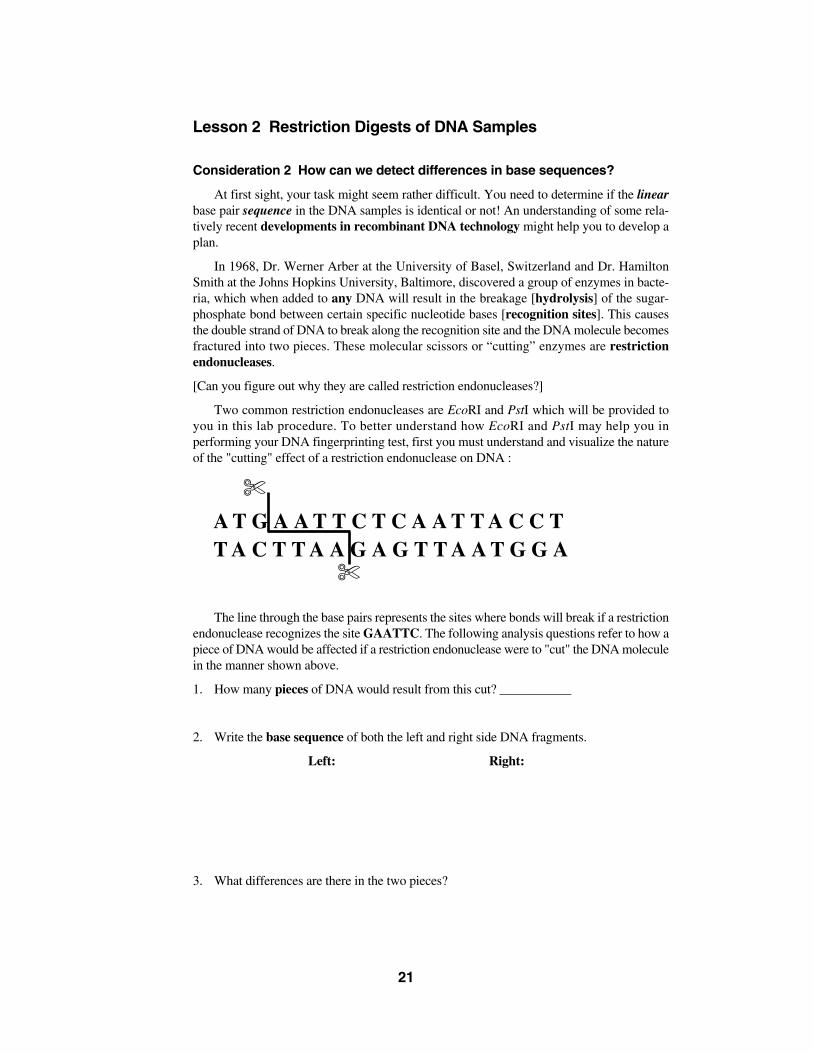
Two common restriction endonucleases are EcoRI and PstI which will be provided toyou in this lab procedure. To better understand how EcoRI and PstI may help you in performing your DNA fingerprinting test, first you must understand and visualize the natureof the "cutting" effect of a restriction endonuclease on DNA :
The line through the base pairs represents the sites where bonds will break if a restrictionendonuclease recognizes the site GAATTC. The following analysis questions refer to how apiece of DNA would be affected if a restriction endonuclease were to "cut" the DNA moleculein the manner shown above.
1. How many pieces of DNA would result from this cut? ___________
2. Write the base sequence of both the left and right side DNA fragments.
Left: Right:
3. What differences are there in the two pieces?
21
A T G A A T T C T C A A T T A C C TT A C T T A A G A G T T A A T G G A
✄
✄
4. DNA fragment size can be expressed as the number of base pairs in the fragment. Indicatethe size of the fragments [mention any discrepancy you may detect].
a) The smaller fragment is ___________ base pairs (bp).
b) What is the length of the longer fragment? ______________
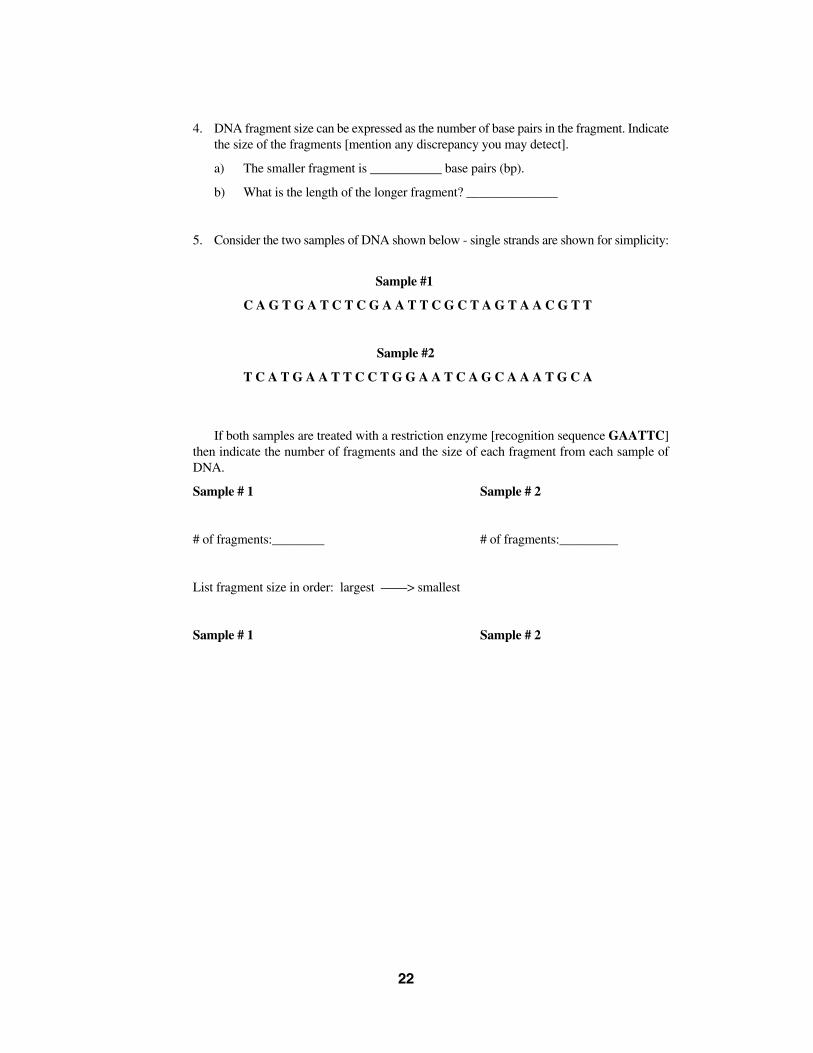
5. Consider the two samples of DNA shown below - single strands are shown for simplicity:
Sample #1
C A G T G A T C T C G A A T T C G C T A G T A A C G T T
Sample #2
T C A T G A A T T C C T G G A A T C A G C A A A T G C A
If both samples are treated with a restriction enzyme [recognition sequence GAATTC]then indicate the number of fragments and the size of each fragment from each sample ofDNA.
Sample # 1 Sample # 2
# of fragments:________ # of fragments:_________
List fragment size in order: largest ——> smallest
Sample # 1 Sample # 2
22
Lesson 2 Restriction Digestion of DNA Samples
Laboratory Procedure
Upon careful observation, it is apparent that the only difference between the DNA of dif-ferent individuals is the linear sequence of their base pairs. In the lab, your team will be given6 DNA samples. Recall that your task is to determine if any of them came from the sameindividual or if they came from different individuals.
Thus far your preliminary analysis has included the following:
• The similarities and differences between the DNA from different individuals.
• How restriction endonucleases cut [hydrolyze] DNA molecules.
• How adding the same restriction endonuclease to two samples of DNA might providesome clues about differences in their linear base pair sequence.
Now that you have a fairly clear understanding of these three items you are ready to pro-ceed to the first phase of the DNA fingerprinting procedure—performing a restriction digestof your DNA samples.
Your Workstation Check (✔✔) ListMake sure the materials listed below are present at your lab station prior to beginning the
Lab.
Student workstations (8) Number (✔✔)Pipet tips 15 ❑
EcoRI/PstI enzyme mix (ENZ) 1 tube (80 µl) ❑
P-10 or P-20 micropipet 1 ❑
Color coded microtubes: green, blue, orange, violet, red, yellow 1 ❑
Lab marker 1 ❑
Waste container 1 ❑
Styrofoam microtube rack 1 ❑
Ice bucket with ice 1 ❑
Instructors workstationCrime Scene DNA 1 vial ❑
Suspect 1 DNA 1 vial ❑
Suspect 2 DNA 1 vial ❑
Suspect 3 DNA 1 vial ❑
Suspect 4 DNA 1 vial ❑
Suspect 5 DNA 1 vial ❑
Incubator or bath—(37 °C) 1/class ❑
23
Lesson 2 Laboratory
Digest the DNA Samples
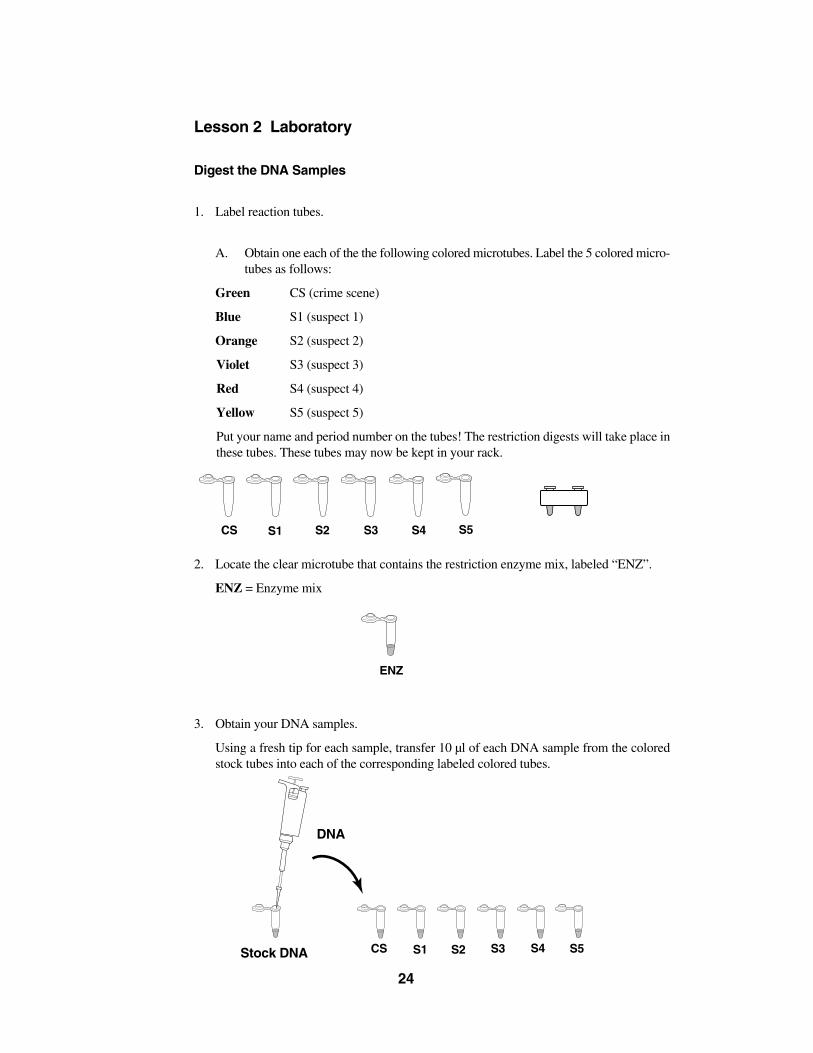
1. Label reaction tubes.
A. Obtain one each of the the following colored microtubes. Label the 5 colored micro-tubes as follows:
Green CS (crime scene)
Blue S1 (suspect 1)
Orange S2 (suspect 2)
Violet S3 (suspect 3)
Red S4 (suspect 4)
Yellow S5 (suspect 5)
Put your name and period number on the tubes! The restriction digests will take place inthese tubes. These tubes may now be kept in your rack.
2. Locate the clear microtube that contains the restriction enzyme mix, labeled “ENZ”.
ENZ = Enzyme mix
3. Obtain your DNA samples.
Using a fresh tip for each sample, transfer 10 µl of each DNA sample from the coloredstock tubes into each of the corresponding labeled colored tubes.
24
CS S1 S2 S3 S4
ENZ
S5
Stock DNA
DNA
CS S1 S3 S4 S5S2
Observations
1) Describe the samples of DNA (physical properties).
2) Is there any observable difference between the samples of DNA?
3) Describe the appearance of the restriction endonuclease mix.
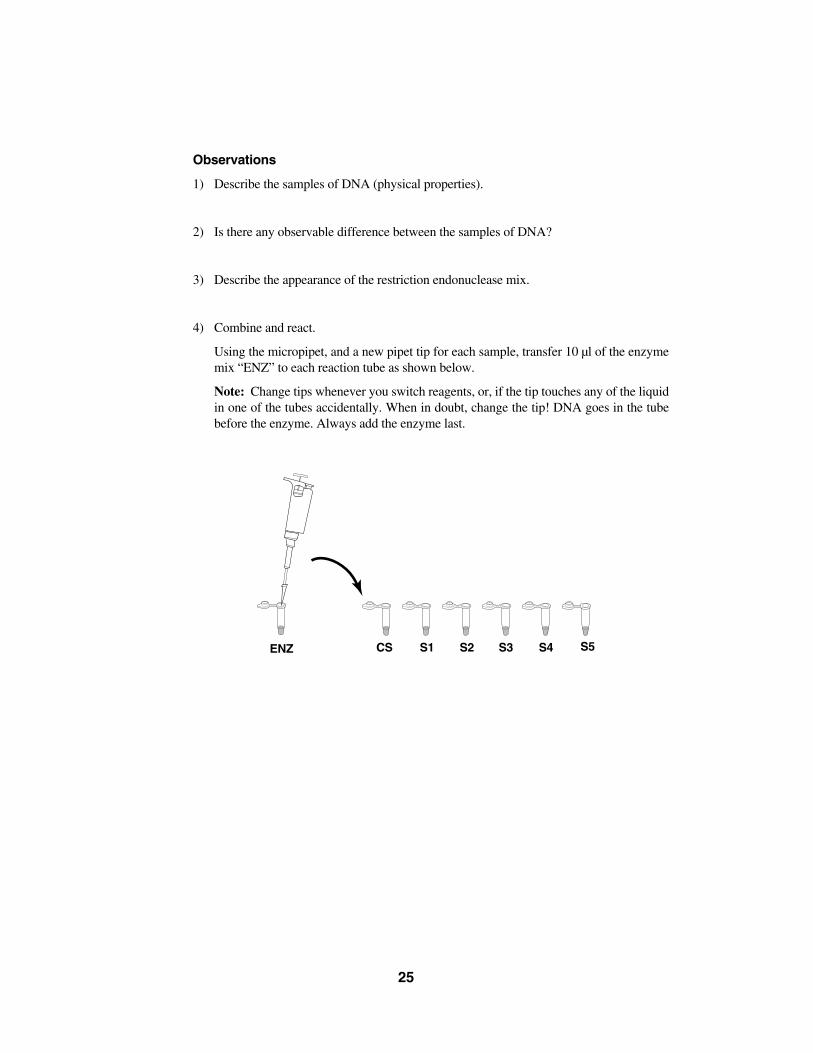
4) Combine and react.
Using the micropipet, and a new pipet tip for each sample, transfer 10 µl of the enzymemix “ENZ” to each reaction tube as shown below.
Note: Change tips whenever you switch reagents, or, if the tip touches any of the liquidin one of the tubes accidentally. When in doubt, change the tip! DNA goes in the tubebefore the enzyme. Always add the enzyme last.
25
CS S1 S2 S3 S4 S5ENZ
Now your DNA samples should contain:
TotalDNA Samples EcoRI/PstI Reaction
(10 µl each) Enzyme Mix VolumeCrime Scene [CS] 10 µl 20 µl
Suspect 1 [S1] 10 µl 20 µlSuspect 2 [S2] 10 µl 20 µlSuspect 3 [S3] 10 µl 20 µlSuspect 4 [S4] 10 µl 20 µlSuspect 5 [S5] 10 µl 20 µl
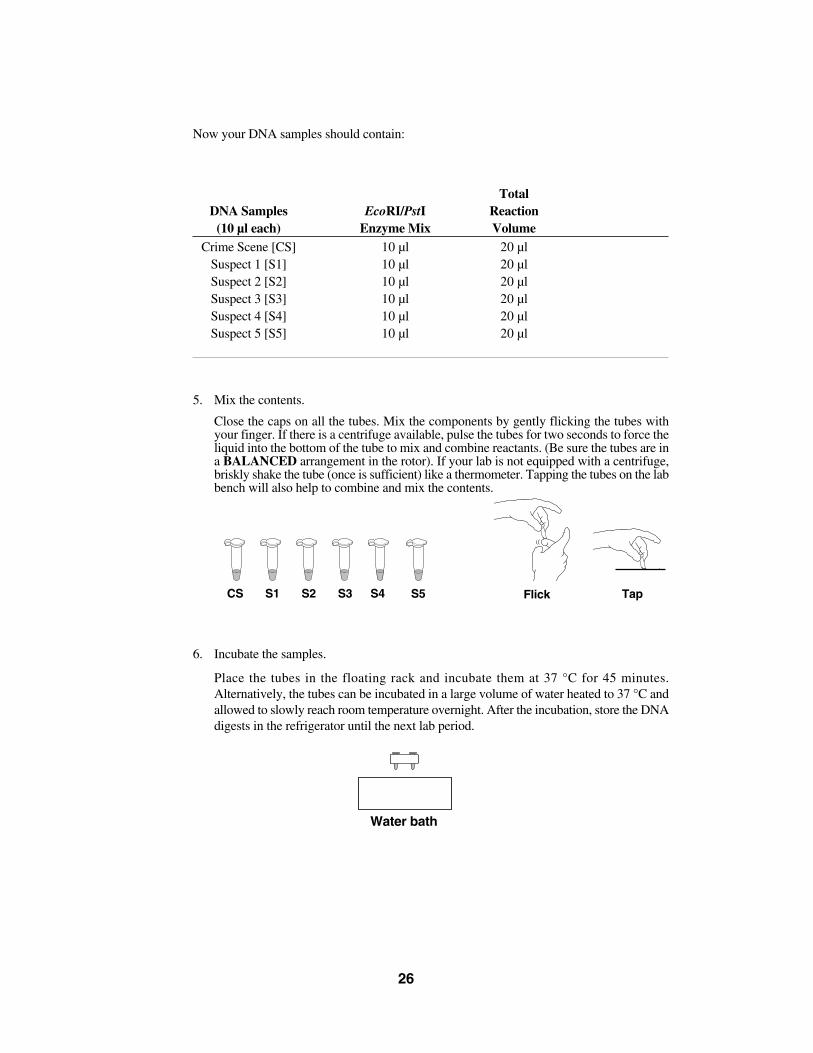
5. Mix the contents.
Close the caps on all the tubes. Mix the components by gently flicking the tubes withyour finger. If there is a centrifuge available, pulse the tubes for two seconds to force theliquid into the bottom of the tube to mix and combine reactants. (Be sure the tubes are ina BALANCED arrangement in the rotor). If your lab is not equipped with a centrifuge,briskly shake the tube (once is sufficient) like a thermometer. Tapping the tubes on the labbench will also help to combine and mix the contents.
6. Incubate the samples.
Place the tubes in the floating rack and incubate them at 37 °C for 45 minutes.Alternatively, the tubes can be incubated in a large volume of water heated to 37 °C andallowed to slowly reach room temperature overnight. After the incubation, store the DNAdigests in the refrigerator until the next lab period.
26
CS S1 S2 S3 S4 Flick
Water bath
S5 Tap
Lesson 2 Restriction Digestion of DNA Samples
Review Questions
1. Before you incubated your samples, describe any visible signs of change in the contentsof the tubes containing the DNA after it was combined with the restriction enzymes.
2. Can you see any evidence to indicate that your samples of DNA were fragmented oraltered in any way by the addition of EcoRI/PstI? Explain.
3. In the absence of any visible evidence of change, is it still possible that the DNA sampleswere fragmented? Explain your reasoning.
4. (Answer the next day)
After a 24 hour incubation period, are there any visible clues that the restriction enzymesmay have in some way changed the DNA in any of the tubes? Explain your reasoning.
27
Lesson 3 Electrophoresis and Staining of DNA Samples
Consideration 3 How can we detect the position of EcoRI and PstI restrictionsites on our DNA samples?
Since we are attempting to detect changes at the molecular level, and there are no visibleclues for us to analyze, this task might seem beyond our capabilities and impossible to do.Let’s see if we can figure this out. One way to determine the location of restriction sites mightbe to determine the following:
1) How many different sizes of DNA fragments are in each sample?
2) What are the relative sizes of each fragment?
Therefore, you must somehow get evidence to answer the following question: Do theEcoRI and PstI restriction sites occur at the same locations in any of the DNA samples?
The following facts will be helpful to you in your attempt to determine the actual rangeof DNA fragment sizes in your samples.
Restriction Digestion Analysis
The 3-dimensional structure of restriction enzymes allows them to attach themselves toa double-stranded DNA molecule and slide along the helix until they recognize a specificsequence of base pairs which signals the enzyme to stop sliding. The enzymes then digest(chemically separate) the DNA molecule at that site—called a "restriction site"—acting likemolecular scissors, they cut DNA at a specific sequence of base pairs.
If a specific restriction site occurs in more than one location on a DNA molecule, a restric-tion enzyme will make a cut at each of those sites resulting in multiple fragments. The lengthof each fragment will depend upon the location of restriction sites contained within the DNAmolecule.
When restriction enzymes are used to cut a long strand of DNA, fragments of varyingsizes may be produced. The fragments can be separated and visualized using a process knownas agarose gel electrophoresis. The term electrophoresis means to carry with electricity.
Agarose Gel Electrophoresis
Electrophoresis separates DNA fragments according to their relative size. DNA frag-ments are loaded into an agarose gel slab, which is placed into a chamber filled with a con-ductive liquid buffer solution. A direct current is passed between wire electrodes at each endof the chamber. DNA fragments are negatively charged, and when placed in an electric fieldwill be drawn toward the positive pole. The matrix of the agarose gel acts as a molecularsieve through which smaller DNA fragments can move more easily than larger ones. Over aperiod of time smaller fragments will travel farther than larger ones. Fragments of the samesize stay together and migrate in single "bands" of DNA.
An analogy: Equate this situation to your classroom in which all the desks and chairshave been randomly scattered around the room. An individual student can wind his/her waythrough the maze quickly and with little difficulty, whereas a string of four students holdinghands would require more time and have difficulty working their way through the maze ofchairs. Try it!
28
Lesson 3 Electrophoresis of DNA Samples
Laboratory Check (✔✔) List
Student workstations Number/Station (✔✔)Agarose gel 1 ❑
Digested DNA samples 5 ❑
DNA sample loading dye "LD" 1 ❑
Marking pen 1 ❑
Pipet tips 1 box ❑
P-10 or P-20 micropipet 1 ❑
Lab marker 1 ❑
Waste container 1 ❑
Styrofoam microtube rack 1 ❑
Gel box and power supply 1 ❑
Gel staining tray 1 ❑
HindIII DNA size markers "M" 1 ❑
Instructors workstation1x TAE electrophoresis buffer 275 ml gel/box ❑
Bio-Safe DNA stain—1x solution 500 ml ❑
29
Lesson 3 Laboratory
Electrophoresis of DNA Samples
1. Obtain a prepoured agarose gel from your teacher, or if your teacher instructs you to do so,prepare your own gel.
2. After preparing the gel, remove your digested samples from the refrigerator.
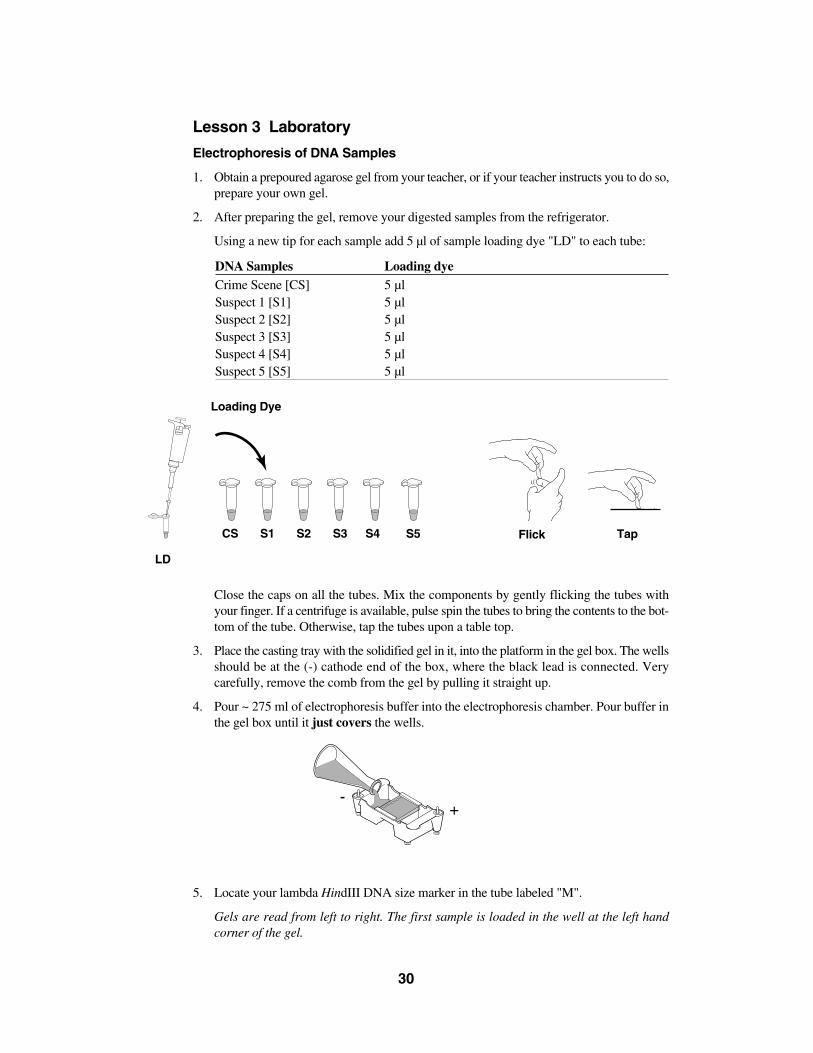
Using a new tip for each sample add 5 µl of sample loading dye "LD" to each tube:
DNA Samples Loading dyeCrime Scene [CS] 5 µl Suspect 1 [S1] 5 µl Suspect 2 [S2] 5 µl Suspect 3 [S3] 5 µl Suspect 4 [S4] 5 µl Suspect 5 [S5] 5 µl
Close the caps on all the tubes. Mix the components by gently flicking the tubes withyour finger. If a centrifuge is available, pulse spin the tubes to bring the contents to the bot-tom of the tube. Otherwise, tap the tubes upon a table top.
3. Place the casting tray with the solidified gel in it, into the platform in the gel box. The wellsshould be at the (-) cathode end of the box, where the black lead is connected. Very carefully, remove the comb from the gel by pulling it straight up.
4. Pour ~ 275 ml of electrophoresis buffer into the electrophoresis chamber. Pour buffer inthe gel box until it just covers the wells.
5. Locate your lambda HindIII DNA size marker in the tube labeled "M".
Gels are read from left to right. The first sample is loaded in the well at the left hand corner of the gel.
30
+-
CS S1 S2 S3 S4 FlickS5 Tap
Loading Dye
LD
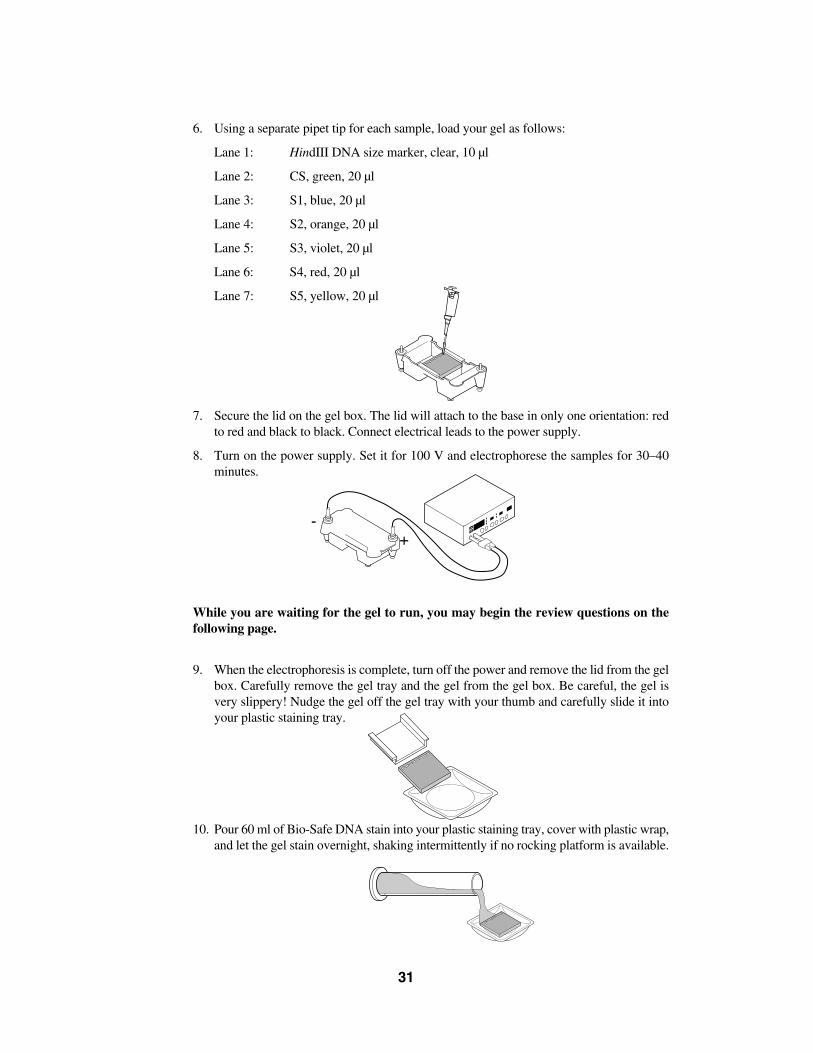
6. Using a separate pipet tip for each sample, load your gel as follows:
Lane 1: HindIII DNA size marker, clear, 10 µl
Lane 2: CS, green, 20 µl
Lane 3: S1, blue, 20 µl
Lane 4: S2, orange, 20 µl
Lane 5: S3, violet, 20 µl
Lane 6: S4, red, 20 µl
Lane 7: S5, yellow, 20 µl
7. Secure the lid on the gel box. The lid will attach to the base in only one orientation: redto red and black to black. Connect electrical leads to the power supply.
8. Turn on the power supply. Set it for 100 V and electrophorese the samples for 30–40minutes.
While you are waiting for the gel to run, you may begin the review questions on thefollowing page.
9. When the electrophoresis is complete, turn off the power and remove the lid from the gelbox. Carefully remove the gel tray and the gel from the gel box. Be careful, the gel isvery slippery! Nudge the gel off the gel tray with your thumb and carefully slide it intoyour plastic staining tray.
10. Pour 60 ml of Bio-Safe DNA stain into your plastic staining tray, cover with plastic wrap,and let the gel stain overnight, shaking intermittently if no rocking platform is available.
31
+-
Lesson 3 Electrophoresis of Your DNA Samples
Review Questions
1. The electrophoresis apparatus creates an electrical field with positive and negative polesat the ends of the gel. DNA molecules are negatively charged. To which electrode poleof the electrophoresis field would you expect DNA to migrate? (+ or -)? Explain.
2. What color represents the negative pole?
3. After DNA samples are loaded into the sample wells, they are “forced” to move throughthe gel matrix. What size fragments (large vs. small) would you expect to move towardthe opposite end of the gel most quickly? Explain.
4. Which fragments (large vs. small) are expected to travel the shortest distance from thewell? Explain.
32
Lesson 4 Drying Gels and Analyzing the DNA Patterns
Consideration 5 Are any of the DNA samples from the suspects the same asan individual at the crime scene?
Take a moment to think about how you will perform the analysis of your gel. In the finaltwo steps, you will:
A. Visualize DNA fragments in your gel.
B. Analyze the number and positions of visible DNA bands on your gel.
Making DNA Fragments Visible
Unaided visual examination of gels indicates only the positions of the loading dyes andnot the positions of the DNA fragments. DNA fragments are visualized by staining the gel witha blue dye. The blue dye molecules have a high affinity for the DNA and strongly bind to theDNA fragments, which makes them visible. These visible bands of DNA may then be traced,photographed, sketched, or retained as a permanently dried gel for analysis.
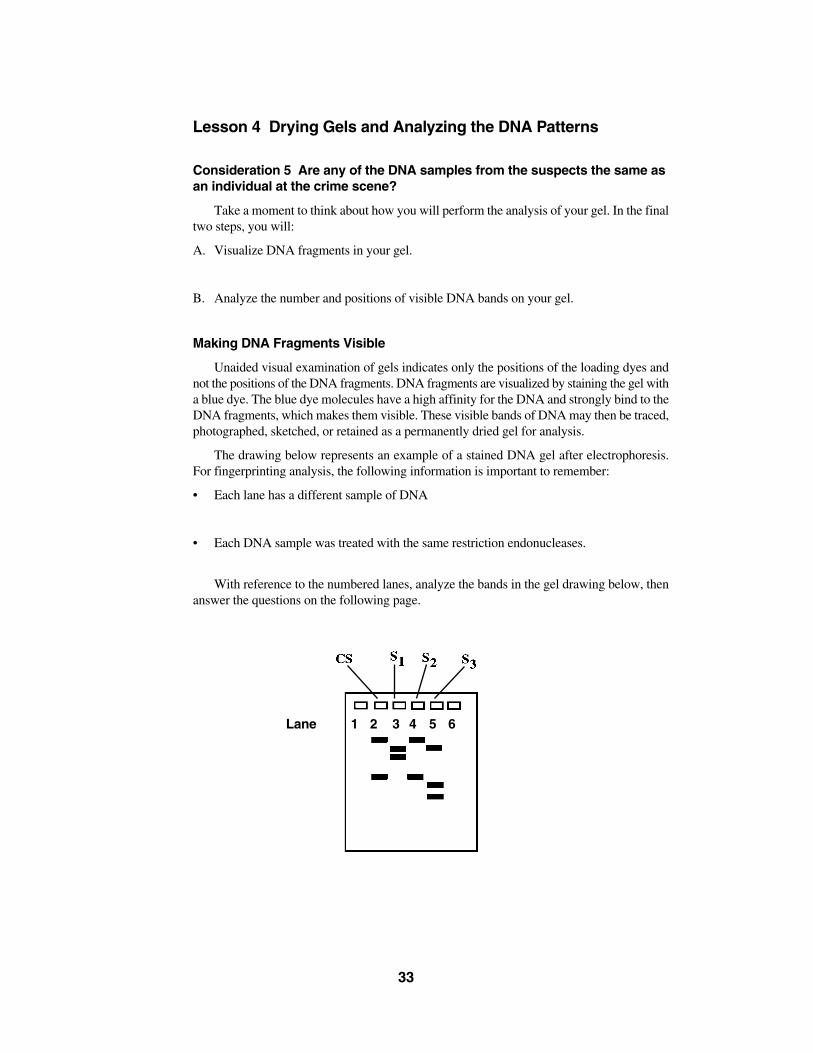
The drawing below represents an example of a stained DNA gel after electrophoresis.For fingerprinting analysis, the following information is important to remember:
• Each lane has a different sample of DNA
• Each DNA sample was treated with the same restriction endonucleases.
With reference to the numbered lanes, analyze the bands in the gel drawing below, thenanswer the questions on the following page.
33
Lane 1 2 3 4 5 6
Lesson 4 Questions
1. What can you assume is contained within each band?
2. If this were a fingerprinting gel, how many samples of DNA can you assume were placedin each separate well?
3. What would be a logical explanation as to why there is more than one band of DNA foreach of the samples?
4. What caused the DNA to become fragmented?
5. Which of the DNA samples have the same number of restriction sites for the restrictionendonucleases used? Write the lane numbers.
6. Which sample has the smallest DNA fragment?
7. Assuming a circular piece of DNA (plasmid) was used as starting material, how manyrestriction sites were there in lane three?
8. Which DNA samples appear to have been "cut" into the same number and size of fragments?
9. Based on your analysis of the gel, what is your conclusion about the DNA samples in thephotograph? Do any of the samples seem to be from the same source? If so, which ones?Describe the evidence that supports your conclusion.
34
Lesson 4 Analyzing the DNA Patterns
Laboratory Procedure
Student Workstations Number (✔✔)Water for destaining gels 60 ml ❑
Millimeter ruler 1 ❑
Linear graph paper 1 ❑
Semi-log graph paper 1 ❑
Instructor’s WorkstationNone required
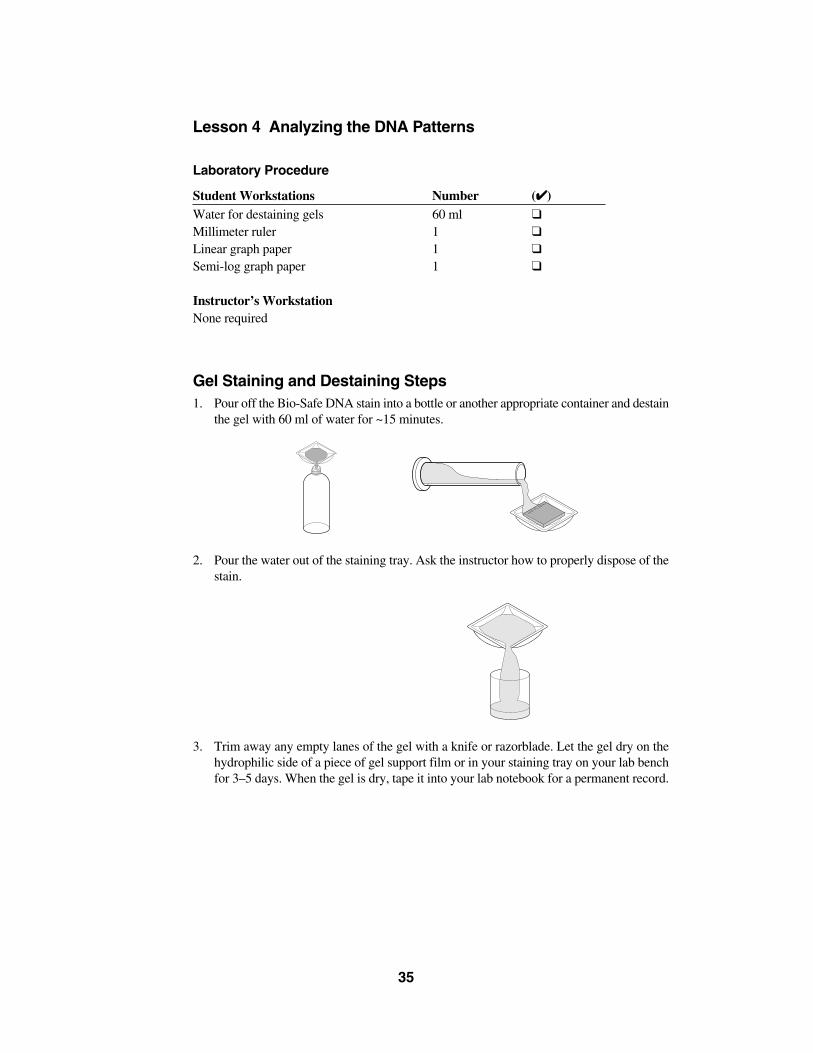
Gel Staining and Destaining Steps1. Pour off the Bio-Safe DNA stain into a bottle or another appropriate container and destain
the gel with 60 ml of water for ~15 minutes.
2. Pour the water out of the staining tray. Ask the instructor how to properly dispose of thestain.
3. Trim away any empty lanes of the gel with a knife or razorblade. Let the gel dry on thehydrophilic side of a piece of gel support film or in your staining tray on your lab benchfor 3–5 days. When the gel is dry, tape it into your lab notebook for a permanent record.
35
Quantitative Analysis of DNA Fragment Sizes
If you were on trial, would you want to rely on a technician’s eyeball estimate of a match,or would you want some more accurate measurement?
In order to make the most accurate comparison between the crime scene DNA and the sus-pect DNA, other than just a visual match, a quantitative measurement of the fragment sizesneeds to be created. This is done below:
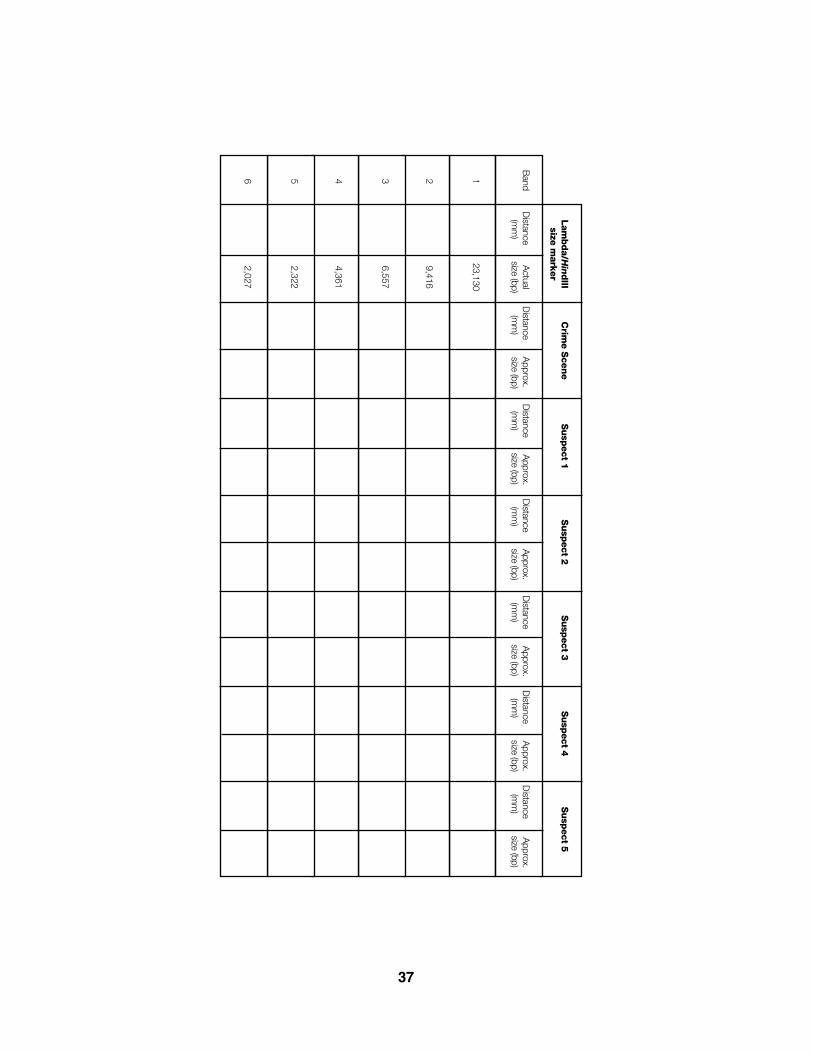
1. Using the ruler, measure the migration distance of each band. Measure the distance inmillimeters from the bottom of the loading well to each center of each DNA band andrecord your numbers in the table on the next page. The data in the table will be used to con-struct a standard curve and to estimate the sizes of the crime scene and suspect restrictionfragments.
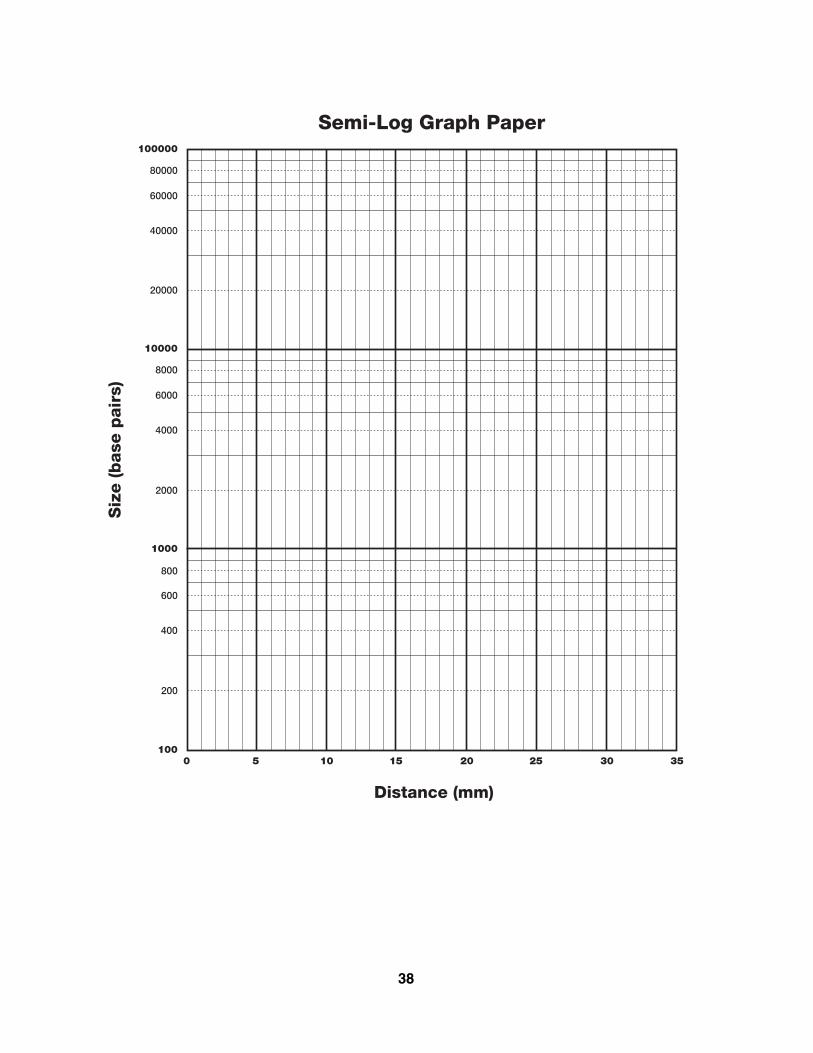
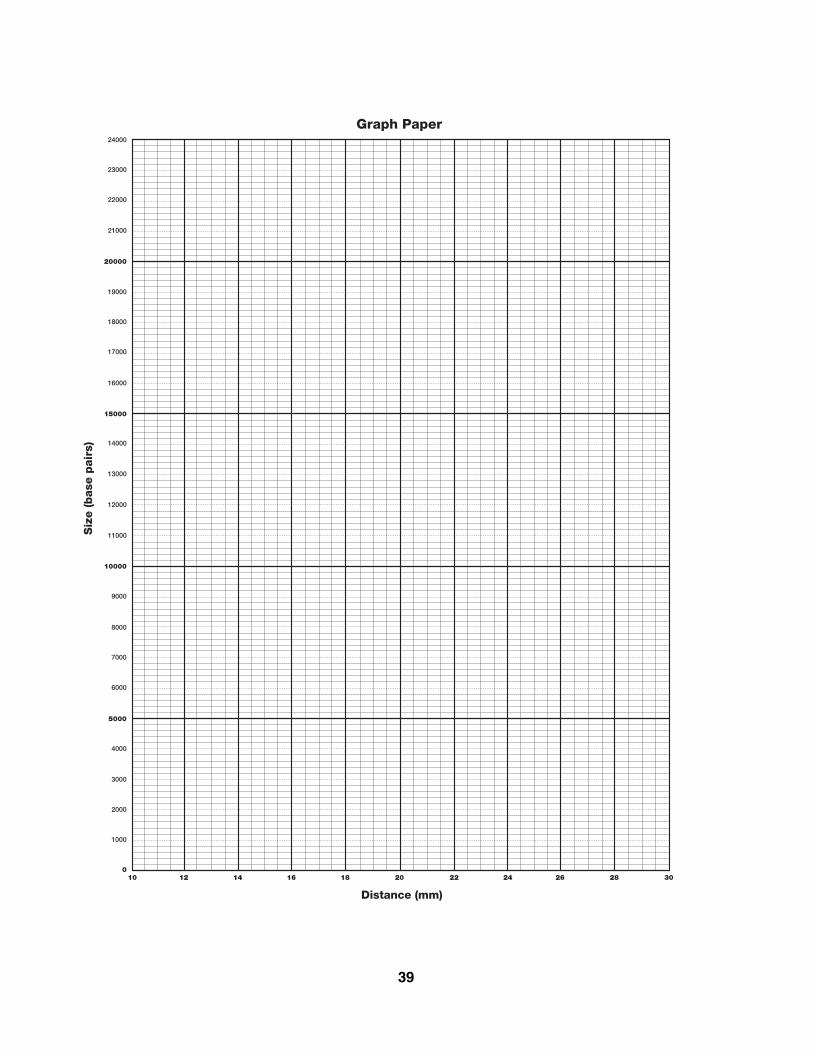
2. To make an accurate estimate of the fragment sizes for either the crime scene or the sus-pects, a standard curve is created using the distance (x-axis) and fragment size (y-axis) datafrom the Lambda/HindIII size marker. Using both linear and semi-log graph paper, plotdistance versus size for bands 2–6. On each graph, use a ruler and draw a line joining thepoints. Extend the line all the way to the right hand edge of the graph.
Which graph provides the straightest line that you could use to estimate the crime sceneor the suspects’ fragment sizes? Why do you think one graph is straighter than the other?
3. Decide which graph, linear or semi-log, should be used to estimate the DNA fragmentsizes of the crime scene and suspects. Justify your selection.
4. To estimate the size of an unknown crime scene or suspect fragment, find the distance thatfragment traveled. Locate that distance on the x-axis of your standard graph. From thatposition on the x-axis, read up to the standard line, and then follow the graph line to overto the y-axis. You might want to draw a light pencil mark from the x-axis up to the stan-dard curve and over to the y-axis showing what you’ve done. Where the graph line meetsthe y-axis, this is the approximate size of your unknown DNA fragment. Do this for allcrime scene and suspect fragments.
5. Compare the fragment sizes of the suspects and the crime scene.
Is there a suspect that matches the crime scene?
How sure are you that this is a match?
36
37
Lambda/H
indIII
Crim
e Scen
eS
usp
ect 1S
usp
ect 2S
usp
ect 3S
usp
ect 4S
usp
ect 5size m
arker
123,130
29,416
36,557
44,361
52,322
62,027
Band
Distance
Actual
Distance
Approx.
Distance
Approx.
Distance
Approx.
Distance
Approx.
Distance
Approx.
Distance
Approx.
(mm
)size (bp)
(mm
)size (bp)
(mm
)size (bp)
(mm
)size (bp)
(mm
)size (bp)
(mm
)size (bp)
(mm
)size (bp)
38
39
Lesson 4 Analyzing the DNA Patterns
Interpretation of Results
Attach a photo, photocopy, or your actual dried gel in this space. Indicate which sampleis in each well.
1. What are we trying to determine? Restate the central question.
2. Which of your DNA samples were fragmented? What would your gel look like if theDNA were not fragmented?
3. What caused the DNA to become fragmented?
4. What determines where a restriction endonuclease will "cut" a DNA molecule?
5. A restriction endonuclease "cuts" two DNA molecules at the same location. What canyou assume is identical about the molecules at that location?
6. Do any of your suspect samples appear to have EcoRI or PstI recognition sites at thesame location as the DNA from the crime scene?
7. Based on the above analysis, do any of the suspect samples of DNA seem to be from thesame individual as the DNA from the crime scene? Describe the scientific evidence thatsupports your conclusion.
40