Leonardo Energy
53
Economic Evaluation of Sectoral Emission Reduction Objectives for Climate Change Economic Evaluation of Carbon Dioxide Emission Reduction in the Household and Services Sectors in the EU Bottom-up Analysis Final Report January 2001 Suzanne Joosen and Kornelis Blok Ecofys P.O. Box 8408 NL-3503 RK Utrecht The Netherlands Contact: Chris Hendriks [email protected] http://europa.eu.int/comm/environment/enveco Contribution to a Study for DG Environment, European Commission by Ecofys Energy and Environment, AEA Technology Environment and Na- tional Technical University of Athens
Transcript of Leonardo Energy

Economic Evaluation of SectoralEmission Reduction Objectives for
Climate Change
Economic Evaluation of Carbon DioxideEmission Reduction in the Household
and Services Sectors in the EU
Bottom-up Analysis
Final ReportJanuary 2001
Suzanne Joosen and Kornelis Blok Ecofys
P.O. Box 8408NL-3503 RK Utrecht
The Netherlands
Contact: Chris [email protected]
http://europa.eu.int/comm/environment/enveco
Contribution to a Study for DG Environment, European Commission byEcofys Energy and Environment, AEA Technology Environment and Na-
tional Technical University of Athens

Preface
On its way to its current form this report has received significant input from aconsiderable number of experts. In particular, a panel of experts in Brusselsdiscussed a draft version of the report on March 29, 2000 (see Annex 2 for a listof names), and made a number of specific and more general comments andsuggestions. The authors would like to thank these people for their valuableinputs into this study. For this “Final Report” it was attempted to consider theirsuggestions wherever possible.

i
EXECUTIVE SUMMARY
Within the EU, the household and private and public services sectors are animportant source of carbon dioxide, accounting for 39% of total carbon dioxideemissions in 1990 and 30% of total greenhouse gas emissions. Greenhousegases other than CO2 contribute for less than 1% to total greenhouse emitted.Indirect emissions related to the use of electricity play an important role in thissector. Emission from the energy supply use that can be allocated to the house-hold and services sector contributes to about 46% of the total emissions of thissector.
Description of the sectorsThere are approximately 140 million dwellings in the EU in 1995. It is ex-pected that the number of dwellings will rise to 156 million in 2010. Almost20% of the energy is consumed in the household sector. The average energyconsumption of a dwelling in a country depends among others on many countryspecific circumstances. Important are: climate, building construction, buildingregulation and age distribution profile of dwellings. About one tenth (12%) ofthe energy in the EU is consumed in the services sector. The energy consump-tion of a services building depends very much on the standard of insulation, airconditioning, ventilation systems and the appliances used. The five most im-portant energy-functions are heating, cooling, transport of air, heat and cold,lighting and office equipment. Energy demand for these energy-functions canvary considerably depending on the characteristics of the buildings. To examine(specific) CO2 emission reduction options and their consequences it is oftenuseful to break the services sector down into a number of sectors, e.g. health,education, government (excluding defence), sports and entertainment, servicesoffices, communications and transport, hotels and catering, retail, warehousingetc.
Frozen technology reference levelThe emission reduction potential for 2010 is calculated using an emission refer-ence level based on frozen technology development. In the frozen technologyreference level it is assumed that there is no energy improvement obtained andthat no reduction of specific energy consumption occurs. In the frozen technol-ogy reference level the emissions of the household sector in 2010 are about12% higher than the 1990 emissions, 750 Mt compared to 841 Mt of CO2-equivalent. The increase is caused by the projected increase of households inthe EU15. The frozen technology reference level in the services sector is about57% higher in 2010 than in 1990, and increases from 438 Mt of CO2-equivalents in 1990 to almost 687 Mt in 2010. The large increase is because ofthe projected larger role of the services sector in the economies of the EU15,increased demand for cooling and increased use of appliances.

ii
Emission reduction optionsThere are numerous of options to reduce emissions in the household and servi-ces sector. For practical reasons the most important options, in terms of reduc-tion potential, are identified and characterised. Remaining ‘small’ options aregrouped in the options ‘miscellaneous’ and ‘development’. The main householdemission reduction option categories are the insulation of existing buildings,energy-efficient new buildings, advanced heating systems and energy efficientelectric appliances. The main emission reduction option categories in the servi-ces sector are the improvement of the building shell, new efficient buildings,more efficient cooling systems, building energy management systems, im-proved lighting systems and improved electric office appliances. Improved re-frigeration systems and use of alternative foams are options to reduce emissionsof fluorinated gases.
Table 1 and 2 give an overview of the options for the household and servicessector respectively, with data on reduction potentials and costs for the EU15.The specific costs are calculated using a real interest rate of 4%, using the life-time of the option, i.e. installation or equipment.
In 2010 emission reduction potential of 315 Mt of CO2–equivalent is identified;about 190 Mt in the household sector and about 126 Mt in the services sector.In both sectors improving energy performance of existing houses has a largereduction potential. In the services sector improved cooling systems also dohave a large emission reduction potential. A further 360 Mt of CO2–equivalentis avoided because electricity is consumed in 2010 with a lower emission factorthan in 1990 (see also the energy supply sector report). Total direct and indirectemission reduction amounts therefore to 677 Mt of CO2-equivalent.

iii
Table 1. EU15-average costs and potential (Mt of CO2–equivalent) for emission reduction in thehousehold sector.
Emiss ion reduction
Inves tment Yearly cos ts L ifetime1/Specific
abatement costs
Mt CO2 eq. euro/tCO2 eq. euro/tCO2 eq. year euro/tCO2 eq.
Energy efficient T V and video equipment 1 0 -310 15 -194
Very energy efficient refrigerators and freezers 0.5 0 -317 15 -187
Efficient lighting: Bes t Practice (partly implemented) 1 178 -323 8 -181
Efficient lighting: Bes t Practice (fully implemented) 2 178 -326 8 -178
Miscellaneous options (cheap tranche) 11 0 -235 15 -165
Miscellaneous options (moderate cos ts tranche) 11 138 -235 15 -156
Efficient refrigerators and freezers : Bes t Practice 3 6686 -368 15 -57
Retrofit houses : wall insulation 2/28 2269 -129 50 -42
Retrofit houses : roof insulation 26 1600 -169 20 -29
Subtotal: Cost range < 0 euro / t CO2 eq. 83
New energy efficient res idential houses : Bes t Practice 12 1815 -200 20 -11
Subtotal: Cost range 0 < 20 euro / t CO2 eq. 12
Efficient washing machines , clothes dryers , dishwashers : Bes t Practice 1 11227 -275 15 7
Retrofit houses : (highly) insulated windows 49 2344 -177 20 10
Advanced heating sys tems : condens ing boilers 15 2038 -140 15 50
Subtotal: Cost range 20 < 50 euro / t CO2 eq. 66
Geothermal heat production 0.2 406 -28 25 58
New very energy efficient res idential houses : Z ero Energy 3 3056 -200 20 71
S olar thermal 8 4879 -52 15 272
Advanced heating sys tems : heat pumps /316 3884 73 15 432
Subtotal: Cost range > 50 euro / t CO2 eq. 28
Domes tic refrigeration: hydrocarbons 1 32.5 0 15 3
Subtotal: Cost range: 0 < 20 euro / t CO2 eq. 1
T otal potential emiss ion reduction 190
/3 Based on average fuel/electricity use. Replacing electric heating sys tems may reduce specific cos ts down to zero for the 4% discount rate case.
Pollutant
CO2
HFC
1/ T he lifetime of some options (e.g. retrofitted (uninsulated) walls and efficient appliances) are chosen at the upper part of the range [De Beer et al, 1994]
2/ An equally divided mix of the options insulating cavity (cheap) and external solid wall insulation (expens ive) was chosen.
Measure Name
iv
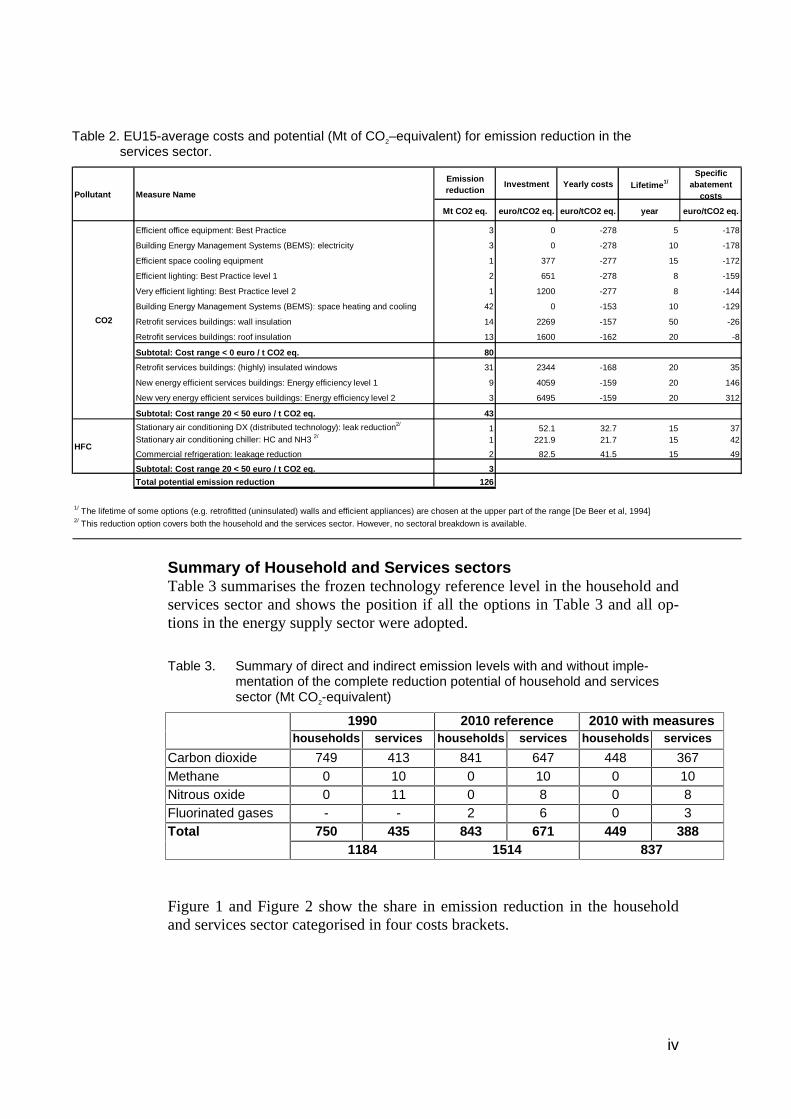
Table 2. EU15-average costs and potential (Mt of CO2–equivalent) for emission reduction in theservices sector.
Emiss ion reduction
Inves tment Yearly costs L ifetime1/Specific
abatement cos ts
Mt CO2 eq. euro/tCO2 eq. euro/tCO2 eq. year euro/tCO2 eq.
Efficient office equipment: Bes t Practice 3 0 -278 5 -178
Building Energy Management S ys tems (BEMS ): electricity 3 0 -278 10 -178
Efficient space cooling equipment 1 377 -277 15 -172
Efficient lighting: Bes t Practice level 1 2 651 -278 8 -159
Very efficient lighting: Best Practice level 2 1 1200 -277 8 -144
Building Energy Management S ys tems (BEMS ): space heating and cooling 42 0 -153 10 -129
Retrofit services buildings : wall insulation 14 2269 -157 50 -26
Retrofit services buildings : roof insulation 13 1600 -162 20 -8
Subtotal: Cost range < 0 euro / t CO2 eq. 80
Retrofit services buildings : (highly) insulated windows 31 2344 -168 20 35
New energy efficient services buildings : Energy efficiency level 1 9 4059 -159 20 146
New very energy efficient services buildings : Energy efficiency level 2 3 6495 -159 20 312
Subtotal: Cost range 20 < 50 euro / t CO2 eq. 43
S tationary air conditioning DX (dis tributed technology): leak reduction2/1 52.1 32.7 15 37
S tationary air conditioning chiller: HC and NH3 2/ 1 221.9 21.7 15 42
Commercial refrigeration: leakage reduction 2 82.5 41.5 15 49
Subtotal: Cost range 20 < 50 euro / t CO2 eq. 3T otal potential emiss ion reduction 126
HFC
Pollutant Measure Name
CO2
1/ T he lifetime of some options (e.g. retrofitted (uninsulated) walls and efficient appliances ) are chosen at the upper part of the range [De Beer et al, 1994]2/ T his reduction option covers both the household and the services sector. However, no sectoral breakdown is available.
Summary of Household and Services sectorsTable 3 summarises the frozen technology reference level in the household andservices sector and shows the position if all the options in Table 3 and all op-tions in the energy supply sector were adopted.
Table 3. Summary of direct and indirect emission levels with and without imple-mentation of the complete reduction potential of household and servicessector (Mt CO2-equivalent)
1990 2010 reference 2010 with measureshouseholds services households services households services
Carbon dioxide 749 413 841 647 448 367Methane 0 10 0 10 0 10Nitrous oxide 0 11 0 8 0 8Fluorinated gases - - 2 6 0 3
750 435 843 671 449 388Total1184 1514 837
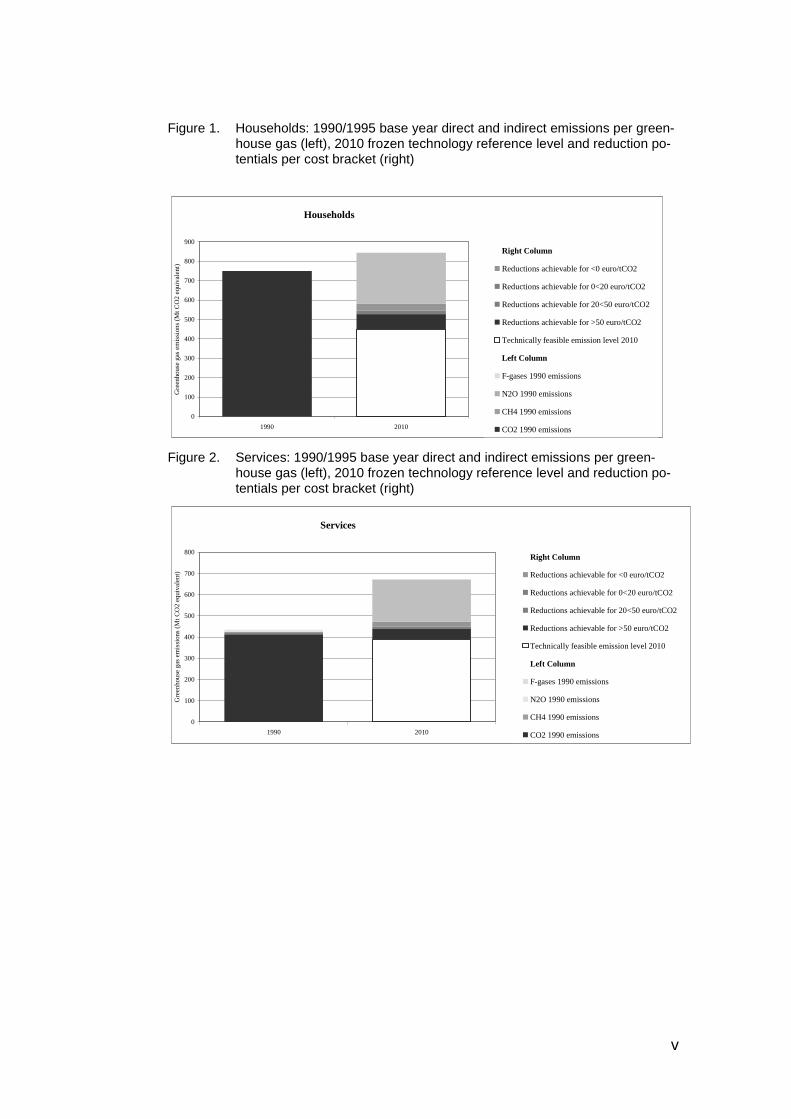
Figure 1 and Figure 2 show the share in emission reduction in the householdand services sector categorised in four costs brackets.
v
Figure 1. Households: 1990/1995 base year direct and indirect emissions per green-house gas (left), 2010 frozen technology reference level and reduction po-tentials per cost bracket (right)
Households
0
100
200
300
400
500
600
700
800
900
1990 2010
Gre
enho
use
gas
emis
sion
s (M
t CO
2 eq
uiva
lent
)
Right Column
Reductions achievable for <0 euro/tCO2
Reductions achievable for 0<20 euro/tCO2
Reductions achievable for 20<50 euro/tCO2
Reductions achievable for >50 euro/tCO2
Technically feasible emission level 2010
Left Column
F-gases 1990 emissions
N2O 1990 emissions
CH4 1990 emissions
CO2 1990 emissions
Figure 2. Services: 1990/1995 base year direct and indirect emissions per green-house gas (left), 2010 frozen technology reference level and reduction po-tentials per cost bracket (right)
Services
0
100
200
300
400
500
600
700
800
1990 2010
Gre
enho
use
gas
emis
sion
s (M
t CO
2 eq
uiva
lent
)
Right Column
Reductions achievable for <0 euro/tCO2
Reductions achievable for 0<20 euro/tCO2
Reductions achievable for 20<50 euro/tCO2
Reductions achievable for >50 euro/tCO2
Technically feasible emission level 2010
Left Column
F-gases 1990 emissions
N2O 1990 emissions
CH4 1990 emissions
CO2 1990 emissions

vi
CONTENT
1. INTRODUCTION................................................................................ 1
2. OPTIONS TO REDUCE CARBON DIOXIDE EMISSIONS FROMTHE HOUSEHOLD SECTOR ............................................................ 3
2.1 Introduction........................................................................................................ 3
2.2 Emissions........................................................................................................... 5
2.2.1 Emission mechanisms .................................................................................5
2.2.2 Emission in EU-15 .......................................................................................5
2.2.3 Introduction ..................................................................................................6
2.2.4 Option 1: Improving building shell: wall insulation .......................................8
2.2.5 Option 2: Improving building shell: roof insulation .......................................9
2.2.6 Option 3: Improving building shell: windows..............................................10
2.2.7 Option 4a and b: Low & zero energy buildings..........................................12
2.2.8 Option 5: Advanced heating systems: condensing boilers........................14
2.2.9 Option 6: Advanced heating system: heat pumps .....................................15
2.2.10Option 7: Lighting: Compact fluorescent lamps.........................................16
2.2.11Option 8 Efficient cold appliances.............................................................17
2.2.12Option 9: Efficient wet appliances..............................................................18
2.2.13Option 10: Efficient brown appliances .......................................................19
2.2.14Option 11: Miscellaneous efficient appliances...........................................20
3. OPTIONS TO REDUCE CARBON DIOXIDE EMISSIONS FROMTHE SERVICES SECTOR............................................................... 21
3.1 Introduction...................................................................................................... 21
3.2 Emissions......................................................................................................... 22
3.2.1 Emission mechanisms ...............................................................................22
3.3 Emission reduction options ........................................................................... 23
3.3.1 Introduction ................................................................................................23
3.3.2 Option 1 : Improving building shell: wall insulation ....................................25
3.3.3 Option 2: Improving building shell: Roof installation..................................26
3.3.4 Option 3: Improving building shell: Windows.............................................27
3.3.5 Option 4: New energy efficient buildings ...................................................28
3.3.6 Option 5: Efficient cooling systems............................................................28
vii
3.3.7 Option 6: Building Energy Management Systems.....................................29
3.3.8 Option 7: Efficient lighting systems............................................................30
3.3.9 Option 8: Efficient office appliances...........................................................31
4. CONCLUSIONS............................................................................... 32
5. RECOMMENDATIONS.................................................................... 35
REFERENCES..................................................................................... 37
ANNEX 1 List of Energy saving measures ..................................................... 39
ANNEX 2 list of Workshop participants.......................................................... 44
1
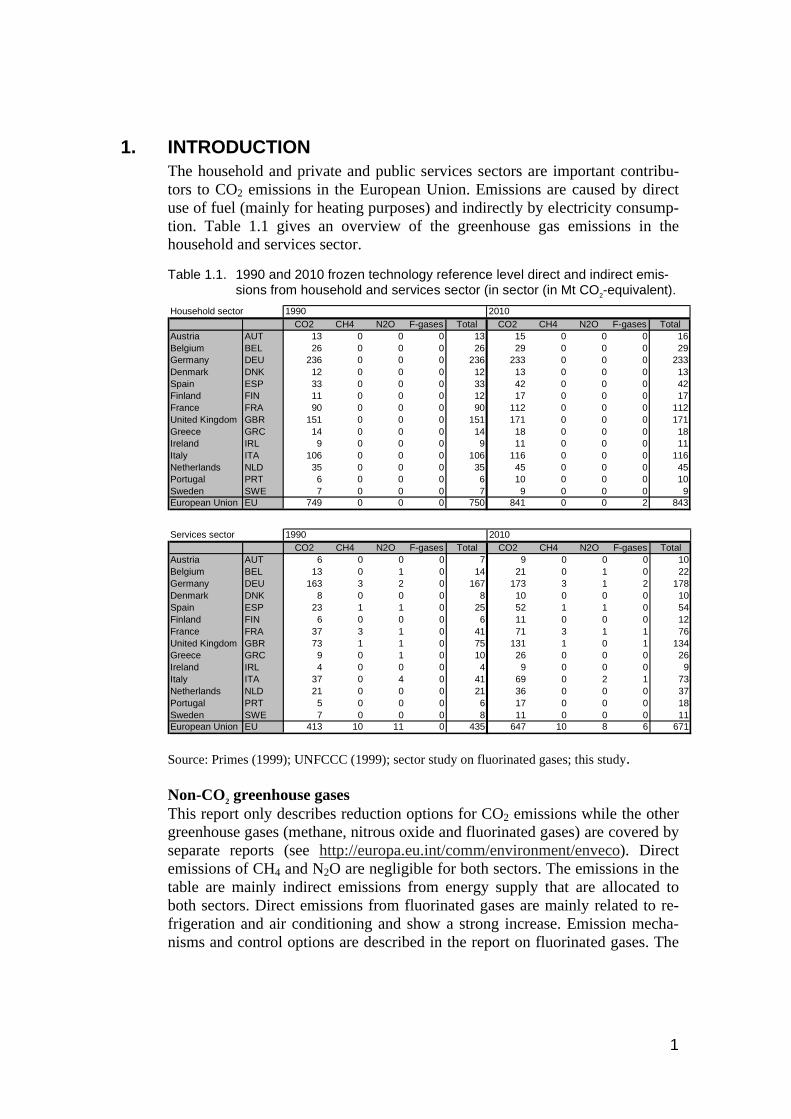
1. INTRODUCTIONThe household and private and public services sectors are important contribu-tors to CO2 emissions in the European Union. Emissions are caused by directuse of fuel (mainly for heating purposes) and indirectly by electricity consump-tion. Table 1.1 gives an overview of the greenhouse gas emissions in thehousehold and services sector.
Table 1.1. 1990 and 2010 frozen technology reference level direct and indirect emis-sions from household and services sector (in sector (in Mt CO2-equivalent).
Household sector 1990 2010CO2 CH4 N2O F-gases Total CO2 CH4 N2O F-gases Total
Austria AUT 13 0 0 0 13 15 0 0 0 16Belgium BEL 26 0 0 0 26 29 0 0 0 29Germany DEU 236 0 0 0 236 233 0 0 0 233Denmark DNK 12 0 0 0 12 13 0 0 0 13Spain ESP 33 0 0 0 33 42 0 0 0 42Finland FIN 11 0 0 0 12 17 0 0 0 17France FRA 90 0 0 0 90 112 0 0 0 112United Kingdom GBR 151 0 0 0 151 171 0 0 0 171Greece GRC 14 0 0 0 14 18 0 0 0 18Ireland IRL 9 0 0 0 9 11 0 0 0 11Italy ITA 106 0 0 0 106 116 0 0 0 116Netherlands NLD 35 0 0 0 35 45 0 0 0 45Portugal PRT 6 0 0 0 6 10 0 0 0 10Sweden SWE 7 0 0 0 7 9 0 0 0 9European Union EU 749 0 0 0 750 841 0 0 2 843
Services sector 1990 2010CO2 CH4 N2O F-gases Total CO2 CH4 N2O F-gases Total
Austria AUT 6 0 0 0 7 9 0 0 0 10Belgium BEL 13 0 1 0 14 21 0 1 0 22Germany DEU 163 3 2 0 167 173 3 1 2 178Denmark DNK 8 0 0 0 8 10 0 0 0 10Spain ESP 23 1 1 0 25 52 1 1 0 54Finland FIN 6 0 0 0 6 11 0 0 0 12France FRA 37 3 1 0 41 71 3 1 1 76United Kingdom GBR 73 1 1 0 75 131 1 0 1 134Greece GRC 9 0 1 0 10 26 0 0 0 26Ireland IRL 4 0 0 0 4 9 0 0 0 9Italy ITA 37 0 4 0 41 69 0 2 1 73Netherlands NLD 21 0 0 0 21 36 0 0 0 37Portugal PRT 5 0 0 0 6 17 0 0 0 18Sweden SWE 7 0 0 0 8 11 0 0 0 11European Union EU 413 10 11 0 435 647 10 8 6 671
Source: Primes (1999); UNFCCC (1999); sector study on fluorinated gases; this study.
Non-CO2 greenhouse gasesThis report only describes reduction options for CO2 emissions while the othergreenhouse gases (methane, nitrous oxide and fluorinated gases) are covered byseparate reports (see http://europa.eu.int/comm/environment/enveco). Directemissions of CH4 and N2O are negligible for both sectors. The emissions in thetable are mainly indirect emissions from energy supply that are allocated toboth sectors. Direct emissions from fluorinated gases are mainly related to re-frigeration and air conditioning and show a strong increase. Emission mecha-nisms and control options are described in the report on fluorinated gases. The

2
results for non-CO2 greenhouse gases are incorporated in the overview tables aspresented in this report (e.g. Table 1 of the Executive Summary).
3
2. OPTIONS TO REDUCE CARBON DIOXIDE EMISSIONSFROM THE HOUSEHOLD SECTOR
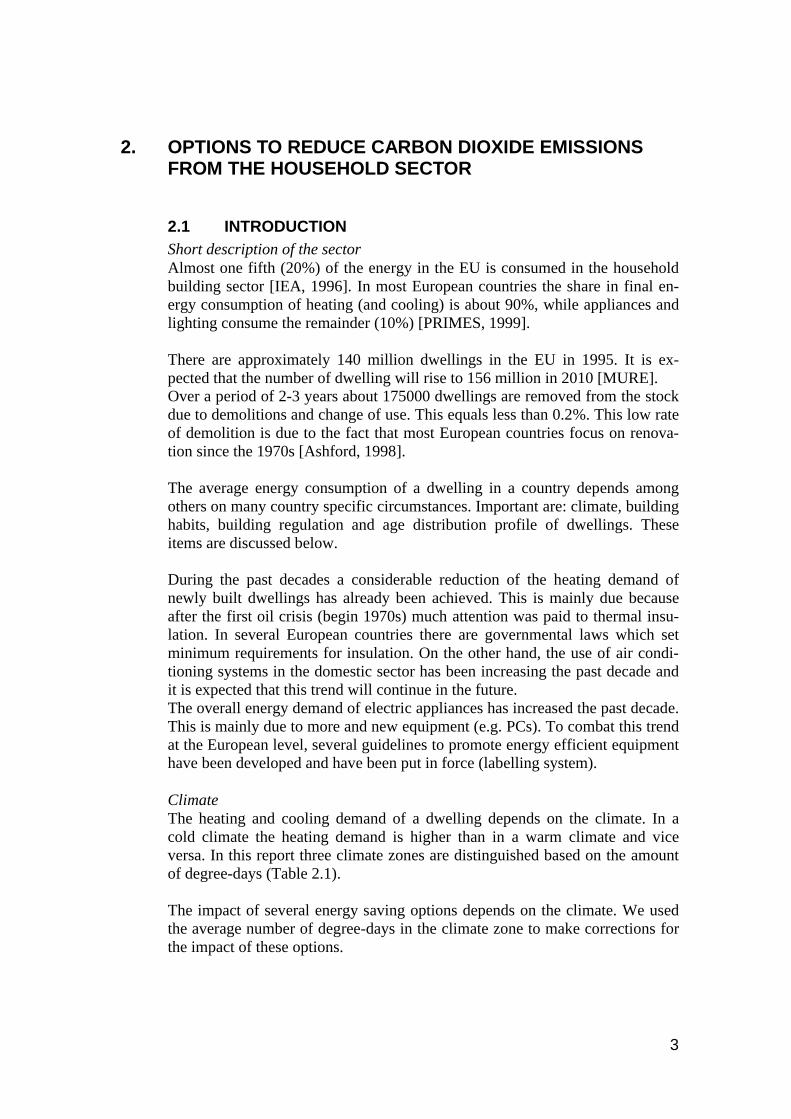
2.1 INTRODUCTIONShort description of the sectorAlmost one fifth (20%) of the energy in the EU is consumed in the householdbuilding sector [IEA, 1996]. In most European countries the share in final en-ergy consumption of heating (and cooling) is about 90%, while appliances andlighting consume the remainder (10%) [PRIMES, 1999].
There are approximately 140 million dwellings in the EU in 1995. It is ex-pected that the number of dwelling will rise to 156 million in 2010 [MURE].Over a period of 2-3 years about 175000 dwellings are removed from the stockdue to demolitions and change of use. This equals less than 0.2%. This low rateof demolition is due to the fact that most European countries focus on renova-tion since the 1970s [Ashford, 1998].
The average energy consumption of a dwelling in a country depends amongothers on many country specific circumstances. Important are: climate, buildinghabits, building regulation and age distribution profile of dwellings. Theseitems are discussed below.
During the past decades a considerable reduction of the heating demand ofnewly built dwellings has already been achieved. This is mainly due becauseafter the first oil crisis (begin 1970s) much attention was paid to thermal insu-lation. In several European countries there are governmental laws which setminimum requirements for insulation. On the other hand, the use of air condi-tioning systems in the domestic sector has been increasing the past decade andit is expected that this trend will continue in the future.The overall energy demand of electric appliances has increased the past decade.This is mainly due to more and new equipment (e.g. PCs). To combat this trendat the European level, several guidelines to promote energy efficient equipmenthave been developed and have been put in force (labelling system).
ClimateThe heating and cooling demand of a dwelling depends on the climate. In acold climate the heating demand is higher than in a warm climate and viceversa. In this report three climate zones are distinguished based on the amountof degree-days (Table 2.1).
The impact of several energy saving options depends on the climate. We usedthe average number of degree-days in the climate zone to make corrections forthe impact of these options.

4
Table 2.1 Climate zones and degree-days
Climate zone Countries # of degree days Average # of degree days
Cold Finland, Sweden # > 4000 4330
Moderate Austria, Belgium, Denmark,Germany, United Kingdom, France,Ireland, Luxembourg, The Nether-lands
2500 < # < 4000 2978
Warm Greece, Italy, Portugal, Spain # < 2500 1785
Source: [EC, 1996; Schipper, 1985]
Building constructionThe construction method differs per country. Low energy demand was firstachieved in buildings using the traditional or modified North American andScandinavian wood frame construction. In particular, Sweden performed a pio-neer function in the early 1980s where dwellings with low energy demand werealready common practice. Later on these low energy requirements have alsobeen realised in buildings using Western European massive wall constructiontechniques. During the early 1990s, the European leadership position in imple-menting state-of-the-art building efficiency has even been taken over by coun-tries using traditional masonry or other massive weight bearing walls, such asDenmark, Germany and Switzerland [Krause et al., 1998].
Building regulationsAlmost all European countries have building regulations. In most countriesthere is an obligation for a certain insulation level for newly built dwellings[STOA, 1998]. Due to these regulations the energy demand of new dwellings isconsiderably lower than that of the existing stock.
Age distribution profile of dwellingsFinally another factor that influences the energy consumption is the age distri-bution profile of dwellings, because old dwellings or dwellings from a particu-lar building period (before 1975) are often poorly insulated or not insulated atall. This profile differs per country. United Kingdom is skewed towards theolder properties compared to for instance Ireland and the Netherlands [Ashford,1998]. The age distribution profile is used to determine the impact of variousenergy saving options (e.g. insulation).
5
2.2 EMISSIONS
2.2.1 Emission mechanismsTo fulfil the heating, cooling, lighting and electric appliances requirements ul-timately mainly techniques based on burning of fossil fuels, are used.
An approach to reduce energy consumption and therefore CO2-emissions is theso-called “Trias Energetica strategy”. This strategy has three golden rules,which are in order of importance:1. Reduce energy demand2. Use renewable sources3. Use efficient energy supply technologiesIn this report we concentrate on rule 1 and 3, because emission reduction op-tions like renewables and CHP are treated in the sector report on energy supply,which is prepared in the framework of this project.
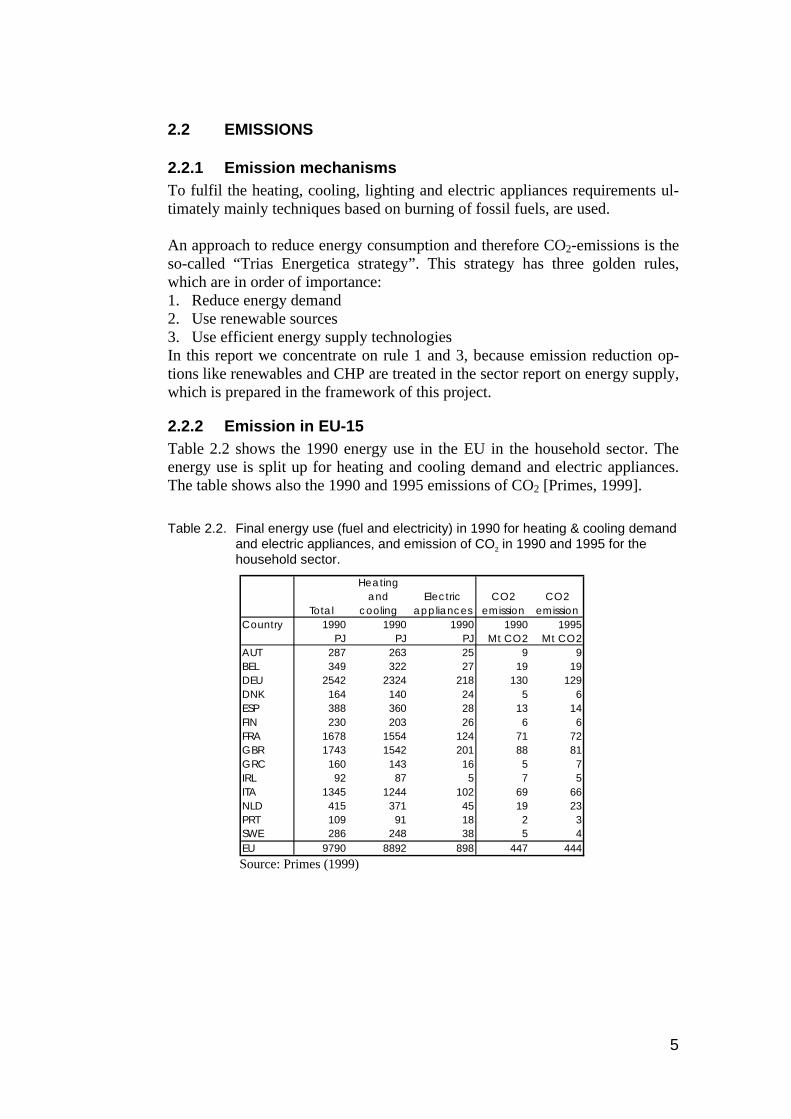
2.2.2 Emission in EU-15Table 2.2 shows the 1990 energy use in the EU in the household sector. Theenergy use is split up for heating and cooling demand and electric appliances.The table shows also the 1990 and 1995 emissions of CO2 [Primes, 1999].
Table 2.2. Final energy use (fuel and electricity) in 1990 for heating & cooling demandand electric appliances, and emission of CO2 in 1990 and 1995 for thehousehold sector.
Total
Heating and
coolingElectric
appliancesCO2
emissionCO2
emissionCountry 1990 1990 1990 1990 1995
PJ PJ PJ Mt CO2 Mt CO2AUT 287 263 25 9 9BEL 349 322 27 19 19DEU 2542 2324 218 130 129DNK 164 140 24 5 6ESP 388 360 28 13 14FIN 230 203 26 6 6FRA 1678 1554 124 71 72GBR 1743 1542 201 88 81GRC 160 143 16 5 7IRL 92 87 5 7 5ITA 1345 1244 102 69 66NLD 415 371 45 19 23PRT 109 91 18 2 3SWE 286 248 38 5 4EU 9790 8892 898 447 444
Source: Primes (1999)

6
2.2.3 IntroductionA literature study was conducted to find out which measures enable CO2 emis-sion reductions in the building sector (domestic and services buildings). Theoutcome was a list of measures, which can be categorised in 10 main groups.An overview is given in Annex 1.
Within the scope of this investigation this list is too detailed, so only the mostimportant measures are described in this paper. Insulation in existing buildings,energy-efficient new buildings, advanced heating systems and energy efficientelectric appliances appeared to be very significant options.
LimitationsThis study aims at giving a first indication for the CO2 emission reductionmeasures in the household sector. Possible follow-up studies can fine-tune theused data (see also recommendations, needs for information). As just stated thepresented options are by no means exhaustive. Also the trend of increasingsizes of dwellings in Europe is not taken into account. Due to the fact that thereis little country specific information available to what extent measures are al-ready implemented, there are probably greater differences between countries interm of potentials than the results indicate at this moment (average penetrationlevels are assumed in case specific country information is not available).
Insulation of existing buildingsIn a standard dwelling in the Western European climate, the largest heat lossesappear through walls and windows, about 21% and 29% of the total heat lossesrespectively [Krause et al., 1998].For this reason the following retrofit measures were chosen:- wall insulation- replacing single and double glazing by advanced insulating windows- because it is simpler and cheaper than wall and window insulation the op-
tion of roof installation is also included (about 11% of the total heat losses)
Energy-efficient new buildingsIt is already possible to build dwellings with a (very) low energy demand withthe same comfortable living standards as for average energy consuming dwell-ings. In many European countries a considerable number of new dwellings willbe built during the period 2000 – 2010. Therefore it is of great importance toincrease the implementation rate of (very) low energy demand dwellings.
Advanced heating systemsThere are several advanced proven heating systems on the market, which couldcontribute to considerable savings of fossil fuels. The application of these sys-tems, such as condensing boilers and heat pumps will contribute significantly toCO2 emission reduction. From the point of view of costs the natural moment ofreplacement is preferable.
7
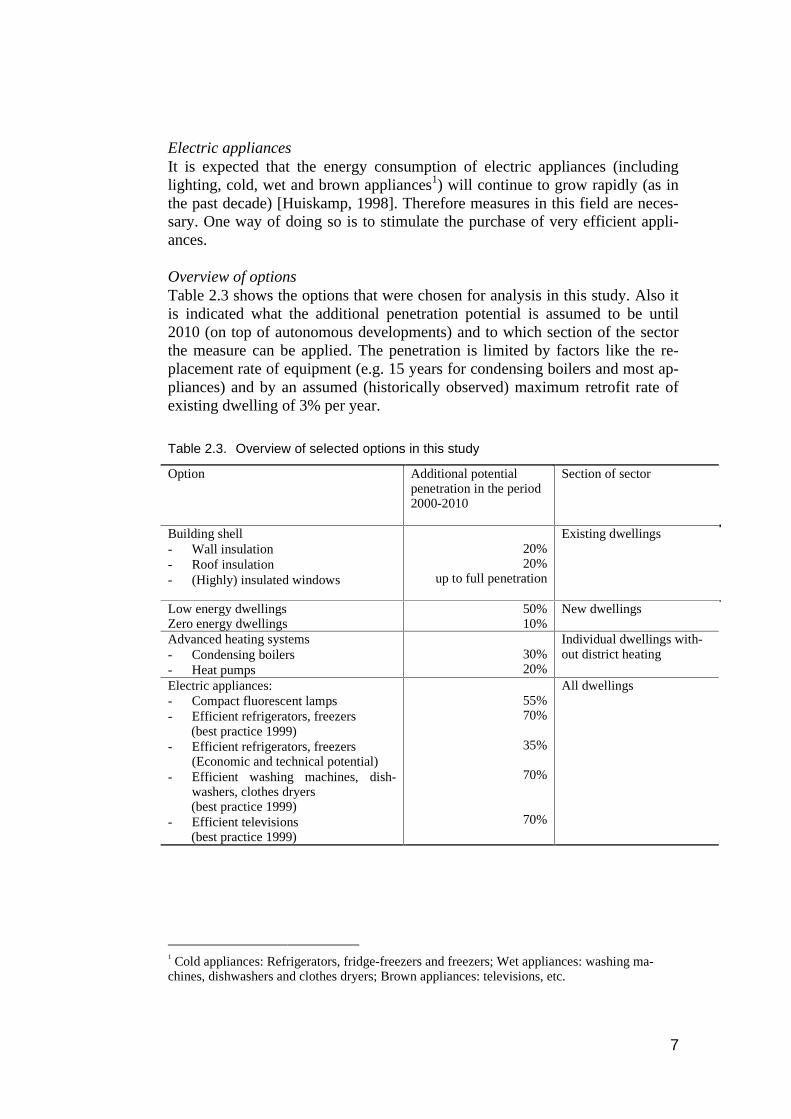
Electric appliancesIt is expected that the energy consumption of electric appliances (includinglighting, cold, wet and brown appliances1) will continue to grow rapidly (as inthe past decade) [Huiskamp, 1998]. Therefore measures in this field are neces-sary. One way of doing so is to stimulate the purchase of very efficient appli-ances.
Overview of optionsTable 2.3 shows the options that were chosen for analysis in this study. Also itis indicated what the additional penetration potential is assumed to be until2010 (on top of autonomous developments) and to which section of the sectorthe measure can be applied. The penetration is limited by factors like the re-placement rate of equipment (e.g. 15 years for condensing boilers and most ap-pliances) and by an assumed (historically observed) maximum retrofit rate ofexisting dwelling of 3% per year.
Table 2.3. Overview of selected options in this study
Option Additional potentialpenetration in the period2000-2010
Section of sector
Building shell- Wall insulation- Roof insulation- (Highly) insulated windows
20%20%
up to full penetration
Existing dwellings
Low energy dwellingsZero energy dwellings
50%10%
New dwellings
Advanced heating systems- Condensing boilers- Heat pumps
30%20%
Individual dwellings with-out district heating
Electric appliances:- Compact fluorescent lamps- Efficient refrigerators, freezers (best practice 1999)- Efficient refrigerators, freezers
(Economic and technical potential)- Efficient washing machines, dish-
washers, clothes dryers (best practice 1999)- Efficient televisions (best practice 1999)
55%70%
35%
70%
70%
All dwellings
1 Cold appliances: Refrigerators, fridge-freezers and freezers; Wet appliances: washing ma-chines, dishwashers and clothes dryers; Brown appliances: televisions, etc.

8
2.2.4 Option 1: Improving building shell: wall insulation
2.2.4.1 DescriptionHeat losses of existing poorly insulated houses can be reduced through insula-tion. Particularly retrofit wall insulation can save substantial quantities of en-ergy since the heat loss per unit of wall surface can be reduced substantiallyand the current penetration level of retrofit wall insulation is low. By wall in-sulation of uninsulated houses the heat losses through the wall are reduced byaround 30% [Ashford, 1998; MURE]. It could be expected that the total savingof the energy demand for space heating across Europe’s domestic buildingstock would be in the order of 20% from insulation alone [Ashford, 1998].
An indication of energy savings and costs are shown in Table 2.4.
Table 2.4. Energy savings and costs of wall insulation of existing dwellings
Energy saving*
[MJ/m2/yr.]Investment cost[euro1990/m2]
Insulating a cavity wall 285 10Insulating a solid wall (external)Insulating a solid wall (internal)**
400 – 600400 – 600
75 - 10025
* dependent on number of degree-days** this option is not used in the analysis, the measure would result in a smaller living areaSource: Joosen (1999)
2.2.4.2 Autonomous developmentThe uninsulated building stock in 1995 is known from literature or estimated.The estimation is based on values in literature [Huiskamp, 1999 and Krause etal., 1998]. Approximately 50% of the total building stock of countries in thecold and moderate climate zone was uninsulated or poorly insulated in 19952.In countries with a warm climate this is estimated to be about 90%. For 2010 isassumed that the already retrofitted building stock will increase (about 10%),based on renovation rates in the last decade [Huiskamp, 1999].
2.2.4.3 Further energy efficiency improvementFirst the number of households and their corresponding energy use for heatingare calculated for 1995 and 2010 [PRIMES, 1999]. The number of dwellings isassumed to be the same as the number of households. Other literature data [UN,1997; VROM, 1998; EC, 1993] confirm that this assumption is sufficiently ac-curate for this analysis. Subsequently the average heating demand per dwellingis estimated. The heating demand for an uninsulated dwelling is based on in-formation from the MURE database (energy consumption of old and/or inter-mediate aged houses), and proportional adjusted to PRIMES data. The energysavings per m2 wall surface are known (see Table 2.4). The average exteriorwall surface per dwelling is assumed to be 40 m2. [Joosen, 1999]. On this basis
2 Comment of some reviewers: lower percentage for countries in the cold climate zone.

9
the saving by wall insulation, equally distinguished in solid and cavity wallconstruction, can be calculated per dwelling.
Subsequently the European average space heating demand of an uninsulateddwelling and the corresponding energy saving by wall insulation aredetermined (respectively 1.39 and 0.42 TOE per dwelling). The saving percent-age is 30% of the space heating demand of an uninsulated dwelling. The spaceheating demand of uninsulated dwelling varies from low in a country with awarm climate to high in a country with a cold climate. By applying the savingpercentage the estimated saving potentials are automatically climate corrected.It is also taken into account that countries with a low space heating demand foran uninsulated dwelling (due to for instance higher building standards) have arelative lower saving potential.
As the next step an estimate is made of the extra amount of retrofitted dwell-ings. In option 1 it is assumed that 20% of the walls are insulated in addition tothe expected level of the already renovated building stock in 2010. This isbased on the assumption that 3% of the uninsulated building stock can be han-dled per year. Finally the total saving potential is calculated by multiplying thenumber of dwellings with the saving per dwelling.
Note that the use of average values is useful for the purpose of this study, but inpractice both energy savings and costs will vary significantly due to local cir-cumstances.
2.2.4.4 CostsPer m2 wall the costs for wall insulation are around 75 to 100 euro1990 (externalsolid construction) and 10 euro1990 (cavity construction) [Joosen, 1999]. Fur-thermore it is assumed that there is 40 m2 wall per dwelling and that 50% of thebuilding stock has a solid construction and 50% a cavity construction. This re-sults in an average cost per dwelling of about 1950 euro1990 (3500 euro1990 perdwelling in case of solid construction and 400 euro1990 per dwelling in case ofcavity construction).
2.2.5 Option 2: Improving building shell: roof insulation
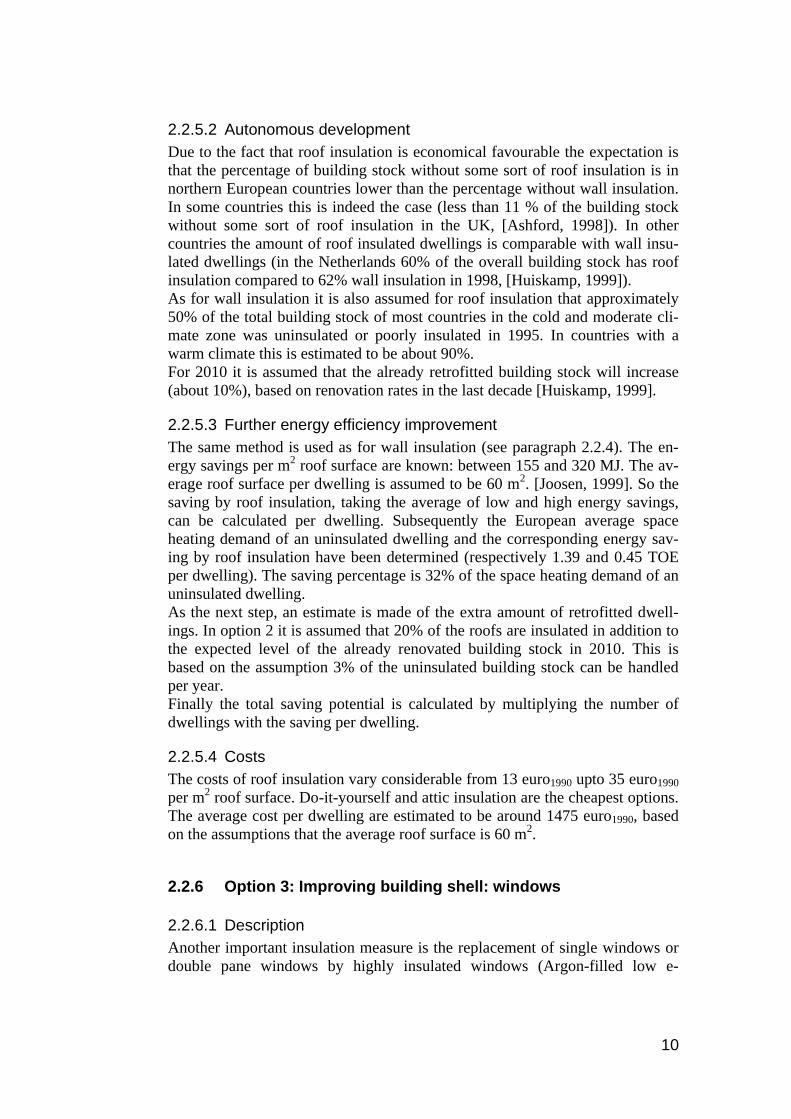
2.2.5.1 DescriptionRoof insulation is cheaper and simpler to implement than wall insulation. Theenergy saving depends on both the roof type and the heat demand of the roombeneath the roof (low heat demand results in low energy saving, high heat de-mand results in high energy saving).Energy savings of roof insulation are estimated to be between 155 and 320 MJper m2 roof surface [Joosen, 1999]. The costs of roof insulation are between 15and 40 euro1999 per m2 roof surface [Reydellet, 2000; Joosen, 1999].
10
2.2.5.2 Autonomous developmentDue to the fact that roof insulation is economical favourable the expectation isthat the percentage of building stock without some sort of roof insulation is innorthern European countries lower than the percentage without wall insulation.In some countries this is indeed the case (less than 11 % of the building stockwithout some sort of roof insulation in the UK, [Ashford, 1998]). In othercountries the amount of roof insulated dwellings is comparable with wall insu-lated dwellings (in the Netherlands 60% of the overall building stock has roofinsulation compared to 62% wall insulation in 1998, [Huiskamp, 1999]).As for wall insulation it is also assumed for roof insulation that approximately50% of the total building stock of most countries in the cold and moderate cli-mate zone was uninsulated or poorly insulated in 1995. In countries with awarm climate this is estimated to be about 90%.For 2010 it is assumed that the already retrofitted building stock will increase(about 10%), based on renovation rates in the last decade [Huiskamp, 1999].
2.2.5.3 Further energy efficiency improvementThe same method is used as for wall insulation (see paragraph 2.2.4). The en-ergy savings per m2 roof surface are known: between 155 and 320 MJ. The av-erage roof surface per dwelling is assumed to be 60 m2. [Joosen, 1999]. So thesaving by roof insulation, taking the average of low and high energy savings,can be calculated per dwelling. Subsequently the European average spaceheating demand of an uninsulated dwelling and the corresponding energy sav-ing by roof insulation have been determined (respectively 1.39 and 0.45 TOEper dwelling). The saving percentage is 32% of the space heating demand of anuninsulated dwelling.As the next step, an estimate is made of the extra amount of retrofitted dwell-ings. In option 2 it is assumed that 20% of the roofs are insulated in addition tothe expected level of the already renovated building stock in 2010. This isbased on the assumption 3% of the uninsulated building stock can be handledper year.Finally the total saving potential is calculated by multiplying the number ofdwellings with the saving per dwelling.
2.2.5.4 CostsThe costs of roof insulation vary considerable from 13 euro1990 upto 35 euro1990
per m2 roof surface. Do-it-yourself and attic insulation are the cheapest options.The average cost per dwelling are estimated to be around 1475 euro1990, basedon the assumptions that the average roof surface is 60 m2.
2.2.6 Option 3: Improving building shell: windows
2.2.6.1 DescriptionAnother important insulation measure is the replacement of single windows ordouble pane windows by highly insulated windows (Argon-filled low e-

11
window (U-value glass 1,1 W/m2K)) and superwindows (U-value glass 0.3-0.4W/m2K3).4
Option 3 concerns renovation of existing dwellings. Application of highly in-sulated windows in new dwellings is part of option 4a and 4b.An indication of the savings and costs of insulated windows compared withsingle windows are shown in Table 2.5.
Table 2.5. Additional energy savings and cost of highly insulated windows comparedwith single windows
U-value*)
[W/m2K]Energy saving[MJ/m2/yr]
Costs**)
[euro1990 /m2]
Single pane 5Double pane 3 790 90-100Argon-filled low-e window 1,5 1105 100-120Superwindow 1 1200 About 175Source: Krause et al. (1998); Joosen, (1999); Laffont and Janssen, (2000)*) U-value – heat transmission coefficient. The lower this value is, the smaller is the heat loss.
Including losses through frame**) Including installation costs in an existing frame
The available saving potential through applying insulating glazing has been re-searched extensively within a DGXVII sponsored project conducted by Fachin-formationsZentrum Karlsruhe (FIZ) and the Comite Permanent des Industriesdu Verre de la Communauté Economique Europeenne (CPIV). As part of theTHERMIE programme action a report is published entitled ‘Major EnergySavings, Environmental and Employment Benefits by Double-Glazing and Ad-vanced Double-glazing Technologies’ [Ashford, 1998]. According to this studyapproximately 60% of all windows in the EU are single glazed. In the domes-tic sector the implementation rate of insulated windows in countries with amoderate and cold climate is likely to be higher than 40% in 1998 (e.g. about80% in Germany within its pre-1990 borders [Krause et al., 1998] and theNetherlands [Huiskamp, 1999]5). In general the replacement of glazing islinked to the natural moment of replacement of frames. In most countries dou-ble panes nowadays represent the standard offer. This means that energy savingopportunities related to low-e glazing are hardly exploited [Laffont, 2000]. Atthe moment there is a strong evolution in the German, Belgium, French and
3 Balance U value, taking into account not only heat losses, but also solar gains. In this reportthe term superwindow is used for the highest technical feasible insulating window.Since ten years windows with triple glazing (U-value glass 0.76 W/m2K) are available. For in-stance standardly implemented in ‘Passiv Hauser’ in Germany.4 The option to insulate a single pane window by placing a second window on it in the oldframe has not been considered in this study. Background: only under specific circumstancesthis option is preferable above double panes. (These circumstances are: only applicable forsmall windows (2 m2), façade and/or (leaded) window has to be intact and limited budget avail-able.)5 Also Finland and Sweden have very likely a much higher implementation rate than 40%, dou-ble glazing is a standard since decades.
12
Dutch market where low-e insulated window are becoming more and more astandard product. Sweden and Finland have had double glazing as a standardfor decades and triple glazing is the present standard.
2.2.6.2 Autonomous developmentIn most European countries there are regulations for the insulation degree fornewly built dwellings. In France, The United Kingdom, Italy and Spain highlyinsulated windows are not yet required for new dwellings. For the existingbuilding stock there are generally no standards (exception German regulation)[Laffont, 2000]. The number of existing dwellings with uninsulated windows isestimated based on values in literature [Ashford, 1998; Huiskamp, 1999, andKrause et al., 1998]. The autonomous development in 2010 is based on the ex-pectation that the number of dwellings with insulated windows will increase(about 20%), based on implementation rates of the past decade.The energy savings per m2 window surface are known (see Table 2.5). It is as-sumed that the average window surface per dwelling is 21 m2 [Joosen, 1999;MURE]. On this basis the average energy saving if the single or double panewindows are replaced by Argon filled low-e windows or superwindows can becalculated. Just as in option 1 (wall insulation) it is assumed that the number ofhouseholds is equal to the number of dwellings.
2.2.6.3 Further energy efficiency improvementOption 3 consists of replacement of the remaining single windows in 2010which are not covered by the autonomous development. It is assumed that 50%is replaced by double glazing, 40% by Argon-filled low-e glazing and 10% bysuperwindows. This leads to a European average energy saving of 34.5% of thespace heating demand per uninsulated dwelling.
2.2.6.4 CostsThe figures from Table 2.5 are used. Per dwelling the cost for implementationof double-glazing is 1995 euro1990, Argon-filled low-e window is 2310 euro1990,for implementation of superwindows 3675 euro1990 [Krause et al., 1998;Joosen, 1999, Laffont and Janssen, 2000]. For option 3 these figures lead to av-erage cost of 2289 euro1990 per dwelling6.
2.2.7 Option 4a and b: Low & zero energy buildings
2.2.7.1 DescriptionLow energy dwellings
6 These costs are based on information of Dutch installers and the glazing industry, some re-viewers think these costs will be higher.

13
So-called superinsulated prototype dwellings have been built over the last 15years in both Europe and North America. Their energy requirement for spaceheating is typically about 30-50 kWh/m2, this is about 40% lower than the av-erage standard for new buildings.This is mainly achieved by the following measures:- Highly insulated building shell (U-value floor and external walls 0.20
W/m2K, roof 0.15 W/m2K).- Argon filled low-e windows- Ventilation rates are reduced to average air exchange rates of 0.3 per hour
using demand-orientated ventilation systems. (Air quality benefit is higherthan that provided by uncontrolled infiltration of the same average magni-tude: when the building is fully occupied, ventilation provides more thanthe average per hour rate and vice versa) [Krause et al., 1998].
A recent project of the WWF in the Netherlands shows that it is already possi-ble to realise low energy dwellings (about 30 kWh/m2) on a commercial basis.
Zero-energy dwellingsThe advances in component technology (e.g. superwindows, vacuum insula-tion) combined with improved design tools will allow to realise dwellings withno or a very low space heating requirement (0-15 kWh/m2). Here, space heatingrelated energy use is more or less limited to the electricity demand for operat-ing ventilation systems and controls (few hundred kWh in a well-designedsystem).An example of recent demonstration project is: townhouses in Darmstadt-Kranichstein in Germany with a space heating requirement of 10-15 kWh/m2.
The field experience suggests that present building technology alone would al-low the construction of completely passive-solar dwellings in Southern Europe[Krause et al., 1998].
2.2.7.2 Autonomous developmentThe autonomous development in 2010 is based on the assumptions that:- The change of number of households between 1995 and 2010 is the same as
the number of newly built dwellings. Demolition rates are so low that theycan be neglected (less than 0.2% per year [Ashford, 1998; MURE, year]).
- New dwellings built in the period 2000 – 2010 have 44% lower energyspace heating demand than new dwellings in 1990, among others due tostrict building regulations.
2.2.7.3 Further energy efficiency improvementWe estimated as realistic technical potential that 50% of the new dwellings willbe low-energy (option 4a) and 10% will be zero-energy (option 4b).
Option 4a Low energy dwellings

14
The half of the newly build dwellings is built according the standard of low en-ergy. Compared to the autonomous scenario in 2010 the energy demand perdwelling is reduced by 25%.
Option 4b Zero energy dwellingsTen percent of the new building stock is built as zero-energy dwellings. Com-pared to the autonomous development in 2010 the energy demand per dwellingis reduced by 55%.
2.2.7.4 CostsThe costs calculations are based on extra cost per dwelling found in literature.These additional investment costs are [Krause et al., 1998]:- 2908 euro1990 for a low energy dwelling- 6786 euro1990 for a zero energy dwelling.The latter figure represents the average of high and low cost zero-energydwellings.
2.2.8 Option 5: Advanced heating systems: condensing boilers
2.2.8.1 DescriptionA considerable amount of the fossil fuel combustion products consists of watervapour. Condensing boilers use a heat exchanger to condense the water vapourand extract the heat. Hence, the latent heat of the water vapour is made use ofand the efficiency of the boiler is improved.
2.2.8.2 Current practice optionIn most European countries the current efficiency of gas-fired heating equip-ment is about 70% (higher heating value), the efficiency of equipment based onother fuels is lower [MURE].In some countries the share of condensing boilers is already considerable. Inthe Netherlands for instance about the half of the building stock is alreadyheated by condensing boilers [Huiskamp, 1999]. In other European countriesthe implementation level is much lower [STOA, 1998].
2.2.8.3 Implementation of optionTo calculate the energy savings the following assumptions have been made:- A condensing boiler achieves 25% improvement of the heat efficiency of
the heating equipment (from 70% to 95% based on higher heating value).- The option is only applied to individual dwellings without district heating.
Option 5 assumes a 30% replacement of heating equipment by condensingboilers. The extent of replacement is limited for technical reasons. For instancecondensing boilers cannot directly replace heating equipment based on oil
15
(pollution) and furthermore the place of the condensing boiler is crucial(enough draft).
2.2.8.4 CostsThe investment cost including installation of a condensing boiler is approxi-mately 1968 euro1990 [Joosen, 1999]. The additional costs relative to a conven-tional boiler in 1997 are 913 euro1990. The additional annual maintenance costis about 16 euro1990. Yearly maintenance of a boiler is certainly necessary toprovide a properly functioning heating system.
2.2.9 Option 6: Advanced heating system: heat pumps
2.2.9.1 DescriptionA heat pump transports heat of a low temperature level to a high temperaturelevel. Heat is extracted from the environment (soil, air, ground water, exhaustair from dwelling, sewage) upgraded using a compressor and delivered to eithera radiator or warm air heating system. An indication of the energy saving perdwelling is: 75% (final energy) and 30% to 50% (primary energy).
2.2.9.2 Autonomous developmentIn excess of 2.5 million heat pumps are currently installed in the size rangefrom 1 kW to 8 MW. Small heat pumps are used in single family dwellingsand the larger installations in multi-family dwellings and small district heatingschemes. The biggest opportunity for CO2 savings is the 20% of the EUhousing stock currently electrically heated by direct radiators, storage heatersor electric boilers.
2.2.9.3 Further energy efficiency improvementFor the calculation of energy saving the following assumptions have beenmade:- A heat pump with a Coefficient of Performance of 3.0 has been assumed.- The option is only applied to individual dwellings without district heating.- There is a fuel switch from traditional fuel heated dwellings to electric
driven heat pump heated dwellings.
Option 6 assumes that - relative to the autonomous development - 20% of theconventional heating equipment is replaced by heat pumps.
A substantial higher reduction of CO2 emission can be obtained when heatpumps are applied in households currently electrically heated by direct radia-tors, storage heaters or electric boilers.
16
2.2.9.4 CostsThe costs of this option vary considerable dependent on the market segmentwhere the heat pump is applied (e.g. existing or new dwelling, in project or not,large / small heat demand of dwelling). The investment costs are assumed to be8930 euro1990 for an individual heat pump. The operational cost are 2,5% of theinvestment costs, i.e. 225 euro1990 per heat pump.However, these costs can be half as high in case one single ground source isused for several new dwellings built closely to each other.
2.2.10 Option 7: Lighting: Compact fluorescent lamps
2.2.10.1 DescriptionThe energy consumption of lighting is a substantial part of the total energy con-sumption of the domestic sector. In the investigated European countries theshare of lighting varies from 12% to 32% in terms of the energy consumptionof electric appliances.
Compact fluorescent lights (CFLs) are essentially folded fluorescent tubes.Nowadays there is an extensive assortment in shape and fitting. This means thatin many cases the light bulbs can be replaced by CFLs. A CFL has three ad-vantages compared to a standard light bulb:1. At the same light production they use much less electricity (at least 60%),2. Longer lifetime (10000 burning hours instead of 1250),3. They are cheaper (higher purchase price counterbalances electricity savings
and longer lifetime)
2.2.10.2 Autonomous developmentThe country profiles of domestic lighting in Europe are based on values in lit-erature [Palmer et al., 1998] and in the MURE II database. For the autonomousdevelopment in 2010 is assumed that:- The demand for lighting in 2010 increases by 11% compared to 1995 (as-
sumed same ratio as rise in number of households).- The use of CFL in households increases by about 10%.- Reduction of 60% of the energy consumption for lighting.
2.2.10.3 Further energy efficiency improvementOptions 7a and 7b assume a higher penetration level than the autonomous sce-nario in 2010, with an additional penetration of 15% and 40% respectively.These implementation levels are based on the assumption that in 2010 a pricereduction is achieved so that also replacement of bulbs with few operationhours will become cost-effective.
2.2.10.4 CostsThe payback time is dependent on the annual operating hours as well as therelative bulb prices and the cost of electricity. Assuming:

17
- an average price of 13 euro1990 for a 20W CFL and0.7 euro1990 for a 60WGLS bulb
- CFL has a lifetime of 10000 burning hours, the lifetime of a GLS is 8 timesshorter
- a 20W CFL replaces a 60W GLS bulb used for 3.5 hours a dayresults in additional investment cost of 0.018 euro1990 /saved kWh/year. This isequivalent to a simple payback time of about 2 years.This means taking lifetime costs into account, an ecolamp giving an equivalentof 60 Watts would be 52% cheaper than a normal lamp.
Of course for bulbs used only an hour a day this simple payback period is muchlonger (exceeding 7 years) [Palmer et al., 1998].
2.2.11 Option 8 Efficient cold appliances
2.2.11.1 DescriptionCold appliances (refrigerators, freezers etc.) use 20% to 58% of the energy con-sumption of all electric appliances [MURE]. A European labelling system isintroduced to make customers more aware of energy efficiency.
2.2.11.2 Autonomous developmentThe current Best Practice appliances with respect to energy consumption are[Energy guide]:- Refrigerators with an annual energy consumption of 150 kWh- Freezers with an annual energy consumption of 208 kWh.
To estimate the energy consumption by 2010 in the autonomous developmenttrajectory it is assumed that:- The share of the energy consumption of cold appliances in 1995 is based on
information from the MURE database.- The amount of energy consumption due to cold appliances increases ac-
cording the growth in the MURE database.- The average of energy consumption per cold appliance stays the same.
2.2.11.3 Further energy efficiency improvementOption 8a: All best practiceThis measure consists of reducing the average level of energy consumption tothe best practice level in 1999. It is assumed that 65% of the total stock will bereplaced by best practice equipment.
Option 8b: Economic and technical potential (ETP)In case new techniques are used, such as vacuum insulation, energy savings by80% can be achieved compared to the average energy consumption in 1995[Boardman et al, 1997a; Boardman et al, 1997b]. It is assumed that 5% of thetotal stock will be replaced by equipment with such a high efficiency.
18
2.2.11.4 CostsThe additional investment costs of best practice cold appliance are [EnergyGuide]:- for refrigerators 170 euro1990 per GJ electricity saved per annum- for freezers 240 euro1990 per GJ electricity saved per annumAccording to PRIMES the additional investment costs for cold appliances varybetween 185 and 231 euro1990 per annual saved GJ electricity for cold appli-ances.
The costs of option 8b (ETP) are still unknown, but will be higher than for op-tion 8a.
2.2.12 Option 9: Efficient wet appliances
2.2.12.1 Current practice optionWet appliances (washing machines, dishwashers and clothes dryers) accountfor 14% to 28% of the energy consumption of all electric appliances [MURE].A labelling system is introduced to make customers more aware of energy effi-ciency.
2.2.12.2 Autonomous developmentThe current Best Practice machines with respect to energy consumption are[Energy Guide]:- Washing machines with an annual energy consumption of 200 kWh- Dishwashers with an annual energy consumption of 132 kWh- Gas-fired dryers use 39% less energy than electric dryers.
Heat pump clothes dryers have an annual energy consumption of 250 kWh(energy reduction by approximately 50%) [Holsteijn et al, 1999]
To estimate the energy consumption by 2010 in the autonomous developmenttrajectory it is assumed that:- The share of the energy consumption of wet appliances in 1995 is based on
information from the MURE database.- The amount of energy consumption due to wet appliances increases ac-
cording the growth of appliances in use according to the MURE database.For the Netherlands it is expected that the growth of clothes dryers willcontinue [Huiskamp1997, Huiskamp, 1998].
- The average of energy consumption per wet appliance is assumed to remainunchanged compared to 1995.
2.2.12.3 Further energy efficiency improvementOption 9: All best practiceThis measure aims to reduce the average level of energy consumption to thebest practice level in 1999. It is assumed that - by gradual replacement - a 70%implementation rate of best practice equipment will be achieved by 2010.

19
Economic and technical potentialThe economic and technical potential is almost the same as the best practicelevel for washing machines and dishwashers [Boardman et al., 1997a].Heat pump clothes dryers have an energy saving potential of around 50% [Hol-steijn et al., 1999]
2.2.12.4 CostsThe additional costs of best practice wet appliance are:- for washing machines 982 euro1990 per GJ electricity saved per annum- for dishwashers there is not a clear relation between energy efficiency and
price [Energy Guide diskette].- 215 euro1990 for a gas-fired dryer and 405 euro1990 for a heat pump dryer.
2.2.13 Option 10: Efficient brown appliances
2.2.13.1 DescriptionDue to the fact that detailed data are only available for televisions this option isrestricted to this type of brown appliances [MURE]. Televisions use 4% to 13%of the energy consumption of electric appliances.
2.2.13.2 Autonomous developmentThe current best practice television (with respect to energy efficiency) has anaverage energy consumption of 38 kWh per year [MURE].
To estimate the energy consumption by 2010 in the autonomous developmenttrajectory it is assumed that:- The share of the energy consumption of brown appliances in 1995 is based
on information from the MURE database.- The amount of energy consumption due to brown appliances increases ac-
cording the growth in the MURE database.- The average of energy consumption per brown appliance stays the same as
in 1995.
2.2.13.3 Further energy efficiency improvementOption 10: All best practiceThe goal of this measure is to reduce the average level of energy consumptionto the best practice level in 1999. The assumed implementation level of bestpractice equipment is 70% based on the lifetime of 15 years.
The additional costs of best practice television are expected to be negligible in2010.
20
2.2.14 Option 11: Miscellaneous efficient appliances
2.2.14.1 DescriptionThe preceding sections described specific appliances. A number of appliancesis only partially covered, e.g. appliances for hot water production and cookingand a range of small electric appliances.
2.2.14.2 Autonomous developmentWe assume that autonomous development of the energy efficiency for theseappliances is 1% per year.
2.2.14.3 Further energy efficiency improvementWe assume that additional savings of 30% are possible at typical investmentcosts of 20 euro per GJ (see, e.g. [De Beer et al., 1994]).

21
3. OPTIONS TO REDUCE CARBON DIOXIDE EMISSIONSFROM THE SERVICES SECTOR
3.1 INTRODUCTIONShort description about the sectorThe services sector comprises the subsectors health, education, government(excluding defence), sports and entertainment, commercial offices, communi-cations and transport, hotels and catering, retail, warehousing, craftmanshipetc. About one tenth (12%) of the energy in the EU is consumed by the servicessector [IEA, 1996]. The energy consumption of a services building dependsvery much on the conditions to provide a good indoor-climate and on theequipment to perform specific tasks.The five most important energy-functions are:1. Heating: to establish a comfortable indoor temperature2. Cooling: to establish a comfortable indoor temperature3. Transport: to transport fresh air from outside to the desired place
and to transport thermal energy (heat or cold) to the desired place4. Lighting: to provide sufficient sight for performing tasks5. Equipment: to perform or support tasks (e.g. computers,
photo copiers etc.)Energy demand for these activities can vary considerably depending on thecharacteristics of the buildings. To examine (specific) CO2 emission reductionmeasures and their consequences it is often useful to break the services sectordown of the subsectors mentioned above. [Lillicrap and Ashford, 2000; ECN,1999]). Each of these sectors has specific characteristics which can often dic-tate the most effective CO2 emission reduction measures. Typical savings are inthe range of 25% of energy use for comprehensive refurbishment in some sec-tors.
The heating demand of buildings is currently declining. For newly built build-ings this is among others due to governmental laws concerning energy effi-ciency. For the existing stock this is due to renovation projects. The expectationfor 2010 is that this trend will continue.For the energy demand of cooling three tendencies are observed:1. Increase of the amount of appliances, leading to more internal heat genera-
tion and therefore, to higher cooling loads.2. Increase of energy efficiency of lighting and appliances, leading to internal
heat generation and therefore lower cooling loads.3. Increased comfort demands, causing higher cooling loads.The sum of theses three trends is expected to lead to an increase of energy de-mand for cooling in the future.The energy demand of office appliances has increased the past decade. This ismainly caused by more and introduction of new equipment. Although there isalso the trend of techniques becoming more energy efficient, the expectation

22
for autonomous development in 2010 is that there will be an overall increasedenergy demand for appliances.
It should furthermore be noted that, in contrast to the domestic sector, there isvery little quantified information on building stock in the services sector at theEuropean level. For this reason, the uncertainties of the model calculations arehigher for the services sector than for the household sector.
3.2 EMISSIONS
3.2.1 Emission mechanismsThe energy demands of the five important energy-functions (heating, cooling,transport, lighting and equipment) are mainly fulfilled by techniques that arebased on the burning of fossil fuels.
To reduce the burning of fossil fuels and their CO2-emissions the so-called“Trias Energetica strategy” can be used. The three golden rules according tothis strategy are in order of importance:1. Reduce energy demand2. Use renewable sources3. Use efficient energy supply technologiesAs for the household sector, we focus for the services sector on rule 1 and 3,because emission reduction options like renewables and CHP are treated in thesector report on energy supply, which is prepared in the framework of this proj-ect.
Table 3.1. Final energy use (fuel and electricity) in 1990 for heating & cooling demandand electric appliances, and emission of CO2 in 1990 and 1995 for theservices sector].
Total
Heating and
cooling
Electric applianc
esCO2
emissionCO2
emission
Country 1990 1990 1990 1990 1995PJ PJ PJ Mt CO2 Mt CO2
AUT 82 73 9 3 3BEL 140 125 15 7 14DEU 1554 1384 170 82 51DNK 139 125 14 3 2ESP 217 193 25 8 16FIN 98 87 11 2 1FRA 678 606 71 23 32GBR 630 560 70 24 43GRC 65 55 10 3 4IRL 40 35 4 2 6ITA 292 250 42 9 15NLD 405 343 62 19 27PRT 44 39 5 2 3SWE 191 171 20 6 4EU 4574 4042 531 193 222
Source: Primes (1999)

23
Table 3.1 shows the 1990 energy use in the EU in the services sector. The en-ergy use is split up for heating and cooling demand and electric appliances. Thetable shows also the1990 and 1995 emissions of CO2 [Primes, 1999].
3.3 EMISSION REDUCTION OPTIONS
3.3.1 IntroductionA literature study was conducted to find out which measures in the entirebuilding sector (domestic and services) lead towards CO2 emissions reduction.The outcome was a list of measures, which can be categorised in 10 maingroups. An overview is given in Annex 1.
Within the scope of this investigation this list is too detailed, so the more im-portant measures from this list are selected. Due to the shorter periods of occu-pancy in the services sector compared to the domestic sector good energy man-agement deserves special attention.
LimitationsCompared with the domestic sector there is much less detailed informationavailable of the services sector. This lack of information is confirmed by vari-ous information sources [Ashford, 1998; Krause et al., 1998]. For this reasonthe CO2 reduction potential in the services sector is based on saving percent-ages concerning the overall measure instead of saving percentages concerningthe measure at building level.Wherever transferable, the results for the domestic sector are used. To accountfor the specific situation in the services sector, corrections are made based oninformation found in the literature.This study aims at giving a first indication for the CO2 emission reductionmeasures in the services sector. Possible follow-up studies can fine-tune theused data (see also recommendations, need for information). As just stated thepresented options are by no means exhaustive. It should be noted that there areprobably greater differences between countries in terms of potentials than theresults indicate at this moment (cause: average penetration levels are assumedin case specific country information is not available).
Due to the lack of data in PRIMES Luxembourg is excluded from this study.Industrial buildings are part of the sector industry. Therefore they are outsidethe scope of this chapter.
RenovationThe measures to reduce the heating energy demand are in principle the same asin the domestic sector. Heat losses can be reduced through, amongst others:- Wall and roof insulation- Replacing single glazing by advanced insulating windows.- Improved insulation of buildings- Better control systems
24
As a consequence of improved insulation, additional ventilation might becomenecessary in order to maintain a good indoor climate (e.g. avoid draught prob-lems) perhaps extra ventilation will become necessary.
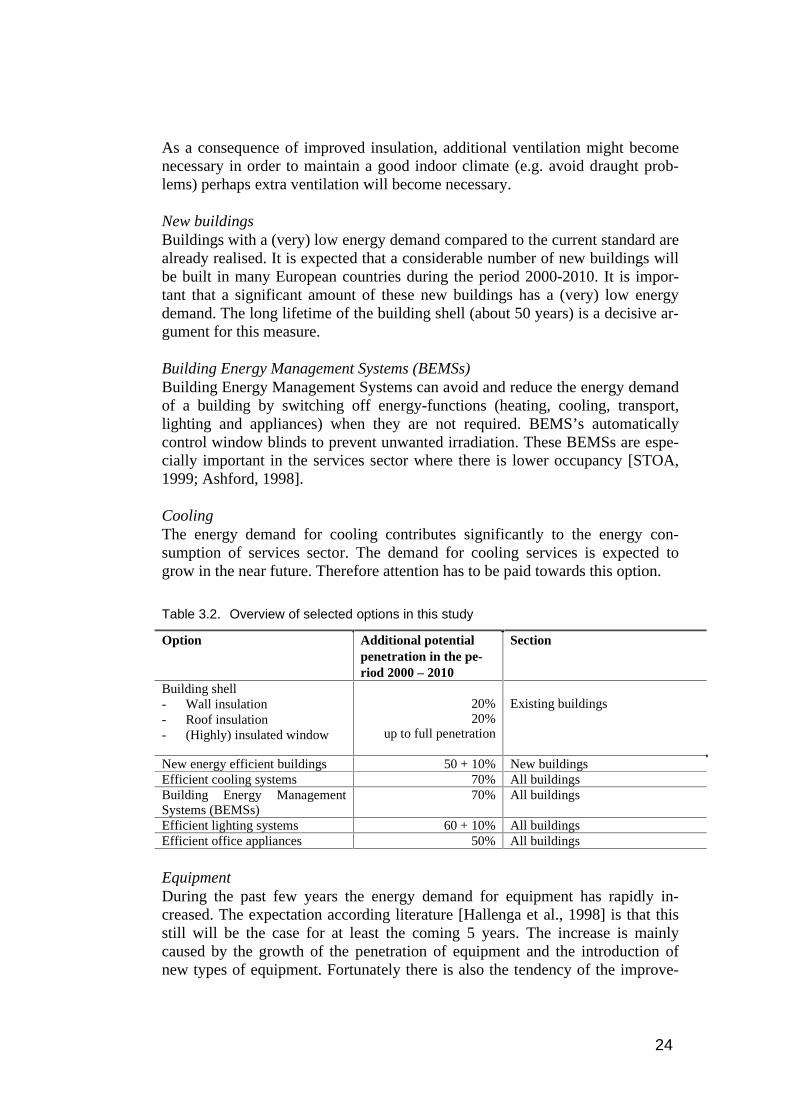
New buildingsBuildings with a (very) low energy demand compared to the current standard arealready realised. It is expected that a considerable number of new buildings willbe built in many European countries during the period 2000-2010. It is impor-tant that a significant amount of these new buildings has a (very) low energydemand. The long lifetime of the building shell (about 50 years) is a decisive ar-gument for this measure.
Building Energy Management Systems (BEMSs)Building Energy Management Systems can avoid and reduce the energy demandof a building by switching off energy-functions (heating, cooling, transport,lighting and appliances) when they are not required. BEMS’s automaticallycontrol window blinds to prevent unwanted irradiation. These BEMSs are espe-cially important in the services sector where there is lower occupancy [STOA,1999; Ashford, 1998].
CoolingThe energy demand for cooling contributes significantly to the energy con-sumption of services sector. The demand for cooling services is expected togrow in the near future. Therefore attention has to be paid towards this option.
Table 3.2. Overview of selected options in this study
Option Additional potentialpenetration in the pe-riod 2000 – 2010
Section
Building shell- Wall insulation- Roof insulation- (Highly) insulated window
20%20%
up to full penetration
Existing buildings
New energy efficient buildings 50 + 10% New buildingsEfficient cooling systems 70% All buildingsBuilding Energy ManagementSystems (BEMSs)
70% All buildings
Efficient lighting systems 60 + 10% All buildingsEfficient office appliances 50% All buildings
EquipmentDuring the past few years the energy demand for equipment has rapidly in-creased. The expectation according literature [Hallenga et al., 1998] is that thisstill will be the case for at least the coming 5 years. The increase is mainlycaused by the growth of the penetration of equipment and the introduction ofnew types of equipment. Fortunately there is also the tendency of the improve-

25
ment of the energy efficiency of equipment, which lowers the overall rise in en-ergy consumption to some extent.
Overview of optionsThe selected options are shown in Table 3.2. Also the additional penetration ratecompared to the autonomous development in 2010 is given and the part of thesector to which the option can be applied is named.
3.3.2 Option 1 : Improving building shell: wall insulation
3.3.2.1 DescriptionIn poorly insulated or uninsulated buildings there are enormous heat lossesthrough the building envelope. One measure with great effect is wall insulation.The impact of the application of wall insulation depends very much on the agedistribution profile of buildings, the renovation level etc. Only little informationis available on these aspects which decisively influence the energy use of theservices sector. The results of the measures assumed for the domestic sector aretranslated to the services sector by correcting for the relative lower heat lossesthrough walls in the services sector and taking into account other characteristics.
3.3.2.2 Autonomous developmentThe energy demand for heating in 1995 and 2010 is taken from the PRIMESdatabase. It is assumed that the specific energy consumption for space heatingdecreases by the same percentage between 1990 and 2010 as in the domesticsector. Depending on the country this results in an energy reduction relative tothe reference energy demand for heating in 2010 of about 1% to 5%. (Thevariation is caused by differences in average energy consumption per building inthe same climate zone). This energy reduction will be achieved through thecommon rate of renovation (about 10%).
3.3.2.3 Further energy efficiency improvementOption 1 consists of 20% extra retrofitting compared to the expected level of al-ready retrofitted building stock in 2010. This is based on the assumption that 3%of the uninsulated building stock can be handled per year and 10% of the build-ing stock has already been renovated during the period 2000 and 2010.For calculation of this option also the energy saving percentages of the domesticsector have been used. At the country level this leads to 1% to 3.5% energy re-duction of space heating.
In the literature it is estimated that potential of thermal insulation (including roofand floor insulation) is about 7.5% of the total energy consumption. This con-firms our results [Ashford, 1998].

26
3.3.2.4 CostsFor the cost per saved GJ the same value is taken as in the domestic sector. Inpractice, costs may be lower in the services sector due to reduced prices forlarger insulated surfaces.The costs vary from 60 euro1990/savedGJth/yr to 465 euro1990/saved GJth/yr.This cost range is mainly caused by differences in climate conditions; in a coldercountry the energy reduction is higher than in a warmer country, while the insu-lation cost per building is the same.
3.3.3 Option 2: Improving building shell: Roof installation
3.3.3.1 DescriptionAnother measure to reduce heat losses of the building shell is roof insulation.The same method as for option 1 has been used for option 2. The estimates havebeen based on the available information for the domestic sector but adaptationshave been made to account for the relatively lower heat transmission. The costof option 2 has been based on the costs of roof insulation in the domestic sector.
3.3.3.2 Autonomous developmentThe data of energy demand for space heating in 1995 and 2010 are extractedfrom the PRIMES database. It is assumed that the specific energy consumptionfor space heating decreases by the same percentage between 1990 and 2010 asin the domestic sector. This results in a lower energy demand for space heatingat country level of 0% to 5%. Cause of this reduction is the autonomous imple-mentation of renovation projects.
3.3.3.3 Further energy efficiency improvementOption 2 consists of 20% extra retrofitting compared to the expected level of al-ready retrofitted building stock of the services sector in 2010. This is based onthe assumption that 3% of the building stock can be insulated per year of which10% has already been planned to be insulated during the period 2000 and 2010(i.e. total 30%: 20% extra (option 2), 10% (autonomous development)). At thecountry level this leads to an additional energy reduction of space heating by 1%to 4%.
3.3.3.4 CostsThe cost per saved GJ is assumed to be the same as in the domestic sector, i.e.between 40 and 330 euro1990/savedGJth/yr. This variety is mainly caused by dif-ference in climate conditions; in a colder country the energy reduction is higherthan in a warmer country, while the insulation cost per building is the same.
27
3.3.4 Option 3: Improving building shell: Windows
3.3.4.1 DescriptionThe replacement of single pane windows by double pane windows, Ar-filledlow-e windows or superwindows represents a considerable energy saving po-tential.Due to lack of detailed information for the services sector the same method as inoption 1 has been used. This means that for a great deal we relied on informationof the domestic sector. Subsequently we corrected the saving percentages for therelatively lower heat transmission losses in the services sector compared to thedomestic sector. For the data (reduction of energy use and additional costs) ofdouble pane windows, Ar-filled low-e windows and superwindows we refer tothe report of the options to reduce carbon dioxide in the household sector.
3.3.4.2 Autonomous developmentThe data of energy demand for space heating in 1995 and 2010 are extractedfrom the PRIMES database.It is assumed that the specific energy consumption for space heating decreasesby the same percentage between 1990 and 2010 as in the domestic sector. Thismeans that at country level the energy demand for space heating is lowered by2.5 % to 8%. This reduction is caused by the autonomous implementation ofrenovation projects.
3.3.4.3 Further energy efficiency improvementOption 3 consists of replacement of the remaining single windows in 2010 ad-justed for the autonomous development. Furthermore, it is assumed that 50% ofthis remaining window amount is replaced by double-glazing, 40% by Argon-filled low e-glazing and 10% by superwindows.For calculation of this option also the findings of energy saving potentials of thedomestic sector have been used. This leads to 2.5% to 8% (compared toautonomous scenario in 2010) energy reduction of space heating at countrylevel.
3.3.4.4 CostsThe costs per saved GJ are taken the same as in the domestic sector. In practicethey may be lower due to reduced prices for larger insulated surfaces.The costs for this option ((highly) insulated windows) vary from 65 euro1990/savedGJth/yr to 480 euro1990/savedGJth/yr in investment terms only.This variation is caused, as in option 1 by the large variation in climate acrossthe EU.

28
3.3.5 Option 4: New energy efficient buildings
3.3.5.1 DescriptionThe energy intensity of space heating in new buildings is already lower than inexisting buildings. A typical current energy demand for space heating of a servi-ces building in the moderate climate zone is around 320 MJ/m2.In many European countries buildings have been realised with very low heatingrequirement: e.g. in France, Spain, and the United Kingdom services officeshave been built using around 200 MJ/m2 or less for heating (Ademe, 1993).Based on this information it is assumed that it is possible to bring the averageenergy use for space heating of new services building in 2010 down to a level of30% of average 1995 buildings (about 100 MJ/m2). This can be achieved by ap-plying good insulated building shell, heat recovery systems and energy efficientheating systems (heat pumps).
3.3.5.2 Autonomous developmentThe data for space heating of the services sector both for 1995 and for 2010 areextracted from the PRIMES database. The number of new buildings is assumedto be identical with the difference between 1995 and 2010. This is based on theassumption there is the assumption that the demolition rate can be neglected.The characteristic heating demand in a building in moderate climate will bearound 200 MJ/m2.
3.3.5.3 Further energy efficiency improvementWe assume that 50% of the new buildings have 30% lower energy use for spaceheating compared to the autonomous development in 2010 (from 200 MJ/m2 to140 MJ/m2) and 10% of the new buildings have 50% lower energy use (100MJ/m2).
3.3.5.4 CostsThe cost per floor space for new services buildings with a heat demand of about140 MJ/m2 is estimated to be 15 euro1990/m
2, for new services building with aheat demand of about 100 MJ/m2 the cost are estimated to be 40 euro1990/m
2.[Novem Website, 2000].
3.3.6 Option 5: Efficient cooling systems
3.3.6.1 DescriptionThe energy consumption for air conditioning has become significant in theservices sector (13% of electricity demand [Blok et al., 1996]). Three tendenciesare observed in the energy demand for cooling:- Increase of the amount of equipment, causing higher cooling loads- Increased comfort demands, causing higher cooling loads- Increase of energy efficiency of lighting and equipment, causing lower
cooling loads.
29
When these tendencies are taken in consideration it is expected that there will bean increased demand for cooling. There are generally two ways for energy con-servation in this area: reducing the need for cooling and by improving the effi-ciency of the cooling system. The demand for air conditioning can be reducedand sometimes eliminated by using natural shading in building design, naturalshading by planting trees, improvement of ventilation and by efficiency im-provement of other office equipment. The efficiency of the air conditioningsystem itself can be improved by improving the efficiency of the chiller, im-proved heat exchange, improved controls, switching to systems using a heatpump, adequate system design and improved maintenance [Levine, 1995]. Im-portant are also the increased use of heat exchangers and economiser, whichswitch the air conditioning system to the use of outdoor air when the outdoortemperature is low enough to cool the building. The technical energy savingpotential comes up to 40% based on most efficient models on the market [Le-vine, 1995].Other important developments are storage of thermal energy in building mass(‘night ventilation’) and seasonal storage of thermal energy (for cooling andheating). Utilising the thermal storage capacity can cut cooling energy demandby 30-70% [Bevington and Rosenfeld, 1990].
3.3.6.2 Autonomous developmentFor the autonomous scenario in 2010 it is assumed that the energy consumptionfor cooling is 13% of the electricity demand.
3.3.6.3 Further energy efficiency improvementThe additional saving potential is estimated to amount to about 40% comparedto the autonomous development in 2010. It is assumed that this potential can beapplied to 70% of the cooling demand in the services sector.
3.3.6.4 CostsThe cost of this option are estimated to be 11 euro1990/GJ [Beer et al, 1994].
3.3.7 Option 6: Building Energy Management Systems
3.3.7.1 DescriptionBuilding energy management systems (BEMSs) automatically regulate the op-eration of all energy demands (heating, cooling, transport, lighting and equip-ment). The BEMS saves energy and water demands by producing accurate andproper comfort levels depending on climate conditions. They are especially re-alising energy conservation by switching off energy-services when rooms arenot occupied. Particularly for the services sector, where many offices are emptyfor over 75% of the time, this is an essential source of energy saving. The intro-ducing of BEMSs has been widely trailed and monitored in the public buildingsector (among others through the CADDET programme). It is estimated thatsavings in the range up to 20% in space heating energy consumption could be
30
realised if wider use of BEMSs were made in the public and services sectors[Ashford, 1998; NWS, year].For electric appliances such as lighting and ventilation an additional saving of10% is expected [Ashford, 1998].
3.3.7.2 Autonomous developmentThe amount of energy demand for space heating and electricity appliances arebased on data from the PRIMES database.
3.3.7.3 Further energy efficiency improvementOption 6 consists of 20% saving of space heating in 2010 and 10% saving ofelectricity appliances in 2010. The assumed maximum penetration level is 70%of the overall building stock.
3.3.7.4 CostsThe costs of BEMSs vary enormously. The payback time is usually very short.Therefore additional costs are not taken into account.
3.3.8 Option 7: Efficient lighting systems
3.3.8.1 DescriptionThe share of energy for lighting accounts for about 38% of the total electricityconsumption of the services sector [Blok et al., 1996].Lighting in the services sector is mainly provided by three systems: incandes-cent lamps, fluorescent lighting and high-intensity discharge lighting. The fol-lowing measures can conserve a considerable amount of energy:- Incandescent lamps can be replaced by efficient fluorescent lamps (CFLs).
CFLs can yield the same amount of light using 60-80% of the energy com-pared to ordinary incandescent lamps.
- The luminaire efficiency of all lamp types can be improved using better re-flectors.
- A lighting control system detecting occupancy of a room or operating day-light or time independent can reduce the amount of burning hours.
The saving potential of the first two measures is determined to be 30% (Op-tion 7a) [Ashford, 1998]. The total saving potential of all three measures is esti-mated to be 55% (Option 7b) [Blok et al, 1996]. It should be noted that the lastmeasure overlaps with the electricity saving of introducing a BEMS.
3.3.8.2 Autonomous developmentIt is assumed that the share of electricity demand for lighting remains unchangedbetween 1995 and 2010. The data used originate from the PRIMES database.
3.3.8.3 Further energy efficiency improvementIt is assumed that the implementation degree of option 7a (30% savings) is 60%and that of option 7b (30% savings) is 10%.
31
3.3.8.4 CostsThe cost of the 55% saving option (option 7b) is estimated to be about 35euro1990/GJ saved electricity/yr. [Blok et al., 1996]. The cost of the 30% savingoption (option 7a) will be lower around 19 euro1990/GJ saved electricity/yr.
3.3.9 Option 8: Efficient office appliances
3.3.9.1 DescriptionAppliances use 35% of the total electricity consumption in the services sector[Blok et al., 1996]. Most of these appliances are typical office-appliances suchas computers, monitors, printers and photocopiers. Office-appliances account forone of the fastest growing end-users in the services building sector [Hallenga etal., 1998]. Computers are responsible for the largest part of the energy con-sumption. Energy reduction can be achieved by power down management andLCD screens.
3.3.9.2 Autonomous development in 2010It is assumed that the share of electricity demand for electric appliances remainsunchanged between 1995 and 2010. The data used originate from the PRIMESdatabase.
3.3.9.3 Further energy efficiency improvementThe technical energy saving potential of applying the combination of powermanagement and LCD screens is about the 50% - 75% of the energy demand forappliances. The penetration degree is estimated to be 50%.
3.3.9.4 CostsIt could be expected that power management would be available by 2010 with-out additional costs. The current additional costs of LCD screens compared tostandard screens are about 406 euro1990 per screen. It could be expected thatthese costs are about 200 euro1990 per screen in 2010.
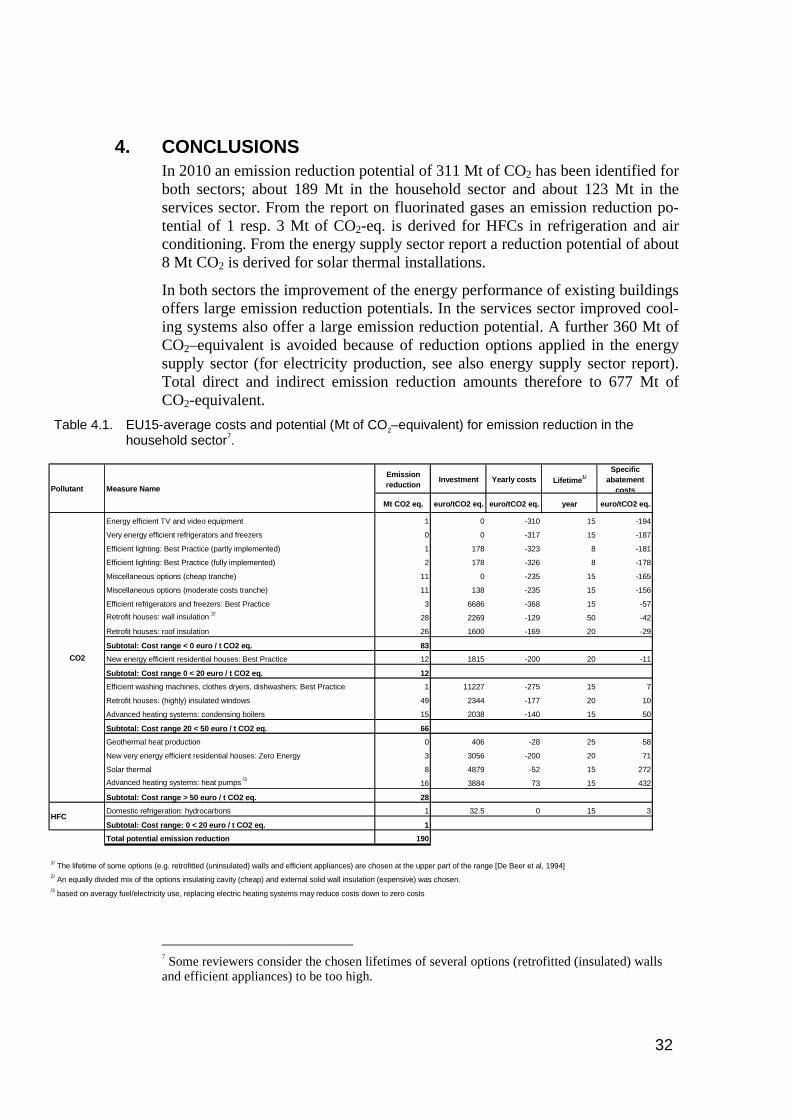
32
4. CONCLUSIONSIn 2010 an emission reduction potential of 311 Mt of CO2 has been identified forboth sectors; about 189 Mt in the household sector and about 123 Mt in theservices sector. From the report on fluorinated gases an emission reduction po-tential of 1 resp. 3 Mt of CO2-eq. is derived for HFCs in refrigeration and airconditioning. From the energy supply sector report a reduction potential of about8 Mt CO2 is derived for solar thermal installations.
In both sectors the improvement of the energy performance of existing buildingsoffers large emission reduction potentials. In the services sector improved cool-ing systems also offer a large emission reduction potential. A further 360 Mt ofCO2–equivalent is avoided because of reduction options applied in the energysupply sector (for electricity production, see also energy supply sector report).Total direct and indirect emission reduction amounts therefore to 677 Mt ofCO2-equivalent.
Table 4.1. EU15-average costs and potential (Mt of CO2–equivalent) for emission reduction in thehousehold sector7.
Emission reduction
Investment Yearly costs L ifetime1/Specific
abatement costs
Mt CO2 eq. euro/tCO2 eq. euro/tCO2 eq. year euro/tCO2 eq.
Energy efficient T V and video equipment 1 0 -310 15 -194
Very energy efficient refrigerators and freezers 0 0 -317 15 -187
Efficient lighting: Best Practice (partly implemented) 1 178 -323 8 -181
Efficient lighting: Best Practice (fully implemented) 2 178 -326 8 -178
Miscellaneous options (cheap tranche) 11 0 -235 15 -165
Miscellaneous options (moderate costs tranche) 11 138 -235 15 -156
Efficient refrigerators and freezers : Best Practice 3 6686 -368 15 -57
Retrofit houses: wall insulation 2/28 2269 -129 50 -42
Retrofit houses: roof insulation 26 1600 -169 20 -29
Subtotal: Cost range < 0 euro / t CO2 eq. 83
New energy efficient res idential houses: Best Practice 12 1815 -200 20 -11
Subtotal: Cost range 0 < 20 euro / t CO2 eq. 12
Efficient washing machines, clothes dryers , dishwashers: Best Practice 1 11227 -275 15 7
Retrofit houses: (highly) insulated windows 49 2344 -177 20 10
Advanced heating systems: condensing boilers 15 2038 -140 15 50
Subtotal: Cost range 20 < 50 euro / t CO2 eq. 66
Geothermal heat production 0 406 -28 25 58
New very energy efficient res idential houses: Zero Energy 3 3056 -200 20 71
S olar thermal 8 4879 -52 15 272
Advanced heating systems: heat pumps /316 3884 73 15 432
Subtotal: Cost range > 50 euro / t CO2 eq. 28
Domestic refrigeration: hydrocarbons 1 32.5 0 15 3
Subtotal: Cost range: 0 < 20 euro / t CO2 eq. 1
T otal potential emiss ion reduction 190
/3 based on averagy fuel/electricity use, replacing electric heating systems may reduce costs down to zero costs
Pollutant
CO2
HFC
1/ T he lifetime of some options (e.g. retrofitted (uninsulated) walls and efficient appliances) are chosen at the upper part of the range [De Beer et al, 1994]2/ An equally divided mix of the options insulating cavity (cheap) and external solid wall insulation (expensive) was chosen.
Measure Name
7 Some reviewers consider the chosen lifetimes of several options (retrofitted (insulated) wallsand efficient appliances) to be too high.

33
Table 4.2. EU15-average costs and potential (Mt of CO2–equivalent) for emission reduction in theservices sector.
E mission reduction
Investment Yearly costs L ifetime1/S pecific
abatement costs
Mt CO2 eq. euro/tCO2 eq. euro/tCO2 eq. year euro/tCO2 eq.
E fficient office equipment: Best Practice 3 0 -278 5 -178
Building Energy Management S ystems (BEMS ): electricity 3 0 -278 10 -178
E fficient space cooling equipment 1 377 -277 15 -172
E fficient lighting: Best Practice level 1 2 651 -278 8 -159
Very efficient lighting: Best Practice level 2 1 1200 -277 8 -144
Building Energy Management S ystems (BEMS ): space heating and cooling 42 0 -153 10 -129
Retrofit services buildings : wall insulation 14 2269 -157 50 -26
Retrofit services buildings : roof insulation 13 1600 -162 20 -8
S ubtotal: Cost range < 0 euro / t CO2 eq. 80
Retrofit services buildings : (highly) insulated windows 31 2344 -168 20 35
New energy efficient services buildings : Energy efficiency level 1 9 4059 -159 20 146
New very energy efficient services buildings : Energy efficiency level 2 3 6495 -159 20 312
S ubtotal: Cost range 20 < 50 euro / t CO2 eq. 43
S tationary air conditioning DX (dis tributed technology): leak reduction2/1 52.1 32.7 15 37
S tationary air conditioning chiller: HC and NH3 2/ 1 221.9 21.7 15 42
Commercial refrigeration: leakage reduction 2 82.5 41.5 15 49
S ubtotal: Cost range 20 < 50 euro / t CO2 eq. 3T otal potential emission reduction 126
1/ T he lifetime of some options (e.g. retrofitted (uninsulated) walls and efficient appliances) are chosen at the upper part of the range [De Beer et al, 1994]2/ T his reduction option covers both the household and the services sector. However, no sectoral breakdown is available.
Pollutant Measure Name
CO2
HFC
NB: the investment costs for the options Building Energy Management Systems space heat and cooling and Building Energy ManagementSystems electricity vary considerably, but are relatively low. In the calculations the investment costs are assumed to be zero.
Table 4.1 and 4.2 give an overview of the investment costs, the yearly costs(sum of operation and maintenance costs and savings), average specific avoid-ance costs and potential for options applicable in the household and servicessector. The specific costs are calculated using a real interest rate of 4% and us-ing the technical lifetime of the option, i.e. installation or equipment.
This report only deals with CO2 emissions while the other greenhouse gases(notably fluorinated gases) are covered by a separate report. However, the re-sults for non-CO2 greenhouse gases are displayed in Table 4.1 and 4.2.
Figure 4.1 and Figure 4.2 show the share in emission reduction by the householdand services sector in four costs brackets.

34
Figure 4.1. Households: 1990/1995 base year direct and indirect emissions per green-house gas (left), 2010 frozen technology reference level and reduction po-tentials per cost bracket (right)
Households
0
100
200
300
400
500
600
700
800
900
1990 2010
Gre
enho
use
gas
emis
sion
s (M
t CO
2 eq
uiva
lent
)
Right Column
Reductions achievable for <0 euro/tCO2
Reductions achievable for 0<20 euro/tCO2
Reductions achievable for 20<50 euro/tCO2
Reductions achievable for >50 euro/tCO2
Technically feasible emission level 2010
Left Column
F-gases 1990 emissions
N2O 1990 emissions
CH4 1990 emissions
CO2 1990 emissions
Figure 4.2. Services: 1990/1995 base year direct and indirect emissions per green-house gas (left), 2010 frozen technology reference level and reduction po-tentials per cost bracket (right)
Services
0
100
200
300
400
500
600
700
800
1990 2010
Gre
enho
use
gas
emis
sion
s (M
t CO
2 eq
uiva
lent
)
Right Column
Reductions achievable for <0 euro/tCO2
Reductions achievable for 0<20 euro/tCO2
Reductions achievable for 20<50 euro/tCO2
Reductions achievable for >50 euro/tCO2
Technically feasible emission level 2010
Left Column
F-gases 1990 emissions
N2O 1990 emissions
CH4 1990 emissions
CO2 1990 emissions
35
5. RECOMMENDATIONSThis study indicates that there is large scope for further energy efficiency im-provement in the household and services sector. This leads to recommendationsfor R&D in both sectors (see below). Moreover, this study comes to the conclu-sion that more detailed information is required for the model calculations, espe-cially to account for country specific aspects. In the following, the findings aregiven in more detail.
Suggestions for new options in household sector- The limitation of the cooling demand and the energy efficient supply of
cooling services will be an important option in the future. This option willespecially be especially relevant for southern European countries.
- Implementation of non-electric heat pumps, i.e., gas-fired absorption heatpumps could be an interesting option. Also the development of improvedelectric heat pumps is of major importance.
- As the insulation degree of dwellings is improved energy efficient ventila-tion systems become more and more important.
- Hot fill equipment for washing machines- Development of appliances that are more efficient than ‘1999 best practice’
appliances- Increased penetration of floor insulation and upgrading of insulation.
Suggestions for additional options in services sector- Advanced heating systems (e.g. heat pumps) have not been taken into ac-
count in this study for two reasons. Firstly, priority is given to lowering theenergy demand of a building (renovation projects, energy-advanced build-ings). Secondly, it is expected that considerable saving potential have al-ready been realised by improved control systems.
- Advanced energy techniques, like vacuum insulation.- Other options, e.g. floor insulation and upgrading of insulation etc.
Needs for more detailed information- More country-specific data to what extent measures are already penetrated is
of great importance. For instance the number of dwellings that has beenrenovated.
- More accurate data and projections of the building stock.- More information about maximum penetration of options.- Data of number of offices and other buildings in the services sector, area
(m2) and their age distribution profile.- Projections of building stock for the nearby future and renovation rates.- Characteristics of energy demand of the various energy-functions (heating,
cooling, transport, lighting and appliances) at country level.

36
- Information of energy consumption, development in energy consumptionand (specific) CO2 reduction measures and their consequences at more de-tailed level, preferable per sub-sector (Health, Education, Government,Sports and Entertainment, Commercial offices, Communications and Trans-port, Hotels and Catering, Retail, Warehousing etc).

37
REFERENCES
Annual Bulletin, 1997. Annual Bulletin of housing and Building Statistics for Europe and NorthAmerica, United Nations 1997.
Ashford et al, 1998. Assessment of potential for saving of carbon dioxide emissions in Europeanbuilding stock, submitted by Caleb management services, prepared for the Euroace – buildingenergy efficiency alliance.
K. Blok, D. van Vuuren, A. van Wijk and L. Hein, 1996. Department of Science, Technologyand Society Utrecht University, ‘Policies and measures to reduce CO2 emissions by efficiencyand renewable, A Preliminary Survey for the Period to 2005’, The Netherlands.
Beer de J.G., Wees van M.T., Worrel E. and Blok K., 1994. Icarus-3, the potential of EnergyEfficiency Improvement in the Netherlands up to 2000 and 2015, Department of Science, Tech-nology and Society Utrecht University, October 1994. Utrecht.
Bevington,R and A.H. Rosenfeld, 1990. Energy for Buildings and Homes, Scientific American,September 1990.
Boardman et al. 1997. DECADE, Transforming the UK Cold Market, Environmental ChangeUnit University of Oxford, CEC (DGXVII) SAVE programme contract No. XVII/4.1031/Z/95-008, 1997
Boardman et al. 1997b. DECADE, 2 MtC, Environmental Change Unit University of Oxford,CEC (DGXVII) SAVE programme contract No. XVII/4.1031/Z/95-008, 1997.
EC, 1993. Statistics on Housing in the European Community 1993, EC
EC, 1996. Communication of the Commission to the Framework Convention on ClimateChange, European Commission, Brussels, EC, 1996.
Energy Guide diskette, year. Energy Guide diskette, Mook & van Zuylen in co-operation withEnergieNed.
EVA, 1998. Analysis of energy efficiency of domestic electric storage water heaters, ContractorEnergieverwertungsagentur (EVA), EC project manager P. Bertoldi Contract No SAVE-41031/E/95-013, March 1998
GEA, 1993. Study on Energy efficiency standards for domestic refrigeration appliances. Groupfor efficient appliances, Working Group 106 – Club EnR, March 1993
GEA, 1995. Washing Machines, Driers and Dishwashers, Group for Efficient Appliances(GEA), Working Group – European Energy Network (EnR), ‘, June 1995
Geuzendam C., Giljiamse W, 1994. Assessment of energy efficient technologies for end-use inthe residential and commercial sectors, IVAM Amsterdam, August 1994
Hallenga et al, 1998. Inventory of Office Equipment Energy-efficiency, report 98 PO/PRO 606,TNO, Delft November 1998
Holsteijn et al, 1999. Gasconcepten voor de zichtjaren 2000, 2010, 2020. R.C.A. Holsteijn, TakM.P.W. and Li W, 1999.
Huiskamp, 1998, Base investigation Electricity consumption of small end users (BEK ’97), En-ergieNed, Arnhem, July 1998
Huiskamp, 1999, Base investigation Natural gas consumption of small end users (BAK ’98), En-ergieNed, Arnhem, December 1999
IEA, 1996. Beyond 2020, IEA Diskette Service Release 4.1 Browser 441 International EnergyAgency, Paris, 1996

38
Joosen et al., 1999. Background study Energy saving guide 1999, Ecofys, on behalf of the Con-sumentenbond, E40094, September 1999
Krause et al, 1998. Low-Carbon Comfort: The Cost And Potential Of Energy Efficiency in EUBuildings, Energy Policy in the Greenhouse Volume two part 5, January 1998
Laffont and Janssen, 2000. Written communication, Glaverbel, email 28 April 2000
Laffont, 2000. Written communication, P. Laffont, June 2000
Levin et al, 1995. Efficient Use of Energy Utilizing High Technology, An Assessment of EnergyUse in Industry and Buildings, WEC, London, UK, 1995
Lillicrap, C and Ashford, P, 2000. Emission reduction options for greenhouse gases in domestic,commercial and industrial buildings, May 2000
MURE, year. MURE database, (Mesures d’Utilisation Rationnelle del’Energie), Developed un-der the SAVE programme, ISIS, Inestene, March, Fraunhofer Gesellschaft
Novem website, 2000. Examples of energy advanced offices, www.novem.nl/epn, 2000
NOVEM, 1998. Analysis of Energy Consumption and Efficiency Potential for TVs in on-mode,Contractor Novem, EC project manager P. Bertoldi, Contract EC-DGXVII4.1031/D/97-023,November 1998
Palmer et al., 1998 DELight, Environmental Change Unit University of Oxford, EC DG XVII,under contract XVII/4.1031/Z/96-075, May 1998
PRIMES, 1999. PRIMES model. National Technical University of Athens, 1999
Reydellet, 2000. Written communication, A. de Reydellet, Saint-Gobain Isover, 2000.
SAVE, 1995. Home and Office Electronics Appliances: More Gigabytes, less Gigawatts. Pro-ceedings of the SAVE Session, 7 June 1995, Valbonne – France
Schipper et al., 1985. Schipper, L., A. Ketoff, and A. Kahane, 1985, Explaining residential en-ergy use by international bottom-up comparisons, in: Ann.Rev.Energy, (1985), 10, p.341-405.
STOA, 1998. Building regulations as a means of requiring energy saving and use of renewableenergies, Scientific and technical options assessment (STOA), project noEP/IV/STOA/98/0503/01, final report, December 1998
United Nations, 1997. Annual Bulletin of housing and Building Statistics for Europe and NorthAmerica, United Nations 1997
Van Hal, year, Beyond the Backyard, sustainable housing experiences in their national context,Aeneas, Best, The Netherlands
VROM, 1998. Public housing in figures, Ministry of Housing and Spatial Planning, the Nether-lands, December 1998
39
AN
NE
X 1
LIS
T O
F E
NE
RG
Y S
AV
ING
ME
AS
UR
ES
ISp
ace
heat
ing
and
cool
ing
(com
fort
able
indo
or t
empe
ratu
re)
I.1
Impr
ovin
g bu
ildi
ng s
hell
wal
l and
cei
ling
insu
lati
onw
indo
ws
door
s an
d w
indo
w f
ram
estu
bes
insu
lati
on (
in r
oom
s, w
hich
hav
e no
or
low
hea
t dem
and)
mea
sure
s to
red
uce
draf
t (to
chtw
erin
g en
kie
rdic
htin
g)I.
2A
dvan
ced
heat
ing
syst
ems
(Sw
itch
ing
of e
nerg
y ca
rrie
rs (
and
usin
g m
ore
ener
gy-e
ffic
ient
hea
ting
sys
tem
s))
cond
ensi
ng b
oile
rshe
at p
umps
low
tem
pera
ture
sys
tem
sI.
3E
nerg
y st
orag
ese
ason
al s
tora
ge o
f th
erm
al e
nerg
y (e
.g. a
quif
er)
ener
gy s
tora
ge in
pha
se c
hang
ing
mat
eria
lsco
ld s
tora
gepa
ssiv
e co
olin
g (e
.g. n
ight
ven
tila
tion
, sun
shad
ing
use
of b
uild
ing
mas
s)pa
ssiv
e so
lar
ener
gyI.
4H
eat r
ecov
ery
on v
enti
lati
on a
ir
IIT
rans
port
(to
tra
nspo
rt f
resh
air
to
the
desi
red
plac
e an
d to
tra
nspo
rt t
herm
al e
nerg
y (h
eat
or c
old)
to
the
desi
red
plac
e)II
.1V
entil
atio
n on
dem
and
(wit
h oc
cupa
tion-
sens
ors)
II.2
Low
Ene
rgy
vent
ilati
on s
yste
ms
Ene
rgy
effi
cien
t fan
sN
atur
al (
driv
en)
vent
ilati
onII
.3O
ptim
al tu
ning
of
pum
ps a
nd f
ans
(wit
h so
ftw
are,
sen
sors
and
var
iabl
e sp
eed
driv
es)

40
III
Lig
htin
gII
I.1
Incr
ease
d us
abili
ty o
f da
y-lig
ht (
dayl
ight
tran
spor
t sys
tem
sII
I.2
Incr
ease
d ef
fici
ency
of
light
ing
syst
ems
switc
h fr
om tu
ngst
en la
mps
to c
ompa
ct f
luor
esce
nt la
mps
impr
ovem
ent i
n th
e ef
fici
ency
of
trad
itio
nal f
luor
esce
nt tu
bes
III.
3In
crea
sed
tuna
bilit
y of
ligh
ting
syst
ems
IVH
ot w
ater
IV.1
Red
uce
hot w
ater
dem
and
hot w
ater
pro
duct
ion
near
the
fauc
etus
e w
ater
sav
ing
fauc
ets
and
show
ers
use
ther
mos
tati
c fa
ucet
sIV
.2A
dvan
ced
heat
ing
syst
ems
(Sw
itchi
ng o
f en
ergy
car
rier
s (a
nd u
sing
mor
e en
ergy
-eff
icie
nt h
eati
ng s
yste
ms)
)se
e al
so I
.2he
at p
ump
boil
erIV
.3U
sing
was
te h
eat
use
was
te h
eat f
rom
fri
dge
or d
eep
free
zehe
at r
ecov
ery
on w
aste
-wat
er
VC
ooki
ngO
nly
Res
iden
tial b
uild
ings
V.1
Impr
ove
trad
ition
al c
ooki
ng s
yste
ms
Impr
ovin
g th
e he
at (
or e
nerg
y-)
tran
sfer
bet
wee
n co
okin
g de
vice
and
coo
king
pot
(max
40%
impr
ovem
ent)
(e.
g. c
ooke
r w
ith b
uilt-
in h
eati
ng e
lem
ent)
Red
uce
cook
ing
tim
e (e
.g. h
igh
pres
sure
, hig
h te
mpe
ratu
re c
ooki
ng)
Insu
lati
ng th
e co
okin
g po
tT
herm
osta
tic tu
ning
of
cook
ing
devi
ce (
deli
veri
ng n
o m
ore
heat
then
nee
ded)
V.2
Adv
ance
d co
okin
g sy
stem
sM
icro
wav
e he
atin
gIn
duct
ion
heat
ing

41
Ele
ctri
city
app
lianc
esV
IC
OL
D A
) R
efri
gera
tor,
B)
Dee
p fr
eeze
Onl
y R
esid
enti
al b
uild
ings
VI.
1Im
prov
e tr
aditi
onal
sys
tem
sV
acuu
m in
sula
tion
Incr
ease
d do
or in
sula
tion
(ap
plie
d on
the
outs
ide/
insi
de)
Incr
ease
d ca
bine
t ins
ulat
ion
(wit
h in
crea
se o
f ap
plia
nce
heig
ht/w
ith
cons
tant
ext
erio
r ap
plia
nce
dim
ensi
ons
(los
s of
vol
ume)
Dec
reas
ed d
oor
leak
age
Incr
ease
eva
pora
tor
surf
ace
Incr
ease
d co
nden
ser
surf
ace
Incr
ease
d ev
apor
atio
n he
at c
apac
ity
Incr
ease
d co
nden
ser
heat
cap
acit
yIm
prov
ed c
ompr
esso
r ef
fici
ency
VI.
2A
dvan
ced
syst
ems
Stir
ling
cool
ing
Abs
orpt
ion
cool
ing
VI.
3U
se o
f w
aste
/env
iron
men
tal h
eat/c
old
Exe
rget
ic c
asca
de (
use
of w
aste
-hea
t fro
m r
efri
gera
tor
for
inst
ance
hot
wat
er)
Use
of
envi
ronm
enta
l col
dV
I.4
Rep
lace
or
repa
ir f
ault
y w
orki
ng s
yste
ms
Onl
y E
xist
ing
Res
iden
tial
bui
ldin
gs
VII
WE
TA
) W
ashi
ng m
achi
neO
nly
Res
iden
tial b
uild
ings
VII
-A.1
Impr
ove
trad
ition
al w
ashi
ng s
yste
ms
Impr
oved
wat
er le
vel c
ontr
ol [
prov
en te
chno
logy
]L
onge
r ti
me,
low
er te
mpe
ratu
re, i
nclu
ding
bio
step
(or
alt
erna
tive
ly, i
mpr
oved
mec
hani
cal a
ctio
n) [
prov
en]
Bas
ic im
prov
emen
t the
rmal
eff
icie
ncy
[pro
ven]
Red
ucti
on o
f tu
b-dr
um c
lear
ance
s, la
rger
dru
mIm
prov
ed r
insi
ng e
ffic
ienc
y, 3
rin
ses
[pro
ven]
Bas
ic im
prov
emen
t mot
or e
ffic
ienc
y [p
rove
n]E
xten
ded
mot
or e
ffic
ienc
y im
prov
emen
t [ex
peri
men
tal]
Ext
ende
d w
ater
eco
nom
y im
prov
emen
t [ex
peri
men
tal]
42
VII
-A.2
Adv
ance
d w
ashi
ng s
yste
ms
Hea
t pum
p w
ashi
ng m
achi
neU
ltras
onic
was
hing
VII
-A.3
Hea
t rec
over
yH
eat e
xcha
nger
con
cept
for
dis
tric
t hea
ting,
cen
tral
hea
ting
, etc
.V
II-A
.4Im
prov
e an
d tu
ne o
pera
tion
Buy
ing
smal
ler
mac
hine
s (t
o fi
t hou
seho
ld s
ize
bette
r), 1
5-20
% d
owns
calin
g (i
mpr
oved
load
ing
effi
cien
cy s
mal
ler
hous
ehol
ds
Low
er p
rogr
amm
e te
mpe
ratu
re (
thro
ugh
dete
rgen
t im
prov
emen
ts)
Red
uced
det
erge
nt lo
ss (
e.g.
tub
valv
e)A
utom
atic
/impr
oved
det
erge
nt d
osag
e (d
ual c
ompo
nent
)U
se o
f E
co-b
utto
nIm
prov
ed te
xtile
sV
II-A
.5In
fras
truc
tura
l opt
ions
Use
of
hot-
fill,
whe
reve
r ap
prop
riat
e (e
.g. i
n ca
se o
f no
n-el
ectr
ic h
ot w
ater
sup
ply
and
reas
onab
ly s
hort
sup
ply
line
s)
Top
ic s
pin
spee
d, w
hich
doe
s no
t rel
ate
to th
e en
ergy
con
sum
ptio
n of
the
was
hing
mac
hine
but
to th
e en
ergy
con
sum
ptio
n of
tum
ble
drie
rs, a
nd n
ight
-tim
e us
e, w
hich
ref
ers
to th
e so
und
leve
l of
the
mac
hine
and
fea
ture
s of
pro
gram
me
pre-
set
B)
Dri
erO
nly
Res
iden
tial b
uild
ings
VII
-B.1
Adv
ance
d dr
ying
sys
tem
sH
igh
spee
d sp
in d
ryin
gH
eat p
ump
drye
rM
icro
wav
es d
ryer
No
drye
r (u
ltras
onic
was
hing
)V
II-B
.2H
eat r
ecov
ery
Hea
t rec
over
y, c
onde
nsin
g dr
yer
VII
-B.3
Impr
ove
and
tune
ope
rati
onIm
prov
ed te
xtile
s

43
C)
Dis
hwas
her
Onl
y R
esid
entia
l bui
ldin
gsV
II-C
.1Im
prov
e tr
aditi
onal
was
hing
sys
tem
sL
ower
hot
rin
se (
spoe
l) te
mpe
ratu
re o
f 55
C [
prov
en te
chno
logy
]L
ower
was
h te
mpe
ratu
re o
f 55
C a
nd 1
0 m
inut
es lo
nger
was
h cy
cle
[pro
ven]
Alte
rnat
ing
spra
ying
of
top
and
botto
m s
pray
arm
[pr
oven
]C
ross
-flo
w h
eat e
xcha
nger
bet
wee
n w
ater
in-
and
outle
tIm
prov
ed th
erm
al e
ffic
ienc
y, r
educ
e th
erm
al b
ridg
esW
eigh
t red
ucti
on o
f he
ated
mac
hine
par
tsC
onde
nser
for
dry
ing
wit
hout
add
ition
al h
eat [
prov
en]
Impr
oved
mot
or a
nd p
ump
effi
cien
cyIm
prov
ed w
ater
leve
l con
trol
Reu
se o
f la
st r
inse
wat
erV
II-C
.2A
dvan
ced
dish
was
hing
sys
tem
sH
eat p
ump
dish
was
her
Aco
ustic
dis
h w
ashe
rV
II-C
.3Im
prov
e an
d tu
ne o
pera
tion
Impr
oved
det
erge
nts
(col
d w
ater
)V
II-C
.4In
fras
truc
tura
l opt
ions
H
ot-f
ill a
nd a
ltern
ativ
e he
at s
ourc
es
VII
IB
RO
WN
(TV
, VSR
, aud
io, P
C e
tc)
Onl
y R
esid
entia
l bui
ldin
gsV
III.
1R
educ
tion
of
stan
dby
cons
umpt
ion
VII
I.2
Impr
oved
tech
niqu
es (
e.g.
lcd
scre
ens,
impr
oved
tran
sfor
mat
ors)
IXO
ffic
e eq
uipm
ent
(cop
iers
, fax
es)
Onl
y C
omm
erci
al b
uild
ings
IX.1
Red
ucti
on o
f st
andb
y co
nsum
ptio
nIX
.2Im
prov
ed te
chni
ques
(e.
g. lc
d sc
reen
s, im
prov
ed tr
ansf
orm
ator
s)
XIn
tegr
ated
opt
ions
X.1
Bui
ldin
g cl
imat
e co
ntro
l sys
tem
X.2
Ene
rgy
man
agem
ent s
yste
mX
.3In
tegr
ated
app
roac
hes
to e
nerg
y ef
fici
ent b
uild
ing
X.4
Red
uce
ener
gy r
equi
rem
ent o
f th
e bu
ildi
ng it
self
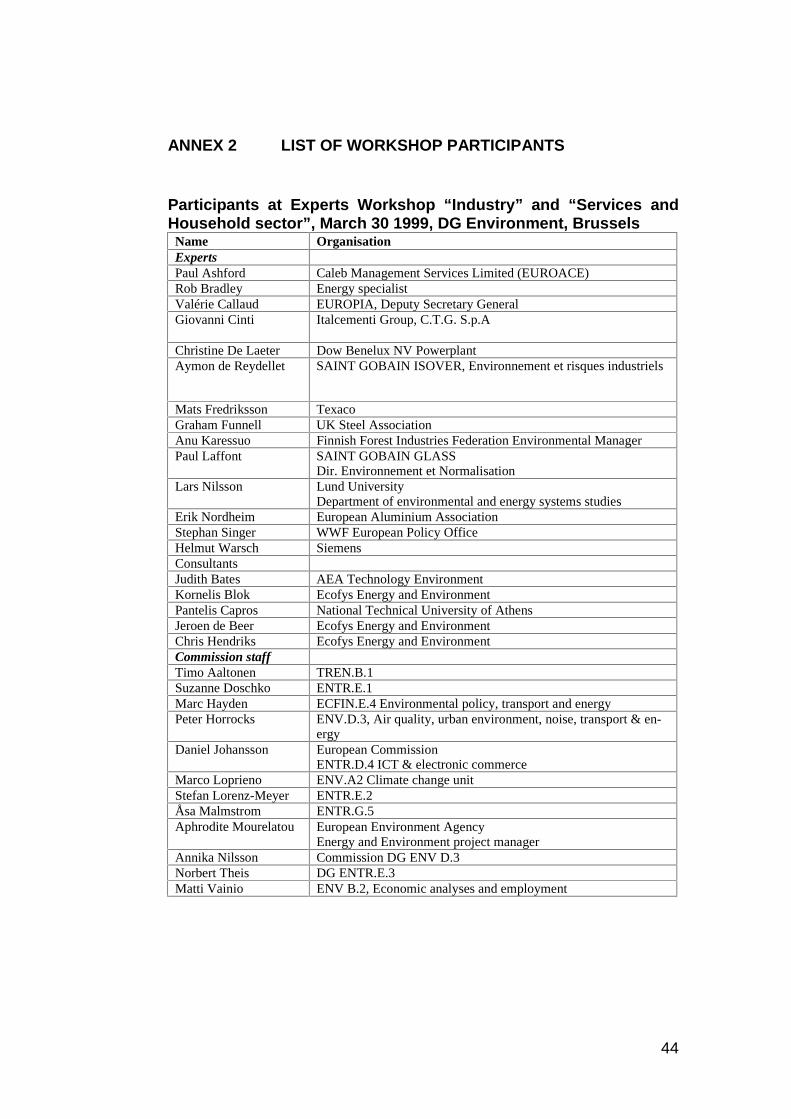
44
ANNEX 2 LIST OF WORKSHOP PARTICIPANTS
Participants at Experts Workshop “Industry” and “Services andHousehold sector”, March 30 1999, DG Environment, Brussels
Name OrganisationExpertsPaul Ashford Caleb Management Services Limited (EUROACE)Rob Bradley Energy specialistValérie Callaud EUROPIA, Deputy Secretary GeneralGiovanni Cinti Italcementi Group, C.T.G. S.p.A
Christine De Laeter Dow Benelux NV PowerplantAymon de Reydellet SAINT GOBAIN ISOVER, Environnement et risques industriels
Mats Fredriksson TexacoGraham Funnell UK Steel AssociationAnu Karessuo Finnish Forest Industries Federation Environmental ManagerPaul Laffont SAINT GOBAIN GLASS
Dir. Environnement et NormalisationLars Nilsson Lund University
Department of environmental and energy systems studiesErik Nordheim European Aluminium AssociationStephan Singer WWF European Policy OfficeHelmut Warsch SiemensConsultantsJudith Bates AEA Technology EnvironmentKornelis Blok Ecofys Energy and EnvironmentPantelis Capros National Technical University of AthensJeroen de Beer Ecofys Energy and EnvironmentChris Hendriks Ecofys Energy and EnvironmentCommission staffTimo Aaltonen TREN.B.1Suzanne Doschko ENTR.E.1Marc Hayden ECFIN.E.4 Environmental policy, transport and energyPeter Horrocks ENV.D.3, Air quality, urban environment, noise, transport & en-
ergyDaniel Johansson European Commission
ENTR.D.4 ICT & electronic commerceMarco Loprieno ENV.A2 Climate change unitStefan Lorenz-Meyer ENTR.E.2Åsa Malmstrom ENTR.G.5Aphrodite Mourelatou European Environment Agency
Energy and Environment project managerAnnika Nilsson Commission DG ENV D.3Norbert Theis DG ENTR.E.3Matti Vainio ENV B.2, Economic analyses and employment