Leica TCS SP8 - McGill Universitybam.lab.mcgill.ca/pdfs/quickstart.pdfStart-Up Procedure 1. Turn on...
30
Leica TCS SP8 Quick Start Guide
Transcript of Leica TCS SP8 - McGill Universitybam.lab.mcgill.ca/pdfs/quickstart.pdfStart-Up Procedure 1. Turn on...

Leica TCS SP8Quick Start Guide

Leica TCS SP8 System Overview


Start-Up Procedure
1. Turn on the CTR Control Box, EL6000 fluorescent light source for the microscope stand.
2. Turn on the Scanner Power (1) on the front of the Compact Supply Unit (CSU)
3. Turn on the Laser Power (2)
4. Enable the lasers by turning the key from the Off position to the Onposition (3).
5. Turn on Workstation and Monitor
6. Log into user profile
7. Double click on the LAS X icon to start the software.
8. Select Machine for the Configuration and DMi8 for the Microscope. (the simulator is used to view and analyze images and not acquistition)
10. Click OK to start the initialization of the LAS AF (Leica Application Suite for Advanced Fluorescence)
11. A message will appear asking whether you want to initialize the stage. Initializing the stage is required to activate the Tiling and Mark & Find features in the software.
If you select yes, the stage is going to move to all 4 corners to calibrate the position of the stage.
Make sure there is nothing on the stage that will hit the condenser before you select yes!
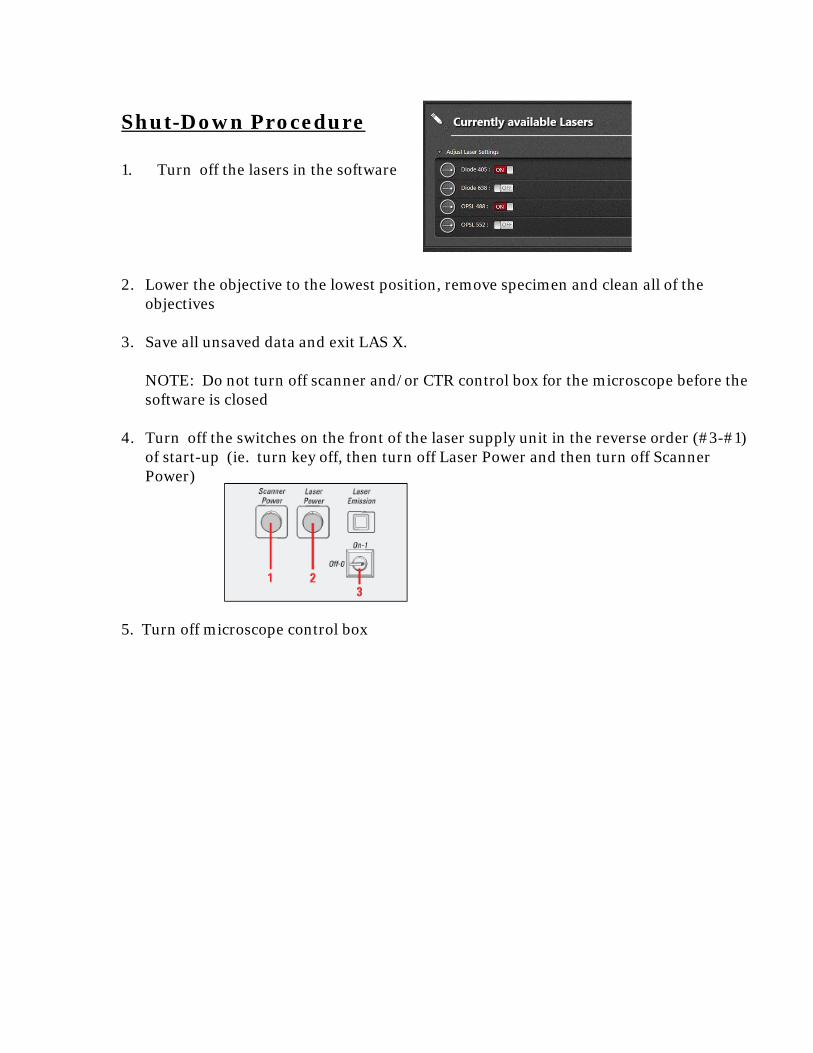
Shut-Down Procedure
1. Turn off the lasers in the software
2. Lower the objective to the lowest position, remove specimen and clean all of the objectives
3. Save all unsaved data and exit LAS X.
NOTE: Do not turn off scanner and/or CTR control box for the microscope before the software is closed
4. Turn off the switches on the front of the laser supply unit in the reverse order (#3-#1) of start-up (ie. turn key off, then turn off Laser Power and then turn off Scanner Power)
5. Turn off microscope control box
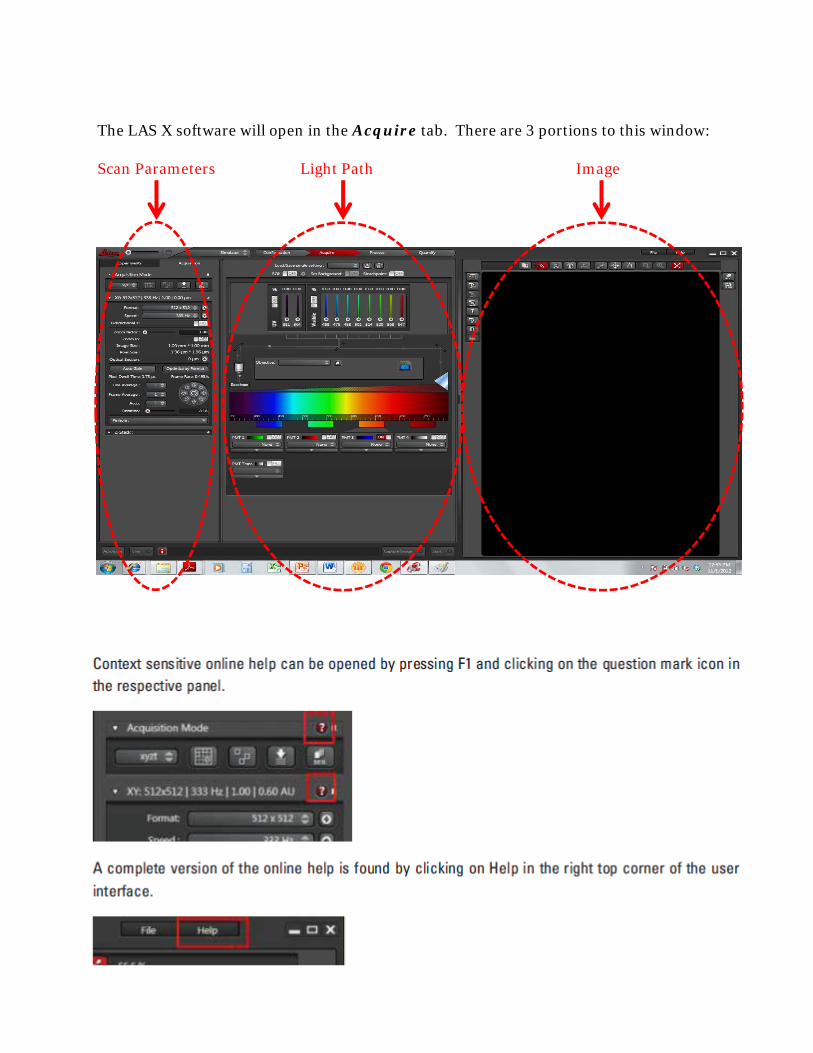
The LAS X software will open in the Acquire tab. There are 3 portions to this window:
Scan Parameters Light Path Image
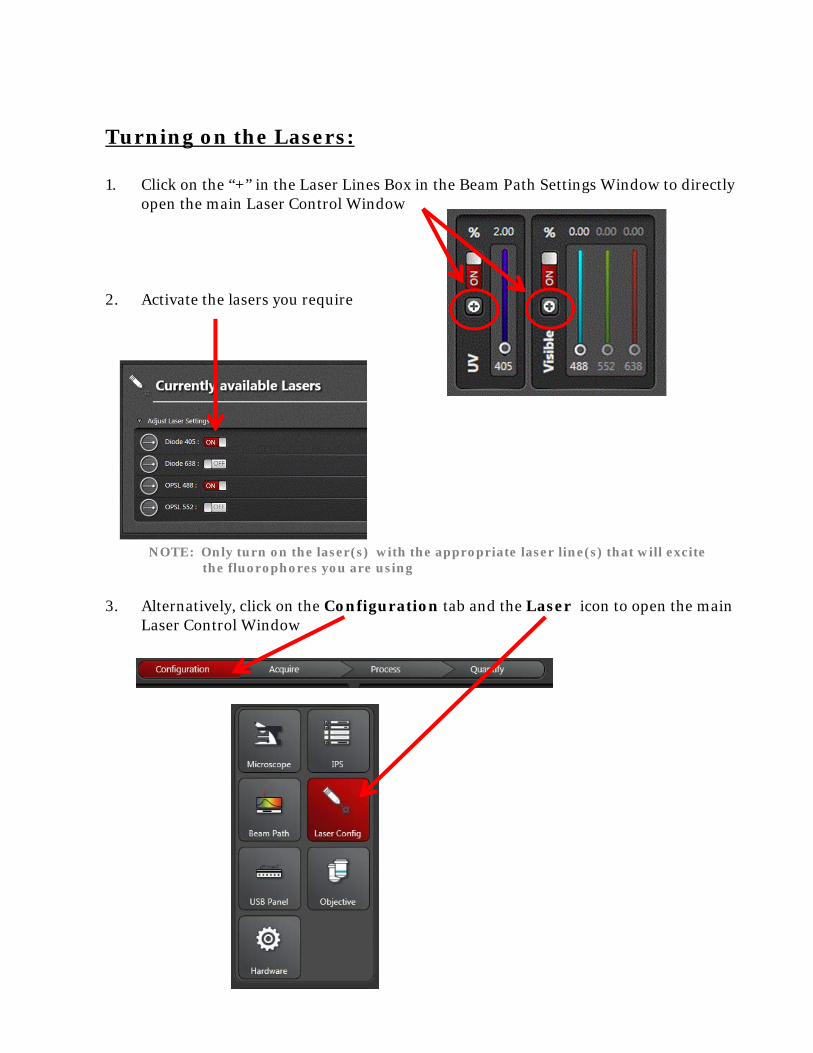
Turning on the Lasers:
1. Click on the “+” in the Laser Lines Box in the Beam Path Settings Window to directly open the main Laser Control Window
2. Activate the lasers you require
3. Alternatively, click on the Configuration tab and the Laser icon to open the main Laser Control Window
NOTE: Only turn on the laser(s) with the appropriate laser line(s) that will excite the fluorophores you are using

Additional Tools in the Configuration Tab…
1. Customize the USB Control Panel - assign various parameter and sensitivities to the various knobs of the control panel
2. Specifications of the Objectives equipped on the microscope
Save and Load the customized settings
Alternatively , click on the Control Panel Icon in the Beam Path Settings Window as a short cut to the USB Control Panel Window
Additional Tools in the Configuration Tab Continued…
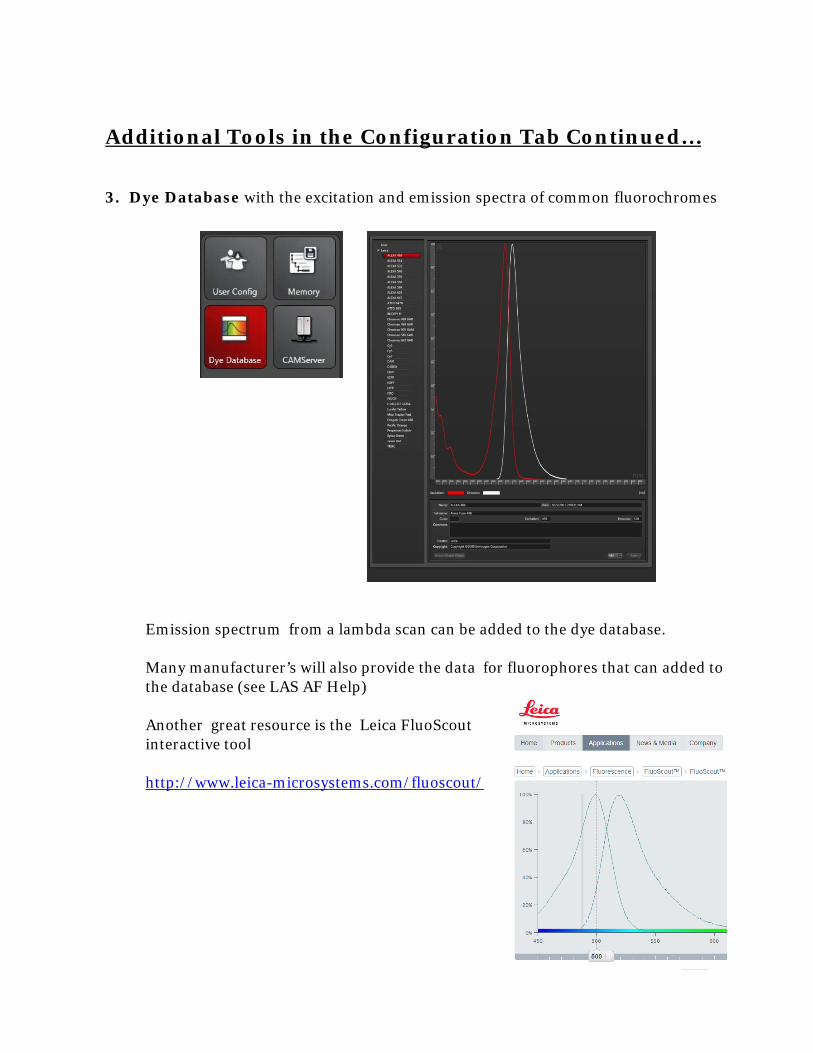
3. Dye Database with the excitation and emission spectra of common fluorochromes
Emission spectrum from a lambda scan can be added to the dye database.
Many manufacturer’s will also provide the data for fluorophores that can added to the database (see LAS AF Help)
Another great resource is the Leica FluoScout interactive tool
http://www.leica-microsystems.com/fluoscout/
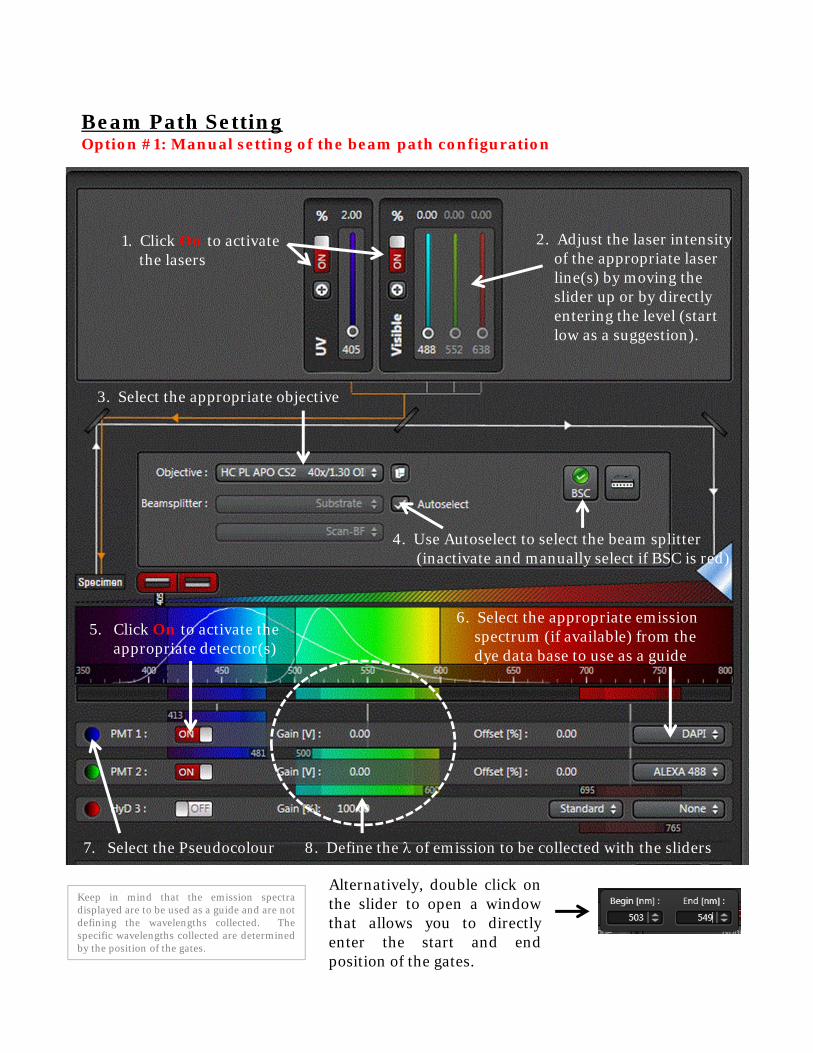
Beam Path SettingOption #1: Manual setting of the beam path configuration
1. Click On to activate the lasers
2. Adjust the laser intensity of the appropriate laser line(s) by moving the slider up or by directly entering the level (start low as a suggestion).
4. Use Autoselect to select the beam splitter(inactivate and manually select if BSC is red)
3. Select the appropriate objective
6. Select the appropriate emission spectrum (if available) from the dye data base to use as a guide
8. Define the of emission to be collected with the sliders
5. Click On to activate the appropriate detector(s)
Keep in mind that the emission spectradisplayed are to be used as a guide and are notdefining the wavelengths collected. Thespecific wavelengths collected are determinedby the position of the gates.
Alternatively, double click onthe slider to open a windowthat allows you to directlyenter the start and endposition of the gates.
7. Select the Pseudocolour

Beam Path SettingOption #2: Dye Assistant to set beam path configuration
The Dye Assistant offers suggestion on system configuration based on the spectralcharacteristics of the fluorescent dyes being used. The user can select the appropriateoption for his or her application
1. Activate the Dye Assistant.
Select the dye from the database Select the type of detector (if applicable)
Use the “+” or “-” toadd or delete a dye
The different configuration options for acquisition are suggestedhere and the overlap is shown graphically:
• Yield: Intensity yield of the individual dyes• Crosstalk: Intensity of the crosstalk in other channels
Edit and Applythe settings.
(see next page)
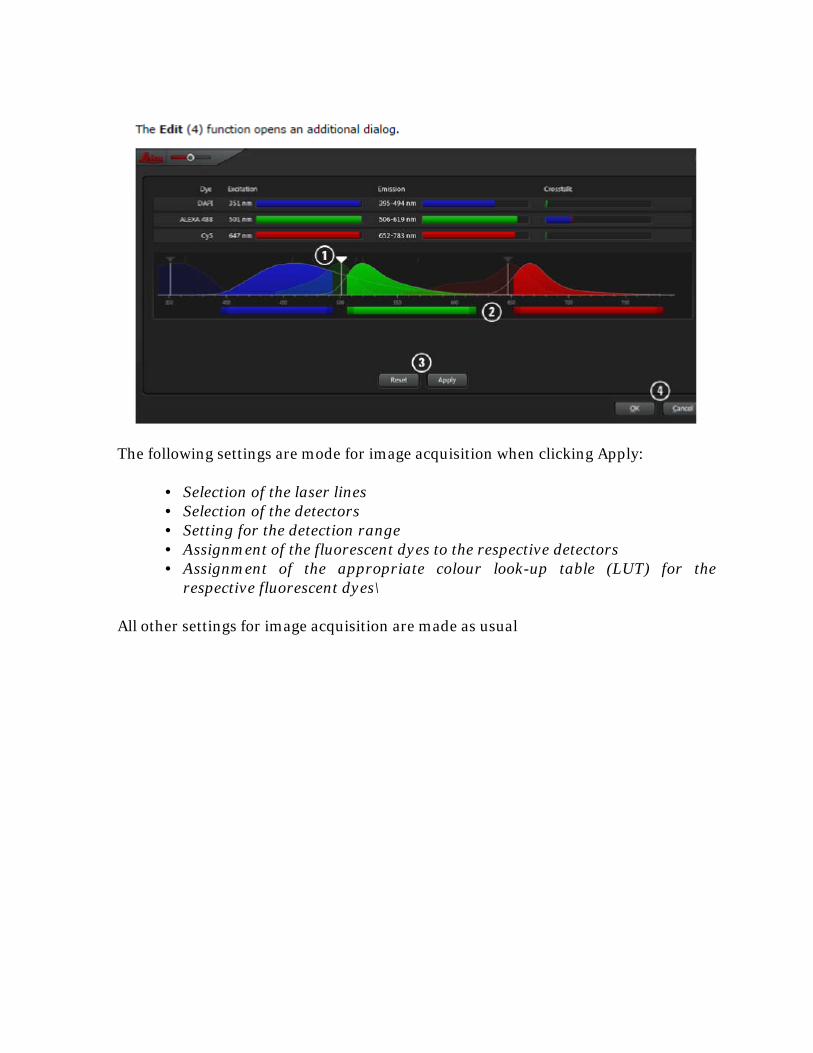
The following settings are mode for image acquisition when clicking Apply:
• Selection of the laser lines• Selection of the detectors• Setting for the detection range• Assignment of the fluorescent dyes to the respective detectors• Assignment of the appropriate colour look-up table (LUT) for the
respective fluorescent dyes\
All other settings for image acquisition are made as usual
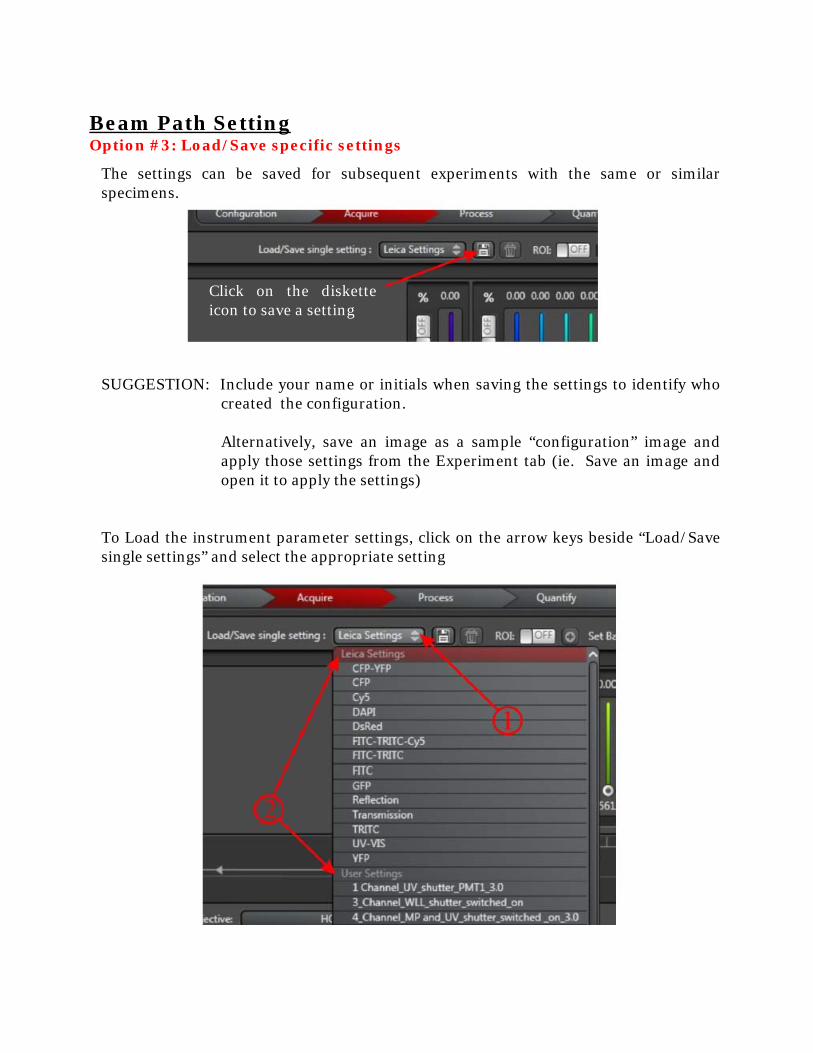
Beam Path SettingOption #3: Load/Save specific settings
The settings can be saved for subsequent experiments with the same or similarspecimens.
SUGGESTION: Include your name or initials when saving the settings to identify whocreated the configuration.
Alternatively, save an image as a sample “configuration” image andapply those settings from the Experiment tab (ie. Save an image andopen it to apply the settings)
To Load the instrument parameter settings, click on the arrow keys beside “Load/Savesingle settings” and select the appropriate setting
Click on the disketteicon to save a setting
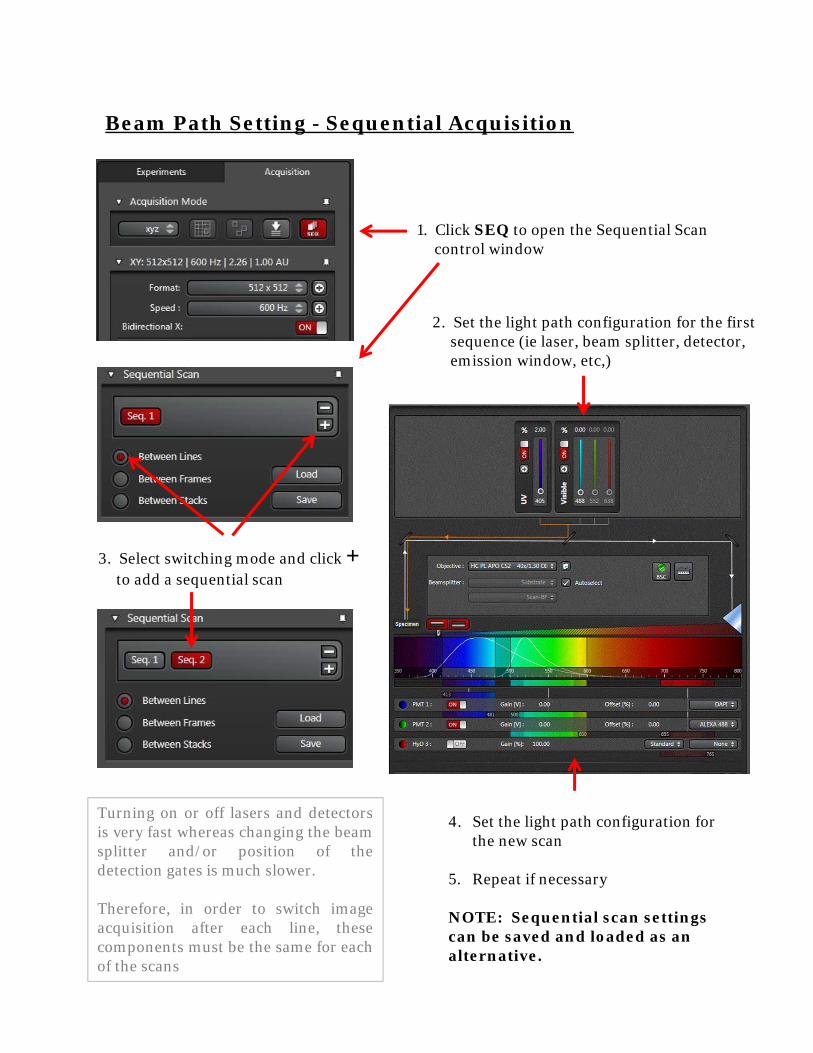
Beam Path Setting - Sequential Acquisition
1. Click SEQ to open the Sequential Scan control window
2. Set the light path configuration for the first sequence (ie laser, beam splitter, detector, emission window, etc,)
3. Select switching mode and click +to add a sequential scan
4. Set the light path configuration for the new scan
5. Repeat if necessary
NOTE: Sequential scan settings can be saved and loaded as an alternative.
Turning on or off lasers and detectorsis very fast whereas changing the beamsplitter and/or position of thedetection gates is much slower.
Therefore, in order to switch imageacquisition after each line, thesecomponents must be the same for eachof the scans


Acquisition Parameters
Format or # of pixels in the image(start with 512 x 512)
Scan Speed (start with 400-600 Hz)
Option for bidirectional for ~2x faster acquisition (may need to adjust phase)
Adjust zoom factor various ways by: • Adjusting slider• Entering specific zoom factor• Activating the Zoom In and drawing
a ROI in image• Zoom knob on Control Panel
The Image Size and Pixel Size will change accordingly as the Format and/or Zoom Factor is adjusted
Select Optimize xy Format to set the optimal # of pixels correctly over-sample (resolution depends on NA of objective)
Set Average and/or Accumulation
NOTE: Averaging removes noise and in general, less averaging is required with a lower gain setting for the detectors.
The HyDs have very little, if any, noise and therefore requires less averaging than the PMTs.
Rotate image if necessary(Optical rotation)
Panning to position specimen in image window
The pinhole will automatically default to 1 Airy unit (optimal) and will adjust accordingly with the different objectives.
The diameter can be be adjusted manually with the slider (or control panel)

1. Select xyz as the Acquisition Mode
2. Use the Control Panel to move the focus position to beginning position of the stack
3. Click Begin to set the start position
4. Use the Control Panel or the SmartMoveto move the focus position to the end position of the stack and click End
5. Select Z-Wide to indicate the focus drive of the microscope stage will be used to control z position during the stack.
Note: Z-Galvo refers to Z-control through a Super Z Galvo Focusing stage, which in not configured with the particular system.
6. Zoom in to help visualize the schematic representation of the z stack
Acquisition Modes:
Z Stack (xyz)
Select the appropriate Acquisition Mode• xyz – single image or z-stack• xzy – xz image • xyt – time series• xyzt -- z-stack and time series• xy – lambda scan
7. Manually define the number of images of a z-stack (Nr. of steps) and the distance between the images (z-step size), or have them optimized automatically (System Optimized).
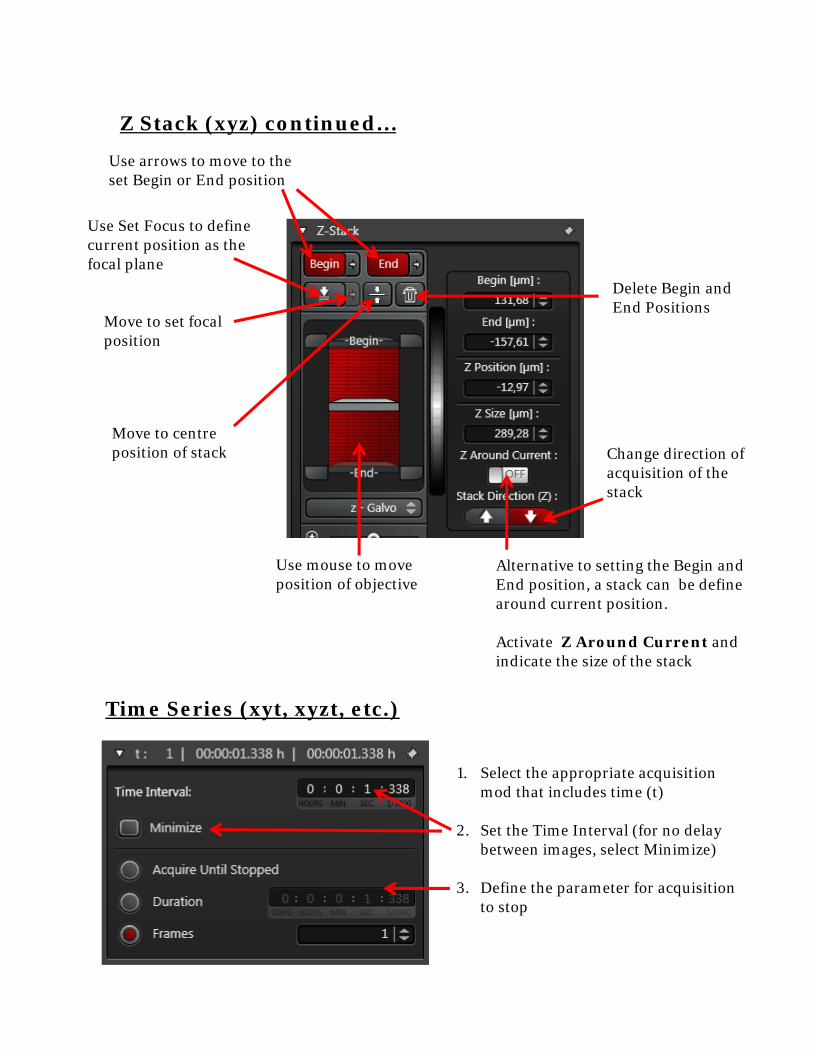
Z Stack (xyz) continued…
Use arrows to move to the set Begin or End position
Delete Begin and End Positions
Use Set Focus to define current position as the focal plane
Move to set focal position
Move to centre position of stack
Use mouse to move position of objective
Alternative to setting the Begin and End position, a stack can be define around current position.
Activate Z Around Current and indicate the size of the stack
Change direction of acquisition of the stack
Time Series (xyt, xyzt, etc.)
1. Select the appropriate acquisition mod that includes time (t)
2. Set the Time Interval (for no delay between images, select Minimize)
3. Define the parameter for acquisition to stop
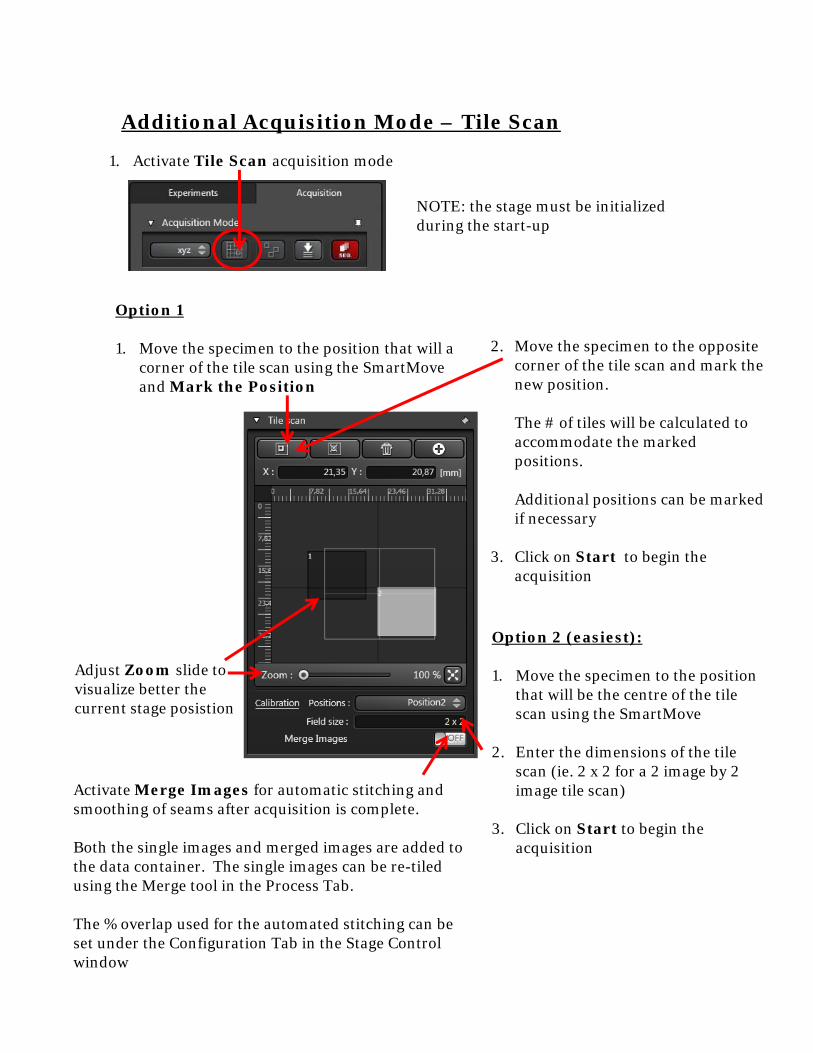
Additional Acquisition Mode – Tile Scan
1. Activate Tile Scan acquisition mode
NOTE: the stage must be initialized during the start-up
Adjust Zoom slide to visualize better the current stage posistion
Option 2 (easiest):
1. Move the specimen to the position that will be the centre of the tile scan using the SmartMove
2. Enter the dimensions of the tile scan (ie. 2 x 2 for a 2 image by 2 image tile scan)
3. Click on Start to begin the acquisition
Option 1
1. Move the specimen to the position that will a corner of the tile scan using the SmartMove and Mark the Position
2. Move the specimen to the opposite corner of the tile scan and mark the new position.
The # of tiles will be calculated to accommodate the marked positions.
Additional positions can be marked if necessary
3. Click on Start to begin the acquisition
Activate Merge Images for automatic stitching and smoothing of seams after acquisition is complete.
Both the single images and merged images are added to the data container. The single images can be re-tiled using the Merge tool in the Process Tab.
The % overlap used for the automated stitching can be set under the Configuration Tab in the Stage Control window
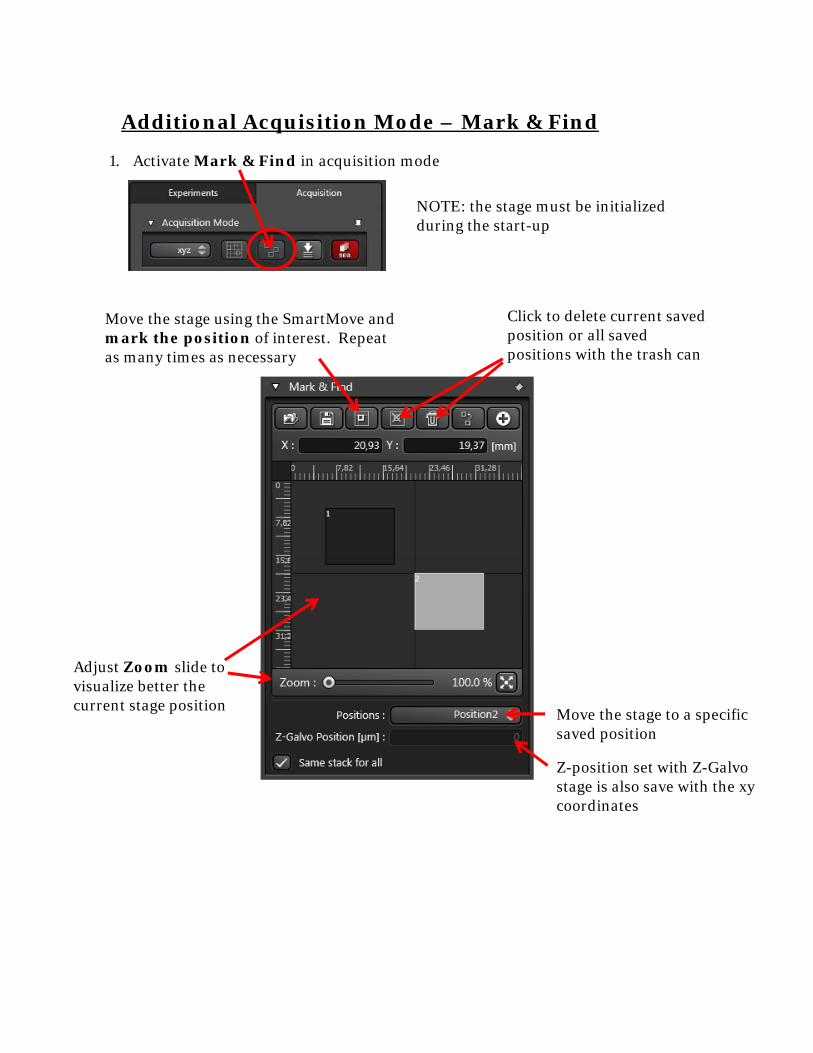
Additional Acquisition Mode – Mark & Find
1. Activate Mark & Find in acquisition mode
NOTE: the stage must be initialized during the start-up
Move the stage using the SmartMove and mark the position of interest. Repeat as many times as necessary
Adjust Zoom slide to visualize better the current stage position
Click to delete current saved position or all saved positions with the trash can
Move the stage to a specific saved position
Z-position set with Z-Galvo stage is also save with the xy coordinates
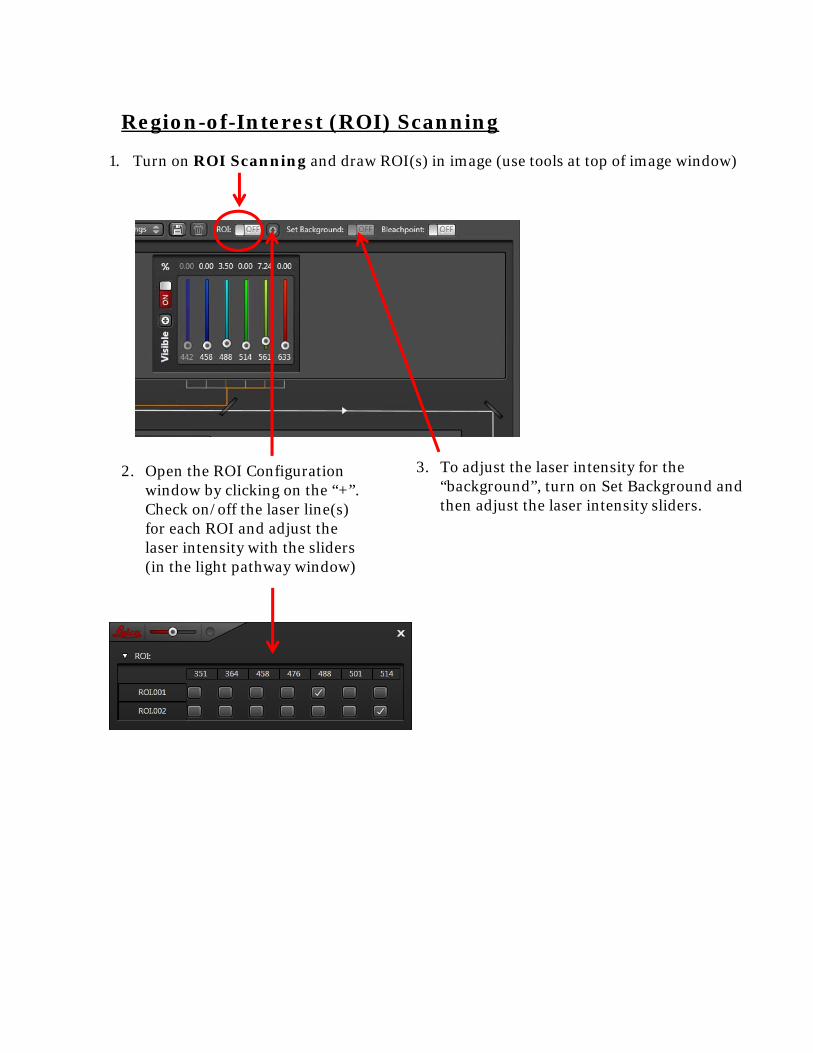
Region-of-Interest (ROI) Scanning
1. Turn on ROI Scanning and draw ROI(s) in image (use tools at top of image window)
2. Open the ROI Configuration window by clicking on the “+”. Check on/off the laser line(s) for each ROI and adjust the laser intensity with the sliders (in the light pathway window)
3. To adjust the laser intensity for the “background”, turn on Set Background and then adjust the laser intensity sliders.

Transmitted Light Image – Brightfield or DIC
Go to the following link for a tutorial on the basic concepts of DIC
http://www.leica-microsystems.com/science-lab/differential-interference-contrast/
1. Ensure Koehler Illumination of the microscope is set correctly
http://www.leica-microsystems.com/science-lab/koehler-illumination/
2. Activate a laser line
3. Turn on Transmitted PMT and select Scan-BF or Scan-DIC
4. Move the appropriate DIC optics (condenser prism, objective prism and polarizer)
Please refer to the DIC with the DMi8 CEL stand for a detailed description.
4. Adjust Gain of detector

Right Click on an image for more options
Experiment/Project Tree – Saving Images

Additional Information - Spectral (SP) Detection System
This particular system has 3 separate internal detectors for confocal imaging
The Leica TCS SP8 does not use emission filters to define the wavelengths of emissioncollected, but rather utilizes a prism-based approach.
The wavelengths of emission are dispersed across the entire visible spectrum and eachdetector has a set of gates that are positioned and width adjusted to collect the desiredwavelengths.
PMT
PMTPMT
PMT
Emission from the specimen is dispersed
by a prism
Sliders are adjusted to determine the wavelengths of the emission collected in each
of the detection channels
EMISSION
1
2
3

Optimize the pixel size to for optimal resolution by adjusting the zoom and format (#pixels) of the image
Requires a sampling frequency of at least 2x-3x the highest spatial frequency to accurately preserve the spatial resolution in the resulting digital image
Too few pixels – pixel size is too large for maximal resolutionToo many pixels – oversampling does not add spatial resolutionOptimal # of pixels – 2-3x the resolution limit
Optimizing Pixel Format (Resolution)
Since the PSF for confocal is ~30%smaller due to the pinhole and thefollowing formula applies