LEHIGH VALLEY ENHANCED BUS/BRT STUDY · LEHIGH VALLEY ENHANCED BUS/BRT STUDY Executive Summary -...
30
Prepared for: Lehigh and Northampton Transportation Authority Prepared by: AECOM HDR Engineering Taggart Associates MARCH 3, 2014 Executive Summary LEHIGH VALLEY ENHANCED BUS/BRT STUDY
Transcript of LEHIGH VALLEY ENHANCED BUS/BRT STUDY · LEHIGH VALLEY ENHANCED BUS/BRT STUDY Executive Summary -...

Prepared for:
Lehigh and Northampton
Transportation Authority
Prepared by:
AECOM
HDR Engineering
Taggart Associates
MARCH 3, 2014
Executive Summary
LEHIGH VALLEY ENHANCED BUS/BRT STUDY
LEHIGH VALLEY ENHANCED BUS/BRT STUDY Executive Summary - March 2014
2
EXECUTIVE SUMMARY
Moving LANTA Forward
On August 29, 2011, the Lehigh and Northampton Transportation Authority (LANta) implemented a fully re-designed
route network, a key component of Moving LANTA Forward, a twelve-year strategic vision for public transportation in
the Lehigh Valley. Moving LANTA Forward was completed in accordance with both the bi-county Comprehensive
Plan – The Lehigh Valley 2030, which prioritized congestion reduction, suburban growth management, establishment
of a link between land use and transportation decisions, revitalization of urban centers and preservation of
agricultural land, and the LANTA Strategic Plan 2004-2015, which established a part of LANta’s mission to “support
desired economic and environmental goals”. The Service Plan of Moving LANTA Forward included four elements:
1. Core Service Improvement Plan;
2. Service Coverage Expansion Plan;
3. Enhanced Bus/Bus Rapid Transit Plan; and
4. Rail Modes Planning.
To further the planning of element 3, the Enhanced Bus/Bus Rapid Transit Plan, LANta commissioned this study,
which includes the preparation of a conceptual enhanced bus/bus rapid transit service plan, identification of regional
goals and objectives for the service, analysis of demand and potential benefits within each corridor, identification of a
“trunk” corridor or corridors, development of a conceptual design plan for the corridor(s), and a final implementation
plan which together may be considered as an application to the FTA for the Very Small Starts program.
GOALS AND OBJECTIVES OF ENHANCED BUS SERVICE
The Problem Statement
The following are the goals and objectives of enhanced bus service (EBS) in the Lehigh Valley, as determined by the
study team with input from the LANta Board and the Study Advisory Committee. Input from the series of public
meetings was also considered and incorporated. The broad program goals for the development of Enhanced Bus
Service in the Lehigh Valley include:
Benefit current riders;
Expand the transit market – attract new and choice riders;
Promote revitalization of the Valley’s urban core;
Maximize productivity (riders per hour); and
Be financially feasible.
In accordance with these goals, all potential enhanced bus corridors were evaluated utilizing the aforementioned
criteria to identify a recommended implementation corridor for more detailed planning. It was also recognized that the
Problem Statement this study would therefore address is:
In response to growth in population and vehicle traffic in the Lehigh Valley, implementation of Enhanced Bus
Service would encourage sustainable growth and revitalization of the region’s urban cores as well as growth
LEHIGH VALLEY ENHANCED BUS/BRT STUDY Executive Summary - March 2014
3
in transit use rather than private vehicle use.
Documents
In addition to this Executive Summary, the Lehigh Valley Enhanced Bus/BRT Study includes five technical
memoranda as follows:
Technical Memorandum 1: Kickoff Meeting Summary Memo
Technical Memorandum 2: Public Involvement Plan
Technical Memorandum 3: Transportation Setting and Data Collection
Technical Memorandum 4: Conceptual Service Plan
Technical Memorandum 5: Conceptual Design
Corridor Selection Process
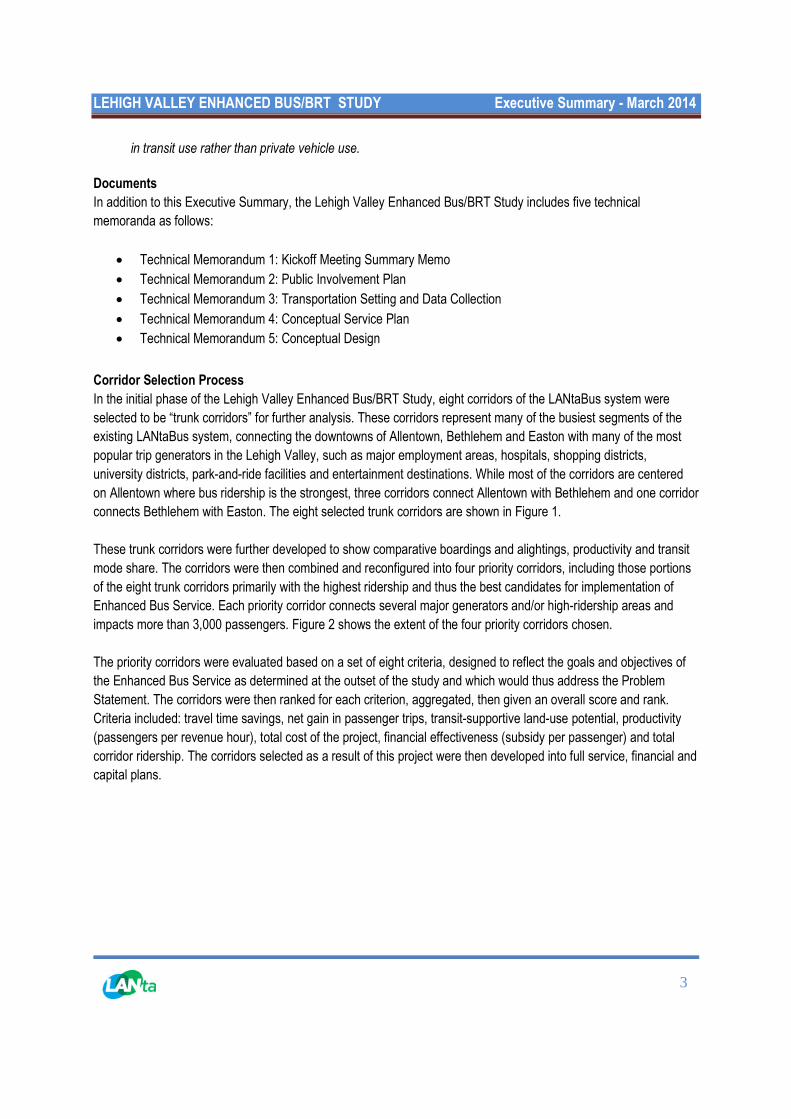
In the initial phase of the Lehigh Valley Enhanced Bus/BRT Study, eight corridors of the LANtaBus system were
selected to be “trunk corridors” for further analysis. These corridors represent many of the busiest segments of the
existing LANtaBus system, connecting the downtowns of Allentown, Bethlehem and Easton with many of the most
popular trip generators in the Lehigh Valley, such as major employment areas, hospitals, shopping districts,
university districts, park-and-ride facilities and entertainment destinations. While most of the corridors are centered
on Allentown where bus ridership is the strongest, three corridors connect Allentown with Bethlehem and one corridor
connects Bethlehem with Easton. The eight selected trunk corridors are shown in Figure 1.
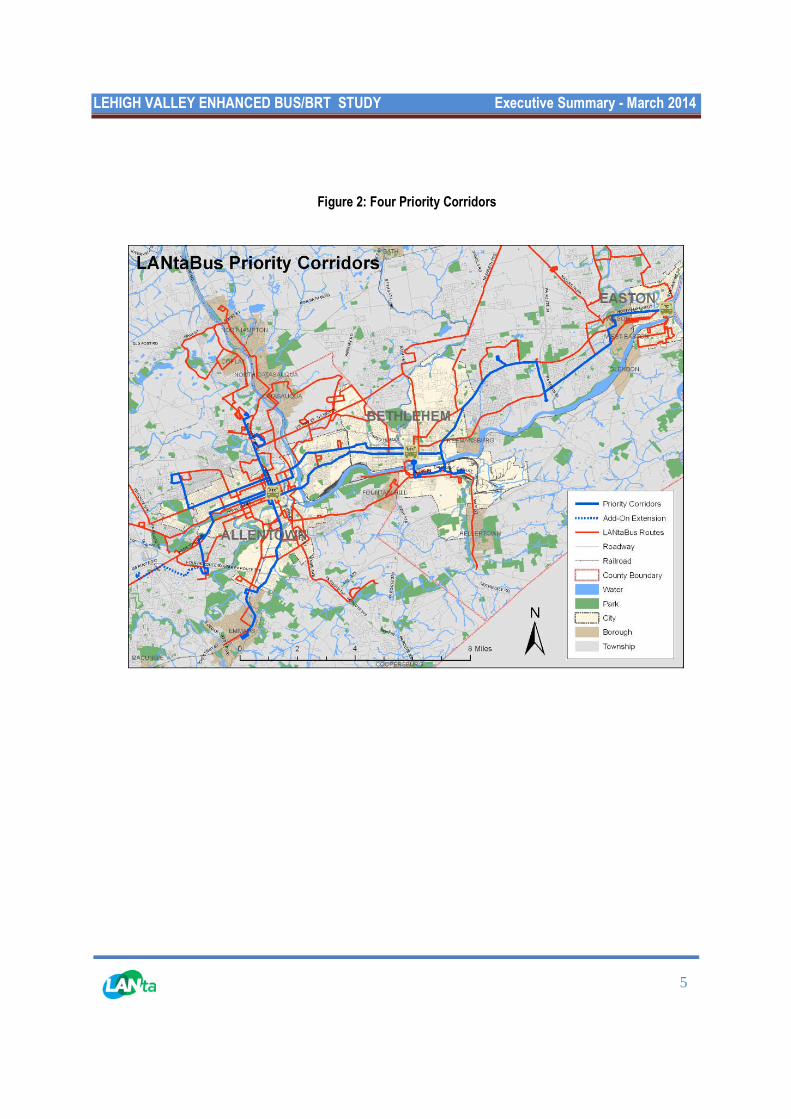
These trunk corridors were further developed to show comparative boardings and alightings, productivity and transit
mode share. The corridors were then combined and reconfigured into four priority corridors, including those portions
of the eight trunk corridors primarily with the highest ridership and thus the best candidates for implementation of
Enhanced Bus Service. Each priority corridor connects several major generators and/or high-ridership areas and
impacts more than 3,000 passengers. Figure 2 shows the extent of the four priority corridors chosen.
The priority corridors were evaluated based on a set of eight criteria, designed to reflect the goals and objectives of
the Enhanced Bus Service as determined at the outset of the study and which would thus address the Problem
Statement. The corridors were then ranked for each criterion, aggregated, then given an overall score and rank.
Criteria included: travel time savings, net gain in passenger trips, transit-supportive land-use potential, productivity
(passengers per revenue hour), total cost of the project, financial effectiveness (subsidy per passenger) and total
corridor ridership. The corridors selected as a result of this project were then developed into full service, financial and
capital plans.
LEHIGH VALLEY ENHANCED BUS/BRT STUDY Executive Summary - March 2014
4
Figure 1: Initial Eight Trunk Corridors
LEHIGH VALLEY ENHANCED BUS/BRT STUDY Executive Summary - March 2014
5
Figure 2: Four Priority Corridors
LEHIGH VALLEY ENHANCED BUS/BRT STUDY Executive Summary - March 2014
6
Public Involvement
A public involvement plan enriches the planning process by obtaining key input from key community members and
stakeholders in a project. The public involvement process for this study was broken down into four major
components:
1) Advisory Committee Meetings – A project Advisory Committee was assembled early on in the study,
comprised of representatives from LANta, the Lehigh Valley Planning Commission, PennDOT, the local
municipalities, and leaders of key stakeholder groups. Six meetings were held where the Consultant Team
and LANta staff presented to the Advisory Committee and answered questions and obtained input.
2) Board Workshops – Three workshops were held with the consultant team, LANta staff and the LANta
Board in order to provide the Board with an opportunity to comment and provide guidance to the consultant
team.
3) Public Open Houses – Approximately midway through and again near the end of the study Public Open
Houses were held in Allentown, Bethlehem and Easton in order to provide an opportunity for the public to
comment on the initial ideas (first round of meetings) and proposals (second round of meetings) presented by
the study team.
4) Stakeholder Meetings – After the initial plans for the recommended EBS corridors had been developed,
the study team consulted with representatives from the Cities of Allentown, Bethlehem and Easton, as well as
Whitehall Township and PennDOT, to determine the feasibility of the recommended improvements and
Enhanced Bus treatments along each corridor.
Selected Corridors
Upon review of the Priority Corridors, it was determined that an amalgamation of the some of the strongest corridors
would provide service to many of the Lehigh Valley’s densest neighborhoods and most heavily used stops/popular
destinations. A recommended Enhanced Bus Service (EBS) “system” was developed, consisting of two routes that
serve the densest portions of the Lehigh Valley—both with respect to land use and to ridership—as well as link the
Valley’s three cities. This system would be implemented in phases, which are further outlined in Technical
Memorandum 5: Conceptual Design and included in the final project report.
The recommended EBS “system” includes two routes, which for the purposes of this study will be referred to as “EBS
1” and “EBS 2”, with official names to be determined by LANta upon development of branding for the system. EBS 1
would span between the Walmart on MacArthur Road in Whitehall Township and the Lehigh Valley Industrial Park
(LVIP) VII on PA 412 in South Bethlehem, via MacArthur Road and the 6th/7th Street Couplet (PA 145), Hamilton
Street, Hanover Avenue, West Broad Street, New Street, 4th/3rd Streets in South Bethlehem, and Daly Avenue. EBS
2 would span between Muhlenberg College in Allentown and the planned Easton Intermodal Transportation Center in
Easton roughly via the Chew/Turner Street couplet, Hamilton Street, Hanover Avenue, West Broad Street, New
Street, 4th/3rd Streets in South Bethlehem, the Minsi Trail Bridge, Stefko Boulevard, Easton Avenue, Emrick
Boulevard, Freemansburg Avenue, 25th Street, and Northampton Street.
LEHIGH VALLEY ENHANCED BUS/BRT STUDY Executive Summary - March 2014
7
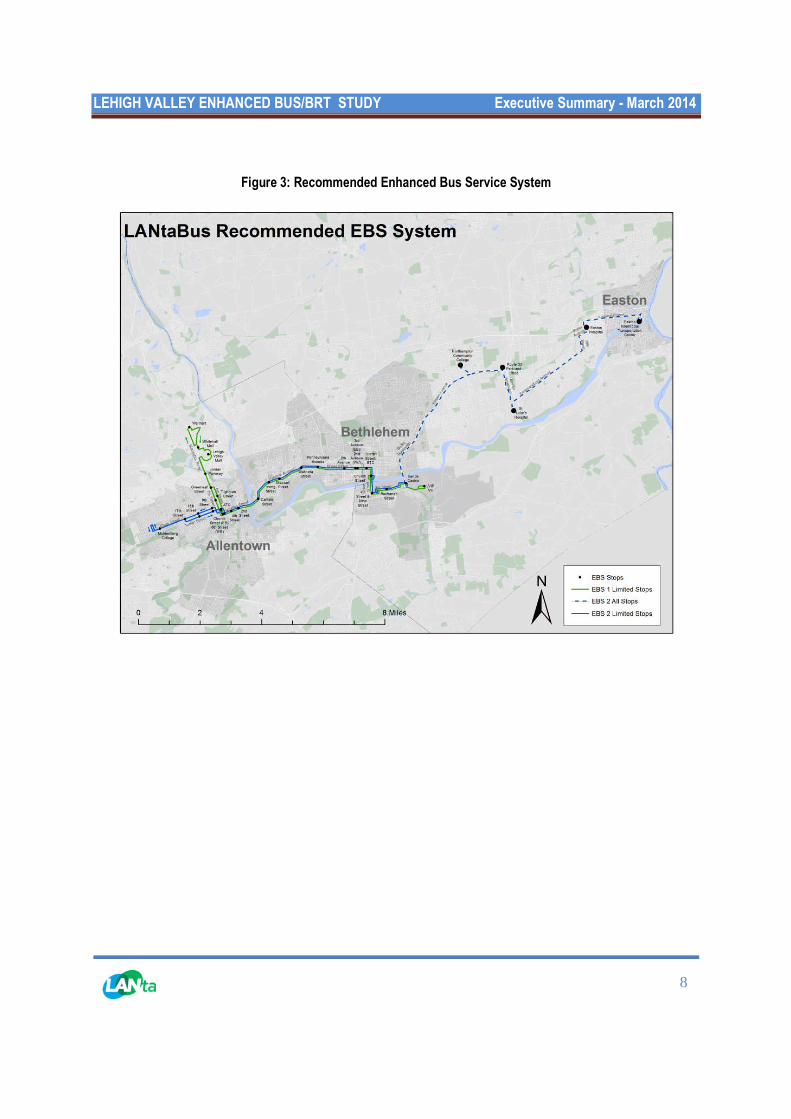
Figure 3 shows the recommended system as of Phase III of implementation (please refer to Technical Memorandum
5 and/or the final project report for the specifics of each phase), when service would be extended from South
Bethlehem to Easton. The two EBS routes would operate as “limited-stop” services throughout much of the Lehigh
Valley, meaning that they would stop approximately every half mile (rather than every two blocks) in order to help
reduce travel times. However, EBS 2 east of the Sands Casino would initially operate as a local service, serving all
stops, to be upgraded to limited-stop service in the future if demand warrants.
Transit Service Plan
The recommended EBS system includes two routes, which are designed to be as convenient and reliable as
possible, as well as to serve the portions of the Lehigh Valley with the greatest demand for bus service. “Convenient”,
in this case, refers to service operating seven days per week, as frequently as possible given existing and potential
ridership, and for a maximum possible span of service. Thus, service on both proposed EBS routes would operate
seven days per week, on approximately the longest span of service of LANtaBus’s existing routes, from 5:00 AM to
11:00 PM on weekdays, 6:00 AM to 11:00 PM on Saturdays, and 10:00 AM to 6:00 PM on Sundays. Depending on
the initial popularity of EBS 1, service might be extended to operate until midnight; however, for the purposes of this
report, it will be assumed that service will operate until 11:00 PM.
On weekdays, EBS 1 would operate every 15 minutes during the peak periods, every 20 minutes off-peak, and every
60 minutes in the evening. EBS 2 would operate every 30 minutes during the peak, and every 60 minutes off-peak
and during the evening. The combined frequency along segment common to both EBS 1 and EBS 2 (between the
ATC and the Sands Casino) would be every 10 minutes during the peak periods, every 15 minutes off-peak, and
every 30 minutes in the evening. It should be noted that these frequencies would not be achieved at the initial
implementation of service on EBS 1 and EBS 2—the routes would initially implemented at lower frequencies, then
service would be increased in latter phases. At full build-out, the aforementioned span and frequencies would imply
54 trips per weekday in each direction on EBS 1 and 24 trips per weekday in each direction on EBS 2 (total of 78
weekday round-trips).
Also during the full build-out phase, on Saturdays service on EBS 1 would operate every 20 minutes between 8:00
AM and 6:00 PM, and hourly in the morning and evening; service on EBS 2 would operate every 60 minutes all day.
On Sundays, service on EBS 1 would operate every 20 minutes, with service on EBS 2 every 60 minutes.
LEHIGH VALLEY ENHANCED BUS/BRT STUDY Executive Summary - March 2014
8
Figure 3: Recommended Enhanced Bus Service System
LEHIGH VALLEY ENHANCED BUS/BRT STUDY Executive Summary - March 2014
9
Phasing
Implementation of the full Enhanced Bus System at once would be an expensive proposition, requiring a large
amount of capital expenditure on new vehicles and priority treatments, as well as a large increase in operating costs
all at once. Therefore, in order to create more financially feasible changes, as well as to encourage steady ridership
growth, implementation is broken out into six phases. Each phase would last approximately one to two years,
allowing LANta service planners the ability to analyze impacts incrementally. Subsequent phases would only be
implemented when resources are available.
Modifications to existing local LANtaBus routes will occur throughout the plan’s implementation. These modifications
were designed to minimize the number of stops at which the frequency of service would be reduced, as well as to
avoid the occurrence where existing riders lose service. Modifications were tailored to demand levels, focusing
resources where they are most needed as possible while continuing to maximize coverage of the LANtaBus service
area.
Phase I would commence as resources become available. For additional information on Phasing, please refer to
Technical Memorandum 5: Conceptual Design or the final project report. Phasing of the EBS system can be summed
up as follows:
Phase I represents the “Minimum Operable Segment”, as determined by the study team. This phase would
include local service along the EBS 1 alignment (to be named “Route 100”) between the Walmart in Whitehall
Township and LVIP VII in South Bethlehem. This service would provide improved connections between
Whitehall Township, Center City Allentown, Bethlehem and South Bethlehem. Adjustments would be made to
local routes in Allentown, Bethlehem and Whitehall Township during this phase.
TSM (Transportation Systems Management) represents a less-resource-intensive alternative to the full build-
out of the EBS system. The TSM for this study would include the implementation of Route 100 and all
improvements included in Phase I, as well as modifications to local LANtaBus services on Routes 101, 107 and
108 to improve connections between Allentown, South Bethlehem and Easton.
Phase II would include upgrades to Route 100 to Enhanced Bus (EBS 1) service, as well as implementation of
bus priority treatments along the EBS 1 corridor.
Phase III would include the implementation of service on EBS 2, and additional priority bus treatments along the
EBS 2 corridor in Allentown. This phase also includes the restructuring of local bus service between Bethlehem
and Easton, and construction of bus lanes immediately adjacent to the Allentown Transportation Center.
Phase IV would include frequency improvements on EBS 1 and EBS 2, reaching full build-out of the system in
terms of both coverage and level of service.
Phase V would include the upgrade of EBS 2 service within the City of Easton and Wilson Borough (east of
Easton Hospital), including limited-stop service and the implementation of bus priority treatments, as well as
improved frequency of service on Route 106 in Easton.
Phase VI would include an upgrade to limited-stop service along EBS 2 between the Sands Casino and Easton
Hospital. At this time, Route 101 would be re-instated to serve as an underlying local service for EBS 2 east of
the Bethlehem Transportation Center.
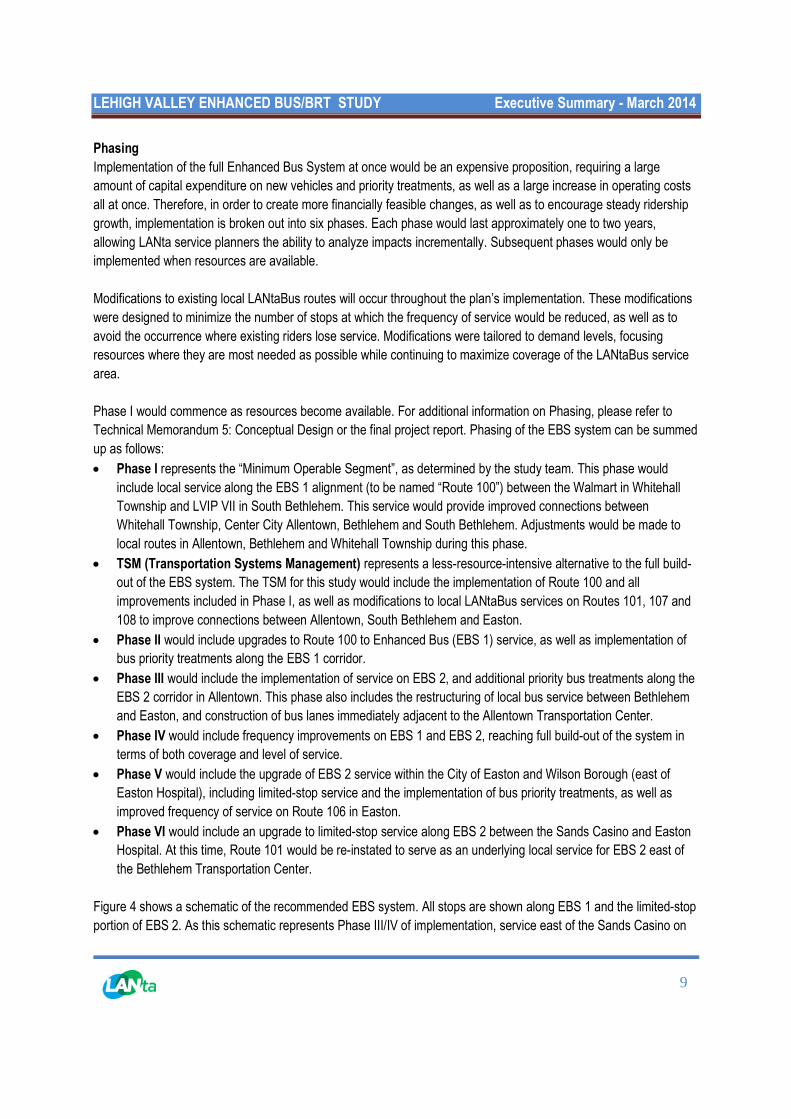
Figure 4 shows a schematic of the recommended EBS system. All stops are shown along EBS 1 and the limited-stop
portion of EBS 2. As this schematic represents Phase III/IV of implementation, service east of the Sands Casino on
LEHIGH VALLEY ENHANCED BUS/BRT STUDY Executive Summary - March 2014
10
EBS 2 is shown as local service. Along that segment, only a few major stops are shown.
Figure 4: Schematic of Recommended Phase III/IV EBS System
LEHIGH VALLEY ENHANCED BUS/BRT STUDY Executive Summary - March 2014
11
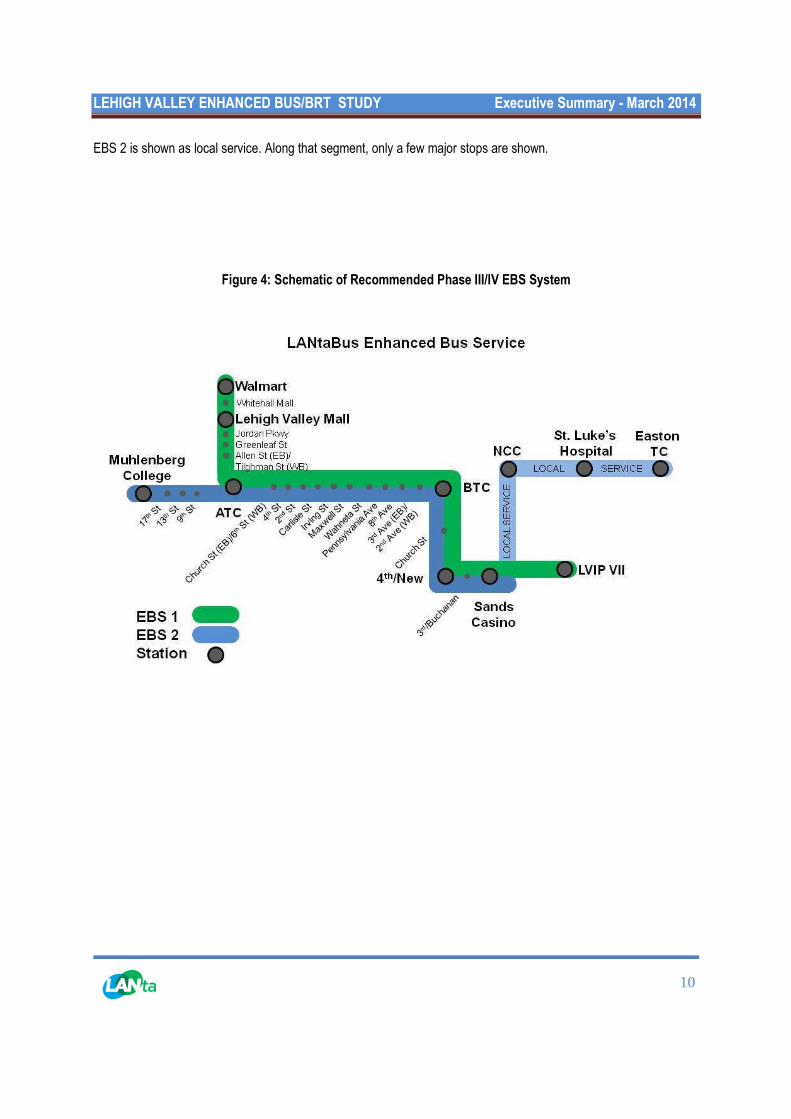
Running Way Treatments
Running way treatments adjust the streetscape to be more accommodating to bus service, either by improving the
pedestrian environment or by allowing buses to more easily or more quickly navigate the route, thus improving
overall reliability. The following running way treatments were considered for LANtaBus Enhanced Bus Service:
Off-Board Fare Collection – fare payment at machines prior to boarding
Moving Bus Stop Locations – moving local bus stops to locations that allow limited-stop buses to pass
Signal Optimization – adjustments to traffic signal phases to decrease travel times for buses
Transit Signal Priority (TSP) – signals that are triggered by proximate buses to stay green longer or
change to green sooner
Bus Lanes – lanes used exclusively by buses all or part of the day:
LEHIGH VALLEY ENHANCED BUS/BRT STUDY Executive Summary - March 2014
12
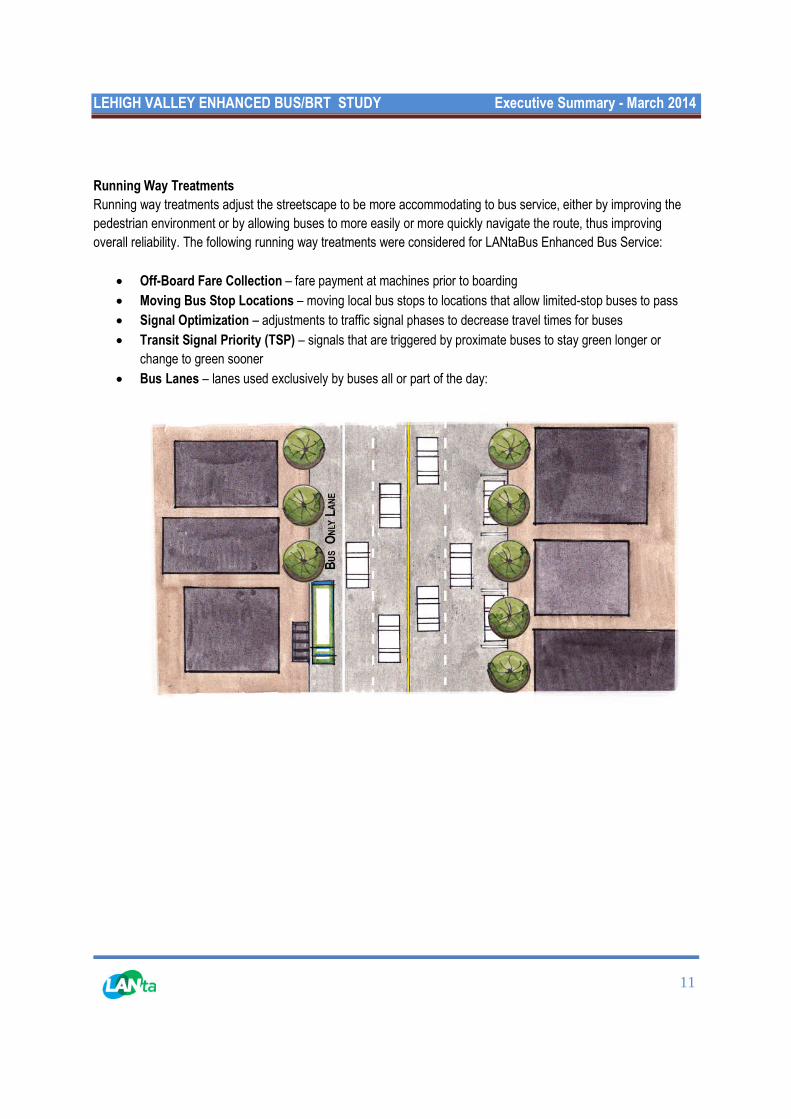
Queue Jumps – lanes/signals that allow buses to bypass traffic queued at signals:
LEHIGH VALLEY ENHANCED BUS/BRT STUDY Executive Summary - March 2014
13
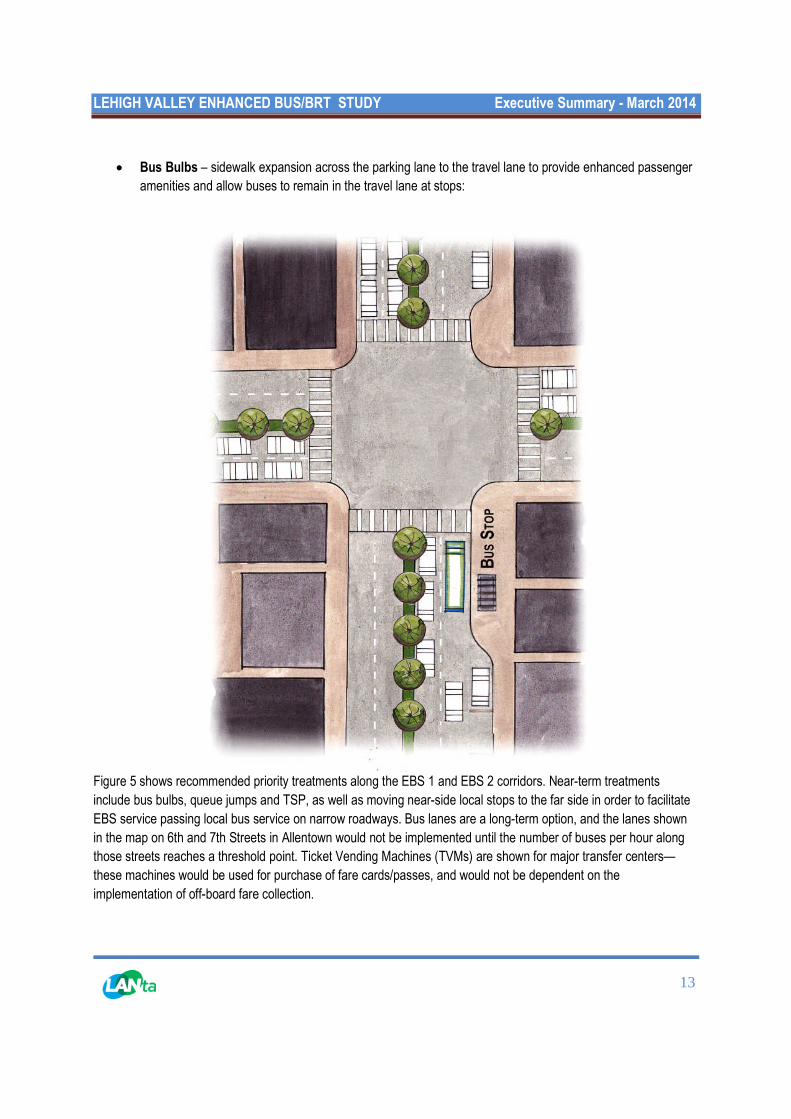
Bus Bulbs – sidewalk expansion across the parking lane to the travel lane to provide enhanced passenger
amenities and allow buses to remain in the travel lane at stops:
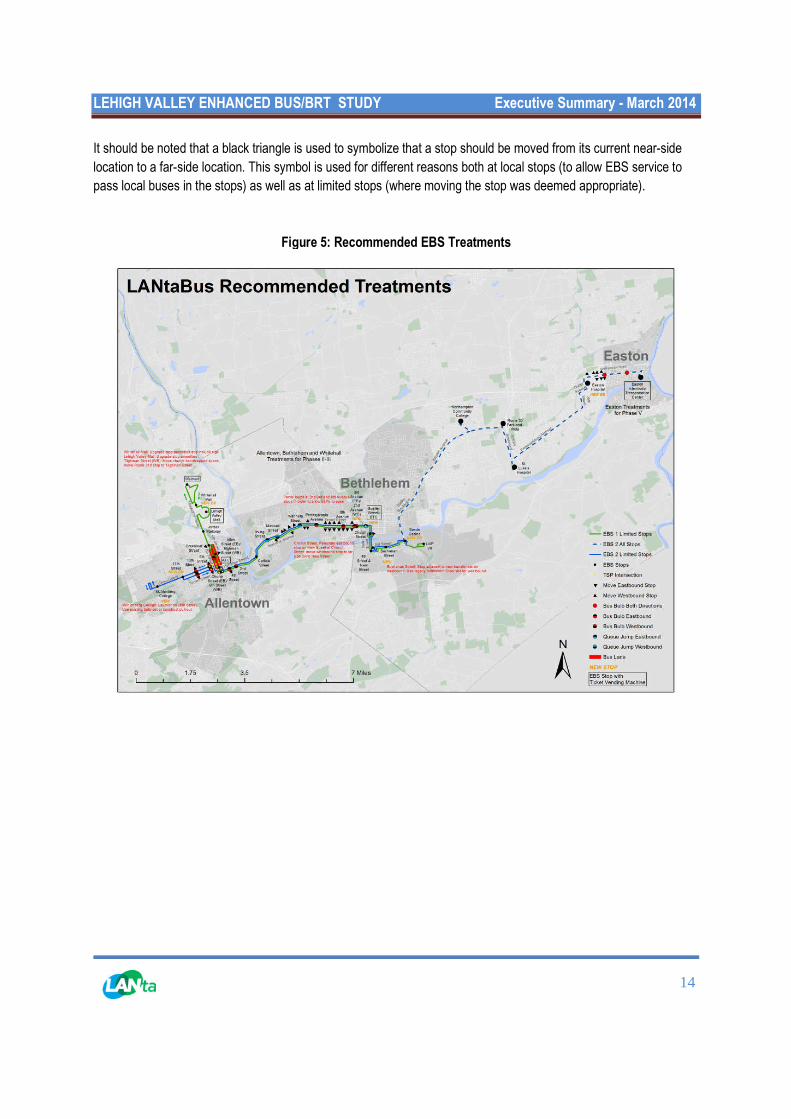
Figure 5 shows recommended priority treatments along the EBS 1 and EBS 2 corridors. Near-term treatments
include bus bulbs, queue jumps and TSP, as well as moving near-side local stops to the far side in order to facilitate
EBS service passing local bus service on narrow roadways. Bus lanes are a long-term option, and the lanes shown
in the map on 6th and 7th Streets in Allentown would not be implemented until the number of buses per hour along
those streets reaches a threshold point. Ticket Vending Machines (TVMs) are shown for major transfer centers—
these machines would be used for purchase of fare cards/passes, and would not be dependent on the
implementation of off-board fare collection.
LEHIGH VALLEY ENHANCED BUS/BRT STUDY Executive Summary - March 2014
14
It should be noted that a black triangle is used to symbolize that a stop should be moved from its current near-side
location to a far-side location. This symbol is used for different reasons both at local stops (to allow EBS service to
pass local buses in the stops) as well as at limited stops (where moving the stop was deemed appropriate).
Figure 5: Recommended EBS Treatments
LEHIGH VALLEY ENHANCED BUS/BRT STUDY Executive Summary - March 2014
15
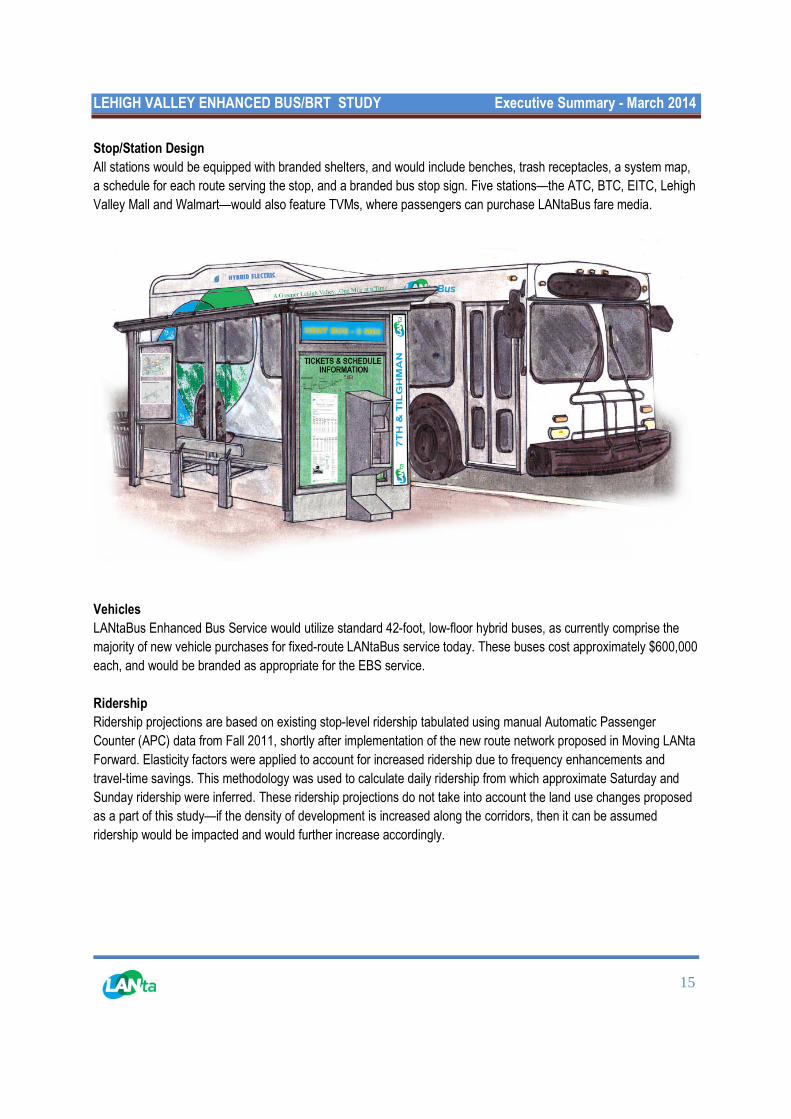
Stop/Station Design
All stations would be equipped with branded shelters, and would include benches, trash receptacles, a system map,
a schedule for each route serving the stop, and a branded bus stop sign. Five stations—the ATC, BTC, EITC, Lehigh
Valley Mall and Walmart—would also feature TVMs, where passengers can purchase LANtaBus fare media.
Vehicles
LANtaBus Enhanced Bus Service would utilize standard 42-foot, low-floor hybrid buses, as currently comprise the
majority of new vehicle purchases for fixed-route LANtaBus service today. These buses cost approximately $600,000
each, and would be branded as appropriate for the EBS service.
Ridership
Ridership projections are based on existing stop-level ridership tabulated using manual Automatic Passenger
Counter (APC) data from Fall 2011, shortly after implementation of the new route network proposed in Moving LANta
Forward. Elasticity factors were applied to account for increased ridership due to frequency enhancements and
travel-time savings. This methodology was used to calculate daily ridership from which approximate Saturday and
Sunday ridership were inferred. These ridership projections do not take into account the land use changes proposed
as a part of this study—if the density of development is increased along the corridors, then it can be assumed
ridership would be impacted and would further increase accordingly.
LEHIGH VALLEY ENHANCED BUS/BRT STUDY Executive Summary - March 2014
16
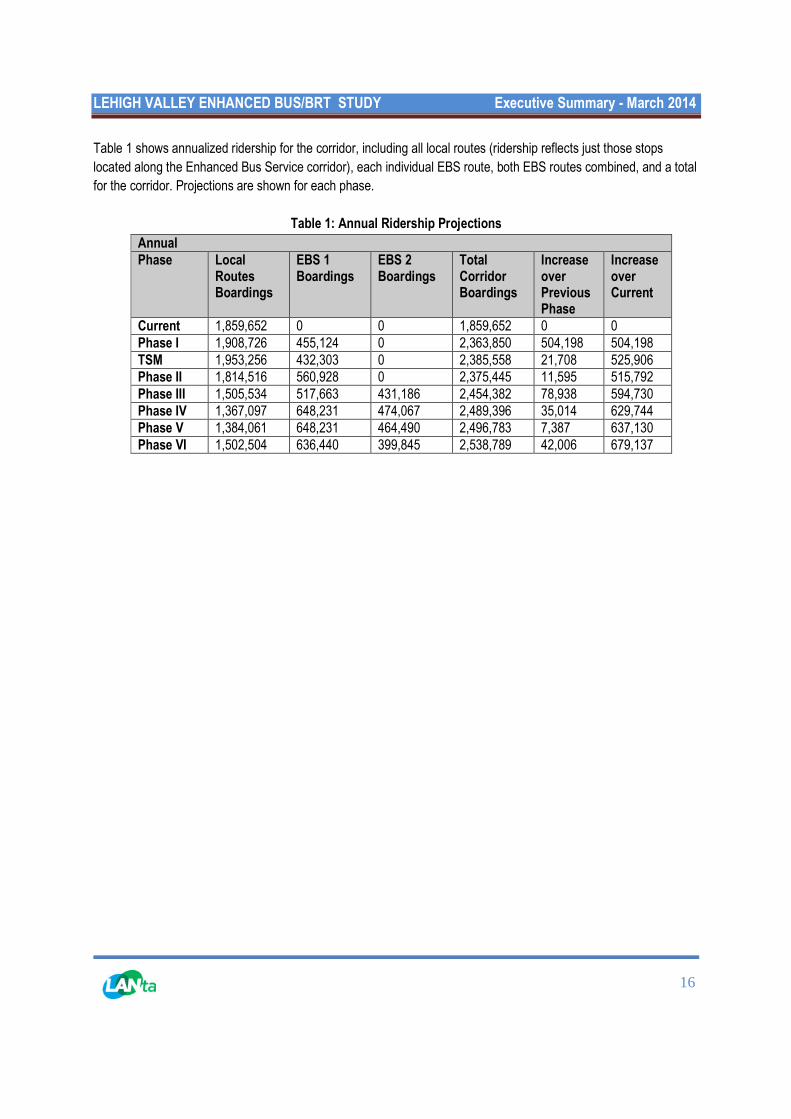
Table 1 shows annualized ridership for the corridor, including all local routes (ridership reflects just those stops
located along the Enhanced Bus Service corridor), each individual EBS route, both EBS routes combined, and a total
for the corridor. Projections are shown for each phase.
Table 1: Annual Ridership Projections
AnnualPhase Local
RoutesBoardings
EBS 1Boardings
EBS 2Boardings
TotalCorridorBoardings
IncreaseoverPreviousPhase
IncreaseoverCurrent
Current 1,859,652 0 0 1,859,652 0 0Phase I 1,908,726 455,124 0 2,363,850 504,198 504,198TSM 1,953,256 432,303 0 2,385,558 21,708 525,906Phase II 1,814,516 560,928 0 2,375,445 11,595 515,792Phase III 1,505,534 517,663 431,186 2,454,382 78,938 594,730Phase IV 1,367,097 648,231 474,067 2,489,396 35,014 629,744Phase V 1,384,061 648,231 464,490 2,496,783 7,387 637,130Phase VI 1,502,504 636,440 399,845 2,538,789 42,006 679,137
LEHIGH VALLEY ENHANCED BUS/BRT STUDY Executive Summary - March 2014
17
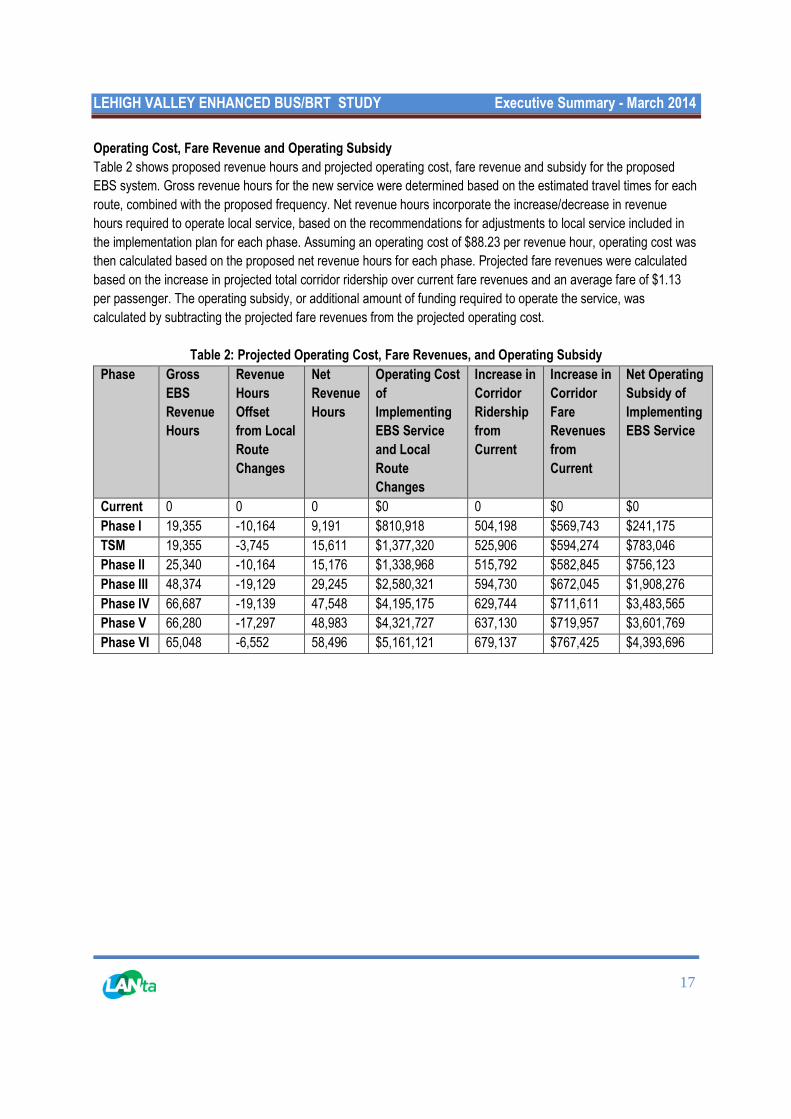
Operating Cost, Fare Revenue and Operating Subsidy
Table 2 shows proposed revenue hours and projected operating cost, fare revenue and subsidy for the proposed
EBS system. Gross revenue hours for the new service were determined based on the estimated travel times for each
route, combined with the proposed frequency. Net revenue hours incorporate the increase/decrease in revenue
hours required to operate local service, based on the recommendations for adjustments to local service included in
the implementation plan for each phase. Assuming an operating cost of $88.23 per revenue hour, operating cost was
then calculated based on the proposed net revenue hours for each phase. Projected fare revenues were calculated
based on the increase in projected total corridor ridership over current fare revenues and an average fare of $1.13
per passenger. The operating subsidy, or additional amount of funding required to operate the service, was
calculated by subtracting the projected fare revenues from the projected operating cost.
Table 2: Projected Operating Cost, Fare Revenues, and Operating Subsidy
Phase Gross
EBS
Revenue
Hours
Revenue
Hours
Offset
from Local
Route
Changes
Net
Revenue
Hours
Operating Cost
of
Implementing
EBS Service
and Local
Route
Changes
Increase in
Corridor
Ridership
from
Current
Increase in
Corridor
Fare
Revenues
from
Current
Net Operating
Subsidy of
Implementing
EBS Service
Current 0 0 0 $0 0 $0 $0
Phase I 19,355 -10,164 9,191 $810,918 504,198 $569,743 $241,175
TSM 19,355 -3,745 15,611 $1,377,320 525,906 $594,274 $783,046
Phase II 25,340 -10,164 15,176 $1,338,968 515,792 $582,845 $756,123
Phase III 48,374 -19,129 29,245 $2,580,321 594,730 $672,045 $1,908,276
Phase IV 66,687 -19,139 47,548 $4,195,175 629,744 $711,611 $3,483,565
Phase V 66,280 -17,297 48,983 $4,321,727 637,130 $719,957 $3,601,769
Phase VI 65,048 -6,552 58,496 $5,161,121 679,137 $767,425 $4,393,696
LEHIGH VALLEY ENHANCED BUS/BRT STUDY Executive Summary - March 2014
18
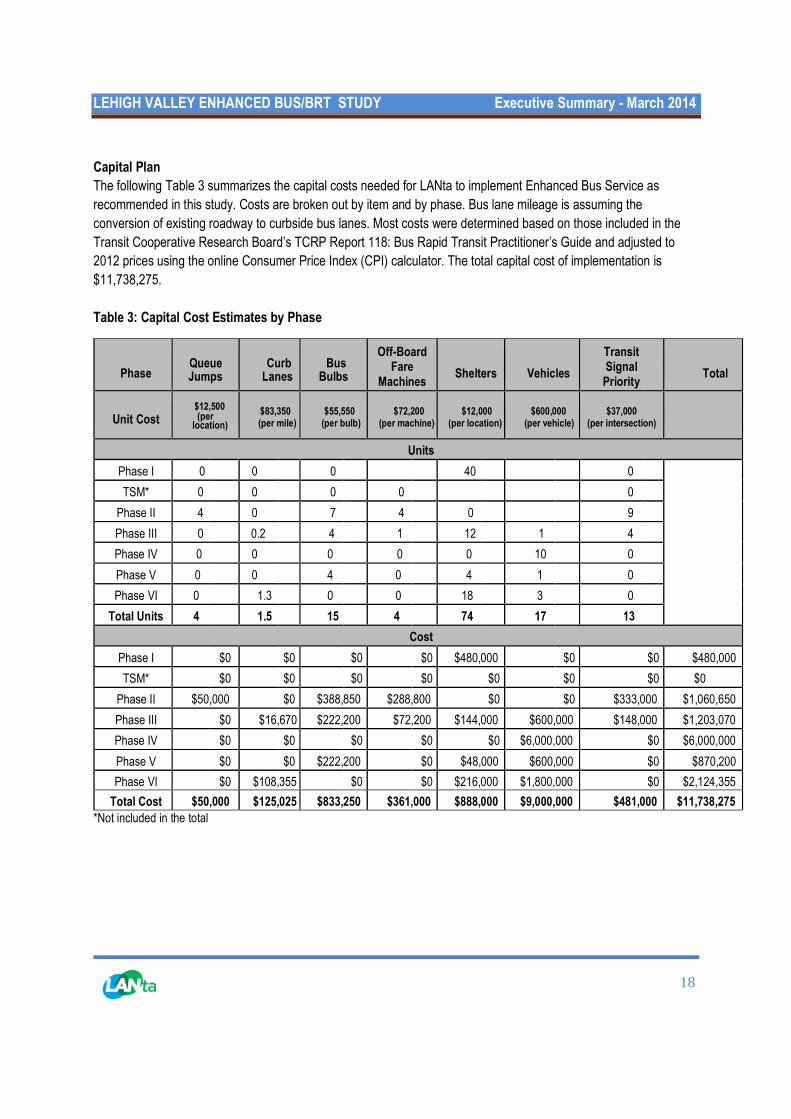
Capital Plan
The following Table 3 summarizes the capital costs needed for LANta to implement Enhanced Bus Service as
recommended in this study. Costs are broken out by item and by phase. Bus lane mileage is assuming the
conversion of existing roadway to curbside bus lanes. Most costs were determined based on those included in the
Transit Cooperative Research Board’s TCRP Report 118: Bus Rapid Transit Practitioner’s Guide and adjusted to
2012 prices using the online Consumer Price Index (CPI) calculator. The total capital cost of implementation is
$11,738,275.
Table 3: Capital Cost Estimates by Phase
*Not included in the total
PhaseQueueJumps
CurbLanes
BusBulbs
Off-BoardFare
MachinesShelters Vehicles
TransitSignalPriority
Total
Unit Cost$12,500(per
location)
$83,350(per mile)
$55,550(per bulb)
$72,200(per machine)
$12,000(per location)
$600,000(per vehicle)
$37,000(per intersection)
Units
Phase I 0 0 00
400
0
TSM* 0 0 0 00 0
0
Phase II 4 0 7 4 00
9
Phase III 0 0.2 4 1 12 1 4
Phase IV 0 0 0 0 0 10 0
Phase V 0 0 4 0 4 1 0
Phase VI 0 1.3 0 0 18 3 0
Total Units 4 1.5 15 4 74 17 13
Cost
Phase I $0 $0 $0 $0 $480,000 $0 $0 $480,000
TSM* $0 $0 $0 $0 $0 $0 $0 $0
Phase II $50,000 $0 $388,850 $288,800 $0 $0 $333,000 $1,060,650
Phase III $0 $16,670 $222,200 $72,200 $144,000 $600,000 $148,000 $1,203,070
Phase IV $0 $0 $0 $0 $0 $6,000,000 $0 $6,000,000
Phase V $0 $0 $222,200 $0 $48,000 $600,000 $0 $870,200
Phase VI $0 $108,355 $0 $0 $216,000 $1,800,000 $0 $2,124,355
Total Cost $50,000 $125,025 $833,250 $361,000 $888,000 $9,000,000 $481,000 $11,738,275
LEHIGH VALLEY ENHANCED BUS/BRT STUDY Executive Summary - March 2014
19
TRANSIT SUPPORTIVE LAND USE FOR THE RECOMMENDED ENHANCED BUS CORRIDOR
Introduction
As envisioned, the Enhanced Bus service network would represent a significant increase in the level of transit service
available in the Lehigh Valley. As stressed in LANta’s Moving LANta Forward strategic plan and LANta's outreach
efforts, the feasibility of any transit expansion in the Lehigh Valley depend heavily on the counties and municipalities
employing transit supportive development practices in land use and economic development decisions. The Enhanced
Bus/Bus Rapid Transit Study included a detailed analysis of land use and land use regulations along the various
potential corridors. This analysis was an input into the selection of the recommended corridor. The study includes
detailed recommendations for land use conditions and practices along the recommended corridor. While LANta’s
Transit Supportive Land Use for the Lehigh Valley document provides recommendations for how municipalities in the
Lehigh Valley in general can promote transit supportive development in their communities. The recommendations
developed as part of the Enhanced Bus/Bus Rapid Transit Study provides recommendations specific to the
recommended Enhanced Bus corridor. These recommendations call for greater densities and more intensive uses of
parcels than the recommendations for the Valley in general. It will be necessary for all development along the
recommended Enhanced Bus corridors to be transit-supportive in nature but will need to vary in terms of intensity
and design based on the context of the area.
The following sections provide a summary of the recommendations. The full analysis is included in the full Enhanced
Bus/Bus Rapid Transit Study – Conceptual Plan document. The EBS study focus emphasized a new transit corridor
from Allentown to Easton. In that sense, the land uses along the corridor need to have equal weight to specific
strategic locations. The rationale behind this is that ridership is a function of land use. Ridership is more likely to
increase if the entire corridor has land use types, densities and intensities that are transit-supportive. Then the
strategic transit-supportive opportunity locations serve as an added “bonus” to the corridor’s ridership production.
They work hand-in-hand.
Land Use Considerations
Communities are often concerned about the “density issue” – that land use types must be “higher” than what already
exists. The earlier land use analysis showed that transit-supportive densities (residential) and intensities
(commercial/office) already exist in the Lehigh Valley. The true issue is whether the location of these transit
supportive land use plans and zoning districts are properly located to induce ridership.
Taking a look at national practices can be helpful for communities work in concert with LANta to provide more robust,
reliable and attractive bus service. To help illustrate the land use types along the corridor and at strategic locations, a
series of examples is presented. The examples represent the type and mix of uses that are compatible with current
development type, scale and intensity in the Valley.
LEHIGH VALLEY ENHANCED BUS/BRT STUDY Executive Summary - March 2014
20
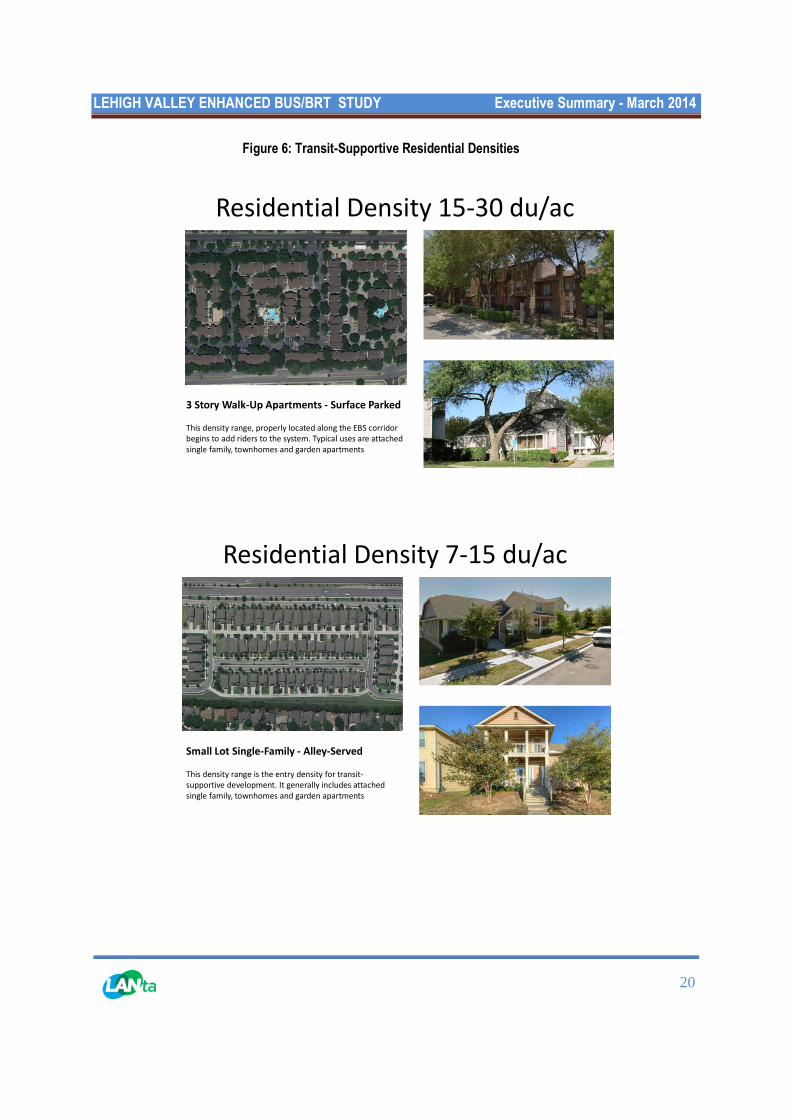
Figure 6: Transit-Supportive Residential Densities
Residential Density 15-30 du/ac
3 Story Walk-Up Apartments - Surface Parked
This density range, properly located along the EBS corridorbegins to add riders to the system. Typical uses are attachedsingle family, townhomes and garden apartments
Residential Density 7-15 du/ac
Small Lot Single-Family - Alley-Served
This density range is the entry density for transit-supportive development. It generally includes attachedsingle family, townhomes and garden apartments
LEHIGH VALLEY ENHANCED BUS/BRT STUDY Executive Summary - March 2014
21
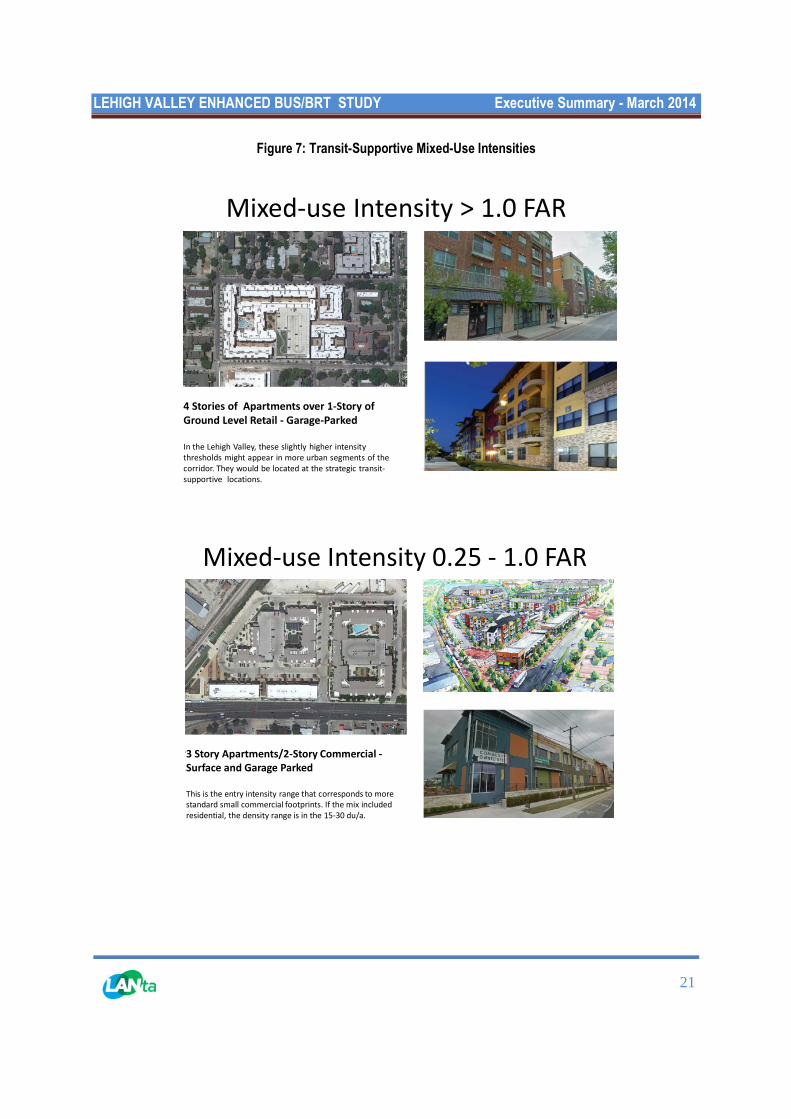
Figure 7: Transit-Supportive Mixed-Use Intensities
Mixed-use Intensity > 1.0 FAR
4 Stories of Apartments over 1-Story ofGround Level Retail - Garage-Parked
In the Lehigh Valley, these slightly higher intensitythresholds might appear in more urban segments of thecorridor. They would be located at the strategic transit-supportive locations.
Mixed-use Intensity 0.25 - 1.0 FAR
3 Story Apartments/2-Story Commercial -Surface and Garage Parked
This is the entry intensity range that corresponds to morestandard small commercial footprints. If the mix includedresidential, the density range is in the 15-30 du/a.
LEHIGH VALLEY ENHANCED BUS/BRT STUDY Executive Summary - March 2014
22
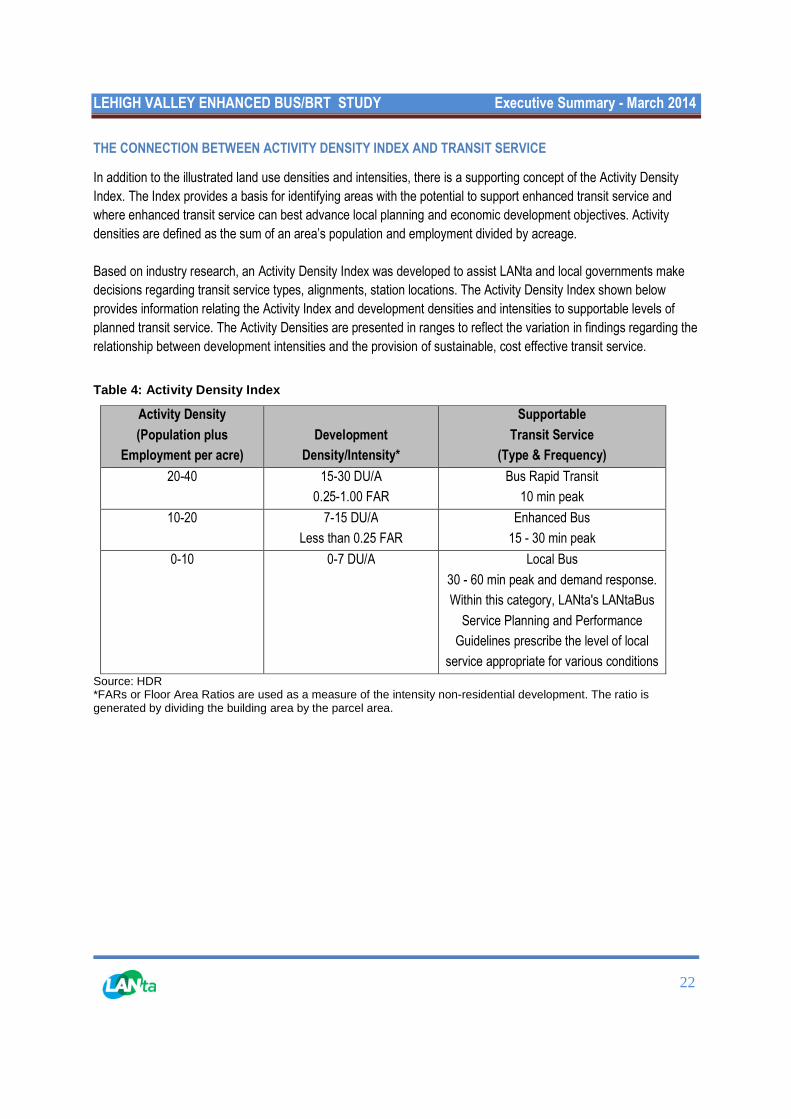
THE CONNECTION BETWEEN ACTIVITY DENSITY INDEX AND TRANSIT SERVICE
In addition to the illustrated land use densities and intensities, there is a supporting concept of the Activity Density
Index. The Index provides a basis for identifying areas with the potential to support enhanced transit service and
where enhanced transit service can best advance local planning and economic development objectives. Activity
densities are defined as the sum of an area’s population and employment divided by acreage.
Based on industry research, an Activity Density Index was developed to assist LANta and local governments make
decisions regarding transit service types, alignments, station locations. The Activity Density Index shown below
provides information relating the Activity Index and development densities and intensities to supportable levels of
planned transit service. The Activity Densities are presented in ranges to reflect the variation in findings regarding the
relationship between development intensities and the provision of sustainable, cost effective transit service.
Table 4: Activity Density Index
Activity Density
(Population plus
Employment per acre)
Development
Density/Intensity*
Supportable
Transit Service
(Type & Frequency)
20-40 15-30 DU/A
0.25-1.00 FAR
Bus Rapid Transit
10 min peak
10-20 7-15 DU/A
Less than 0.25 FAR
Enhanced Bus
15 - 30 min peak
0-10 0-7 DU/A Local Bus
30 - 60 min peak and demand response.
Within this category, LANta's LANtaBus
Service Planning and Performance
Guidelines prescribe the level of local
service appropriate for various conditions
Source: HDR*FARs or Floor Area Ratios are used as a measure of the intensity non-residential development. The ratio isgenerated by dividing the building area by the parcel area.
LEHIGH VALLEY ENHANCED BUS/BRT STUDY Executive Summary - March 2014
23
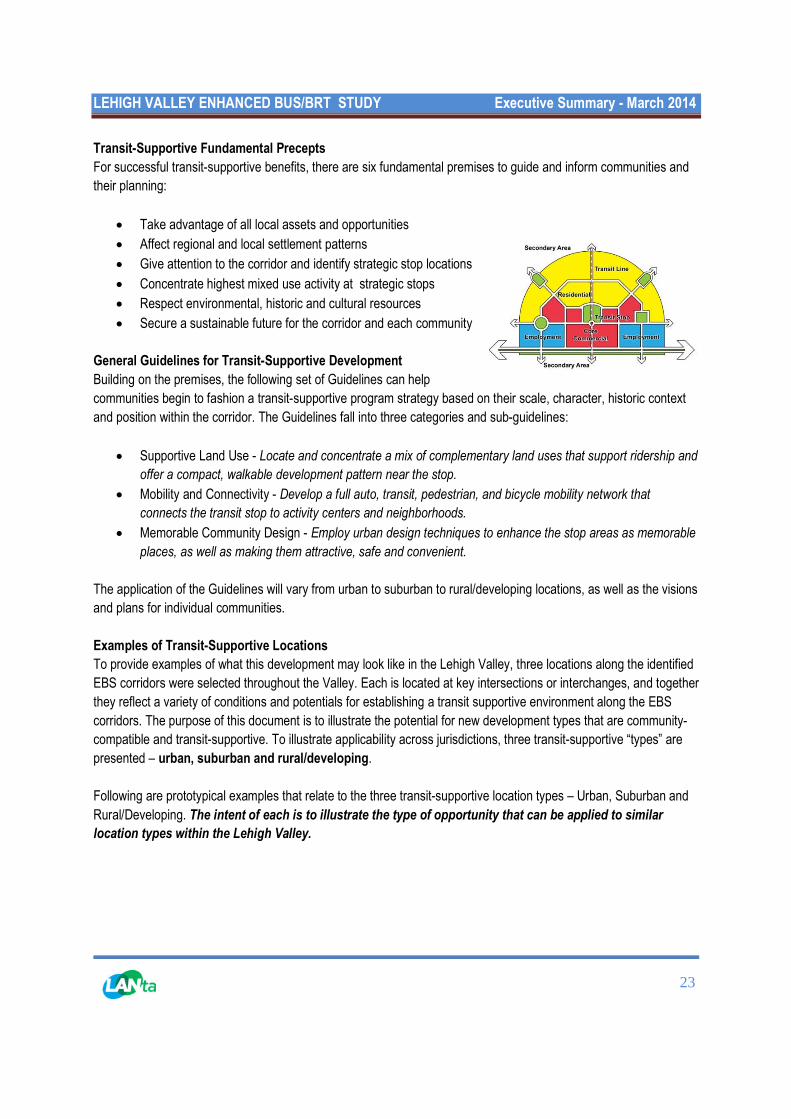
Transit-Supportive Fundamental Precepts
For successful transit-supportive benefits, there are six fundamental premises to guide and inform communities and
their planning:
Take advantage of all local assets and opportunities
Affect regional and local settlement patterns
Give attention to the corridor and identify strategic stop locations
Concentrate highest mixed use activity at strategic stops
Respect environmental, historic and cultural resources
Secure a sustainable future for the corridor and each community
General Guidelines for Transit-Supportive Development
Building on the premises, the following set of Guidelines can help
communities begin to fashion a transit-supportive program strategy based on their scale, character, historic context
and position within the corridor. The Guidelines fall into three categories and sub-guidelines:
Supportive Land Use - Locate and concentrate a mix of complementary land uses that support ridership and
offer a compact, walkable development pattern near the stop.
Mobility and Connectivity - Develop a full auto, transit, pedestrian, and bicycle mobility network that
connects the transit stop to activity centers and neighborhoods.
Memorable Community Design - Employ urban design techniques to enhance the stop areas as memorable
places, as well as making them attractive, safe and convenient.
The application of the Guidelines will vary from urban to suburban to rural/developing locations, as well as the visions
and plans for individual communities.
Examples of Transit-Supportive Locations
To provide examples of what this development may look like in the Lehigh Valley, three locations along the identified
EBS corridors were selected throughout the Valley. Each is located at key intersections or interchanges, and together
they reflect a variety of conditions and potentials for establishing a transit supportive environment along the EBS
corridors. The purpose of this document is to illustrate the potential for new development types that are community-
compatible and transit-supportive. To illustrate applicability across jurisdictions, three transit-supportive “types” are
presented – urban, suburban and rural/developing.
Following are prototypical examples that relate to the three transit-supportive location types – Urban, Suburban and
Rural/Developing. The intent of each is to illustrate the type of opportunity that can be applied to similar
location types within the Lehigh Valley.
LEHIGH VALLEY ENHANCED BUS/BRT STUDY Executive Summary - March 2014
24
URBAN LOCATION
The urban strategic transit-supportive development location, the block on 7th Street between Allen Street and
Tilghman Street Allentown focuses on how generally built-up urban locations can be more transit-supportive. The
interaction between transit and land use mix, building forms, street patterns, vehicular access and pedestrian
accommodation is critical. Urban locations, such as the one that centers on 7th Street between Allen Street and
Tilghman Street, are excellent areas for selective treatments that can enhance ridership. Following is a set of
Opportunities and Issues that may be representative of other similar urban locations in the Lehigh Valley.
Opportunities
The characteristics of this typical urban location
are:
o LANta currently exists so its presence is a
known service
o There is a well-developed grid network with
small block sizes that allows for pedestrian
circulation
o Existing land uses exhibit diversity with
retail/shopping, services and denser
residential types
o Buildings demonstrate an urban scale and
character
o Existing buildings are candidates for adaptive
reuse
o Selective vacant areas can be infill candidates
o On-street parking is typical
Transit-supportive zoning is in place
Potential for a supporting pedestrian and bicycle
network.
Issues
There are limited locations for enhanced transit
stops
Gaps in the urban fabric create lack of visual
continuity
Auto access points interrupt pedestrian flow and
safety
Complementary streetscape and urban design
features are limited
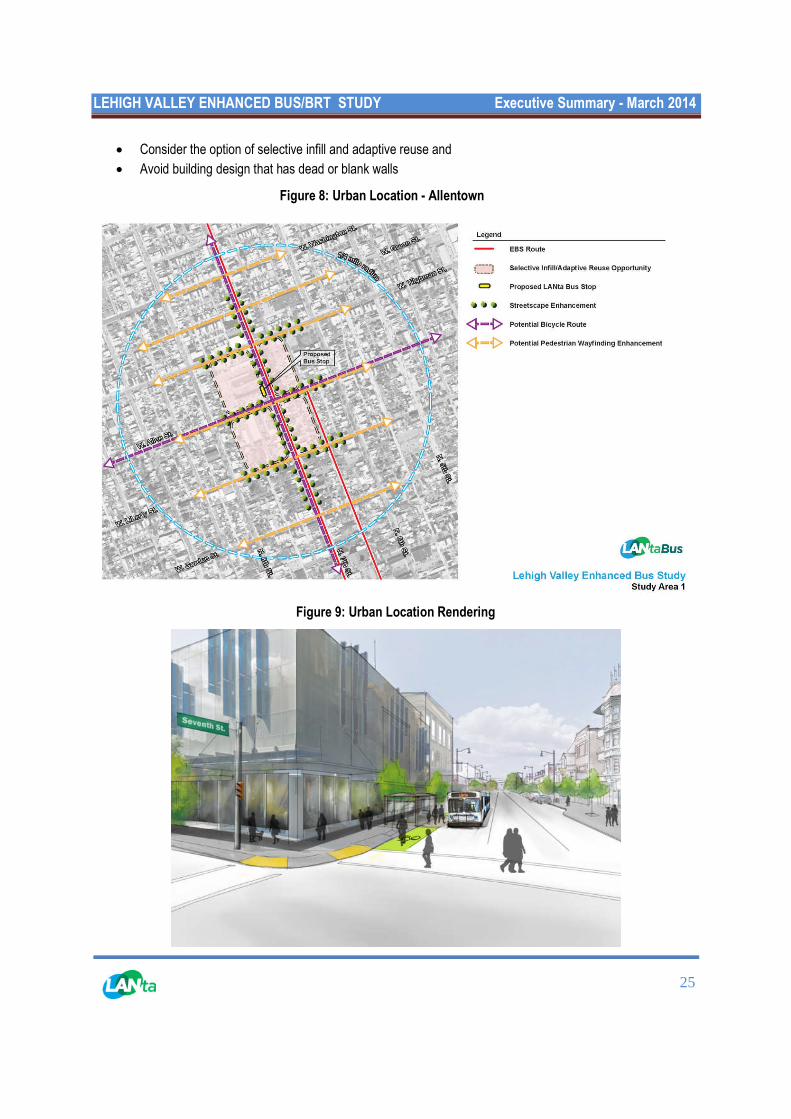
The urban location example focuses more on limited enhancements – but oriented to making the location functional,
attractive and accessible. The location currently has a standard bus stop, so the emphasis is on an enhanced shelter
and supporting facilities. There can be infill or adaptive reuse options, depending on the nature and character of the
area. Using the General Design Guidelines listed previously; ones that are particularly applicable to the urban
example are highlighted. As an urban example, the diagram reflects the ¼ mile walk shed with:
Mix land uses
Highlight pedestrian routes
Consider a supporting bike lane
Wayfinding and safety
Streetscape amenities
Provide on-street parking
LEHIGH VALLEY ENHANCED BUS/BRT STUDY Executive Summary - March 2014
25
Consider the option of selective infill and adaptive reuse and
Avoid building design that has dead or blank walls
Figure 8: Urban Location - Allentown
Figure 9: Urban Location Rendering
LEHIGH VALLEY ENHANCED BUS/BRT STUDY Executive Summary - March 2014
26
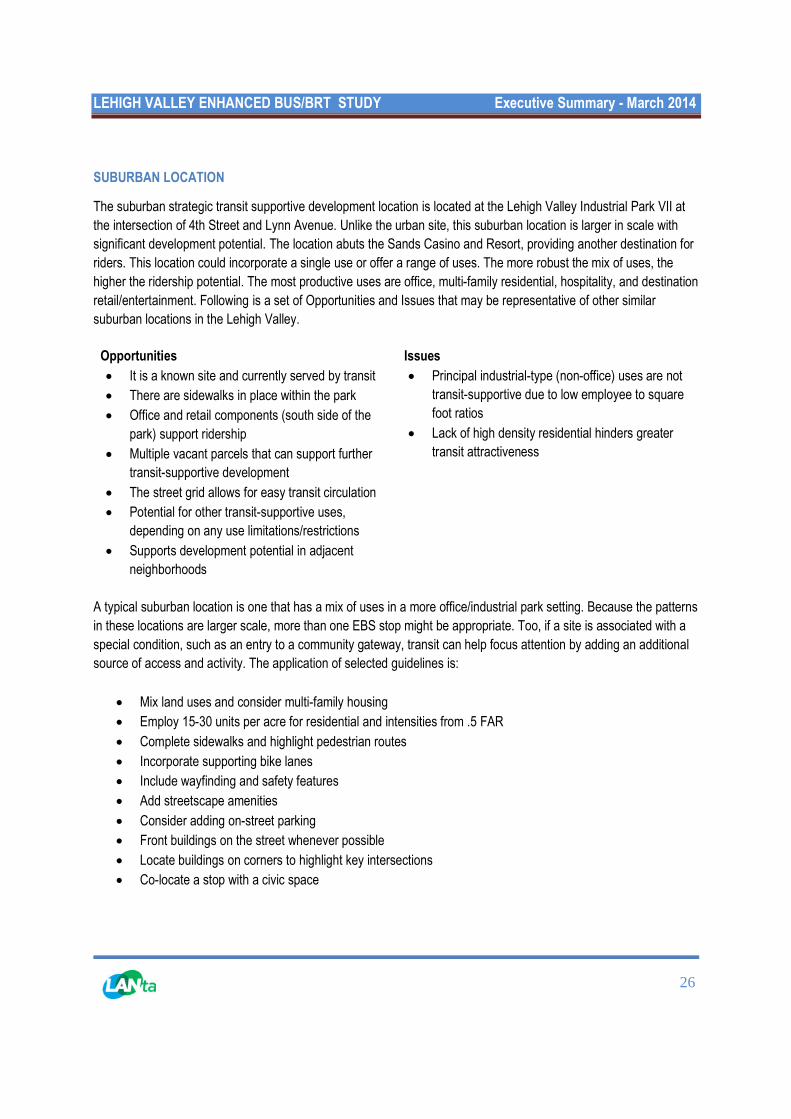
SUBURBAN LOCATION
The suburban strategic transit supportive development location is located at the Lehigh Valley Industrial Park VII at
the intersection of 4th Street and Lynn Avenue. Unlike the urban site, this suburban location is larger in scale with
significant development potential. The location abuts the Sands Casino and Resort, providing another destination for
riders. This location could incorporate a single use or offer a range of uses. The more robust the mix of uses, the
higher the ridership potential. The most productive uses are office, multi-family residential, hospitality, and destination
retail/entertainment. Following is a set of Opportunities and Issues that may be representative of other similar
suburban locations in the Lehigh Valley.
Opportunities
It is a known site and currently served by transit
There are sidewalks in place within the park
Office and retail components (south side of the
park) support ridership
Multiple vacant parcels that can support further
transit-supportive development
The street grid allows for easy transit circulation
Potential for other transit-supportive uses,
depending on any use limitations/restrictions
Supports development potential in adjacent
neighborhoods
Issues
Principal industrial-type (non-office) uses are not
transit-supportive due to low employee to square
foot ratios
Lack of high density residential hinders greater
transit attractiveness
A typical suburban location is one that has a mix of uses in a more office/industrial park setting. Because the patterns
in these locations are larger scale, more than one EBS stop might be appropriate. Too, if a site is associated with a
special condition, such as an entry to a community gateway, transit can help focus attention by adding an additional
source of access and activity. The application of selected guidelines is:
Mix land uses and consider multi-family housing
Employ 15-30 units per acre for residential and intensities from .5 FAR
Complete sidewalks and highlight pedestrian routes
Incorporate supporting bike lanes
Include wayfinding and safety features
Add streetscape amenities
Consider adding on-street parking
Front buildings on the street whenever possible
Locate buildings on corners to highlight key intersections
Co-locate a stop with a civic space
LEHIGH VALLEY ENHANCED BUS/BRT STUDY Executive Summary - March 2014
27
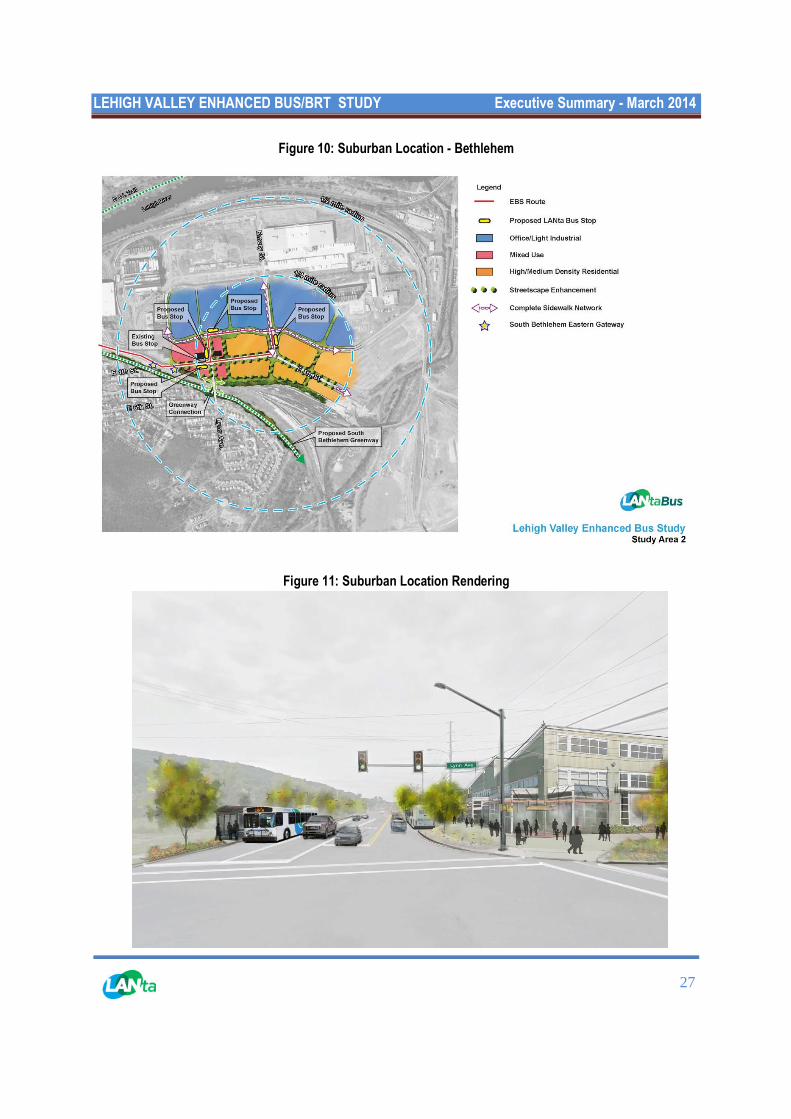
Figure 10: Suburban Location - Bethlehem
Figure 11: Suburban Location Rendering
LEHIGH VALLEY ENHANCED BUS/BRT STUDY Executive Summary - March 2014
28
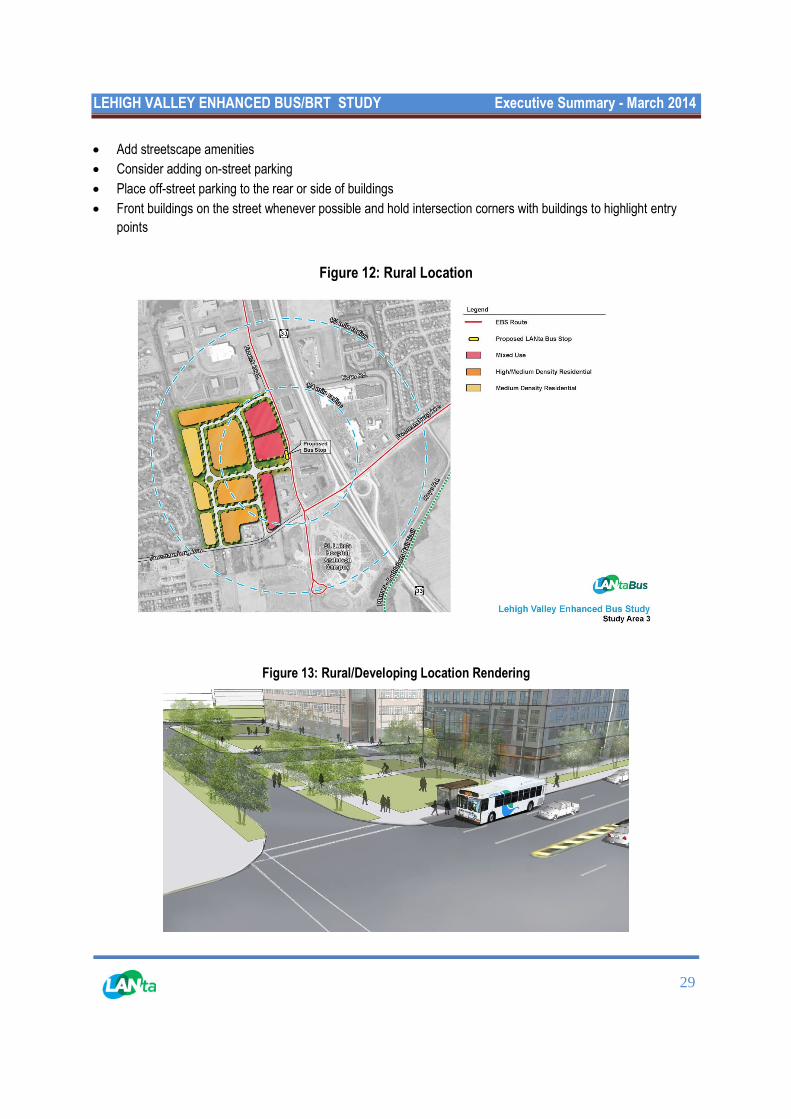
RURAL/DEVELOPING LOCATION
Moving farther away from the two urban centers of Allentown and Bethlehem, there is a long stretch of rural and
sporadically located opportunity areas. One of these locations is at the interchange of Route 33 and Freemansburg
Avenue, where the transit route turns toward Easton. This is an emerging “mid-way” location that has multiple
development opportunities and several key anchors in place. These include a developing office park on Emrick Blvd,
the St. Luke's Hospital Anderson Campus and a shopping center just east of Route 33. Bethlehem Township has
transit supportive-development planned and zoned in place on all four corners:
Mixed Use/Light Industrial Office campus (northwest)
Hospital Health Care Village (southwest)
Commercial Enhancement (northeast)
Town Center (southeast)
Future opportunities for such sites are dependent on proactive planning by the communities along the route.
Following is a set of Opportunities and Issues that may be representative of other similar rural/developing locations in
the Lehigh Valley.
Opportunities
The location is strategic, since it is mid-way
between urban centers on a stretch of the corridor
that generally has lower development patterns
Has development opportunities on multiple
parcels
One or more key anchors are in place
Strategically located stops can give access to all
four key locations
Issues
Road configuration can divide the major parcels
Large, adjacent single family subdivisions affect
land use compatibility at the edges
The rate of development is the unknown factor
and can influence ridership potential
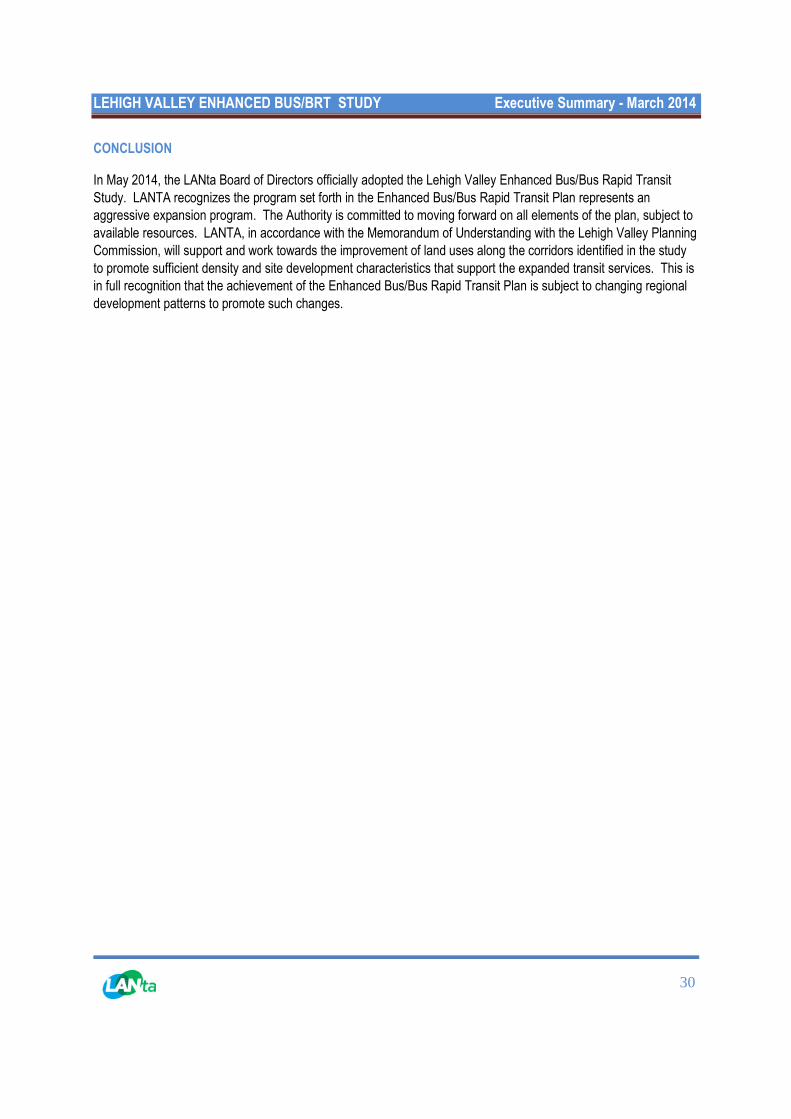
This transit-supportive example represents an opportunity where a community has a vision for an emerging area.
These locations are important for LANta, because the addition of land uses can mean enhanced ridership potential.
Too, when development is already taking place, it is easier to create a destination and center of activity. In the case
of location three, there is a significant vacant parcel with mixed use zoning. Such a location can serve as a model at
other potential stops, even if the site is smaller. New patterns that are more transit-supportive are possible. The
application of selected guidelines for this type is:
Co-locate a stop with a civic space
Mix land uses and consider multi-family housing
Employ 7.5-15 units per acre against lower density development and 15-30 units per acre for residential and
intensities from .5 FAR in the core
Have a complete sidewalk network and highlight pedestrian routes
Incorporate supporting bike lanes
Wayfinding and safety
LEHIGH VALLEY ENHANCED BUS/BRT STUDY Executive Summary - March 2014
29
Add streetscape amenities
Consider adding on-street parking
Place off-street parking to the rear or side of buildings
Front buildings on the street whenever possible and hold intersection corners with buildings to highlight entry
points
Figure 12: Rural Location
Figure 13: Rural/Developing Location Rendering
LEHIGH VALLEY ENHANCED BUS/BRT STUDY Executive Summary - March 2014
30
CONCLUSION
In May 2014, the LANta Board of Directors officially adopted the Lehigh Valley Enhanced Bus/Bus Rapid TransitStudy. LANTA recognizes the program set forth in the Enhanced Bus/Bus Rapid Transit Plan represents anaggressive expansion program. The Authority is committed to moving forward on all elements of the plan, subject toavailable resources. LANTA, in accordance with the Memorandum of Understanding with the Lehigh Valley PlanningCommission, will support and work towards the improvement of land uses along the corridors identified in the studyto promote sufficient density and site development characteristics that support the expanded transit services. This isin full recognition that the achievement of the Enhanced Bus/Bus Rapid Transit Plan is subject to changing regionaldevelopment patterns to promote such changes.


![[A4] XIAOMEI_Guangzhou BRT and New BRT in China - Ed](https://static.fdocuments.us/doc/165x107/577ce47b1a28abf1038e73a0/a4-xiaomeiguangzhou-brt-and-new-brt-in-china-ed.jpg)