![Accountable Government: A Guide for Ministers and Ministers ......2011/05/27 · Accountable government: a guide for ministers and ministers of state Annual (irregular) [2003]- Text](https://static.fdocuments.us/doc/165x107/60dbf72e48bc3559e537dc8c/accountable-government-a-guide-for-ministers-and-ministers-20110527-.jpg)
Legislative Role Models: Female Ministers, Participation ...
58
Legislative Role Models: Female Ministers, Participation, and Influence in the UK House of Commons Jack Blumenau London School of Economics Abstract When women are promoted to high office, do they serve as role models to other women in politics? I evaluate a female role-model hypothesis by examin- ing parliamentary debates in the UK House of Commons. In the context of a difference-in-differences design which exploits over-time variation in the gender of cabinet ministers, I demonstrate that appointing a female minister increases the participation of other female MPs in relevant debates by approximately one third, compared to when the minister is male. Further, using a measure of debate influence, based on the degree to which the words used by one legislator are subsequently adopted by other members, I show that female ministers also increase the influence of female backbenchers. To explore the mechanisms be- hind these results, I introduce a new metric of ministerial responsiveness and show that female ministers are significantly more responsive to the speeches of female backbenchers than are male ministers. Word count: 9972
Transcript of Legislative Role Models: Female Ministers, Participation ...

Legislative Role Models:
Female Ministers, Participation, and Influence in
the UK House of Commons
Jack Blumenau
London School of Economics
Abstract
When women are promoted to high office, do they serve as role models toother women in politics? I evaluate a female role-model hypothesis by examin-ing parliamentary debates in the UK House of Commons. In the context of adifference-in-differences design which exploits over-time variation in the genderof cabinet ministers, I demonstrate that appointing a female minister increasesthe participation of other female MPs in relevant debates by approximately onethird, compared to when the minister is male. Further, using a measure ofdebate influence, based on the degree to which the words used by one legislatorare subsequently adopted by other members, I show that female ministers alsoincrease the influence of female backbenchers. To explore the mechanisms be-hind these results, I introduce a new metric of ministerial responsiveness andshow that female ministers are significantly more responsive to the speeches offemale backbenchers than are male ministers.
Word count: 9972

Many years ago I worked in the House of Commons for a woman that I admiredvery much called Barbara Castle. She was my role model because I felt, well, ifBarbara can do it then I can do it. (Boothroyd, 2013)
Baroness Boothroyd, Former Speaker of the House of Commons.
When women are promoted to high political office, do they serve as role models to other
women in politics? The factors that determine the appointment of women to political
leadership roles have been the subject of increasing study in recent years (Heath, Schwindt-
Bayer and Taylor-Robinson, 2005; Escobar-Lemmon and Taylor-Robinson, 2008; Krook
and O’Brien, 2012; O’Brien, 2015), but we know considerably less about the implications of
these appointments for the behaviour of other politicians. This is surprising as the idea that
successful or prominent women can act as ‘role models’ to other women is well established
in electoral politics (Wolbrecht and Campbell, 2007; Beaman et al., 2008; Gilardi, 2015),
education (Nixon and Robinson, 1999; Rask and Bailey, 2002; Bettinger and Long, 2005;
Dee, 2007; Brajer and Gill, 2010; Beaman et al., 2012) and business (Wang and Kelan,
2013; Bertrand et al., 2014). As the epigraph suggests, the potential for female leaders to
act as role models for other women in the legislature is acknowledged by female politicians
themselves, but this idea has not previously been subjected to systematic empirical scrutiny.
This paper evaluates a female role-model hypothesis in the context of the UK House
of Commons. I focus on one particularly visible leadership role in the legislature – cabi-
net ministers in the UK government – and study the effects of the appointment of female
cabinet ministers on the participation and influence of other female members of parliament
(MPs) in plenary debates. When speaking is a mechanism for collective decision-making,
inequalities in participation and influence may reflect deeper inequalities between groups
(Karpowitz, Mendelberg and Shaker, 2012). Furthermore, the ways in which individuals
interact in group discussions can provide important insights into relative distributions of
power, particularly with regard to gender (Karakowsky, McBey and Miller, 2004). Un-
derstanding the conditions under which female legislators participate and hold influence
in political debates is therefore important for evaluating the representation of women’s
interests in politics more broadly.
1

I argue that the appointment of a female cabinet minister may affect other female
MPs’ willingness to participate in debate, and the influence they enjoy as a result of their
participation. When women are appointed to high-office, this sends a signal to other female
legislators about the benefits to be gained from participating in policymaking, and may
help to break down historically constructed stereotypes concerning the appropriateness of
female political rule. Furthermore, female ministers’ debating styles are likely to be more
conducive to, and encouraging of, the participation of other female MPs in parliamentary
debate. In the UK, cabinet ministers are highly visible actors in the policy process and
play a central role in the parliamentary debates that relate to their ministries, speaking
frequently to answer questions and to propose legislation for consideration. Consequently, I
expect the appointment of a female minister to lead to higher levels of female participation
and influence in debates that are presided over by the new minister.
Causal identification of role-model effects, however, presents an empirical challenge.
Ministries to which women are appointed differ in several ways from ministries presided
over by men. In particular, the factors that drive the appointment of female ministers
to certain ministries are correlated with the probability that women participate in policy
debates pertaining to those ministries. For example, women are more likely to be appointed
to traditionally “feminine” cabinet posts (Escobar-Lemmon and Taylor-Robinson, 2008;
Krook and O’Brien, 2012), and are also disproportionately likely to contribute to debates
that deal with traditionally “feminine” policy areas (Taylor-Robinson and Heath, 2003;
Bird, 2005; Catalano, 2009). Because of this, simple estimates of the relationship between
cabinet minister gender and female debate participation will be upwardly biased.
The strategy here makes progress by exploiting within-ministry variation in the gender
of the cabinet minister over time. By assigning each debate to a specific ministry, I compare
the level of female debate participation in a ministry before and after a switch in the gender
of the minister, and compare this difference to changes in female participation in other
ministries where the gender of the minister remains constant. This approach – which is
equivalent to a difference-in-differences design in a multi-period setting – allows me to rule
2

out any omitted variable bias that could be attributed to any fixed tendencies of women
to engage with the work of particular ministries and not others. Using this design-based
framework to analyse over half a million Commons’ speeches between 1997 and 2017, I
demonstrate that appointing a female minister increases the participation of women MPs
in relevant debates by approximately one third over the level of female participation under
male ministers.
These results are robust to a number of alternative specifications and provide strong
evidence of a role-model effect. However, if women speak more after the appointment of a
female minister, but the issues that they raise are ignored by other parliamentarians, then
the substantive importance of this effect may be questioned. I address this issue by building
on new techniques for identifying important speakers in political debate (Erkan and Radev,
2004; Fader et al., 2007), which I use to examine the influence of female MPs. I model the
speeches of a parliamentary debate as a directed graphical network, and assess the linguistic
centrality of members’ speeches within a debate-graph in order to infer how influential each
MP is in each debate. The strategy is based on the assumption that the more that an MP’s
language is adopted by other MPs in subsequent speeches, the more influential is the MP.
Using this measure I show that in addition to becoming more loquacious, women also
become more influential in debate when their female colleagues are elevated to high-office.
While the mechanisms behind these effects are likely to be varied, I provide evidence
that female ministers behave systematically differently towards female MPs than do male
ministers. I introduce a new quantitative measure of ministerial responsiveness which
assumes that a minister is more responsive when the language they use to reply to a
backbencher is more similar to the words that the backbencher uses. I use this measure
to demonstrate that female ministers are substantially more responsive than their male
counterparts to the speeches made by female MPs.
Role models in the legislature
Existing research provides evidence for a female role-model hypothesis outside of the leg-
islative setting. In countries with higher proportions of female representatives, women are
3

more likely to discuss politics, and to participate in political activities (Wolbrecht and
Campbell, 2007). The election of female politicians also affects the educational attainment
and career aspirations of adolescent girls (Beaman et al., 2012) and increases the propensity
for other women to stand for elections (Beaman et al., 2008; Gilardi, 2015). In education,
assignment to same-sex teachers can significantly improve educational achievement (Dee,
2007; Nixon and Robinson, 1999); influence the course choices of students (Rask and Bai-
ley, 2002; Bettinger and Long, 2005); and improve communication between students and
teachers (Brajer and Gill, 2010). Additionally, appointing women to corporate boards can
increase the number of women occupying other leadership positions within business (Wang
and Kelan, 2013; Bertrand et al., 2014).
Why, then, might the appointment of women to positions of legislative power encourage
other female legislators to participate in plenary debate? In the electoral realm, women see
themselves as less qualified to run for political office than men (Fox and Lawless, 2011),
as less informed about political matters (Mendez and Osborn, 2010) and are less likely to
run for office (Fox and Lawless, 2004). If women see themselves as less qualified for office,
they may also see themselves as less qualified for participating in the policy process. For
example, women tend to stand for, and be elected to, predominantly “feminine” cabinet
assignments and committee positions (Escobar-Lemmon and Taylor-Robinson, 2008; Krook
and O’Brien, 2012) and female parliamentarians in the UK contribute more to policy de-
bates that concern traditionally feminine issues, but less to debates associated with more
masculine policy areas (Bird, 2005; Catalano, 2009). Observing the success of one woman
in a policy area may send a signal that women in general are qualified to contribute to
that domain (Lockwood, 2006), and may therefore encourage further participation of other
women in plenary discussion.
Furthermore, female appointments may break down historically constructed stereotypes
regarding the appropriateness of female leadership. Women are systematically under-
represented in leadership positions (Heath, Schwindt-Bayer and Taylor-Robinson, 2005;
Krook and O’Brien, 2012); are appointed to leadership roles in unfavourable circumstances
4

(O’Brien, 2015); and tend to control low prestige portfolios (Studlar and Moncrief, 1999;
Russell and DeLancey, 2002). The historical marginalisation of women in high-power roles
may create entrenched perceptions that certain policy areas, and even politics in general,
represent distinctly “male domains” (Sapiro, 1981, 712). Group-based stereotypes are often
the source of negative evaluations of women’s capabilities as leaders (Eagly and Johnson,
1990) and exposure to role models can help to undermine stereotypic beliefs (Dasgupta
and Asgari, 2004). By breaking with historical patterns, the appointment of women to
powerful cabinet positions may therefore reverse the impression that women are unsuitable
for participation in politics (Mansbridge, 1999).
In addition, theorists argue that the “deeply embedded culture of masculinity” (Loven-
duski, 2005, 48) that pervades parliament is contra-indicated to female influence in political
discussion. Legislatures are marked by highly gendered conversational dynamics in which
male contributions to policymaking are “heard” more than female contributions (Kathlene,
1994; Hawkesworth, 2003) and, in the UK, the declamatory and adversarial style of West-
minster debate (Childs, 2004) is seen as particularly antithetical to the participation and
influence of women in the policy-process. Experimental evidence suggests that as the pro-
portion of women in a group decreases, women are likely to be interrupted more often by
men (Mendelberg, Karpowitz and Oliphant, 2014); discussion will focus less on traditional
“women’s issues” (Mendelberg, Karpowitz and Goedert, 2014); and each individual women
will speak less (Karpowitz, Mendelberg and Shaker, 2012). These studies also find that
when groups operate under majority-rule (as opposed to unanimity), women experience
less conducive speaking environments. This is particularly relevant when thinking about
parliamentary settings, where women normally constitute a small proportion of discussants,
and discussions almost always take place under majoritarian decision rules.
If the appointment of a female politician to a position of high-office changes the ex-
periences of other women in parliamentary discussions, we should expect an increase in
women’s influence and participation in those debates. For example, women tend to be
more democratic in their approach to leadership (Eagly and Johnson, 1990) and in the
5

legislative setting, female committee chairs act more as moderators or facilitators, rather
than directors, of committee discussions, speaking less and make fewer interruptions than
their male counterparts (Kathlene, 1994). In the UK context, female politicians in the
Commons tend to employ a distinct form of language and debating style (Childs, 2000)
which is more cooperative, approachable, and practical than that of their male colleagues
(Lovenduski and Norris, 1996). In general, female rhetorical styles are less aggressive, more
inclusive, and more cooperative than male speech patterns (Karpowitz, Mendelberg and
Shaker, 2012, 534). Women also tend to be characterised by facilitative styles of speech,
marked by high levels of politeness and responsiveness, while male speech is seen as less
facilitative (Hannah and Murachver, 1999, 2007) and these styles are strongly predictive of
the speaking time of conversational partners (Thomson, Murachver and Green, 2001).
An important component of these styles is the degree to which an individuals’ contribu-
tions to discussion are responded to and acknowledged by other participants (Hannah and
Murachver, 2007; Asgari, Dasgupta and Cote, 2010). Accordingly, one potential locus of a
role-model effect is in the differential responsiveness of male and female high-office-holders.
Cabinet ministers have institutionally privileged positions that almost always mean that
they speak first in debates, and speak more often than backbench MPs. If female cabinet
ministers provide higher quality responses to the speeches of female legislators than do
their male counterparts, the status of women in legislative debate is likely to increase when
a woman is appointed. Such an increase in status is likely to be concomitant with increases
in the degree of influence that women enjoy, and thus their willingness to participate in
plenary debate.
Overall, there are numerous reasons why the appointment of a female legislative leader
might affect the incentives of female MPs to participate in legislative debate. The central
implication that I test in the next section is that when a female MP is appointed to lead a
ministry previously held by a man, other female MPs will be more likely to participate in
debates that pertain to that ministry than they would have been previously. In addition,
as participation and influence in debate are closely related concepts (Kathlene, 1994, 573),
6

and inequalities in participation between men and women are also associated with inequal-
ities in influence (Karpowitz, Mendelberg and Shaker, 2012), we might also expect that
the influence of women in political discussion is also likely to increase when debates are
presided over by a high-ranking women. In the subsequent section I investigate whether
the appointment of a female minister is also associated with an increase in the level of
influence that female MPs experience in plenary debate.
Data, sample, and methodology
I study all House of Commons floor debates between May 1997 and February 2017. The
full sample contains 53,397 debates, comprising over a million individual speeches.1 In
this section, I am interested in comparing the volume of speeches delivered by women in
debates pertaining to ministry m at time t when the minister for ministry m is female to
the counterfactual in which the minister is male.
The key independent variable is the gender of the minister responsible for a ministry
at a given point in time. The dummy variable, FemaleMinistermt, is equal to one when
the minister responsible for a given ministry m in time t is a woman, and zero otherwise.
Figure S2 in the appendix shows the variation in this variable over time for all 33 ministries
included in the sample.2 During the study period, there are several ministries for which the
responsible minister is never a woman – including the Defence ministry and the position of
Chancellor of the Exchequer – but no ministry is always controlled by a female minister.
While I include all ministries in the empirical analysis, identification of the role-model effect
relies only on those ministries which see a change in the gender of the cabinet minister over
time.
The analysis requires that each debate is mapped to an individual ministry. To assign
debates to ministries, I note whether a current cabinet minister speaks in a given debate,
1This information comes from theyworkforyou.com, a public website that catalogues all speeches madeby UK MPs.
2I define a cabinet minister as any individual who is paid a government salary and regularly attendscabinet meetings. The policy responsibilities for each ministry change occasionally over time and I thereforetreat each change in the name of the ministry as a new ministry.
7

and assign the debate to the ministry for which that cabinet minister is responsible. Where
more than one cabinet minister speaks, I assign the debate to the ministry of the most
frequently appearing cabinet minister. As ministers speak regularly in the debates for
which they are responsible, this serves as an efficient way of categorising the debates.
Some debates do not contain speeches from any cabinet ministers,3 and the final sample
for analysis contains 14,388 debates consisting of approximately 530,000 speeches.
The outcome variable is the proportion of words spoken by female legislators in debates
pertaining to ministry m in month t:
PropWordsWomenmt =# words spoken by womenmt
# words spoken by men and womenmt
(1)
I exclude speeches made by the ministers themselves, ensuring that the figures are
not artificially inflated by female ministers speaking more after they are appointed. I
also remove speeches made by the Speaker of the House of Commons, which are almost
exclusively procedural.4
Systematic differences between ministries almost certainly affect the degree to which
female legislators choose to participate in legislative debate. For example, previous research
shows that women are significantly more likely to participate in legislative debates that
relate to areas of traditional concern to women, including health care and children and
family issues (Catalano, 2009; Pearson and Dancey, 2011). Figure S1 in the appendix
suggests that unobserved ministry characteristics such as these are clearly influential in the
data here. Women speak significantly more in ministries such as ‘Education’ and ‘Energy
and Climate Change’, and significantly less in debates pertaining to the ‘Defence’, ‘Foreign’,
and ‘Justice’ ministries. If female ministers are disproportionately appointed to ministries
in which the rate of female participation is already high, then naive comparisons between
debates presided over by female and male ministers are likely to be upwardly biased.
To overcome these problems, I estimate fixed-effects regressions of the following form:
PropWordsWomendmt = β1 ∗ FemaleMinistermt + λm + δt + εdmt (2)
3These are mostly procedural debates.4In appendix section B, I consider several alternative specifications of the dependent variable. The
choice between these various measures is inconsequential.
8

where PropWordsWomendmt is defined in equation 1, λm is a ministry fixed-effect that
washes out any omitted variable bias from unobserved ministry characteristics that are
fixed over time (such as the degree to which a ministry deals with policy that is tradition-
ally of greater concern to women), δt is a year-month fixed-effect to control for common
shocks across ministries in a given month, and εdmt is an idiosyncratic error term. β1 is
the coefficient of interest, and captures the reduced-form causal effect of the appointment
of a female minister on the participation of women in debates for those ministries that
experienced a change in minister gender over time.
This fixed-effect design is equivalent to a multi-period ‘difference-in-differences’ in the
style of Angrist and Pischke (2009, 234). β1 identifies the effect of switching from a male
to female minister based on the within-ministry variation of the outcome variable among
those ministries that see changes in the gender of the minister over time. By accounting
for fixed characteristics of ministries that might predict both female debate participation
and the appointment of a female minister, the model compares changes in female debate
participation in ministries that experience a switch in minister gender to ministries where
the gender of the minister remains constant, while differencing out the general trends across
ministries in a given month.
Identification of the causal effect relies on changes in minister gender being exogenous
to the level of female debate participation, conditional on time and ministry fixed-effects.
The key identifying assumption is that treated ministries would have followed the same
trend as non-treated ministries in the absence of treatment. I relax this assumption by
estimating further models which include ministry-specific linear (λm1) and quadratic (λm2)
time trends:
PropWordsWomendmt = β1 ∗ FemaleMinistermt + λm0 + δt
+λm1t+ λm2t2 + εdmt (3)
where t is a time variable. Furthermore, in contrast to the typical multi-period ‘difference-
in-difference’ model, in this setting the treatment (the presence of a female minister)
switches on and off over time. That is, once appointed, a female minister might also leave
9

office, and ministries often see multiple female ministers (appointed at different times) over
the study period. To account for the possibility that differential local trends within min-
istries might confound the causal effect, I also estimate generalised additive models (GAM)
which include non-parametric ministry-specific time trends:
PropWordsWomendmt = β1 ∗ FemaleMinistermt + λm0 + δt
+λm1f(t) + εdmt (4)
These models represent extremely conservative specifications, as the addition of the
ministry-specific trends means that all unobserved and smoothly varying confounding dif-
ferences are removed from the estimate of β1, and that only sharp changes to the trend in
the outcome variable that occur at the same time as the change in minister gender con-
tribute to this estimate. As none of the substantive or statistical results change noticeably
when this crucial identifying assumption is relaxed, this lends significant support to the
empirical design. I provide further evidence for the validity of the identification assump-
tion by estimating a dynamic panel model, which estimates the treatment effect in the
time periods before and after the actual change in minister gender. This allows me to test
whether the treated and non-treated ministries experienced systematically different levels
of female debate participation in the periods leading up to the treatment. The results from
the dynamic model suggest that this is not the case, and thus reduce concerns that the
effect I observe is a feature of some factor other than the appointment of a female minister.
Finally, as there are only 33 ministries in the data, I follow standard practice in the litera-
ture and construct bootstrapped clustered standard errors at the ministry level (Cameron
and Miller, 2015).5
5I bootstrap 1000 times, resampling ministries from the full data with replacement, and estimatingequations 2 and 3 at each iteration. Because the GAM model is computationally very burdensome, I donot bootstrap this model. Nevertheless, the GAM model provides point estimates which are very similarto the other models.
10

Female ministers and debate participation
Before turning to the main results, I present a simple graphical analysis. Figure 1 shows
the evolution of the dependent variable over time in the ministries that experienced a
change in the gender of the minister. The y-axis in the figure gives the proportion of words
spoken by female MPs in each month, and the x-axis gives the date. Blue line segments
represent periods in which the presiding minister is female, and orange segments represent
male ministers. The plot provides clear evidence of a role-model effect whilst also revealing
heterogeneity across ministries. In many cases, the appointment of a female minister is
accompanied by an increase in the proportion of words spoken by other female MPs. The
effect appears to be particularly pronounced in the ‘Trade and Industry’, ‘Home’, ‘Culture,
Media and Sport’, and ‘International Development’ ministries. By contrast, there is less
evidence of an effect in other ministries, though in no cases does the appointment of a
female minister appear to lead to a decrease in the proportion of words spoken by other
female MPs.
Table 1 presents the results of the regression analyses. Model 1 presents the naive
estimate of the effect of a female minister, without controlling for ministry or year-month
fixed-effects. Models 2 and 3 introduce these fixed-effects separately, and model 4 presents
the results of the ‘difference-in-differences’ model which includes both fixed-effects. The
coefficient of the main variable of interest, FemaleMinister, is positive and significant in
all four of these models, but it decreases noticeably when accounting for ministry. This
suggests that female ministers are indeed appointed to lead ministries where the level of
debate participation of other female MPs is already high. Nevertheless, the effect remains
significant in the specification in model 4, implying that the appointment of a female
minister leads to an increase in debate participation of other female MPs in the House of
Commons. The size of the effect is also substantial. Based on model 4, the appointment
of a female minister increases the proportion of words used by women by 4.4 percentage
points of total words. This corresponds to an increase of approximately 26% [11%, 41%]
over the average speech rate of women in debates under male ministers.
11

Figure 1: Proportion of words spoken by women in treated ministries, over time
Note: The plot shows the proportion of words spoken by women in each calendar month, in each ministrythat experienced a change in the gender of the presiding minister.
12

Tab
le1:
Eff
ect
ofap
poi
nti
ng
afe
mal
em
inis
ter
onfe
mal
edeb
ate
par
tici
pat
ion
Pro
pW
ord
sWom
en
(1)
(2)
(3)
(4)
(5)
(6)
(7)
Fem
ale
min
iste
r0.0
60∗∗∗
0.05
4∗∗∗
0.05
6∗∗∗
0.04
4∗∗∗
0.04
0∗∗∗
0.04
1∗∗∗
0.03
3∗∗∗
(0.0
17)
(0.0
16)
(0.0
16)
(0.0
13)
(0.0
13)
(0.0
11)
(0.0
08)
Con
stant
0.16
9∗∗∗
0.09
8∗∗∗
0.10
9∗0.
055
0.11
90.
159
0.03
8(0
.011
)(0
.025
)(0
.066
)(0
.034
)(2
.015
)(5
52.8
66)
(0.3
77)
Mon
thF
Es
×X
×X
XX
XM
inis
try
FE
s×
×X
XX
XX
Lin
ear
tim
etr
end
s×
××
×X
X×
Qu
adra
tic
tim
etr
end
s×
××
××
X×
Fle
xib
leti
me
tren
ds
××
××
××
XE
ffec
tS
ize
%36
3233
2623
2419
95%
CI
[16,5
6][1
3,50
][1
4,52
][1
1,41
][9
,38]
[12,
37]
[10,
29]
Ob
serv
atio
ns
3,05
73,
057
3,05
73,
057
3,05
73,
057
3,05
7R
20.
034
0.24
00.
192
0.36
60.
395
0.41
6A
dju
sted
R2
0.03
40.
184
0.18
40.
312
0.33
60.
352
0.40
4
Note:
Mod
els
1-6
rep
rese
nt
OL
Sfi
xed
-eff
ect
regr
essi
ons
for
the
per
iod
1997
-201
7.R
egre
ssio
nco
effici
ents
are
show
nw
ith
boot
stra
pp
edcl
ust
er-r
obu
stst
and
ard
erro
rs(c
lust
ered
by
min
istr
y)
show
nin
par
enth
eses
.T
he
“Eff
ect
Siz
e”ro
win
dic
ates
the
per
centa
gein
crea
sein
fem
ale
par
tici
pat
ion
rela
tive
toth
eav
erag
efe
mal
ep
art
icip
atio
nra
teu
nd
erm
ale
min
iste
rs.∗ p<
0.1;∗∗
p<
0.05
;∗∗∗ p<
0.01
13
The main effect is also robust to a number of alternative specifications. Models 5, 6 and
7 introduce linear, quadratic and non-parametric ministry-specific time trends. As stated
above, the inclusion of these trends relax the crucial identifying assumption that treated
and non-treated ministries would have followed parallel trends in the absence of treatment.
The table shows that the effects are highly robust, and the effect size is consistent: based on
model 6, the appointment of a female minister increases the proportion of words spoken by
other female MPs by between 12% and 37%. That the inclusion of ministry-specific time
trends changes the estimates so little is encouraging, as it rules out the possibility that
the documented effect is driven by either global or local trends in unobserved confounding
variables.
As a final robustness check, figure 2 plots the coefficients estimates from the dynamic
panel model. Here I code a binary indicator for the first 6 months of the treatment period
in a given ministry, and then add four leads and three lags of this indicator in addition to
the full set of fixed-effects and linear and quadratic time-trends. The final lagged variable
captures all treated periods from eighteen months until the end of the treatment period
for a given ministry. The coefficients represent the estimated difference in the outcome
between treated and untreated ministries in the periods before and after the treatment
occurs. The results strongly support the identifying assumption, as I find no significant
‘placebo’ effects in the two years prior to the change in minister gender. This strengthens
the plausibility of the design, as it suggests that there are no unobserved variables leading
to differential trends in the outcome between the treatment and control ministries prior
to the appointment of a female minister. Furthermore, there is a large and significant
difference between treatment and control ministries in all periods after a female minister
is appointed.
Overall, the results presented here provide strong support for a female role-model hy-
pothesis: when a female minister is appointed, other women speak approximately one third
more in debates pertaining to that ministry than when the responsible minister is male.
14

Figure 2: Dynamic panel model estimates
Note: The plot presents estimates of switching from a male to a female minister before and after the actualchange occurred. The vertical dashed line indicates the timing of the change, and the points indicate (atsix month intervals) the difference between treated and untreated ministries at the given time point.
15

Female ministers and influence
The findings in the previous section indicate that female backbenchers are more likely to
participate in the policymaking process when the responsible minister is a woman. However,
changes in relative levels of participation tells us little about how these debate contributions
are received by others in the House. If women are speaking at increasing rates, but the
issues and concerns that they raise are largely ignored by other parliamentarians, then the
substantive importance of the documented role-model effect may be limited. In this section,
I use the texts of the parliamentary speeches to provide evidence that female backbenchers
do not only speak more after the appointment of a female minister, but also that they play
a more influential role in political debate than under male ministers.
Which features of text might identify ‘influential’ speakers? Rather than directly
analysing the content of each speech, I study the links between speeches in order to as-
sess the influence of any particular speaker in a debate. I consider an MP to be influential
when the issues and concerns she raises in her speeches are adopted and discussed by other
members in subsequent speeches. Having other people pick up on your framing of an issue
is a way of controlling how the debate proceeds: it means other people are taking up your
perspective, whether or not they agree with it. Influential MPs are therefore literally ‘shap-
ing the debate’. The intuition behind the measurement strategy is to identify distinctive
language that first appears in the statement of one MP, but then gets used subseqeuntly
by later MPs.
I build upon methods for detecting influence in text corpora, where the corpus of texts
is treated as a graphical network, and influential documents are identified by their lexical
centrality in the network (Erkan and Radev, 2004; Mihalcea, 2004; Fader et al., 2007).
Debates can be viewed as clusters of documents that are related to each other in the
language that they use. Some speeches within a debate will share similar language, while
others will share less information with one another. The crucial intuition behind the model
employed here is that those speeches that are similar to many other speeches within the
same debate are more central to the topic, and speakers of central speeches are more
16

influential in a legislative debate.
I assess the influence of a speech, i, by calculating how many ‘references’ i receives from
other speeches within the debate.6 One speech, j, can be understood to ‘reference’ another,
i, when it occurs after i in the debate and when it comprises language which is sufficiently
similar to that used by i. By using similar language to i, j is implicitly indicating that
i is relevant and important for the discussion at hand. There are myriad reasons why
one speech may use similar language to another (direct quotation; expression of criticism;
statement of support) but the goal here is not to assess the substantive meaning of each
link. Rather, I assume that a speech that shares language with many other speeches
is being collectively referenced and thus can be considered an important and influential
speech within the debate. A simple way of assessing influence would therefore be to simply
count the number of references each speech receives. I consider not only the number of
references a given speech receives, but also incorporate information about the influence of
the referencing speeches. Thus, the more references i receives, and the higher the influence
of the referencing speeches, the higher is the influence i within the debate.
The basic steps of the measurement procedure are as follows.7 First, I construct debate-
specific similarity matrices which measure the cosine-similarity between all speeches in each
debate, where speeches are represented as term-frequency-inverse-document-frequency (tf-
idf) vectors. Second, these matrices are converted into directed graphs (again, one for each
debate) where the nodes represent speeches, and edges are placed between nodes for the
speech-pairs whose cosine-similarity is greater than some threshold value.8 The edges are
then weighted by the similarity scores. Third, I analyse these matrices using an iterative
ranking algorithm (Page et al., 1999) to calculate a vector of centrality scores, P , which
correspond to the influence of each speech in each debate. Finally, the influence score of
an MP in a given debate is the sum of the influence scores for the speeches given by that
MP in that debate.
6I use the term ‘reference’ as a heuristic for describing the tendency for the vocabulary used in thespeech of one member to be subsequently used in the speeches of other members.
7Full details can be found in appendix section C.8In line with Fader et al. (2007) I set this threshold to 0.25.
17

Figure 3: Example of ‘influence’ in a debate
Note: The left panel shows the ‘reference’ patterns for an example debate. The right paneldepicts the similarity matrix as a network graph.
In figure 3, the left-hand plot depicts the similarity matrix for an example debate with
14 separate speeches. Speakers are sorted according to the order in which they participated
in the debate, such that Taylor is the first speaker and Boothroyd is the last speaker. As
I only allow one speech to reference another when it occurs later in the debate than the
speech it is referencing, the bottom triangle of the matrix is empty. I also exclude the
possibility that a speaker can reference herself (grey shaded boxes). The orange-shaded
squares indicate the cosine similarity between two speeches, and are scaled such that when
the similarity between a pair of speeches is 1 (i.e. when the tf-idf vectors are identical) the
orange square will fill the dashed box that contains it. The empty elements of the upper
triangle correspond to speech pairs where the similarity between the speeches is lower
than the minimum threshold. The left panel shows, for example, that Taylor’s speech is
referenced by many subsequent speeches, while Tyler’s speech is referenced only by Trimble.
The right margin of the plot gives the vector of influence scores for this debate. Taylor’s
speech has an influence score of 0.25 and Tyler’s speech has an influence score of just 0.06.
18

The right-hand panel depicts the same similarity matrix as a directed network graph, with
speeches as nodes and edges as the ‘references’ flowing from one speech to another. Taylor’s
speech is referenced by many other members, while Bottomley, Colman, Dunwoody, and
Paisley make speeches which are not sufficiently similar to any subsequent speeches and
therefore these speakers receive no references.
Validation is essential for text-based measures of political concepts (Grimmer and Stew-
art, 2013) and in appendix table S5 I show that cabinet ministers (who have agenda-setting
privileges in debate) are on average 5 times more influential than backbench MPs, while
the Speaker of the House (whose speeches are almost exclusively procedural) is less than
half as influential as backbenchers. In addition, in appendix figure S4 I show that the
influence scores estimated from the procedure above correlate strongly and positively with
the number of times that an MP is directly mentioned by other MPs in debate. These com-
parisons provide reassuring evidence regarding the face validity of the measure of influence
described above.
One potential concern is that this measure of influence is simply proxying for speech
length. Additionally, because references only flow from later speeches to earlier ones, there
may be a relationship between influence and the position that a speech occurs in a debate.
In figure S5 in the appendix I investigate the relationship between influence and both speech
length and debate position across all debates in the sample. As the figures show, there is
a very weak relationship between length and influence (the average correlation across all
debates is -0.05), and although there is a stronger negative association between influence
and debate position, the influence measure is clearly picking up information above and
beyond simple debate ordering (the average correlation is −0.45).
With this measure in hand, I now analyse the effect of the appointment of a female
cabinet minister on the influence of female MPs. In contrast to the previous analysis here I
concentrate on changes at the individual – rather than debate – level. As before, I exclude
all speeches made by cabinet ministers and by the Speaker of the House and estimate
19

models of the form:
influenceimt = β1 ∗ FemaleMPi + β2 ∗ FemaleMinistermt +
β3 ∗ (FemaleMPi ∗ FemaleMinistermt) +
λm0 + λm1t+ λm2t2 + δt + εs(imt) (5)
where influenceimt represents the influence of member i in debates pertaining to ministry
m at time t. FemaleMPi is a binary variable, equal to one when the MP is female, and zero
otherwise. FemaleMinistermt is equal to one when the minister responsible for ministry
m and time t is female, and zero otherwise. β1 captures the average difference in influence
between male and female MPs when the minister is male. β2 represents the marginal effect
of a female minister on the influence of male MPs, and the equivalent effect for female
MPs – and the main quantity of interest – is given by β2 + β3. The role-model hypothesis
implies that β2 +β3 > 0, i.e. that female MPs’ influence increases after the appointment of
a woman minister. As previously, in addition to ministry and time fixed-effects (λm0 and
δt, respectively), I also relax the common trend assumption with the addition of ministry-
specific linear (λm1), quadratic (λm2), and non-parametric time trends. Errors are again
clustered at the ministry level. Table 2 presents the results.
Model 1 gives the results of a naive specification without controlling for ministry or time
fixed-effects, and indicates that while the appointment of a female minister has no effect on
the influence of male MPs in parliamentary debates, female MPs’ influence does increases
when a female minister is appointed. The introduction of ministry and time fixed-effects
in models 2, 3 and 4, does not change the estimate dramatically: the appointment of a
female minister is significantly related to an increase in the influence of female MPs in
parliamentary debate, but has no effect on the influence of male MPs. Models 5, 6 and 7
include ministry-specific linear, quadratic and non-parametric time trends. As before, that
the effect does not disappear once controlling for these trends gives additional support to
the design-based identification strategy.
Figure 4 shows the percentage change in influence for male (orange lines) and female
(blue lines) MPs after the appointment of a female minister, relative to a baseline where
20

Tab
le2:
Eff
ect
ofap
poi
nti
ng
afe
mal
em
inis
ter
onM
Ps’
deb
ate
influen
ce
Infl
uen
ce
(1)
(2)
(3)
(4)
(5)
(6)
(7)
Con
stan
t0.0
47∗∗∗
0.04
7∗∗∗
0.05
5∗∗∗
0.03
3∗0.
051∗∗∗
0.04
5∗∗∗
35.8
38(0
.004)
(0.0
002)
(0.0
15)
(0.0
18)
(0.0
14)
(0.0
16)
(164
.412
)F
emale
min
iste
r0.0
03
0.00
10.
003
0.00
10.
001
0.00
04−
0.00
4∗∗∗
(0.0
05)
(0.0
03)
(0.0
05)
(0.0
03)
(0.0
03)
(0.0
04)
(0.0
01)
Fem
ale
MP
−0.
001
−0.
001
0.00
10.
001
0.00
10.
001
0.00
1(0
.002)
(0.0
02)
(0.0
01)
(0.0
02)
(0.0
02)
(0.0
02)
(0.0
01)
Inte
ract
ion
0.01
1∗∗∗
0.00
8∗∗∗
0.01
1∗∗∗
0.00
9∗∗∗
0.00
8∗∗∗
0.00
9∗∗∗
0.00
9∗∗∗
(0.0
03)
(0.0
03)
(0.0
03)
(0.0
03)
(0.0
02)
(0.0
02)
(0.0
01)
Min
istr
yF
Es
×X
×X
XX
XM
onth
FE
s×
×X
XX
XX
Lin
ear
tim
etr
end
s×
××
×X
X×
Qu
ad
rati
cti
me
tren
ds
××
××
×X
×F
lexib
leti
me
tren
ds
××
××
××
XO
bse
rvati
on
s17
4,4
1917
4,41
917
4,41
917
4,41
917
4,41
917
4,41
917
4,41
9R
20.0
01
0.04
20.
015
0.05
40.
060
0.05
9A
dju
sted
R2
0.0
01
0.04
20.
014
0.05
20.
058
0.05
80.
075
Note:
Mod
els
1-6
pre
sent
OL
Sfi
xed
-eff
ect
regr
essi
ons
for
the
per
iod
1997
-201
7,m
od
el7
pre
sents
resu
lts
from
the
GA
M.R
egre
ssio
nco
effici
ents
are
show
nw
ith
rob
ust
stan
dar
der
rors
(clu
ster
edby
min
istr
y)
show
nin
pare
nth
eses
.∗ p<
0.1
;∗∗
p<
0.05
;∗∗∗ p<
0.01
21

Figure 4: Marginal effect of female minister on influence
Note: The plot shows the marginal effect of the appointment of a female cabinet minister on the debateinfluence of male (orange lines) and female (blue lines) MPs, relative to the average level of influence whenthe minister is male.
the minister is male. The marginal effect for male MPs is close to zero, varying in sign, and
statistically insignificant for all models except for the GAM. For female MPs, the effect
is always positive and significant, and the magnitude is non-trivial: based on model 6,
female MPs are 20% [4%, 35%] more influential under a female minister than when the
minister is male. In sum, the results indicate that, consistent with a role-model effect,
the appointment of a female minister leads to an increase not only in the degree to which
female MPs participate in plenary debate, but also in the level of influence that female
MPs enjoy when debating with their fellow parliamentarians.
Ministerial responsiveness
The analysis in the previous sections demonstrated reduced-form evidence of a female role-
model effect in the House of Commons, both in terms of participation and influence. How
might we account for these effects? The processes underpinning these findings are likely
to be many and varied, and isolating the mechanisms behind causal effects is notoriously
22
difficult with observational data (Imai et al., 2011). However, one explanation for this
finding might be that female cabinet ministers behave in a systematically different manner
towards female MPs than do male ministers. In particular, female ministers may be more
responsive to the speeches of female MPs. Such a hypothesis is consistent with findings in
the literature on social linguistics: “conversational partners who offer encouragement and
are attentive and responsive are more likely to elicit frequent and active participation from
speakers in the conversation.” (Hannah and Murachver, 1999, 157) If female ministers give
other female MPs responses to their speeches that are of higher quality, this is likely to
serve as a signal that they are valued colleagues in the House, and may encourage higher
levels of participation in future debates. Similarly, the measure of influence outlined in the
previous section is based on the idea that speakers are more influential when the language
that they use is adopted by other members is subsequent speeches. Accordingly, if female
cabinet ministers provide fuller responses to the contributions of female MPs than do male
ministers, then this could directly explain the empirical results presented above.
What are the important properties of responsiveness? First, a response is the occurrence
of one phenomenon after the occurrence of another phenomenon. Second, a responsive
speech is necessarily reactive, and involves engaging with or replying to concepts raised
in an original speech. To measure ‘responsiveness’, I therefore assume that a speech, j,
responds to another speech, i, when it occurs directly after i and when it engages with
the same thematic content as i. I also consider one speech to be more responsive to
another when that speech is longer, on the assumption that longer responses provide more
information to the original speaker than shorter ones, and give a greater impression of
attentiveness and fullness of reply than shorter responses.9
I define a metric which measures how similar two (consecutive) speeches are in terms
of the words that they use. Making use of the vector-representation of speeches described
9Eggers and Spirling (2014) evaluate ministerial responsiveness by analysing the relative frequencywith which ministers speak after backbenchers in debate. By contrast, I focus on the degree to which –conditional on a minister speaking after a backbencher – the language used by a minister is similar to thatused by the backbencher.
23

in equation S4, the responsiveness of speech j to speech i is given by:
resj→i = sim(i, j) ∗ nj (6)
where the first term on the right-hand side of the equation is the cosine-similarity between
the two tf-idf vectors, and nj is the number of words in speech j. When all elements of
vi and vj are positive, as they are here, the cosine-similarity of two documents is bounded
between zero and one. An intuitive interpretation of resj→i is therefore the (weighted)
number of words in speech j that are responding to speech i.10
I provide two types of validation for this measure in appendix section F. First, I show
that equation 6 captures something distinct from topicality, as comparing pairs of speeches
within the same debate, those speeches that follow directly after each other are more re-
sponsive than speeches that are non-adjacent. Second, I demonstrate that patterns of
responsiveness conform with basic intuitions of parliamentary behaviour in the Commons
by leveraging the particular structure of minister-backbencher interactions in Question
Time debates.
I now turn to the main analysis. To reiterate, if female MPs speak more and become
more influential because they receive higher quality responses from female ministers than
male ministers, then ministerial speeches subsequent to female speeches should be marked
by higher levels of res when the presiding minister is female. I therefore subset the data to
those speeches made by backbench MPs which are immediately followed by speeches made
by ministers, and estimate models of the following form:
ress(imt) = β1 ∗ FemaleMPi + β2 ∗ FemaleMinistermt +
β3 ∗ (FemaleMPmt ∗ FemaleMinistermt) +
λm0 + δt + λm1t+ λm2t2 + εs(imt) (7)
The unit of analysis in these models is a speech made by a backbencher, which is immedi-
ately followed by a speech made by a minister. Thus, ress(imt) is the response received by
10Note that as i occurs prior to j, it therefore cannot be understood to ‘respond’ to j. For this reason,resi→j is not meaningful in our context, and I calculate equation 6 only for sequentially adjacent speeches.
24

a speech s made by MP i in a debate pertaining to ministry m at month t. FemaleMPi
is a binary variable, equal to one when the MP is female. FemaleMinistermt is equal to
one when the minister responsible for ministry m and time t is female. β1 indicates the
difference in responsiveness received by male and female MPs when the minister is male.
β2 captures the effect of the appointment of a female minister on the responses received by
male MPs. β3 therefore captures the interaction between the gender of the MP speaking,
and the gender of the minister responding. A positive value for β2 +β3 would indicate that
the appointment of a female minister leads to an increase in ministerial responsiveness to
speeches by female MPs. As before, I include ministry and time fixed-effects and various
ministry-specific time trends. Also as before, errors are clustered at the ministry level.
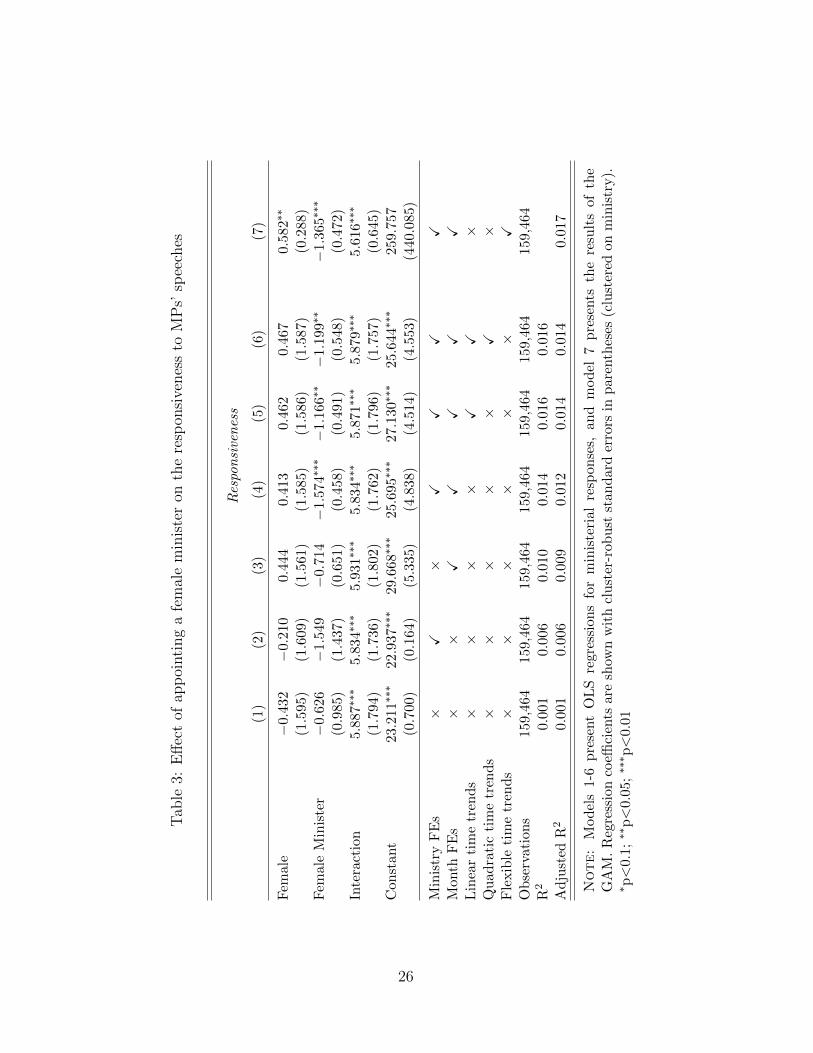
Table 3 presents the results. The interaction effect of interest, β3, is positive, significant,
and sizeable in magnitude across all model specifications. I plot the substantive magnitude
of these effects in figure 5, where the baseline is the average responsiveness of male ministers
to male and female speeches. Based on the estimates in model 6, the appointment of a
female minister increases the responsiveness to female speeches by 21% [8%, 33%] . By
contrast, the appointment of a female minister has no consistent effect on the responsiveness
to male speeches: across all models in table 3, β2 is small in magnitude and in many cases
statistically indistinguishable from zero. However, when the first speaker is a woman, then
the gender of the responding minister matters.
That female MPs receive systematically different responses from male and female minis-
ters helps to explain the increase in influence of female MPs detailed in the previous section.
Female MPs become more influential in parliamentary debate (the language that they use
in debate is adopted more often in subsequent speeches) after the appointment of a female
minister, and this effect is at least partially driven by higher levels of responsiveness of the
female minister herself. This may also explain the increase in the participation of female
MPs in debate, as higher levels of ministerial responsiveness indicate that the concerns of
female MPs are receiving more attention from powerful government figures, and send a
signal that the issues that female MPs raise are worthy of governmental concern.
25
Tab
le3:
Eff
ect
ofap
poi
nti
ng
afe
mal
em
inis
ter
onth
ere
spon
sive
nes
sto
MP
s’sp
eech
es
Res
pon
sive
nes
s
(1)
(2)
(3)
(4)
(5)
(6)
(7)
Fem
ale
−0.4
32
−0.
210
0.44
40.
413
0.46
20.
467
0.58
2∗∗
(1.5
95)
(1.6
09)
(1.5
61)
(1.5
85)
(1.5
86)
(1.5
87)
(0.2
88)
Fem
ale
Min
iste
r−
0.6
26−
1.54
9−
0.71
4−
1.57
4∗∗∗−
1.16
6∗∗−
1.19
9∗∗
−1.
365∗∗∗
(0.9
85)
(1.4
37)
(0.6
51)
(0.4
58)
(0.4
91)
(0.5
48)
(0.4
72)
Inte
ract
ion
5.8
87∗∗∗
5.83
4∗∗∗
5.93
1∗∗∗
5.83
4∗∗∗
5.87
1∗∗∗
5.87
9∗∗∗
5.61
6∗∗∗
(1.7
94)
(1.7
36)
(1.8
02)
(1.7
62)
(1.7
96)
(1.7
57)
(0.6
45)
Con
stan
t23.
211∗∗∗
22.9
37∗∗∗
29.6
68∗∗∗
25.6
95∗∗∗
27.1
30∗∗∗
25.6
44∗∗∗
259.
757
(0.7
00)
(0.1
64)
(5.3
35)
(4.8
38)
(4.5
14)
(4.5
53)
(440
.085
)
Min
istr
yF
Es
×X
×X
XX
XM
onth
FE
s×
×X
XX
XX
Lin
ear
tim
etr
end
s×
××
×X
X×
Qu
adra
tic
tim
etr
ends
××
××
×X
×F
lexib
leti
me
tren
ds
××
××
××
XO
bse
rvat
ion
s159
,464
159,
464
159,
464
159,
464
159,
464
159,
464
159,
464
R2
0.0
01
0.00
60.
010
0.01
40.
016
0.01
6A
dju
sted
R2
0.0
01
0.00
60.
009
0.01
20.
014
0.01
40.
017
Note:
Mod
els
1-6
pre
sent
OL
Sre
gres
sion
sfo
rm
inis
teri
alre
spon
ses,
and
mod
el7
pre
sents
the
resu
lts
ofth
eG
AM
.R
egre
ssio
nco
effici
ents
are
show
nw
ith
clu
ster
-rob
ust
stan
dar
der
rors
inp
aren
thes
es(c
lust
ered
onm
inis
try).
∗ p<
0.1;∗∗
p<
0.0
5;∗∗∗ p<
0.0
1
26

Figure 5: Marginal effect of a female minister on responsiveness
Note: The plot shows the marginal effect of the appointment of a female minister on the responsiveness tospeeches by male (orange lines) and female (blue lines) MPs, relative to the average level of responsivenesswhen the minister is male.
Alternative explanations
I do not claim that the differential level of responsiveness is the only mechanism through
which the role-model effect could operate. It is possible, for example, that these results may
be driven by the purely symbolic effects of appointing a female minister rather than any
behavioural differences. More concerning is the possibility that the reasons for the increase
in female participation and influence are completely distinct from the hypothesised role-
model effect.
First, if appointing women to visible positions confers a political advantage to the gov-
erning party, opposition parties may respond to the appointment of a female government
minister by strategically appointing a woman to lead the competing shadow ministry (Mat-
land and Studlar, 1996). If this is the case, the documented effects may be due to the fact
that institutional rules give both ministers and shadow ministers more time to speak on
the House floor than other MPs. I investigate this hypothesis in appendix section G by
analysing the relationship between the gender of a newly appointed shadow minister and
27

the gender of the current government minister in a given ministry. If opposition parties
are behaving strategically, then the probability that a female shadow minister is appointed
should be positively associated with the presence of a female government minister. As my
regressions show, there is little empirical support for such an argument. In addition, table
S9 in the appendix re-runs the main analysis when excluding speeches made by shadow
ministers. The results are substantively and statistically very similar to those from the full
sample.
Second, ministerial positions come with significant agenda-setting powers, and ministers
determine the direction and substance of legislation deriving from their ministries. One
possible explanation for the increase in female participation and influence is that female
ministers may propose legislation that focuses on topics which are traditionally of greater
interest to women, and on which women’s contributions are more respected. Such a finding
would undermine the notion that female ministers are acting as role models, and suggest
instead that female MPs increase their level of participation thanks to a substantive change
in the legislative agenda. In section H of the appendix, I examine whether topics that are
typically associated with high levels of female participation become more prevalent when
a female minister is appointed. I use statistical topic models to estimate which legislative
topics are associated with high levels of female participation under male ministers, and
then assess the degree to which these topics increase when a female minister takes office.
I find no evidence that female ministers are disproportionately introducing legislation that
is traditionally associated with high levels of female participation.
Conclusion
In a debate in the House of Commons on International Women’s Day in 2003, Joan Rud-
dock, a Labour Party MP, paid tribute to the minister for Women and the Secretary of
State for Trade and Industry, Patricia Hewitt:
“It is a great pleasure, as it always is, to participate in a debate that is
dominated by women. I want to start by congratulating my right honourable
28

Friend the Minister for Women, who is a great role model for us – not just
in her role as Minister for Women. . . but by being the head of a substantial
Government Department.” (Ruddock, 2003)
That female parliamentarians themselves recognise the importance of role models in
the legislature makes it all the more surprising that such a premise has been missing from
the academic literature. In this paper, I provided evidence for a female role-model effect
in the House of Commons by showing that the appointment of a female cabinet minister
is associated with an increased propensity for other female MPs to speak in parliamentary
debates under the jurisdiction of the new minister. Further, I find that female MPs also
become more influential in debates under the purview of female ministers. While there
are many mechanisms through which a role-model effect may operate, I show that female
ministers respond in a systematically different fashion to the speeches of female MPs than
do male ministers.
Legislatures are hierarchical institutions in which some actors have access to positions
which confer important powers to the office holder. While the general consequences of these
institutional powers are well-studied, there has been less written about the implications of
female occupation of such roles for the representation of women. Cabinet posts, commit-
tee chairs, and other high-profile legislative offices are normally marked by high levels of
visibility and prestige, and make the politicians that hold these posts natural focal points
for the public, but also for other members of the legislature. The results here suggest that
when women hold high-profile offices, they have significant effects on the behaviour of other
legislators, and, crucially, that their appointment can increase the voice of other women in
the policy process.
Furthermore, a central focus of legislative scholars studying gender issues has concerned
the link between descriptive representation – the number of women elected to parliament
– and substantive representation – the incorporation of women’s interests into policy out-
comes (Wangnerud, 2009). While there is growing empirical evidence for this link, the
mechanisms that connect increasing numbers of women in parliament to qualitative changes
29

in political outcomes have not been fully articulated (Beckwith and Cowell-Meyers, 2007).
One possibility is that it is not merely the number of women who gain elected office that
matters for substantive representation, but also the heights to which those women rise once
they have been elected. A limited amount of experimental research indicates that when
women take leadership roles, collective decisions tend to reflect distinctly female prefer-
ences (Humphreys, Masters and Sandbu, 2006). More research is needed to examine the
down-stream effects of female leadership on policy outcomes, but the findings here indicate
a possible mechanism through which policy change may occur: female leaders promote
increased participation and influence of other women in policymaking. Tracing out a full
causal relationship between female leadership and policy outcomes that enhance the sub-
stantive representation of women is a difficult empirical task, but the results here suggest,
at the very least, that the appointment of women to high-office can have non-negligible
effects on the behaviour of other legislators.
Future work should consider the potential for a role-model effect for other disadvantaged
groups in different legislative settings. Historically, political elites have disproportionately
shared characteristics of the dominant groups in society, and several groups remain sig-
nificantly underrepresented in the policy process. It would be profitable in the US case,
for example, to examine whether the elevation of African-American members to senior
positions in the Congressional hierarchy is associated with a concomitant increase in the
participation of black legislators in policymaking.
Finally, a growing formal literature examines the consequences of leaders’ communica-
tion strategies in collective decision making but the empirical literature on communication
and leadership has lagged behind (Ahlquist and Levi, 2011). In part, this is due to the
difficulty of operationalising reliable measures of spoken communication and establishing
credible identification strategies that isolate the effects of leaders in observational settings.
This paper makes progress on both fronts. First, the identification strategy I employ sug-
gests that by exploiting variation over time in the identity of political leaders, it is possible
to estimate causal effects of leadership on parliamentary outcomes. Second, the measures of
30

influence and responsiveness introduced here could be profitably applied to other questions
of rhetoric and parliamentary leadership. I leave such endeavours for future work.
31

References
Ahlquist, John S and Margaret Levi. 2011. “Leadership: What it means, what it does, andwhat we want to know about it.” Annual Review of Political Science 14:1–24.
Angrist, Joshua D. and Jorn-Steffen Pischke. 2009. Mostly Harmless Econometrics: AnEmpiricist’s Companion. Princeton University Press.
Asgari, Shaki, Nilanjana Dasgupta and Nicole Gilbert Cote. 2010. “When Does Con-tact with Successful Ingroup Members Change Self-Stereotypes?” Social Psychology41(3):203–211.
Beaman, Lori A, Raghabendra Chattopadhyay, Esther Duflo, Rohini Pande and PetiaTopalova. 2008. Powerful women: does exposure reduce bias? Technical report NationalBureau of Economic Research.
Beaman, Lori, Esther Duflo, Rohini Pande and Petia Topalova. 2012. “Female leadershipraises aspirations and educational attainment for girls: A policy experiment in India.”science 335(6068):582–586.
Beckwith, Karen and Kimberly Cowell-Meyers. 2007. “Sheer numbers: Critical representa-tion thresholds and women’s political representation.” Perspectives on politics 5(03):553–565.
Bertrand, Marianne, Sandra E Black, Sissel Jensen and Adriana Lleras-Muney. 2014.Breaking the glass ceiling? The effect of board quotas on female labor market outcomesin Norway. Technical report National Bureau of Economic Research.
Bettinger, Eric P and Bridget Terry Long. 2005. “Do faculty serve as role models? Theimpact of instructor gender on female students.” American Economic Review pp. 152–157.
Bird, Karen. 2005. “Gendering parliamentary questions.” The British Journal of Politics& International Relations 7(3):353–370.
Blei, David and John Lafferty. 2006. “Correlated topic models.” Advances in neural infor-mation processing systems 18:147.
Boothroyd, Baroness Betty. 2013.URL: https://www.youtube.com/watch?v=uH6-lfwUeS4
Brajer, Victor and Andrew Gill. 2010. “Yakity-Yak: Who Talks Back? An Email Experi-ment*.” Social Science Quarterly 91(4):1007–1024.
Cameron, A Colin and Douglas L Miller. 2015. “A practitioner’s guide to cluster-robustinference.” Journal of Human Resources 50(2):317–372.
32

Catalano, Ana. 2009. “Women acting for women? An analysis of gender and debateparticipation in the British House of Commons 2005–2007.” Politics & Gender 5(01):45–68.
Childs, Sarah. 2000. “The New Labour women MPs in the 1997 British Parliament: issuesof recruitment and representation.” Women’s History Review 9(1):55–73.
Childs, Sarah. 2004. “A feminised style of politics? Women MPs in the House of Commons.”The British Journal of Politics & International Relations 6(1):3–19.
Csardi, Gabor and Tamas Nepusz. 2006. “The igraph software package for complex networkresearch.” InterJournal, Complex Systems 1695(5):1–9.
Dasgupta, Nilanjana and Shaki Asgari. 2004. “Seeing is believing: Exposure to counter-stereotypic women leaders and its effect on the malleability of automatic gender stereo-typing.” Journal of Experimental Social Psychology 40(5):642–658.
Dee, Thomas S. 2007. “Teachers and the gender gaps in student achievement.” Journal ofHuman Resources 42(3):528–554.
Eagly, Alice H and Blair T Johnson. 1990. “Gender and leadership style: A meta-analysis.”Psychological bulletin 108(2):233.
Eggers, Andrew C and Arthur Spirling. 2014. “Ministerial Responsiveness in WestminsterSystems: Institutional Choices and House of Commons Debate, 1832–1915.” AmericanJournal of Political Science 58(4):873–887.
Erkan, Gunes and Dragomir R Radev. 2004. “LexRank: Graph-based lexical centrality assalience in text summarization.” Journal of Artificial Intelligence Research pp. 457–479.
Escobar-Lemmon, Maria and Michelle M Taylor-Robinson. 2008. “Getting to the top:Career paths of women in Latin American cabinets.” Political Research Quarterly .
Fader, Anthony, Dragomir R Radev, Michael H Crespin, Burt L Monroe, Kevin M Quinnand Michael Colaresi. 2007. MavenRank: Identifying Influential Members of the USSenate Using Lexical Centrality. In EMNLP-CoNLL. pp. 658–666.
Fox, Richard L and Jennifer L Lawless. 2004. “Entering the arena? Gender and the decisionto run for office.” American Journal of Political Science 48(2):264–280.
Fox, Richard L and Jennifer L Lawless. 2011. “Gendered perceptions and political candi-dacies: A central barrier to women’s equality in electoral politics.” American Journal ofPolitical Science 55(1):59–73.
Gilardi, Fabrizio. 2015. “The Temporary Importance of Role Models for Women’s PoliticalRepresentation.” American Journal of Political Science .
33

Grimmer, Justin and Brandon M Stewart. 2013. “Text as data: The promise and pitfalls ofautomatic content analysis methods for political texts.” Political Analysis 21(3):267–297.
Hannah, Annette and Tamar Murachver. 1999. “Gender and conversational style as predic-tors of conversational behavior.” Journal of Language and Social Psychology 18(2):153–174.
Hannah, Annette and Tamar Murachver. 2007. “Gender preferential responses to speech.”Journal of Language and Social Psychology 26(3):274–290.
Hawkesworth, Mary. 2003. “Congressional enactments of race–gender: Toward a theory ofraced–gendered institutions.” American Political Science Review 97(04):529–550.
Heath, Roseanna Michelle, Leslie A Schwindt-Bayer and Michelle M Taylor-Robinson. 2005.“Women on the sidelines: Women’s representation on committees in Latin Americanlegislatures.” American Journal of Political Science 49(2):420–436.
Humphreys, Macartan, William A Masters and Martin E Sandbu. 2006. “The role ofleaders in democratic deliberations: results from a field experiment in Sao Tome andPrıncipe.” World Politics 58(04):583–622.
Imai, Kosuke, Luke Keele, Dustin Tingley and Teppei Yamamoto. 2011. “Unpacking theblack box of causality: Learning about causal mechanisms from experimental and obser-vational studies.” American Political Science Review 105(04):765–789.
Karakowsky, Leonard, Kenneth McBey and Diane L Miller. 2004. “Gender, perceivedcompetence, and power displays examining verbal interruptions in a group context.”Small Group Research 35(4):407–439.
Karpowitz, Christopher F, Tali Mendelberg and Lee Shaker. 2012. “Gender inequality indeliberative participation.” American Political Science Review 106(03):533–547.
Kathlene, Lyn. 1994. “Power and Influence in State Legislative Policymaking: The Interac-tion of Gender and Position in Committee Hearing Debates.” American Political ScienceReview 88(03):560–576.
Kleinberg, Jon M. 1999. “Authoritative sources in a hyperlinked environment.” Journal ofthe ACM (JACM) 46(5):604–632.
Krook, Mona Lena and Diana Z O’Brien. 2012. “All the president’s men? The appointmentof female cabinet ministers worldwide.” The Journal of Politics 74(03):840–855.
Lockwood, Penelope. 2006. “Someone like me can be successful: Do College Students NeedSame-Gender Role Models?” Psychology of Women Quarterly 30(1):36–46.
Lovenduski, Joni. 2005. Feminizing politics. Polity.
34

Lovenduski, Joni and Pippa Norris. 1996. Women in politics. Vol. 4 Oxford UniversityPress.
Mansbridge, Jane. 1999. “Should blacks represent blacks and women represent women? Acontingent “yes”.” The Journal of politics 61(03):628–657.
Matland, Richard E and Donley T Studlar. 1996. “The contagion of women candidates insingle-member district and proportional representation electoral systems: Canada andNorway.” The journal of politics 58(03):707–733.
Mendelberg, Tali, Christopher F Karpowitz and J Baxter Oliphant. 2014. “Gender inequal-ity in deliberation: Unpacking the black box of interaction.” Perspectives on Politics12(01):18–44.
Mendelberg, Tali, Christopher F Karpowitz and Nicholas Goedert. 2014. “Does DescriptiveRepresentation Facilitate Women’s Distinctive Voice? How Gender Composition andDecision Rules Affect Deliberation.” American Journal of Political Science 58(2):291–306.
Mendez, Jeanette Morehouse and Tracy Osborn. 2010. “Gender and the perception ofknowledge in political discussion.” Political Research Quarterly 63(2):269–279.
Mihalcea, Rada. 2004. Graph-based ranking algorithms for sentence extraction, applied totext summarization. In Proceedings of the ACL 2004 on Interactive poster and demon-stration sessions. Association for Computational Linguistics p. 20.
Nixon, Lucia A and Michael D Robinson. 1999. “The educational attainment of youngwomen: Role model effects of female high school faculty.” Demography 36(2):185–194.
O’Brien, Diana Z. 2015. “Rising to the Top: Gender, Political Performance, and PartyLeadership in Parliamentary Democracies.” American Journal of Political Science .
Page, Lawrence, Sergey Brin, Rajeev Motwani and Terry Winograd. 1999. “The PageRankcitation ranking: bringing order to the Web.”.
Pearson, Kathryn and Logan Dancey. 2011. “Speaking for the underrepresented in theHouse of Representatives: Voicing women’s interests in a partisan era.” Politics & Gender7(04):493–519.
Rask, Kevin N and Elizabeth M Bailey. 2002. “Are faculty role models? Evidence frommajor choice in an undergraduate institution.” The Journal of Economic Education33(2):99–124.
Ruddock, Joan. 2003.URL: http://www.theyworkforyou.com/debates/?id=2003-03-06.976.0
35

Russell, Catherine A and Mark W DeLancey. 2002. “African Women in Cabinet Positions-Too Few, Too Weak: A Research Report.” Asian Women 15:147–163.
Sapiro, Virginia. 1981. “Research frontier essay: When are interests interesting? The prob-lem of political representation of women.” American Political Science Review 75(03):701–716.
Studlar, Donley T and Gary F Moncrief. 1999. “Women’s work? The distribution andprestige of portfolios in the Canadian provinces.” Governance 12(4):379–395.
Taylor-Robinson, Michelle M and Roseanna Michelle Heath. 2003. “Do women legislatorshave different policy priorities than their male colleagues? A critical case test.” Women& Politics 24(4):77–101.
Thomson, Rob, Tamar Murachver and James Green. 2001. “Where is the gender in gen-dered language?” Psychological Science 12(2):171–175.
Wang, Mingzhu and Elisabeth Kelan. 2013. “The gender quota and female leadership:Effects of the Norwegian gender quota on board chairs and CEOs.” Journal of businessethics 117(3):449–466.
Wangnerud, Lena. 2009. “Women in parliaments: Descriptive and substantive representa-tion.” Annual Review of Political Science 12:51–69.
Wolbrecht, Christina and David E Campbell. 2007. “Leading by example: Female membersof parliament as political role models.” American Journal of Political Science 51(4):921–939.
36

S1. Appendix
Figure S1: Female speech ratio, by ministry
Note: The figure shows the average female speech ratio as defined in equation S1 for each ministry, pooledacross all months in the data. It is clear from the figure that some ministries are subject to greater levelsof female participation than others.
S1

A. Independent variable
Figure S2: Gender of ministers over time
Note: The figure shows the distribution of the independent variable over time. While some ministriesare never held by a woman (those all in orange), and the Women’s ministry is always presided over by awoman (all in blue), the gender of the minister in several ministries varies over time.
Figure S2 shows the variation in the independent variable over time for all 33 ministriesincluded in the sample. Ministries are sorted by the proportion of the time period thatthe ministry is occupied by a female minister. Orange bars pertain to periods in which theminister responsible is male, and blue bars represent female ministers. There are severalministries for which the responsible minister is never a woman, including the the Defenceministry and the position of Chancellor of the Exchequer.
B. Alternative dependent variables
Equations S1, S2, and S3 provide alternative definitions of the dependent variable in equa-tion 1. Results for the main fixed-effects models using these alternative operationalisationsare presented in tables S1, S2, and S3 below. Regardless which of these measures is used,
S2

the main results hold: the appointment of a female minister leads to an increase in thelevel of participation in parliamentary debates by female MPs.
RatioWordsWomendmt =PropWordsWomendmt
Proportion of women in parliamentt(S1)
PropSpeechesWomendmt =# speeches by womendmt
# speeches by men and womendmt
(S2)
RatioSpeechesWomendmt =PropSpeechesWomendmt
Proportion of women in parliamentt(S3)
S3

Tab
leS1:
Eff
ect
ofap
poi
nti
ng
ofa
fem
ale
min
iste
ron
fem
ale
spee
ch(r
atio
ofw
ords)
Rati
oW
ord
sWom
en
(1)
(2)
(3)
(4)
(5)
(6)
(7)
Fem
ale
min
iste
r0.2
90∗∗∗
0.27
0∗∗∗
0.26
3∗∗∗
0.22
7∗∗∗
0.20
9∗∗∗
0.21
8∗∗∗
0.16
9∗∗∗
(0.0
82)
(0.0
75)
(0.0
68)
(0.0
67)
(0.0
67)
(0.0
63)
(0.0
42)
Con
stan
t0.8
33∗∗∗
0.53
9∗∗∗
0.60
0∗∗∗
0.30
8∗0.
652
0.90
00.
536
(0.0
52)
(0.1
35)
(0.2
29)
(0.1
79)
(8.4
44)
(2,3
25.4
90)
(2.9
79)
Mon
thF
Es
×X
×X
XX
XM
inis
try
FE
s×
×X
XX
XX
Lin
ear
tim
etr
end
s×
××
×X
X×
Qu
adra
tic
tim
etr
end
s×
××
××
X×
Fle
xib
leti
me
tren
ds
××
××
××
XE
ffec
tS
ize
%35
3232
2725
2620
95%
CI
[16,
54]
[15,
50]
[16,
48]
[12,
43]
[9,4
1][1
1,41
][1
0,30
]O
bse
rvati
on
s3,0
573,
057
3,05
73,
057
3,05
73,
057
3,05
7R
20.0
340.
161
0.18
60.
299
0.32
70.
349
Ad
just
edR
20.0
340.
099
0.17
80.
239
0.26
10.
278
0.33
2
Note:
Mod
els
1-6
rep
rese
nt
OL
Sfi
xed
-eff
ect
regr
essi
ons
for
the
per
iod
1997
-201
7.R
egre
ssio
nco
effici
ents
are
show
nw
ith
boots
trap
ped
rob
ust
stan
dar
der
rors
(clu
ster
edby
min
istr
y)
show
nin
par
enth
eses
.M
od
-el
s5
and
6in
clu
de
lin
ear
an
dqu
adra
tic
min
istr
y-s
pec
ific
tim
etr
end
sin
add
itio
nto
min
istr
yfi
xed
-eff
ects
an
dm
onth
fixed
-eff
ects
.M
od
el7
isa
GA
Mm
od
elin
clu
din
gn
on-p
aram
etri
c,m
inis
try-s
pec
ific,
flex
ible
tim
etr
end
s.T
he
“E
ffec
tS
ize”
row
ind
icat
esth
ep
erce
nta
gein
crea
sein
fem
ale
par
tici
pat
ion
rela
tive
toth
eav
erage
fem
ale
par
tici
pat
ion
rate
un
der
mal
em
inis
ters
.∗ p<
0.1;∗∗
p<
0.05
;∗∗∗ p<
0.01
S4

Tab
leS2:
Eff
ect
ofth
eap
poi
ntm
ent
ofa
fem
ale
min
iste
ron
fem
ale
par
tici
pat
ion
(pro
por
tion
ofsp
eech
es)
Pro
por
tion
spee
ches
(1)
(2)
(3)
(4)
(5)
(6)
(7)
Fem
ale
min
iste
r0.0
43∗∗∗
0.03
7∗∗∗
0.04
1∗∗∗
0.03
0∗∗∗
0.02
9∗∗∗
0.02
8∗∗∗
0.02
2∗∗∗
(0.0
13)
(0.0
12)
(0.0
11)
(0.0
10)
(0.0
09)
(0.0
09)
(0.0
07)
Con
stant
0.17
5∗∗∗
0.07
5∗∗∗
0.12
7∗∗
0.04
30.
103
0.45
90.
419
(0.0
10)
(0.0
19)
(0.0
55)
(0.0
27)
(1.0
27)
(268
.539
)(0
.984
)
Mon
thF
Es
×X
×X
XX
XM
inis
try
FE
s×
×X
XX
XX
Lin
ear
tim
etr
end
s×
××
×X
X×
Qu
adra
tic
tim
etr
end
s×
××
××
X×
Fle
xib
leti
me
tren
ds
××
××
××
XE
ffec
tS
ize
%25
2123
1717
1613
95%
CI
[10,4
0][8
,34]
[11,
36]
[6,2
8][7
,27]
[6,2
6][5
,21]
Ob
serv
atio
ns
3,05
73,
057
3,05
73,
057
3,05
73,
057
3,05
7R
20.
023
0.22
40.
166
0.33
60.
357
0.37
6A
dju
sted
R2
0.02
30.
166
0.15
80.
280
0.29
40.
307
0.33
9
Note
:M
od
els
1-6
rep
rese
nt
OL
Sfi
xed
-eff
ect
regr
essi
ons
for
the
per
iod
1997
-201
7.R
egre
ssio
nco
effici
ents
are
show
nw
ith
boots
trap
ped
rob
ust
stan
dar
der
rors
(clu
ster
edby
min
istr
y)
show
nin
par
enth
eses
.M
od
-el
s5
and
6in
clu
de
lin
ear
an
dqu
adra
tic
min
istr
y-s
pec
ific
tim
etr
end
sin
add
itio
nto
min
istr
yfi
xed
-eff
ects
an
dm
onth
fixed
-eff
ects
.M
od
el7
isa
GA
Mm
od
elin
clu
din
gn
on-p
aram
etri
c,m
inis
try-s
pec
ific,
flex
ible
tim
etr
end
s.T
he
“E
ffec
tS
ize”
row
ind
icat
esth
ep
erce
nta
gein
crea
sein
fem
ale
par
tici
pat
ion
rela
tive
toth
eav
erage
fem
ale
par
tici
pat
ion
rate
un
der
mal
em
inis
ters
.∗ p<
0.1;∗∗
p<
0.05
;∗∗∗ p<
0.01
S5

Tab
leS3:
Eff
ect
ofth
eap
poi
ntm
ent
ofa
fem
ale
min
iste
ron
fem
ale
par
tici
pat
ion
(rat
ioof
spee
ches
)
Rat
iosp
eech
es
(1)
(2)
(3)
(4)
(5)
(6)
(7)
Fem
ale
min
iste
r0.2
04∗∗∗
0.18
6∗∗∗
0.18
6∗∗∗
0.15
4∗∗∗
0.15
3∗∗∗
0.14
6∗∗∗
0.11
4∗∗∗
(0.0
62)
(0.0
63)
(0.0
47)
(0.0
53)
(0.0
51)
(0.0
49)
(0.0
38)
Con
stan
t0.8
65∗∗∗
0.41
2∗∗∗
0.69
6∗∗∗
0.23
7∗0.
570
2.23
42.
342
(0.0
46)
(0.1
10)
(0.1
78)
(0.1
39)
(4.5
12)
(1,1
81.4
58)
(5.5
65)
Mon
thF
Es
×X
×X
XX
XM
inis
try
FE
s×
×X
XX
XX
Lin
ear
tim
etr
end
s×
××
×X
X×
Qu
adra
tic
tim
etr
end
s×
××
××
X×
Fle
xib
leti
me
tren
ds
××
××
××
XE
ffec
tS
ize
%24
2222
1818
1713
95%
CI
[9,3
8][7
,36]
[11,
32]
[6,3
0][6
,29]
[6,2
8][5
,22]
Ob
serv
ati
on
s3,0
573,
057
3,05
73,
057
3,05
73,
057
3,05
7R
20.0
220.
136
0.15
50.
258
0.27
90.
299
Ad
just
edR
20.0
220.
072
0.14
60.
194
0.20
80.
222
0.25
8
Note
:M
od
els
1-6
rep
rese
nt
OL
Sfi
xed
-eff
ect
regr
essi
ons
for
the
per
iod
1997
-201
7.R
egre
ssio
nco
effici
ents
are
show
nw
ith
boots
trap
ped
rob
ust
stan
dar
der
rors
(clu
ster
edby
min
istr
y)
show
nin
par
enth
eses
.M
od
-el
s5
and
6in
clu
de
lin
ear
an
dqu
adra
tic
min
istr
y-s
pec
ific
tim
etr
end
sin
add
itio
nto
min
istr
yfi
xed
-eff
ects
an
dm
onth
fixed
-eff
ects
.M
od
el7
isa
GA
Mm
od
elin
clu
din
gn
on-p
aram
etri
c,m
inis
try-s
pec
ific,
flex
ible
tim
etr
end
s.T
he
“E
ffec
tS
ize”
row
ind
icat
esth
ep
erce
nta
gein
crea
sein
fem
ale
par
tici
pat
ion
rela
tive
toth
eav
erage
fem
ale
par
tici
pat
ion
rate
un
der
mal
em
inis
ters
.∗ p<
0.1;∗∗
p<
0.05
;∗∗∗ p<
0.01
S6

C. Details of the influence measurement procedure
I proceed in two steps: first, I construct similarity graphs for all speeches in each debate;second, I analyse the graphs using an iterative ranking algorithm to calculate a vector ofcentrality scores, P , which correspond to the influence of each speech in each debate.
Construction of a debate-specific similarity graph, Sd, begins with the selection of ametric which measures how linguistically similar two speeches are to one another. I repre-sent each speech as an N -dimensional term-frequency-inverse-document-frequency (tf-idf)vector, where N is the number of unique words in the corpus. Each element in the vector isa count of the number of times a given word, w, appears in a given speech, s, multiplied bythe logged inverse document frequency of that word, to create a weighted term-frequencyscore, vws, for each word in each speech. Where N is the total number of unique wordsin the corpus, nw is the number times that word w appears in the corpus, and tfws is thenumber times that word w appears in speech s, the score for w in s is given by:
vws = tfws ∗ log(N
nw
) (S4)
A high value of vws occurs when a word is used frequently in a given speech, but infre-quently in the corpus as a whole. The weights thus filter out very common words suchas ‘stopwords’, and ensure that the vector representation of the speeches mostly reflectstopically-salient features of the political debate.
Having calculated the tf-idf vectors for each speech in the corpus, I construct D simi-larity matrices (one for each debate), the typical element of which is: Sd(i, j) = sim(vi, vj),the cosine-similarity of the weighted word-count vectors of speeches i and j in debate d.Each graph (again, one for each debate) therefore consists of nodes that represent speechesin a debate, and edges which are placed between speeches for which sim(vi, vj) is greaterthan some threshold value, Smin.11 The edges are then weighted by the similarity scores.
The cosine-similarity relation is symmetric (i.e. because Sd(i, j) = Sd(j, i)) and thus it ispossible to construct either undirected (where edges between nodes run in both directionsand receive the same weight) or directed (where edges between nodes run in only onedirection) networks (Erkan and Radev, 2004). As I conceptualise influence as the degreeto which language used in one speech is adopted in subsequent speeches, it is necessary totake the temporal ordering of debate into account when constructing the graphical network.Put simply, it does not make sense for speeches that occur later in the debate to ‘influence’speeches that occur earlier in the debate. I therefore focus on only the upper triangle ofthe similarity matrices, Sd, while setting all elements in the lower triangle to zero. Theconsequence of this is that ‘references’ from one speech to another can only flow in onedirection: later speeches can reference earlier ones, but not vice versa. Using a directedgraph makes no difference to the computation of the influence scores (Mihalcea, 2004).
As described above, the influence of a speech is determined by the number of referencesit receives from other speeches within a debate (i.e. by the number of speeches which
11Throughout the analysis I set Smin to 0.25, in line with Fader et al. (2007).
S7

are linguistically similar to it), and by the influence of the referencing speeches. In thesimplified case where all edges receive a weight of 1, an intuitive way of formulating thisidea is to imagine that each speech has an influence value, and that this value to getsdistributed to the speeches that it references:
p(i) =∑
j∈adj(i)
p(j)
deg(j)(S5)
Where p(i) is the influence of speech i, adj(i) is the set of speeches that have edgeswith i, and deg(j) is the degree of node j (the degree of a node is simply the number ofedges that connects the node to other nodes). This formulation emphasises that a speech ismore influential when it is referenced by many other speeches (adj(i)), when the influenceof the referencing speeches (p(j)) increases, and when the referencing speeches referencerelatively few other speeches (deg(j)). Weighting the edges of the network by Sd(i, j) allowsreferences to vary in strength (according to the similarity between speeches i and j) andwe can reformulate equation S5 to include the weights in Sd via:
p(i) =∑
j∈adj(i)
Sd(i, j)∑k∈adj(j) Sd(k, j)
p(j) (S6)
Equation S6 makes clear that the reference that speech i receives from speech j is de-termined by the linguistic similarity between i and j (the numerator), and the similaritybetween j and all of the speeches that j references (the denominator). Fader et al. (2007)and Erkan and Radev (2004) show that computation of the vector of speech-level influencescores, P , is achieved by calculating the left eigenvector of the row-normalised similar-ity matrix Sd via the PageRank algorithm, which was originally designed for computingwebpage prestige in the Google search engine (Page et al., 1999).12 Finally, with thesespeech-influence scores in hand, as some MPs will speak multiple times in a debate, theinfluence score of an MP in a given debate is simply the sum of the influence scores p forthe speeches given by that MP in that debate.
D. HITS algorithm influence results
This section replicates the analysis in table 2 and figure 4 estimating P in equation S6using Kleinberg’s (1999) HITS algorithm. As table S4 and figure S3 show, the results aresubstantively and statistically very similar regardless of the estimation approach.
12Mihalcea (2004) shows that either the Kleinberg (1999) HITS algorithm and PageRank can be used tocalculate P and that both perform well in approximating human judgements. I present statistically andsubstantively similar results from the HITS algorithm in appendix section D. I implement both algorithmsusing the iGraph package in R (Csardi and Nepusz, 2006)
S8
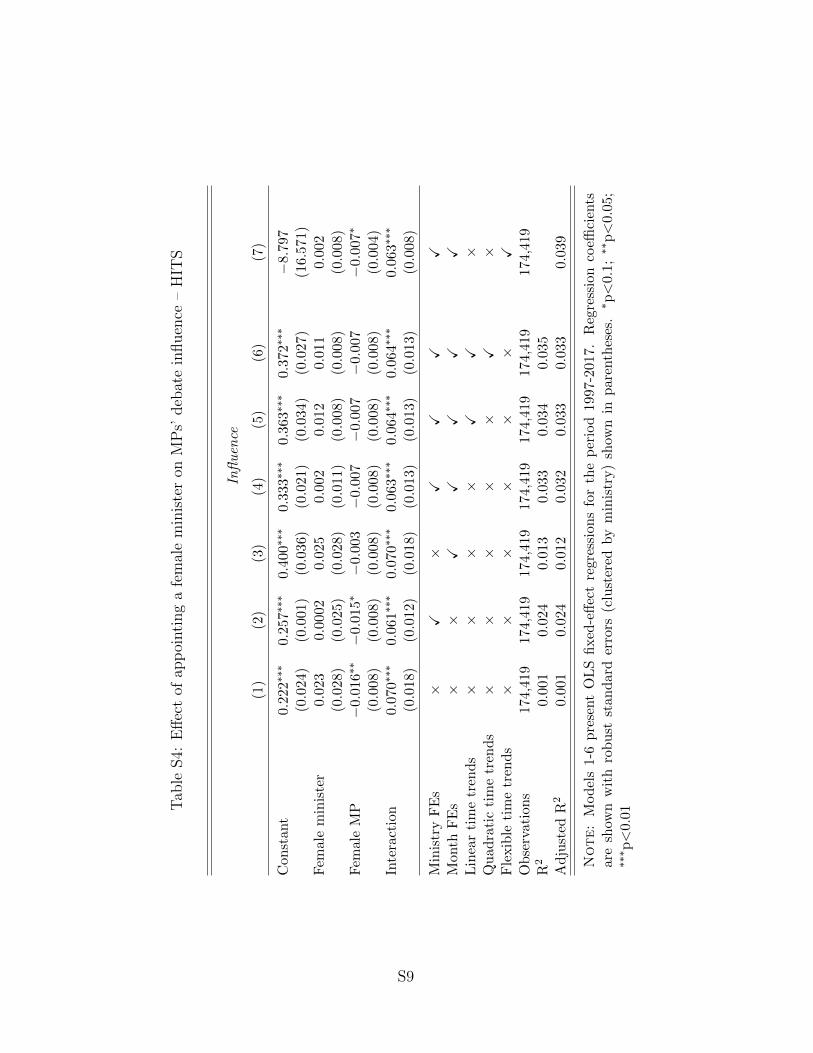
Tab
leS4:
Eff
ect
ofap
poi
nti
ng
afe
mal
em
inis
ter
onM
Ps’
deb
ate
influen
ce–
HIT
S
Infl
uen
ce
(1)
(2)
(3)
(4)
(5)
(6)
(7)
Con
stan
t0.2
22∗∗∗
0.25
7∗∗∗
0.40
0∗∗∗
0.33
3∗∗∗
0.36
3∗∗∗
0.37
2∗∗∗
−8.
797
(0.0
24)
(0.0
01)
(0.0
36)
(0.0
21)
(0.0
34)
(0.0
27)
(16.
571)
Fem
ale
min
iste
r0.
023
0.00
020.
025
0.00
20.
012
0.01
10.
002
(0.0
28)
(0.0
25)
(0.0
28)
(0.0
11)
(0.0
08)
(0.0
08)
(0.0
08)
Fem
ale
MP
−0.
016∗∗−
0.01
5∗−
0.00
3−
0.00
7−
0.00
7−
0.00
7−
0.00
7∗
(0.0
08)
(0.0
08)
(0.0
08)
(0.0
08)
(0.0
08)
(0.0
08)
(0.0
04)
Inte
ract
ion
0.0
70∗∗∗
0.06
1∗∗∗
0.07
0∗∗∗
0.06
3∗∗∗
0.06
4∗∗∗
0.06
4∗∗∗
0.06
3∗∗∗
(0.0
18)
(0.0
12)
(0.0
18)
(0.0
13)
(0.0
13)
(0.0
13)
(0.0
08)
Min
istr
yF
Es
×X
×X
XX
XM
onth
FE
s×
×X
XX
XX
Lin
ear
tim
etr
end
s×
××
×X
X×
Qu
adra
tic
tim
etr
end
s×
××
××
X×
Fle
xib
leti
me
tren
ds
××
××
××
XO
bse
rvat
ion
s174
,419
174,
419
174,
419
174,
419
174,
419
174,
419
174,
419
R2
0.00
10.
024
0.01
30.
033
0.03
40.
035
Ad
just
edR
20.
001
0.02
40.
012
0.03
20.
033
0.03
30.
039
Note:
Mod
els
1-6
pre
sent
OL
Sfi
xed
-eff
ect
regr
essi
ons
for
the
per
iod
1997
-201
7.R
egre
ssio
nco
effici
ents
are
show
nw
ith
rob
ust
stan
dard
erro
rs(c
lust
ered
by
min
istr
y)
show
nin
par
enth
eses
.∗ p<
0.1;∗∗
p<
0.05
;∗∗∗ p<
0.01
S9

Figure S3: Marginal effect of female minister on male and female influence – HITS
Note: The plot shows the marginal effect of the appointment of a female cabinet minister on the debateinfluence of male (orange lines) and female (blue lines) MPs, relative to the average level of influence whenthe minister is male.
E. Validating influence scores
I test two relatively unambiguous intuitions about which actors in the House of Commonswe expect to be influential in parliamentary debate.13 First, government ministers should beon average more influential than other MPs when participating in plenary debate. Ministersplay a crucial role in setting the agenda for parliamentary business, and their speeches arefrequently used to outline policy that we would expect others to comment on extensively.Second, the Speaker of the House should be on average less influential than other members.The majority of the Speaker’s contributions are procedural, having little to do with thesubstantive matters under discussion, and should not be referenced frequently by othermembers. I test these expectations by regressing the influence score on binary indicatorsfor whether an MP is either the cabinet minister responsible for the current debate, orthe Speaker. The results, presented in table S5 in the appendix, strongly support theexpectations: cabinet ministers are on average 5 times more influential than backbenchMPs, while the Speaker is less than half as influential as backbenchers.
In addition, we can also compare the influence score of an MP to how many directreferences that MP receives during a debate. MPs follow strict conventions when directlyreferring to other members as they must not use the names of their colleagues, but insteadrefer to the “Member for Holborn and St Pancras” or the “Honourable Member for Taunton
13Fader et al. (2007) have shown previously that these influence scores calculated for speeches made inthe US Senate correlate strongly with membership and seniority in Senate legislative committees.
S10
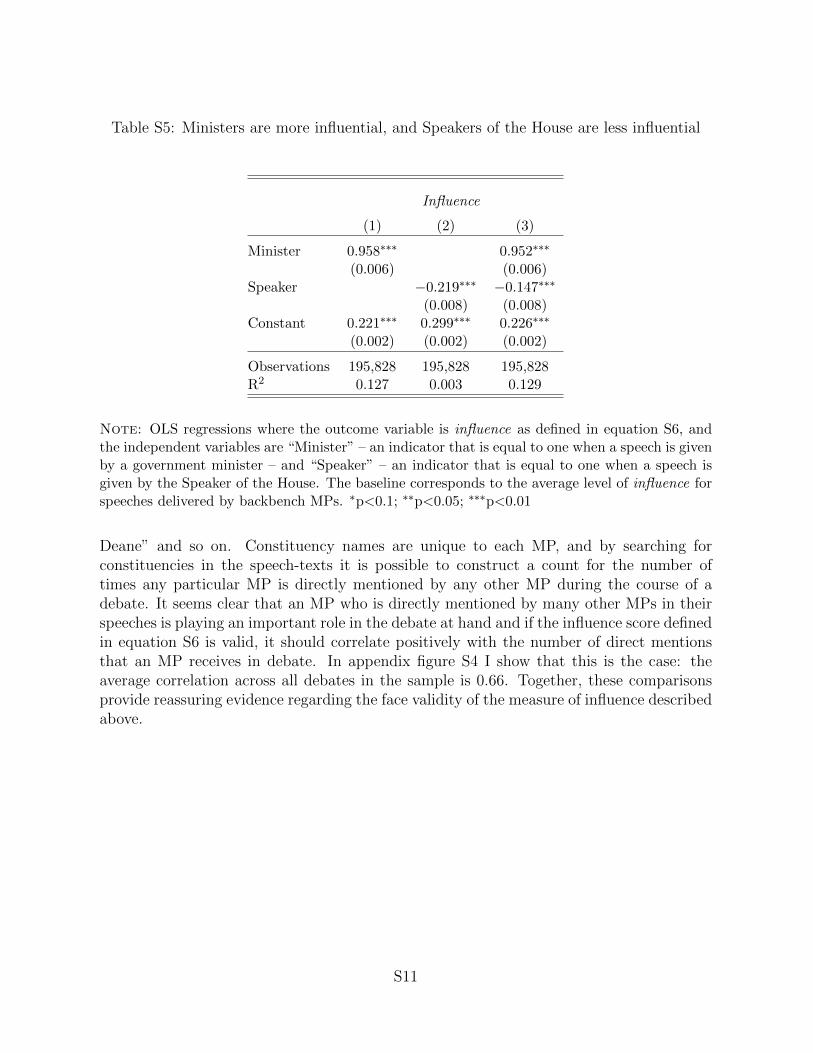
Table S5: Ministers are more influential, and Speakers of the House are less influential
Influence
(1) (2) (3)
Minister 0.958∗∗∗ 0.952∗∗∗
(0.006) (0.006)Speaker −0.219∗∗∗ −0.147∗∗∗
(0.008) (0.008)Constant 0.221∗∗∗ 0.299∗∗∗ 0.226∗∗∗
(0.002) (0.002) (0.002)
Observations 195,828 195,828 195,828R2 0.127 0.003 0.129
Note: OLS regressions where the outcome variable is influence as defined in equation S6, andthe independent variables are “Minister” – an indicator that is equal to one when a speech is givenby a government minister – and “Speaker” – an indicator that is equal to one when a speech isgiven by the Speaker of the House. The baseline corresponds to the average level of influence forspeeches delivered by backbench MPs. ∗p<0.1; ∗∗p<0.05; ∗∗∗p<0.01
Deane” and so on. Constituency names are unique to each MP, and by searching forconstituencies in the speech-texts it is possible to construct a count for the number oftimes any particular MP is directly mentioned by any other MP during the course of adebate. It seems clear that an MP who is directly mentioned by many other MPs in theirspeeches is playing an important role in the debate at hand and if the influence score definedin equation S6 is valid, it should correlate positively with the number of direct mentionsthat an MP receives in debate. In appendix figure S4 I show that this is the case: theaverage correlation across all debates in the sample is 0.66. Together, these comparisonsprovide reassuring evidence regarding the face validity of the measure of influence describedabove.
S11

Figure S4: Correlation of speech ‘influence’ and direct mentions
Note: The plot shows the average correlation between the influence of an MP and the number of timesthat that MP was directly mentioned by other members measured at the debate level across all years inthe sample. In line with expectations, influence is strongly positively correlated with direct mentions.
S12

Figure S5: Correlation of speech ‘influence’ with speech length and debate position
Note: The left panel shows the average correlation between the length of a speech and influence measuredat the debate level across all years in the sample. The right panel shows the equivalent correlation betweenspeech position and influence.
F. Validating responsiveness scores
First, within a debate, MPs might use similar words even when they are not responding toone another. Debates are normally focussed on a small number of topics, the discussion ofwhich will lead MPs to use similar language regardless of whether they are talking directlyto one another. However, if the measure defined in equation 6 captures responsiveness, andnot merely topicality, then speeches that are adjacent to one another should demonstratehigher responsiveness scores than speeches that are not adjacent. Table S6 in the appendixtests this hypothesis. From each debate in the corpus, I randomly sample two speech pairs.One of the pairs is adjacent, and one is non-adjacent. I then regress the responsivenessscore on a binary indicator which is equal to one for an adjacent pair of speeches, andzero otherwise. The coefficient on this indicator is statistically significant, and implies thatadjacent speeches are approximately 30% more responsive than non-adjacent speeches. Thisprovides strong evidence that equation 6 is capturing something distinct from topicality:comparing pairs of speeches within the same debate, those speeches that follow directlyafter each other are more responsive than speeches that are non-adjacent.
Second, in a subset of debates, government ministers go before the House to field ques-tions from backbenchers, and are required to provide answers to these questions. In these‘Question Time’ debates, questions by backbenchers need not address the same topic asthe question just answered by the minister. For example, a first backbencher might ask the
S13

Table S6: Adjacent speeches are more responsive than non-adjacent speeches
res
Adjacent 8.133∗∗∗
(1.163)Constant 27.898∗∗∗
(0.823)
Observations 21,604R2 0.002
Note: OLS regression for adjacent and non-adjacent speeches (within a debate). Regressioncoefficients are shown with standard errors in parentheses. The outcome variable is res as definedin equation 6, and the independent variable is an indicator that is equal to one when a given pairof speeches occupy adjacent positions in the debate. The baseline corresponds to speeches thatare non-adjacent. ∗p<0.1; ∗∗p<0.05; ∗∗∗p<0.01
minister about schools, to which the minister will provide an answer, and then a secondbackbencher might ask about child care provision, to which the minister must also respond.In these debates, we should therefore expect that when a minister’s speech follows a back-bencher, that speech should be more responsive than when a backbencher’s speech followsthat of a minister. For each speech in each ‘Question Time’ debate, I code whether thespeech is made by a minister responding to a backbencher, or a backbencher asking a newquestion.14 I then regress the responsiveness score on a binary indicator which is equalto one when the speech is made by a minister in response to a backbencher. The resultsin table S7 show that ministerial replies are more than twice as responsive than are ques-tions posed by backbenchers to the minister. This indicates that the measure is accuratelyrecovering intuitive properties of the concept of responsiveness.
14I exclude all instances where a backbencher follows from another backbencher.
S14

Table S7: Minister and backbencher responsiveness
res
Minister responding to backbencher 10.036∗∗∗
(0.167)Constant 10.028∗∗∗
(0.121)
Observations 152,683R2 0.023
Note: OLS regressions for 9927 “question time” debates. Regression coefficients are shownwith standard errors in parentheses. The outcome variable is res as defined in equation 6. Theindependent variable is an indicator that is equal to one when a speech is spoken by a minister,and comes immediately after a speech by a backbencher. The baseline corresponds to backbenchspeeches that follow directly after a speech by a minister. ∗p<0.1; ∗∗p<0.05; ∗∗∗p<0.01
G. Strategic appointment of female shadow ministers
To investigate the hypothesis that opposition parties may respond strategically to theappointment of a female government minister by appointing a female shadow minister to theopposition cabinet, I analyse the relationship between the sex of a newly appointed shadowminister and the sex of the current government minister. I estimate this relationship usinglogit models of the following form:
logit(E[ShadowFemaleMinistermt]) = α + β1 ∗ FemaleMinistermt + λm + εmt
where ShadowFemaleMinistermt is equal to one when the shadow minister appointed toministry m at time t is a woman, and zero otherwise. FemaleGovernmentMinister isequal to one when the government minister responsible for a given ministry m in time tis a woman, and zero otherwise. λm is a ministry fixed effect. If opposition parties areresponding strategically to the sex of the government minister in a given ministry, then theβ1 coefficient will be positive, indicating that the probability of appointing a female shadowminister is associated with the sex of the current cabinet minister for that ministry. Theresults of these regressions are given in table S8.
While the coefficient on the ‘female government minister’ variable are positive in bothmodels, these effects are imprecisely estimated, and statistically indistinguishable fromzero. This suggests that it is unlikely that the effects documented in the main analysis aredriven by the strategic appointment of female shadow ministers by opposition parties.
S15

Table S8: Probability that a female shadow minister will be appointed, conditional on thesex of the current government minister
Female shadow minister
(1) (2)
Female government minister 0.141 0.504(0.456) (0.659)
Constant −1.288∗∗∗ −0.504(0.399) (1.560)
Ministry FEs No YesObservations 149 149
Note: ∗p<0.1; ∗∗p<0.05; ∗∗∗p<0.01Logit model
H. Differential agenda-setting of male and female ministers
The main idea here is to measure the topical content of the issues under discussion indebate, and to evaluate whether topics which are associated with high levels of femaleparticipation (when the minister is male) increase when a female minister is appointed. Inorder to measure the topical content of the legislation under debate, I focus on the speechesmade by ministers during each debate, rather than the speeches made by all members. Inmany cases, debates begin with a long opening statement by the minister, in which theyput forward the purpose and detail of the legislation to be considered by the House. Asthe content of speeches made by other members may itself be a result of the appointmentof a female minister, these speeches provide a useful resource for estimating the agendaproposed by the ministers.
I proceed in four steps. First, I estimate a series of topic models to produce debate-level topic proportions for all debates in the sample. These proportions indicate the topicalcontent of each debate, and give a basis on which to find thematically similar debatesunder both male and female ministers. Second, I use the topic proportions for debateswhich are held under male ministers as explanatory variables in linear regressions, wherethe dependent variable is the ratio of words spoken by women as defined in equationS1. The coefficients from these regressions indicate the degree to which each latent topicis traditionally associated with female participation in debate. Third, in a second setof linear regressions, I estimate the relationship between the prevalence of a topic andthe sex of a minister. The coefficients from these regressions indicate whether a topicincreases or decreases when the minister is female. Finally, I compare the two sets ofregression coefficients. If the agenda-setting hypothesis is correct, there should be a positivecorrelation between these two sets of coefficients: topics that are traditionally associated
S16

Tab
leS9:
Eff
ect
ofap
poi
nti
ng
afe
mal
em
inis
ter
onfe
mal
edeb
ate
par
tici
pat
ion
–sh
adow
min
iste
rsex
cluded
Pro
pW
ord
sWom
en
(1)
(2)
(3)
(4)
(5)
(6)
(7)
Fem
ale
min
iste
r0.
035∗∗
0.03
4∗∗
0.03
7∗∗∗
0.03
5∗∗∗
0.04
3∗∗∗
0.03
6∗∗∗
0.03
1∗∗∗
(0.0
15)
(0.0
14)
(0.0
14)
(0.0
13)
(0.0
08)
(0.0
11)
(0.0
07)
Con
stan
t0.1
69∗∗∗
0.10
7∗∗∗
0.13
5∗∗
0.08
5∗∗
0.10
7−
0.04
30.
076
(0.0
06)
(0.0
25)
(0.0
52)
(0.0
38)
(1.1
62)
(160
.703
)(0
.181
)
Mon
thF
Es
×X
×X
XX
XM
inis
try
FE
s×
×X
XX
XX
Lin
ear
tim
etr
end
s×
××
×X
X×
Qu
adra
tic
tim
etr
end
s×
××
××
X×
Fle
xib
leti
me
tren
ds
××
××
××
XE
ffec
tS
ize
%21
2022
2125
2118
95%
CI
[4,3
8][4
,37]
[6,3
8][5
,36]
[16,
35]
[8,3
4][1
0,27
]O
bse
rvat
ion
s3,
234
3,23
43,
234
3,23
43,
234
3,23
43,
234
R2
0.01
40.
119
0.13
50.
231
0.25
60.
281
Ad
just
edR
20.
013
0.05
70.
126
0.16
90.
187
0.20
60.
224
Note:
Mod
els
1-6
rep
rese
nt
OL
Sfi
xed
-eff
ect
regr
essi
ons
for
the
per
iod
1997
-201
7w
ith
shad
owm
inis
ters
excl
ud
edfr
om
the
data
.R
egre
ssio
nco
effici
ents
are
show
nw
ith
boot
stra
pp
edcl
ust
er-r
obu
stst
and
ard
erro
rs(c
lust
ered
by
min
istr
y)
show
nin
par
enth
eses
.∗ p<
0.1;∗∗
p<
0.05
;∗∗∗ p<
0.01
S17

with female participation will increase when the minister is female. Such a finding wouldsuggest that female ministers are indeed focussing on topics that are more conducive tofemale participation in legislative debate.
I start by applying a series of unsupervised topic models to all speeches made by min-isters in the entire sample. I use the Correlated Topic Model (Blei and Lafferty, 2006),which, as with all topic models, assumes that the frequency with which terms co-occurwithin different documents (here, debates) gives information about the topics that featurein those documents. The key quantity of interest recovered from the CTM is θ, which is aT x D matrix of topic proportions that describe the fraction of each ministerial statementd ∈ {1, 2, ..., D} that is from each topic t ∈ {1, 2, ..., T}. Analysts must choose how manytopics to estimate from the data, and because the ‘correct’ number of topics is unclear, apriori, I estimate K topic models for a range of topic counts from 20 to 60, at 10 topic in-crements. This results in 5 separate θk matrices, with typical elements θktd: the proportionof ministerial-statement d in topic t from topic-model k.
I then use each θk matrix as the model matrix15 for a linear regression predicting Yd,the female speech ratio in debate d. As the goal of this first-stage model is to establish abaseline level of female participation associated with each topic, I estimate this model onlyfor those debates where the presiding minister is male. I repeat this exercise K times, oncefor each topic model.
Yd = bk1θk1d + bk2θk2d + ...+ bkT θkTd + εd (S7)
The estimated b coefficients represent the degree to which each topic (collection ofwords) is associated with female participation in debates, holding other topics constant.An example of the substantive information that these coefficients contain is clear fromtable S10 , which contains each topic from the 30 topic model, ordered by their respectiveb coefficients. Reassuringly, the topics with the largest b coefficients deal primarily withtopics that match intuitive notions of female interests, including children, parents, andwomen’s issues. Additionally, women appear relatively more likely to contribute to debatesthat focus on the NHS, teachers and schools, and energy issues.
Next, I estimate a series of regressions to establish which topics are more prevalentunder female ministers. As we are concerned here with establishing the differences inagenda-setting within government ministries, I estimate models of the following form:
θktd(m) = α + γkt ∗ FemaleMinisterd + λm + εktd (S8)
Where θktd(m) is the proportion of debate-text d (in ministrym) devoted to topic t from topicmodel k. FemaleMinisterd is a binary variable equal to one when debate d is presided overby a female minister, and λm is a ministry fixed effect. The model is estimated separatelyfor each topic, and, as in the previous step, I repeat this exercise for each of the 5 topicmodels. The estimation therefore results in K vectors of γt coefficients – one coefficient for
15The topic proportions for each statement (θkd) sum to one, and so I could exclude one of the topics orthe intercept term. I choose to exclude the intercept term.
S18

Table S10: Topics ordered by their association with female participation under male min-isters
Topic beta
child women children disabl parent famili employ 1.330nhs patient clinic doctor hospit gps trust 0.968
speech opposit chamber bench conserv liber lord 0.944debat motion monday thursday committe tuesday wednesday 0.834
local author flood council grant area fund 0.789look sure absolut import think see right 0.766
carbon energi emiss gas climat electr renew 0.758rail railway passeng transport railtrack airport road 0.677
teacher school pupil student educ teach academi 0.653bank deficit labour tax budget chancellor economi 0.582
offend sentenc prison crime polic offenc victim 0.578role bbc process approach white relationship detail 0.569
refuge humanitarian zimbabw syria pakistan syrian isil 0.545sport olymp scottish scotland footbal game lotteri 0.522
amend claus bill committe provis legisl draft 0.451post compani manufactur busi industri enterpris small 0.443
pension incom credit minimum retir payment earn 0.441health servic treatment wait cancer nurs extra 0.375
inquiri investig report sir alleg inform recommend 0.366farmer anim farm vaccin outbreak diseas agricultur 0.363
immigr asylum court appeal terror card ident 0.360global aid develop world india africa debt 0.355
saddam palestinian iran israel iraq resolut weapon 0.200troop afghanistan afghan armi defenc deploy nato 0.167
wale welsh assembl elector devolut elect referendum 0.108think tri thing say reason let problem 0.065
treati europ european union negoti enlarg britain 0.026ireland northern paramilitari irish agreement decommiss ira -0.004
cent per conserv cut spend billion rise -0.166awar matter certain understand although concern gentleman -0.272
S19

each topic, in each topic model. When γkt is positive, this implies that the use of the topicincreases when a female minister is appointed, and when it is negative it suggests that theuse of the topic decreases on the appointment of a female minister.
Equations S7 and S8 therefore result in two vectors of coefficients: bk gives the relation-ship between each of the topics in topic model k and the level of female debate participationunder male ministers, and γk indicates how much each of the same topics in topic modelk increases (or decreases) when a female minister is appointed. Assessing the correlationbetween these coefficient vectors allows us to test whether female ministers introduce legis-lation that focusses on topics which are associated with high levels of female participationunder male ministers. Thus, to test the agenda-setting hypothesis, I regress the estimatedb coefficients from equation S7 on the γ coefficients from equation S8 according to:
bt(k) = α + ζk ∗ γt(k) + εt(k) (S9)
If the agenda-setting hypothesis is correct, then the bt(k) and γt(k) coefficients should bepositively correlated, indicating that high female-participation topics (under male minis-ters) play a more prominent role on the policy agenda when a female minister is appointed.That is, we expect the ζk coefficient from equation S9 to be positive. Such a finding wouldcontradict the legislative role-model hypothesis, as it would suggest that the increased lev-els of legislative participation documented in the main results section could be attributedto the development of an increasingly ‘female-friendly’ agenda under female ministers. Ipresent the estimated ζk coefficients – one for each of the topic models – in figure S6 alongwith their associated 95% confidence intervals.
Figure S6 provides no clear evidence that female ministers focus more attention ontopics that are traditionally marked by high levels of female participation. As none of theslopes is statistically significant at traditional levels, the plot suggests that it is unlikelythat changes to the legislative agenda are responsible for the changes in female participationdocumented in the main text.
S20

Figure S6: There is no increase in the use of ‘female friendly’ topics on the parliamentaryagenda when a female minister is appointed.
Note: The graph plots, on the x-axis, the number of topics, and on the y-axis, the estimated ζ coefficientsfrom equation S9. There is no clear evidence that when female ministers are appointed, they focus moreon topics that are traditionally popular with other female MPs.
S21