Legion Tools - theory.stanford.edu
24
Legion Tools Thiago Teixeira Legion Project Retreat 2021-06-14
Transcript of Legion Tools - theory.stanford.edu

Legion Tools
Thiago Teixeira
Legion Project Retreat2021-06-14

Legion Tools● Legion-Prof
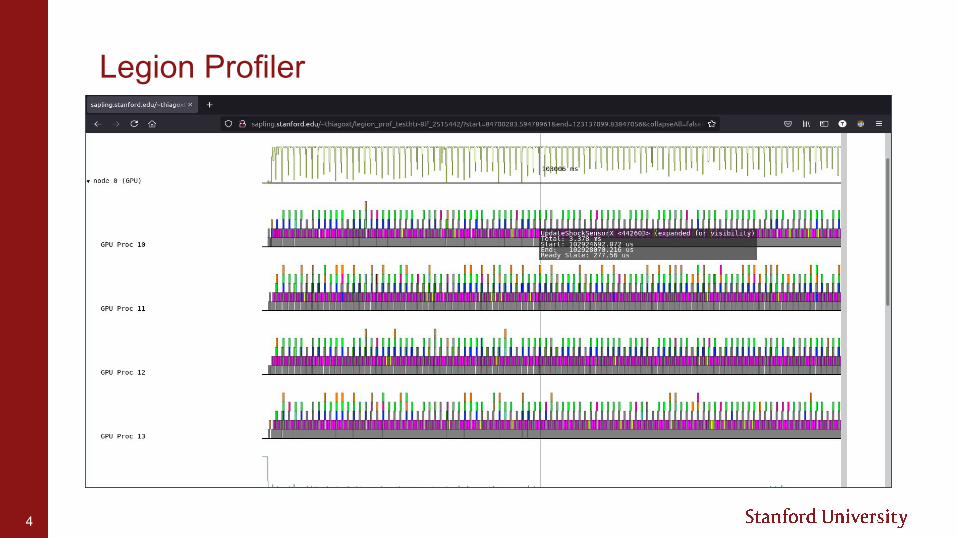
○ Interactive profile that displays information about the run○ Embedded in all builds by default, just run with -lg:prof
● Legion-Spy○ Visualization tool for task dependencies○ Sanity check and cross-check the runtime captured dependencies
● Automap○ Automatically search for mappings○ Mapping is a complicated task
2
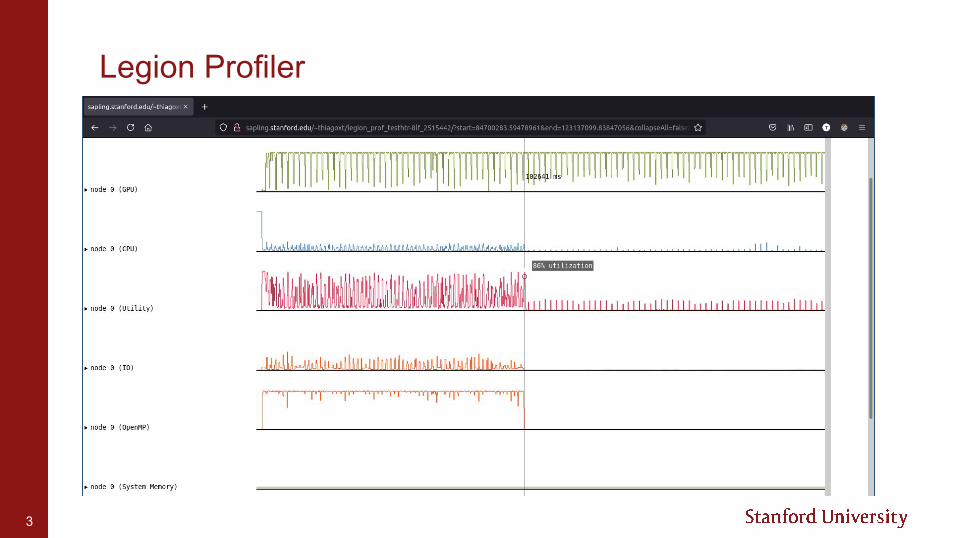
Legion Profiler
3
Legion Profiler
4

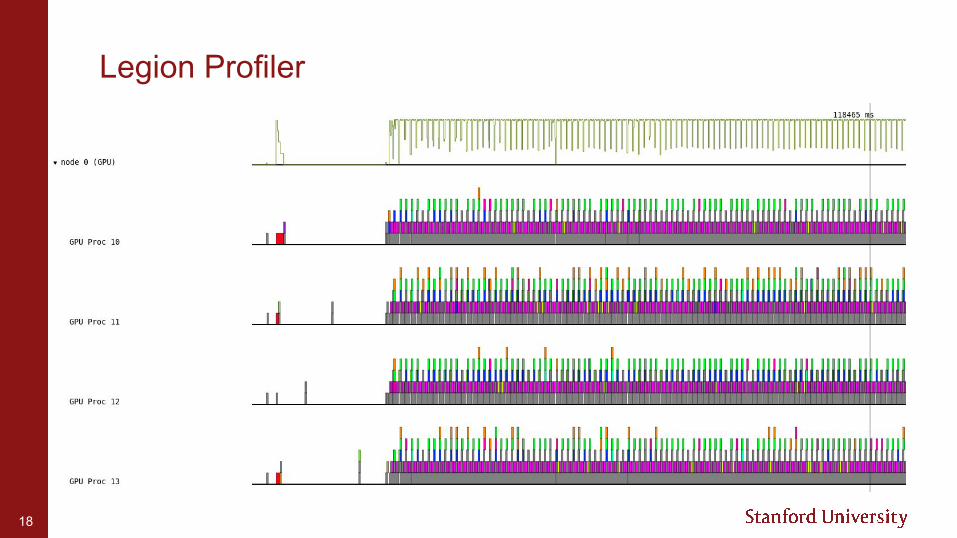
New Legion Profiler by Andrew Lee and Elliott Slaughter
● Implemented in Rust ○ 10-35x faster than current implementation (even with PyPy)○ Uses about 50% less memory
● Compatibility with existing Legion Prof○ Utilization (processors, channels, memories): fully supported
■ Bitwise identical to current profiler○ Detailed view (processors, channels): very nearly fully supported
■ Bitwise identical except in some internal ID fields and initiation dependencies
○ Instances: not (yet) supported○ “Plug-ins” (critical path, etc.): not (yet) supported
5

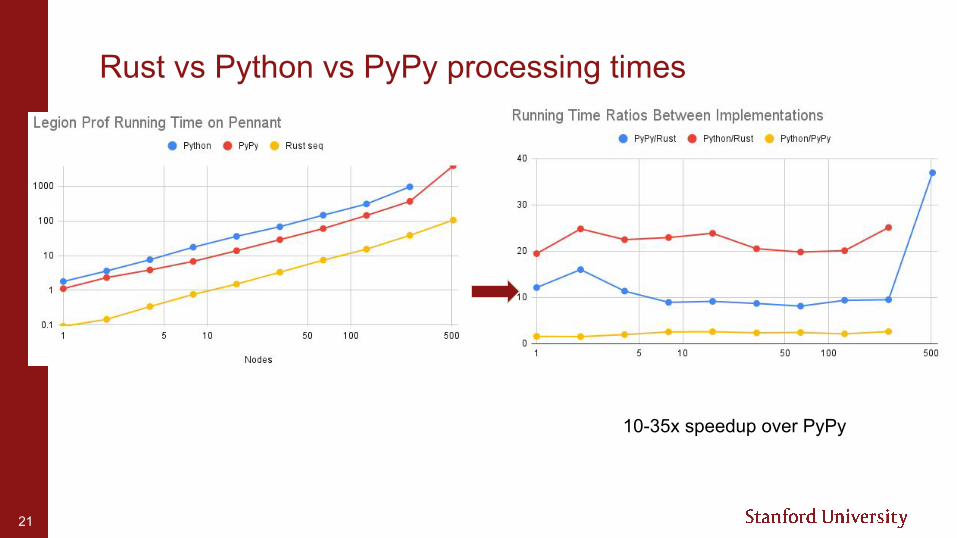
Rust vs Python vs PyPy processing times
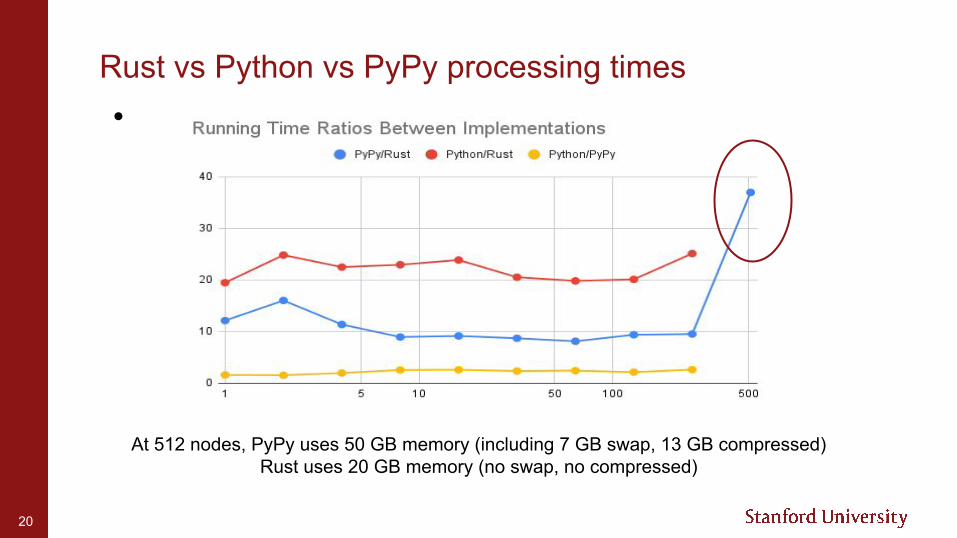
10-35x speedup over PyPyAt 512 nodes, PyPy uses 50 GB memory (including 7 GB swap, 13 GB compressed)Rust uses 20 GB memory (no swap, no compressed)
6
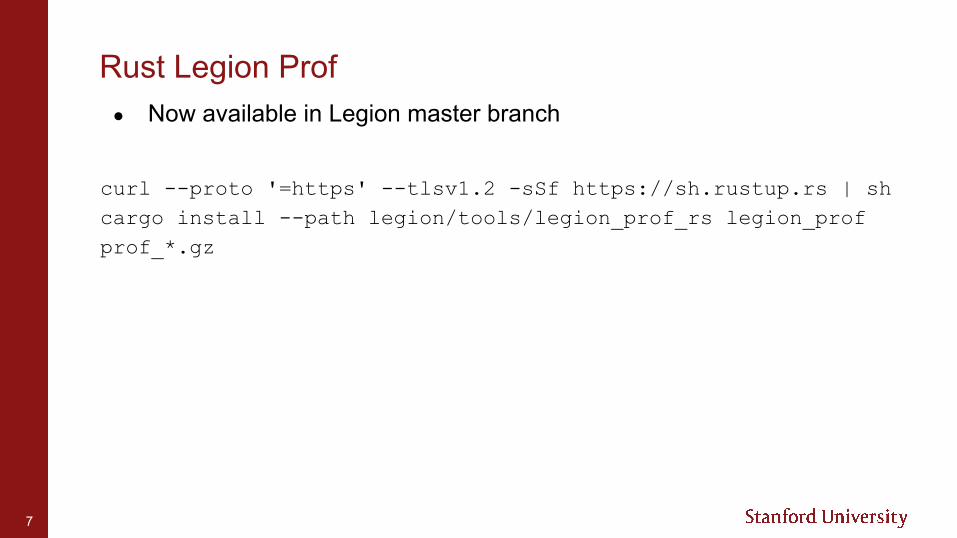
Rust Legion Prof● Now available in Legion master branch
curl --proto '=https' --tlsv1.2 -sSf https://sh.rustup.rs | sh cargo install --path legion/tools/legion_prof_rs legion_prof prof_*.gz
7

Legion Spy● Useful for understanding application’s task dependencies ● Critical for debugging the Legion runtime ● Future work: improve scalability
8

Automap with Alexandra Henzinger, Rohan Yadav, and Alex Aiken
● Mapping decides where to place ○ tasks (e.g., CPU, GPU) ○ data (e.g., System, Frame-buffer, Zero-copy, RDMA)
● Mapping can become quite complicated!
● Requires significant knowledge about the system and the application ○ Impact of placement decisions on data movement○ Reasoning about capacity constraints
■ How many regions will fit in the frame buffer?
● Often benefit by tailoring decisions to specific machine and configuration used
9
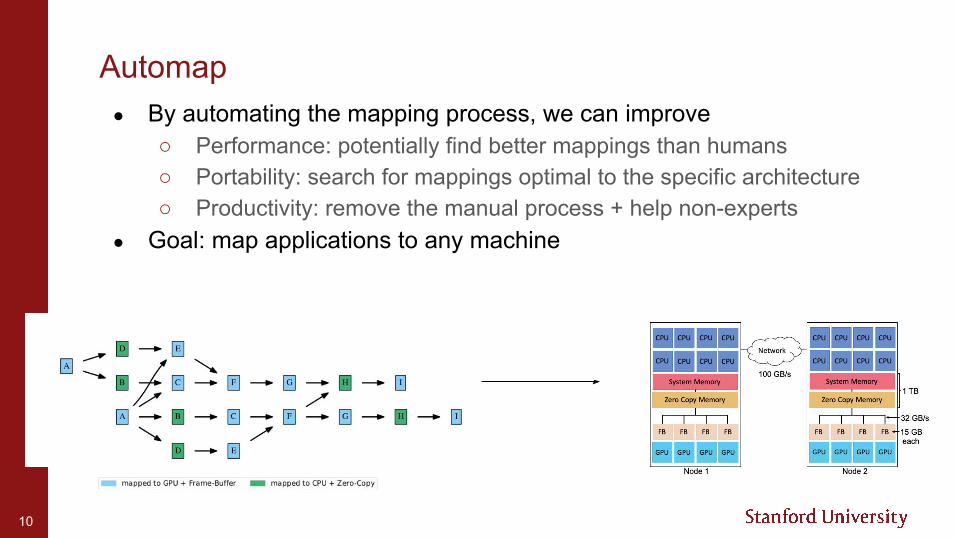
Automap● By automating the mapping process, we can improve
○ Performance: potentially find better mappings than humans ○ Portability: search for mappings optimal to the specific architecture ○ Productivity: remove the manual process + help non-experts
● Goal: map applications to any machine
10
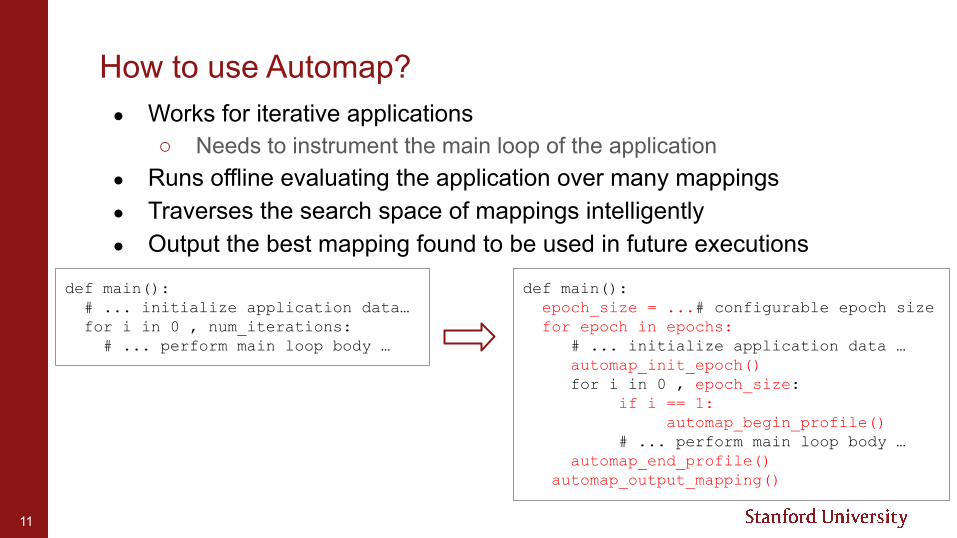
How to use Automap?● Works for iterative applications
○ Needs to instrument the main loop of the application● Runs offline evaluating the application over many mappings● Traverses the search space of mappings intelligently ● Output the best mapping found to be used in future executions
def main(): epoch_size = ...# configurable epoch size for epoch in epochs:
# ... initialize application data …automap_init_epoch()for i in 0 , epoch_size:
if i == 1:automap_begin_profile()
# ... perform main loop body …automap_end_profile()
automap_output_mapping()
def main(): # ... initialize application data… for i in 0 , num_iterations: # ... perform main loop body …
11

Automap Results● Stencil: 2D structured stencil● Circuit: sparse circuit simulation using unstructured graphs ● MiniAero: proxy-app for an explicit solver for compressible
Navier-Stokes equations● Pennant: unstructured mesh proxy-app for simulating Lagrangian
hydrodynamics
12

Automap Results● Single node of Sapling (2 Tesla C2070 GPUs + 2 Intel Xeon 5680 CPUs)
○ Circuit (same as hand-tuned mapper): ■ some shared regions moved to Zero-Copy memory
○ MiniAero: ■ moves 3/9 tasks from GPUs onto CPUs
○ Pennant (same as hand-tuned mapper): ■ some shared regions moved to Zero-Copy memory ■ some tasks moved onto CPUs
● These mappings are good only on Sapling○ 2x slower on another machine ...
13
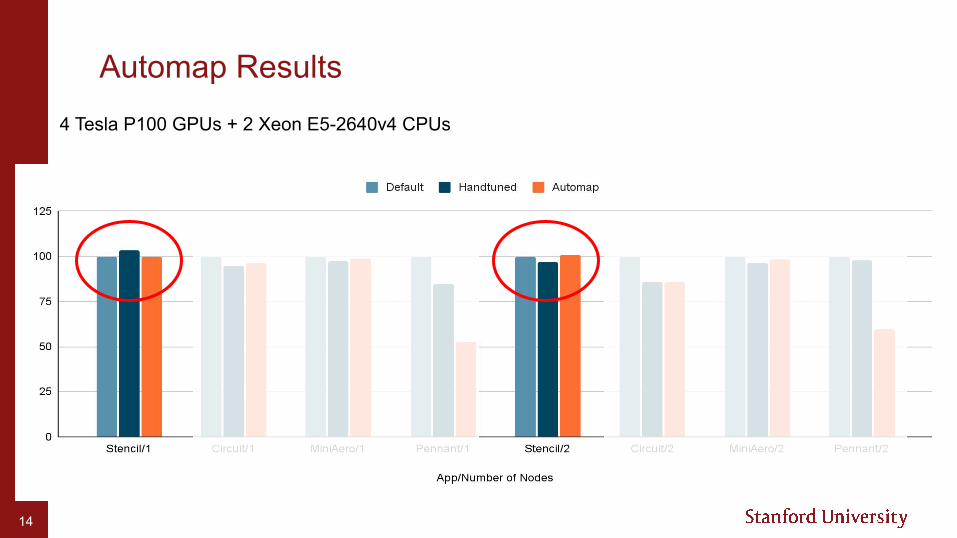
Automap Results4 Tesla P100 GPUs + 2 Xeon E5-2640v4 CPUs
14

Automap Results●
48% 40%
4 Tesla P100 GPUs + 2 Xeon E5-2640v4 CPUs
15

Automap● Advantages:
○ produce mappings much faster than humans○ mappings are tuned to application, machine, and input size
● Still under development ○ Contact me if interested in trying it out
16
Legion Profiler
18

Legion Profiler
19
Rust vs Python vs PyPy processing times●
At 512 nodes, PyPy uses 50 GB memory (including 7 GB swap, 13 GB compressed)Rust uses 20 GB memory (no swap, no compressed)
20
Rust vs Python vs PyPy processing times●
10-35x speedup over PyPy
21

Rust vs Python vs PyPy processing times●
At 512 nodes, PyPy uses 50 GB memory (including 7 GB swap, 13 GB compressed)Rust uses 20 GB memory (no swap, no compressed)
22

Automap Search● Search space: whether to distribute, a kind of processor, a kind of
memory for each region ○ high dimensional, difficult space to search over ○ some dimensions are correlated, others aren’t ○ application specific
● 4 Algorithms: ○ Greedy Hill Climbing with random restarts (GHC) ○ Monte Carlo Markov Chain (MCMC) ○ Coordinate-Wise Descent (CD) ○ Constrained Coordinate-Wise Descent (CCD)
■ application's dependence graph is used to constrain the search
23
Automap Search● Search space: whether to distribute, a kind of processor, a kind of
memory for each region ○ high dimensional, difficult space to search over ○ some dimensions are correlated, others aren’t ○ application specific
24