Legacy Carriers’ Use of Regional Airlines: Competition or ...
23
Legacy Carriers’ Use of Regional Airlines: Competition or Entry Deterrence? * Kerry M. Tan † October 2015 Abstract This paper investigates whether outsourcing by legacy carriers to regional airlines is pro- competitive or anti-competitive. Legacy carriers are more inclined to switch to regional airlines on routes where a low-cost carrier exists, subsequently decreasing their average airfare. How- ever, low-cost carriers are not effectively deterred from entering routes where a regional airline is present. The results refute the notion made in the existing literature that regional airlines can serve as an effective barrier to entry to low-cost carriers, rather suggesting that legacy carriers exploit the more cost-efficient regional airlines in order to lower prices and better compete with low-cost carriers. JEL classifications: L93, L11 * I would like to thank Matt Lewis, Jim Peck, Huanxing Yang, Stephen J.K. Walters, as well as seminar participants at The Ohio State University, the Southern Economic Association Annual Meeting, and the International Industrial Organization Conference for their helpful suggestions and comments. All errors are my own. † Economics Department, Loyola University Maryland, 4501 N. Charles St, Baltimore, MD 21204 1
Transcript of Legacy Carriers’ Use of Regional Airlines: Competition or ...

Legacy Carriers’ Use of Regional Airlines:
Competition or Entry Deterrence?∗
Kerry M. Tan†
October 2015
Abstract
This paper investigates whether outsourcing by legacy carriers to regional airlines is pro-competitive or anti-competitive. Legacy carriers are more inclined to switch to regional airlineson routes where a low-cost carrier exists, subsequently decreasing their average airfare. How-ever, low-cost carriers are not effectively deterred from entering routes where a regional airlineis present. The results refute the notion made in the existing literature that regional airlines canserve as an effective barrier to entry to low-cost carriers, rather suggesting that legacy carriersexploit the more cost-efficient regional airlines in order to lower prices and better compete withlow-cost carriers.
JEL classifications: L93, L11
∗I would like to thank Matt Lewis, Jim Peck, Huanxing Yang, Stephen J.K. Walters, as well as seminar participantsat The Ohio State University, the Southern Economic Association Annual Meeting, and the International IndustrialOrganization Conference for their helpful suggestions and comments. All errors are my own.
†Economics Department, Loyola University Maryland, 4501 N. Charles St, Baltimore, MD 21204
1

1 Introduction
Legacy carriers have recently become much more reliant on regional airlines to provide servicefor passengers within their route network. The number of passengers flown by regional airlineswithin the United States has increased from 6.56 million in 1998 to 36.5 million in 2009, largelydue to growth in outsourcing by legacy carriers during this time period. Under these arrangements,planes are owned by the regional airlines but are painted to resemble the legacy carrier’s fleet;flight crews are employed by the regional airline yet the legacy carrier is responsible for ticketingand operations at the airport. Such arrangements enable legacy carriers to benefit from regionalairlines’ lower labor costs. For example, Hirsch (2007) found that senior pilots and flight attendantsat United Airlines make 80 percent more and 32 percent more, respectively, than their counterpartsat regional airlines. This paper assesses the competitive effect of these outsourcing agreementsbetween legacy carriers and their regional airline partners.
The use of regional airlines by legacy carriers can potentially have pro-competitive or anti-competitive effects. On the one hand, legacy carriers might outsource to regional airlines as aresponse to competitive pressure from low-cost carriers. With lower operating costs, legacy carriersmay find it easier to decrease average airfare once they switch the operation of a route from theirown fleet to a regional airline. Thus, the legacy carriers’ growing use of regional airlines could bemotivated by the desire to meet the price competition of existing low-cost carriers.
Alternatively, legacy carriers might use partnerships with regional airlines to facilitate a limitpricing strategy, in which legacy carriers decrease average airfares in order to erect a barrier toentry. From this perspective, outsourcing to regional airlines might be seen as a credible threatto commit to lower airfares and ultimately discourage a potential entrant from actually entering aroute, which is clearly anti-competitive. Forbes and Lederman (2007) mention that outsourcingthe operation of a route to a regional airline could serve as an effective barrier to entry to low-costcarriers. Their intuition follows an entry deterrence story, in which cost-efficient regional airlinescould be utilized by legacy carriers as a signal to potential low-cost carrier entrants who wouldthen find entry to be unprofitable. Moreover, Borenstein (1992) suggests that partnerships betweenlegacy carriers and regional airlines can increase the cost of entry at airports where the two airlinesconnect. However, this paper is the first to formally analyze this conjecture.
My findings are largely consistent with the idea that regional airlines are used to help legacycarriers better compete with low-cost carriers. Legacy carriers typically lower average airfare oncethe switch to regional airlines occurs. Moreover, legacy carriers are more likely to start using re-gional airlines on routes where low-cost carriers are already present. In contrast, I find no evidencethat the likelihood of entry by low-cost carriers is reduced where legacy carriers have outsourced
2

to regional airlines. Therefore, the evidence is consistent with the notion that outsourcing is acompetitive pricing response to current competition with low-cost carriers rather than an attemptto preclude future entry by prospective low-cost carriers.
2 Industry Structure
Before the Airline Deregulation Act of 1978, regional airlines operated as commuter airlines,servicing thin and short-haul routes. At the time, the Civil Aeronautics Board heavily regulatedprice and entry in the airline industry. Airlines were allowed to set high prices on long-haul routes,which cross-subsidized profit losses made on low-margin short-haul routes. Regional airlines,however, were exempt from regulation as long as their fleet contained planes below a certain size.1
As such, they operated independently from the major airlines at the time.After the airline industry became deregulated in 1978, legacy carriers altered their route struc-
ture by developing hub-and-spoke networks, in which passenger traffic is concentrated throughcertain airports in the United States. Under this system, legacy carriers have to decide whether tooperate a route themselves or outsource to a regional airline. Although passengers purchase theirticket from the legacy carrier, the contracted regional airline supplies the aircrew and fleet usedin the operation of the flight. Legacy carriers typically use regional airlines on short-haul routeslinking a legacy carrier’s spoke airport to its hub airport, and vice versa.
Figure 1: Number of Passengers Flown by Operating Carrier
The number of passengers is calculated based on whether the operating carrier was a regional airline, low-cost carrier, or legacy carrier. As such,the number of passengers is not determined by the ticketing carrier. For example, regional airlines would be credited for the number of passengersit flew on behalf of a legacy carrier. Legacy carriers only get credit for passengers who flew on flights that they operated themselves.
1The size limit effectively limited regional airlines to planes with 20 to 30 seats.
3

Legacy carriers have become more attracted to outsourcing to regional airlines in part becauseregional airlines have changed the type of aircraft they fly from turbo-props to regional jets, whichhave increased range, speed, and passenger capacity. As a result, the use of regional airlines bylegacy carriers has drastically expanded over time as the total number of routes that legacy carriersoutsourced to regional airlines increased from 1,917 in 1998 to 17,111 in 2009.2 Figure 1 showsthat 213 million and 6.56 million passengers flew on flights operated by legacy carriers and regionalcarriers, respectively, in 1998. This corresponds to a market share of 67.3% for legacy carriers and2.1% for regional airlines. While the number of passengers flown by legacy carriers decreasedto 146 million passengers (44.7% market share) in 2009, 36.4 million passengers (11.1% marketshare) flew with a regional airline operating on behalf of a legacy carrier, an increase of nearly455% over the twelve year period.
Figure 2: Cost per Available Seat Mile by Operating Carrier
The cost per available seat mile (CASM) is calculated based on whether the operating carrier was a regional airline, low-cost carrier, or legacycarrier. Source: Air Carrier Financial Reports (Form 41) from the U.S. Department of Transportation.
Breuckner and Pai (2009) analyze how the innovation of regional jets has increased servicequality as measured by the frequency of flights. Regional airlines have steadily replaced their tur-boprop aircraft with more cost-efficient regional jets, leading to a lower cost per available seat permile (CASM). Figure 2 illustrates the evolution of CASM3 for regional airlines, low-cost carri-ers, and legacy carriers over time. By 2009, CASM for regional airlines approached the relatively
2Forbes and Lederman (2009 and 2010) explain how the decision for legacy carriers to outsource to an ownedregional airline rather than an independent regional airline is affected by service quality-related motivations. Since Ifocus on the decision by legacy carriers to operate a route using its own fleet or any of its regional airline partners, Icombine the statistics for independent and subsidiary regional airlines.
3CASM is calculated as operating expenses divided by available seat miles using the Air Carrier Financial Reports(Form 41) from the U.S. Department of Transportation.
4

low levels for low-cost carriers. Meanwhile, CASM for legacy carriers has steadily increased overtime. The rise in the level of outsourcing by legacy carriers towards the use of regional airlines canbe partly attributed to the increased cost advantage for regional airlines.
Since regional airlines have a more efficient cost structure, then perhaps legacy carriers couldconsider outsourcing all routes to the regional airlines and essentially have a franchisee/franchisorrelationship with these regional airlines. However, scope clauses in labor union contracts betweenlegacy carriers and its labor unions create a constraint on the amount of routes that the legacycarrier can outsource to the regional airline. As mentioned in Forbes and Lederman (2007), scopeclauses typically take on one of two forms: 1) there is a cap on the total number of outsourcing bythe network airlines to a regional airline partner or 2) the network airline must increase the amountof flights used by its own fleet by a pre-determined ratio for every increase in outsourced routes toregional airlines. These scope clauses effectively create a trade-off for the legacy carrier when theydecide whether to switch to a regional airline as this would take away the opportunity of using thatregional airline on a different route.
The rise of low-cost carriers is another outcome of a deregulated airline industry. Since dereg-ulation made it easier for new airlines to enter the industry, start-up airlines emerged that foundways to lower the cost of available seat mile relative to that of legacy carriers. These low-costcarriers decreased the cost of operation by using a point-to-point network and a fleet consistingof the same aircraft.4 Legacy carriers established low-cost "airline within an airline"5 in order tocounter the influx of new airlines, but they have all since been discontinued because they quicklybecame a financial burden to the legacy carrier.
As with regional airlines, low-cost carriers have experienced a remarkable growth in the num-ber of passengers flown between 1998 and 2009. Figure 1 illustrates that the number of passengersflown by low-cost carriers has increased dramatically from 58.5 million (18.5% market share) in1998 to 130 million (39.8% market share) in 2009. During this time period, there have been 940instances of entry6 by low-cost carriers into routes with a maximum distance of 1,500 miles, withAirTran Airways entering 424 routes, JetBlue Airways entering 136 routes, Southwest Airlines
4For example, Southwest Airlines operates Boeing aircraft exclusively, comprising of 614 Boeing 737 and66 Boeing 717. Moreover, JetBlue’s fleet of 194 planes include Airbus 320 and 321, as well as Em-braer 190. On the other hand, legacy carriers operate a larger variety of planes manufactured by Boe-ing, Embraer, and Airbus. Low-cost carriers are able to reduce training and maintentance costs since theirfleet is more concentrated on a fewer assortment of planes. Source: http://finance.yahoo.com/news/
low-cost-carrier-strategies-maintain-225005754.html5Examples include Continental Lite (Continental Airlines), Song (Delta Air Lines), and Ted (United Airlines).6Each instance is defined by entry into a one-way airport pair. For example, when Southwest started operating the
route between Detroit Metro Airport and Philadelphia International Airport in 2004, two routes are entered: the routefrom Philadelphia to Detroit, and the route from Detroit to Philadelphia.
5

entering 322 routes, and Spirit Airlines entering 58 routes. The expansion of the low-cost carrier’sroute network largely explains their recent growth and their emergence as a major influence in theU.S. airline industry. This paper studies how the growing use of regional airlines by legacy carriershas impacted competition in the airline industry, particularly between legacy carriers and low-costcarriers.
3 Data
In order to investigate how legacy carriers use regional airlines to better compete with low-costcarriers, I use data from three main sources. The main dataset used in this paper is the AirlineOrigin and Destination Survey (DB1B), which is published quarterly by the Bureau of Transporta-tion Statistics. It is a ten percent survey of domestic air travel and contains data on the origin,destination, non-stop distance between endpoints, ticketing and operating carrier,7 market fare,8
and number of passengers paying a particular market fare. I augment this data with monthly dataon the number of delayed flights from the Airline On-Time Performance Data set, also from theBureau of Transportation Statistics. Finally, I use yearly data from the Bureau of Economic Anal-ysis’s Local Area Personal Income tables on population and per capita personal income, as wellas their Annual Personal Income by Major Source and Earnings by Industry (Table SA05) datasetto obtain information on both accommodation9 and nonfarm earnings for metropolitan statisticalareas (MSA).
The sample time period for this paper is 1998 to 2009. I start with 1998 because the Bureau ofTransportation Statistics did not ask carriers to report whether the operating carrier differed fromthe ticketing carrier until that year, while partnerships between legacy carriers and regional airlinescould have been affected by the completion of the Delta-Northwest merger in 2009. As such,1998-2009 provides a clean time frame to analyze the growth of regional airlines.
The following steps are undertaken to clean the data. First, I eliminate all observations wherethe distance was equal to zero or the market fare is less than $10. Observations with an unidentifiedticketing carrier are also dropped. Only observations related to coach fares on nonstop flights are
7The key distinction between the ticketing carrier and the operating carrier is that the ticketing carrier is the airlinethat the passenger purchased the ticket from, whereas the operating carrier is the airline that is in charge of the aircrewand fleet used on the flight.
8Market fare is calculated by the Bureau of Transportation Statistics as the itinerary yield multiplied by the numberof miles flown. Ancillary fees, such as baggage fees, priority seating fees, and the cost of food and beverage purchasedon the flight, are not accounted for in the market fare.
9According to the Bureau of Economic Analysis, the accommodation industry includes hotels, motels, and othertraveler accommodations.
6

kept.10 I then limit the sample to routes within the contiguous United States with a maximumdistance of 1,500 miles since regional airlines would not be used on longer routes and restrict thesample to the 2,500 routes with the highest number of passengers from 1998 to 2009. I drop routesthat are never serviced by a legacy carrier in order to focus on routes where there is the potentialfor strategic behavior between legacy carriers11 and low-cost carriers.12 In some cases, data on thenumber of delayed flights or accommodation earnings are not reported. Routes with incompleteinformation on either of these two variables are eliminated.
4 The Effect of Regional Airline Entry on Pricing
This section investigates how outsourcing to regional airlines alters the pricing strategy of theoutsourcing legacy carrier. Legacy carriers could potentially charge lower prices by exploiting theregional airlines’ more efficient cost structure. I run a two-way fixed effects regressions on loggedaverage airfares in order to study price changes associated with regional airline entry.
Observations from the DB1B for every quarter between 1998:Q1 to 2009:Q4 is merged withthe annual population estimates of metropolitan statistical areas (MSA) in the United States forevery year between 1998 to 2009 from the Bureau of Economic Analysis. The population for theairport’s MSA is assumed to be constant for each quarter in a particular year. An observation inthe resulting dataset is at the carrier-route-year-quarter level.
I construct one dependent variable and seven control variables to be used in the price regres-sions. The dependent variable (lnprice) is the logged average airfare set by the ticketing carrier- operating carrier combination for a particular route in a given year-quarter time period. I createtwo market share variables called msroute and msapt, which calculated the market share of thecarrier on a particular route and the arithmetic mean of the carrier’s market share at the endpointairports on a particular route in a given year-quarter, respectively. I proxy for market concentrationby constructing the route’s Herfindahl-Hirschman Index in a particular year-quarter (HHIroute)and the arithmetic mean of the Herfindahl-Hirschman Indexes at endpoints on a route in a given
10It can be the case that regional airlines are flying travelers on one leg of a one-stop or multi-stop itineraries.However, the issue with these itineraries is that a legacy carrier can be responsible for a portion of the the one-stop ormulti-stop itineraries as well. In other words, I focus on nonstop products in order to avoid the complication with somepassengers flying on a legacy carrier plane to get them from a origin airport to a hub airport and then a regional airlinefrom the hub airport to the final destination airport. Thus, focusing on nonstop products lends to a cleaner analysis ofthe legacy carrier’s decision to operate that particular route themselves or to outsource to a regional airline.
11The legacy carriers studied in this paper are American Airlines, Continental Airlines, Delta Air Lines, NorthwestAirlines, United Airlines, and US Airways.
12The low-cost carriers studied in this paper are AirTran Airways, JetBlue Airways, Southwest Airlines, and SpiritAirlines.
7

time period (HHIapt). Both market share variables and market concentration variables are basedon the number of passengers flown by a given ticketing carrier. In order to control for marketsize, I use the population data to create pop, which is the geometric mean of the endpoint’s MSApopulation in millions. Finally, legacy carrier - regional airline partnerships are defined using theRegional Airline Association’s Annual Reports. I use this information to construct the variable ofinterest, REGoperating, which assumes the value of 1 the year-quarter that a legacy carrier starts tooutsource to a regional airline and every subsequent year-quarter that the regional airline operateson behalf of that legacy carrier, and 0 otherwise.
I keep observations that pertain to a legacy carrier who decides to start using a regional airlinepartner as the operating carrier on a route that it previously operated itself during the sample timeperiod (1998:Q1 - 2009:Q4). This subsample contains 91,777 observations on 1,313 routes from1998:Q1 to 2009:Q4. Summary statistics are reported in Table 1.
Table 1: Summary StatisticsData for Price Regressions
Variable Definition Mean(Std. Dev.)
pricei jt Average one-way market fare for carrier i 200.50on route j in time period t (89.40)
msroutei jt Market share for carrier i on route j in time period t 0.400(0.340)
HHIroute jt Herfindahl Index for route j in time period t 0.598(0.209)
msapti jt Arithmetic mean of carrier i’s market share 0.235at endpoints on route j in time period t (0.137)
HHIapt jt Arithmetic mean of Herfindahl Indexes 0.333at endpoints on route j in time period t (0.099)
pop jt Geometric mean of population (in millions) of origin and 3.24destination airports’ MSA on route j in time period t (2.02)
REGoperatingi jt Indicator variable equal to 1 if carrier i is a legacy carrier 0.313and switches to a regional airline on route j in time period t (0.464)or prior to time period t, and 0 otherwise
Routes Number of routes in the sample 1,313N Number of observations 91,777
I use a fixed effects approach to perform an event study that measures the change in the legacycarrier’s price once it outsources to a regional airline while controlling for time-invariant and route-specific factors. As such, the dependent variable used is the legacy carrier’s logged average airfare
8

(lnprice). The specification is as follows:
lnpricei j,t = γi j +νt +αXi j,t +βREGoperatingi j,t + εi j,t , (1)
where γi j is the carrier-route fixed effect, νt is the year-quarter fixed effect, REGoperatingi j,t isthe indicator variable used to identify when a legacy carrier i switches the operation of a routeto a regional airline on route j in time period t or prior to time period t, and Xi j,t are the othercontrol variables discussed above.13 Standard errors are clustered by carrier-route to account forheteroskedasticity and serial correlation between a carrier-route combination. REGoperating, thekey variable of interest, captures the change in price charged when a regional airline operates ona route relative to what the legacy carrier charged when it previously operated the route itself.Given that regional airlines have a more efficient cost structure than legacy carriers, the sign forREGoperating is hypothesized to be negative and significant, implying that legacy carriers de-crease their average prices once they outsource the operation of a route to a regional airline.
Table 2: Legacy Carrier Price Response to Outsourcing
Dependent variable lnpriceStandard
Variable Coefficient errorRoute-level market share (msroute) 0.007 (0.020)Route concentration (HHIroute) 0.203∗∗ (0.021)Airport-level market share (msapt) −0.138∗ (0.067)Airport concentration (HHIapt) 0.210∗∗ (0.075)Population (pop) 0.364∗∗ (0.096)Operates using regional airline (REGoperating) −0.111∗∗ (0.006)N 91,777
Note: This table reports the results of the two-way fixed effects price regressions outlined in Equations 1. Observations are at thecarrier-route-year-quarter level. Route and year-quarter fixed effects suppressed. Standard errors are clustered by carrier-route to account forcorrelation between a carrier-route combination over time.* indicates significance at 5% level.** indicates significance at 1% level.
Table 2 summarizes the price regression results that estimates how legacy carriers change theiraverage price once they switch to regional airlines. The coefficient for REGoperating (-0.111)
13Endogeneity might arise if regional airlines could sell tickets for flights that it operates on behalf of the legacycarrier. However, this is not the case in reality. Regional airlines cannot sell tickets independently from legacy carriers.Regional airlines rely exclusively on legacy carriers for passenger traffic. In fact, official websites for regional airlineswill merely identify the routes that it services for legacy carriers and sometimes include links to the legacy carrier’sofficial website for ticketing purposes. Since regional airlines do not decide which routes to fly on themselves or theair fares for those routes, then endogeneity does not become a major concern here either.
9

is both negative and significant at the 1% level, which implies that legacy carriers decrease theiraverage price by 10.5%,14 on average, when they outsource a route to a regional airline. This isconsistent with the idea that outsourcing allows the legacy carrier to charge lower prices, whichmay allow it to better compete with rival carriers on that route or may be an entry-limiting tacticagainst potential entrants. Given this price effect of outsourcing, the following section analyzes thecompetitive motivations for a legacy carrier to switch the operating of a route to a regional airline.
5 Motivations for Regional Airline Entry
This section analyzes two possible mechanisms through which competitive pressures fromlow-cost carriers could influence the decision to outsource to regional airlines: 1) outsourcing asa pro-competitive response to current competition with low-cost carriers and 2) outsourcing asan anti-competitive strategy that erects a barrier to entry against low-cost carriers. I examine thefirst explanation by testing whether legacy carriers are more likely to switch to a regional airlineon routes where low-cost carriers are present. This is done using a two-way fixed effects logitregression of entry by regional airlines on the number of low-cost carriers operating on a route, aswell as other control variables. Second, I estimate the effect of regional airlines on entry by low-cost carriers in order to test whether the presence of a regional airline reduces the likelihood thatlow-cost carriers enter that route. In other words, I investigate whether legacy carriers outsource toregional airlines where they attempt to preclude future entry by regional airlines.
Observations from the DB1B and the Airline On-Time Performance Data are aggregated tothe year level so that the final dataset contains route-year observations. Thus, the main distinctionbetween this dataset and the one used in the previous section is that observations are at the carrier-route-year-quarter combination for the price regression in Section 4, whereas the dataset used inthis section is aggregated to the route-year level. Entry is identified when an airline starts servicinga route and remains on that route for at least two consecutive quarters. In some cases, airlinesare seen in the DB1B to operate on a particular route only to drop out for a quarter and reappearin the subsequent quarter. This is not an example of actual entry but represents an issue with theDB1B being a ten percent sample of airline tickets. Nevertheless, this problem was resolved byqualifying entry when the carrier did not service the route in question for at least four quartersbefore the identified quarter of entry. The carrier must have also flown at least 100 passengers onthe entered route in the quarter of entry. The final dataset contains 12,790 observations on 1,161routes from 1998 to 2009.
14Given the log-linear specification in Equation 1, this is calculated as exp(-0.111) - 1 = -0.105.
10

Table 3: Summary StatisticsData for Entry Regressions
Variable Definition Mean(Std. Dev.)
REGentryit Indicator equal to 1 if a regional airline enters on route i 0.122in time period t, and 0 otherwise (0.328)
LCCentryit Indicator equal to 1 if a low-cost carrier enters on route i 0.028in time period t, and 0 otherwise (0.166)
WNentryit Indicator equal to 1 if Southwest Airlines enters on route i 0.006in time period t, and 0 otherwise (0.078)
otherLCCentryit Indicator equal to 1 if a low-cost carrier other than 0.023Southwest Airlines enters on route i in time period t, and 0 otherwise (0.149)
distancei Distance (in miles) between the endpoints of route i 723.65(339.84)
passengersit Number of passengers on route i in time period t 29859.29Note: lndensityit = ln(passengersit) (29346.83)
pdelayit Percentage of flights delayed over 15 minutes on route i in time period t 0.202(0.084)
popit Geometric mean of population (in millions) of origin and destination 3.402airports’ MSA on route i in time period t (2.204)
incomeit Geometric mean of per capita income (in tens of thousands) of origin 3.582and destination airports’ MSA on route i in time period t (0.547)
tourismit Maximum of the percentage of accommodation income in nonfarm income 1.745of origin and destination airports’ MSA on route i in time period t (20.415)
HHIrouteit Herfindahl-Hirschman Index for route i in time period t 0.578(0.206)
maxshareit Maximum of the market share of carriers on route i in time period t 0.691(0.184)
nLEGit Number of legacy carriers operating route i in time period t 2.647(1.456)
nLCCit Number of low-cost carriers carriers operating route i in time period t 0.572(0.593)
nREGit Number of regional airlines servicing route i in time period t 1.057(1.269)
nOT HERit Number of other carriers (not legacy carrier, low-cost carrier, or regional 0.596airline) servicing route i in time period t (0.890)
Routes Number of routes in the sample 1,161N Number of observations 12,790
There are three types of control variables: market variables, demographic variables, and com-petition variables. Market variables include the natural log of the number of passengers on aroute (lndensity)15 and the percentage of flights on a route that were delayed at least 15 minutes
15The lndensity variable includes the total number of nonstop and connecting passengers on a route in order toaccurately represent market demand and because it is well understood that low-cost carriers target entry on routes thathave limited non-stop service.
11

(pdelay). Demographic variables include the maximum of the ratio of accommodation earningsto nonfarm earnings for each endpoint on a route (tourism), as well as the geometric mean of thepopulation (pop) and per capita income (income) of the MSA where the origin and destinationairports are located. Finally, I include competition variables to control for the maximum marketshare of a servicing airline on that route (maxshare) and the route-level Herfindahl-Hirschman In-dex (HHIroute). I also control for the number of competing airlines by including the number oflegacy carriers (nLEG), low-cost carriers (nLCC), regional airlines (nREG), and other airlines16
(nOT HER) operating on that route. Summary statistics for this dataset is reported in Table 3.
5.1 The Pro-Competitive Use of Regional Airlines
I use a fixed effects approach to exploit the panel structure of my data in order to test whetherthe presence of low-cost carriers affect the likelihood that a legacy carrier outsources to a regionalairline while controlling for time-invariant, route-specific factors. I am interested in routes wherelegacy carriers have a choice to operate with a regional airline or not so the data only includesroutes where legacy carriers service during the sample time period. Legacy carriers tend to employa regional airline on routes that they previously operated themselves. Entry in this sense is definedwhen a legacy carrier starts using a regional airline where it had previously served as both theticketing and operating carrier. Once a regional airline has entered the route, the legacy carrierremains as the ticketing carrier, but the regional airline becomes the operating carrier. Thus, Iconstruct REGentry as a dependent variable, which assumes the value of 1 when a legacy carrierswitches to a partnered regional airline, and 0 otherwise.
The specification for the two-way fixed effects logit regression model is as follows:
REGentryi,t+1 = γi +νt +αXi,t +βnLCCi,t + εi,t , (2)
where REGentryi,t+1 is the indicator variable that identifies entry by a regional airline, γi is theroute fixed effect, νt is the year fixed effect, nLCCi,t is the number of low-cost carriers operatingon route i in year t, and Xi,t are the other control variables explained above. Note that the controlvariables are in terms of period t, whereas the dependent variable relates to period t +1. In otherwords, I am looking at the effect that the control variables in a particular year will have on entry by
16Other airlines are simply domestic airlines that do not fit into either legacy carrier, regional airline, or low-costcarrier categories. This includes (but is not limited to) Alaska Airlines, Hawaiian Airlines, and Midwest Airlines. Tobe sure, the market density, market concentration, and market share variables include the passenger volume of theseairlines.
12

regional airlines in the subsequent year.17 I am particularly interested in the sign and significanceof the nLCC variable, which controls for the number of low-cost carriers operating on the route. Ifregional airlines are more likely to be used where low-cost carriers are present, then the estimatedcoefficient for nLCC should be positive and statistically significant.
Table 4: Entry by Regional Airlines
Dependent variable REGentryLogit Standard
Variable coefficient errorMarket density (lndensity) −0.311∗ (0.136)Airport congestion (pdelay) 2.099∗∗ (0.560)Population (pop) −0.640 (0.350)Per capita income (income) −0.931∗ (0.425)Tourist market (tourism) −0.197 (0.140)Route concentration (HHI) −0.775 (0.853)Maximum market share (maxshare) 0.331 (0.901)Number of legacy carriers (nLEG) −0.023 (0.080)Number of low-cost carriers (nLCC) 0.436∗∗ (0.151)Number of regional airlines (nREG) −0.300∗∗ (0.037)Number of other airlines (nOT HER) 0.100 (0.057)N 7,785
Note: This table presents the results for the two-way fixed effects logit regression method on entry by regional airlines. Entry is defined when alegacy carrier switches operation of a route to a regional airline. Observations are at the route-year level. Route and year fixed effects suppressed.* indicates significance at 5% level.** indicates significance at 1% level.
Table 4 reports the results of the two-way fixed effects logit model. The estimates suggest thatlegacy carriers tend to start using regional airlines on routes where low-cost carriers are presentsince the estimated coefficient for nLCC18 (0.436) is both positive and significant at the 1% level.
17Endogeneity could arise if the use of regional airlines by various legacy carriers is not independent. In otherwords, endogeneity could be a major concern if multiple legacy carriers switch to regional airlines on the same routein the same time period. However, a deeper investigation into the dataset reveals that this is luckily not the case. Ofthe 12,790 observations in the dataset, 11,226 observations are associated with the case that no legacy carrier switchedto a regional airline on that route in that year. In the 1,564 observations pertaining to a switch in the operation of aroute from the legacy carrier to regional airline, only 67 observations (4.3%) are related to the case when more thanone legacy carrier started outsourcing to a regional airline. This suggests that a legacy carrier’s decision to outsourceto a regional airline is not affected by rival legacy carriers’ actions at that time. Unsurprisingly, removing these 67observations from the dataset yields qualitatively similar regression results.
18Out of the 12,790 observations in the data sample, 6,103 observations pertained to routes with no low-cost carriercompetition and 6,115 observations with only one low-cost carrier servicing the route. Thus, only 572 of 12,790observations (4.5%) pertain to routes services by two or three low-cost carriers. There are no routes in the data set thatwere serviced by more than three low-cost carriers. As a robustness check, I replaced nLCC with one of two variables
13

The results also show that the presence of other regional airlines operating on behalf of rival legacycarriers discourages legacy carriers to start using a regional airline themselves as the estimatedcoefficient for nREG (-0.300) is negative and statistically significant. Finally, outsourcing wouldbe more likely to occur on routes that experience a high frequency of delay (pdelay), as well asroutes that are traveled by less passengers (lndensity) and that connect markets with lower percapita income (income). This is likely to be the case since regional airlines are used to integratesmall cities into the legacy carrier’s route network.
The results imply that legacy carriers are more likely to use regional airlines where they cur-rently compete with low-cost carriers. However, it could also be the case that legacy carriersoutsource to regional airlines on routes where they intend to deter future entry by low-cost carri-ers. The rest of this section investigates whether regional airlines could serve as an effective barrierto entry to low-cost carriers.
5.2 The Use of Regional Airlines as a Barrier to Entry
Previous papers have estimated barriers to entry using a logit model. Cotterill and Haller (1992)find that the number of large supermarket chains in a particular market serves as an effective barrierto entry. Cetorelli and Strahan (2006) conclude that banks with market power erect a significantfinancial barrier to entry. These papers generally use entry in the relevant market as a dependentvariable and test whether particular market conditions affect entry rates. If a logit coefficient for aparticular variable is negative and statistically significant, then that variable is determined to be aneffective barrier to entry.
In order to test whether regional airlines effectively deter entry by low-cost carriers, I utilizeLCCentry, an indicator variable equal to 1 when a low-cost carrier enters the route in the followingyear, and 0 otherwise, as the dependent variable in a two-way fixed effects logit regression modelwith the following specification:
LCCentryi,t+1 = γi +νt +αXi,t +βnREGi,t + εi,t , (3)
where LCCentryi,t+1 is the indicator variable that identifies entry by a low-cost carrier, γi is theroute fixed effect, νt is the year fixed effect, nREGi,t is the number of regional airlines on route i inyear t, and Xi,t are the other control variables explained above. Note that the control variables are
in Equation 2. First, I included an indicator variable for whether any low-cost carrier is in the market. Second, Iincluded an indicator variable for whether only one low-cost carrier is in the market and 0 if no low-cost carrieris in the market, which effectively drops any observations related to the presence of two or more low-cost carriers.Regardless, the results using either indicator variable are qualitatively similar.
14
in terms of period t, whereas the dependent variable relates to period t + 1. In other words, I amlooking at the effect that the control variables in a particular year will have on entry by low-costcarriers in the subsequent year. I am particularly interested in the estimated sign and significanceof the nREG variable, which accounts for the number of regional airlines operating on the route. Ifregional airlines serve as an effective barrier to entry to low-cost carriers, the estimated coefficientfor nREG should be negative and statistically significant.
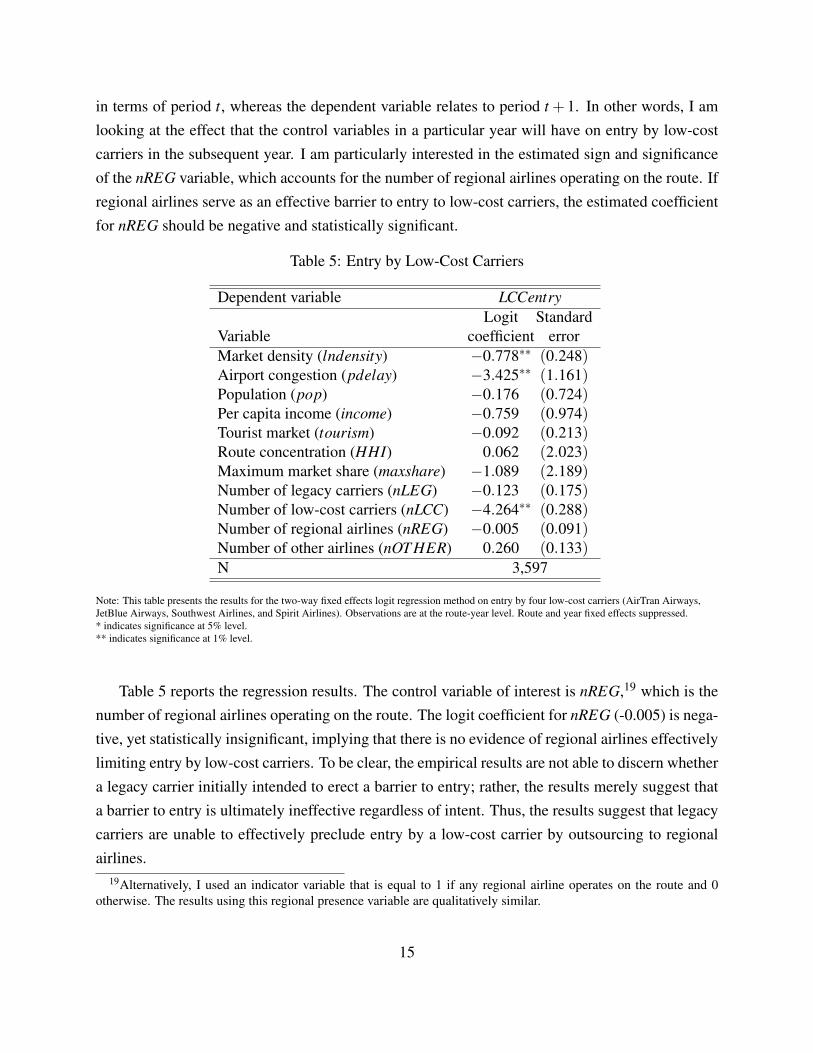
Table 5: Entry by Low-Cost Carriers
Dependent variable LCCentryLogit Standard
Variable coefficient errorMarket density (lndensity) −0.778∗∗ (0.248)Airport congestion (pdelay) −3.425∗∗ (1.161)Population (pop) −0.176 (0.724)Per capita income (income) −0.759 (0.974)Tourist market (tourism) −0.092 (0.213)Route concentration (HHI) 0.062 (2.023)Maximum market share (maxshare) −1.089 (2.189)Number of legacy carriers (nLEG) −0.123 (0.175)Number of low-cost carriers (nLCC) −4.264∗∗ (0.288)Number of regional airlines (nREG) −0.005 (0.091)Number of other airlines (nOT HER) 0.260 (0.133)N 3,597
Note: This table presents the results for the two-way fixed effects logit regression method on entry by four low-cost carriers (AirTran Airways,JetBlue Airways, Southwest Airlines, and Spirit Airlines). Observations are at the route-year level. Route and year fixed effects suppressed.* indicates significance at 5% level.** indicates significance at 1% level.
Table 5 reports the regression results. The control variable of interest is nREG,19 which is thenumber of regional airlines operating on the route. The logit coefficient for nREG (-0.005) is nega-tive, yet statistically insignificant, implying that there is no evidence of regional airlines effectivelylimiting entry by low-cost carriers. To be clear, the empirical results are not able to discern whethera legacy carrier initially intended to erect a barrier to entry; rather, the results merely suggest thata barrier to entry is ultimately ineffective regardless of intent. Thus, the results suggest that legacycarriers are unable to effectively preclude entry by a low-cost carrier by outsourcing to regionalairlines.
19Alternatively, I used an indicator variable that is equal to 1 if any regional airline operates on the route and 0otherwise. The results using this regional presence variable are qualitatively similar.
15

The regression results suggest three variables that have a significant impact on low-cost car-rier entry. Both the logged number of passengers on the route (lndensity) and the percentage ofdelayed flights (pdelay) have a negative and significant effect, implying that low-cost carriers gen-erally tend to avoid congested routes that are likely to cause disruptions to their route network.Moreover, a higher number of low-cost carriers operating on a route (nLCC) significantly inhibitsrival low-cost carriers from entering a route. That is not to say that low-cost carrier presence com-pletely blocks entry. In fact, there are some cases where low-cost carriers enter a route despite thepresence of a rival low-cost carrier. Nevertheless, the results suggest that this type of competitiondiscourages a possible low-cost carrier entrant from actually entering the route.
5.3 Robustness Checks for Entry by Low-Cost Carriers
The results in the previous subsection suggest that legacy carriers do not effectively use regionalairlines as an anti-competitive mechanism against low-cost carriers. However, the insignificantcoefficient for nREG in Table 5 does not necessarily imply that this non-result is truly a zero-result.The rest of this section discusses the robustness checks used to confirm that regional airlines donot effectively preclude entry by low-cost carriers.
Industrial organization economists have been interested in Southwest Airlines as a case studyon the effect of low-cost carriers in the airline industry. Southwest Airlines has a reputation ofnot being susceptible to aggressive entry deterrence strategies by incumbents.20 Consequently,it could be the case that the results from Table 5 are largely influenced by Southwest Airlines.In order to check that other low-cost carriers are similarly unaffected by regional airlines, I runseparate regressions with either entry by Southwest Airlines (WNentry)21 or by other low-costcarriers (otherLCCentry) as the dependent variable.
The results in Table 6 suggest that some factors that affect entry by Southwest Airlines do notaffect entry by other low-cost carriers, and vice-versa. Southwest Airlines is more apt to enterroutes in touristy markets (tourism), while other low-cost carriers are less inclined to enter denseroutes (lndensity) that are prone to delays (pdelay). The only determinant that significantly affectsboth Southwest Airlines and other low-cost carriers is the number of low-cost carriers operating onthe route (nLCC), which suggests that the presence of low-cost carriers significantly deters entryby rival low-cost carriers, in general.
20Bamberger and Carlton (2006) find that Southwest Airlines has a high survival rate, meaning that SouthwestAirlines successfully remains on an entered route for at least a year after entry.
21WN is the International Air Transport Association code for Southwest Airlines.
16

Table 6: Entry by Southwest Airlines vs. Other Low-Cost Carriers
Dependent variable WNentry otherLCCentryLogit Standard Logit Standard
Variable coefficient error coefficient errorMarket density (lndensity) −0.950 (0.658) −0.666∗ (0.303)Airport congestion (pdelay) −2.954 (3.040) −3.737∗∗ (1.270)Population (pop) −2.555 (2.500) −1.432 (0.841)Per capita income (income) 3.176 (2.908) −2.325∗ (1.091)Tourist market (tourism) 1.924∗ (0.892) −0.348 (0.270)Route concentration (HHI) −8.122 (5.449) 3.339 (2.294)Maximum market share (maxshare) 4.093 (6.057) −2.468 (2.428)Number of legacy carriers (nLEG) 0.483 (0.490) −0.276 (0.200)Number of low-cost carriers (nLCC) −5.592∗∗ (0.953) −3.645∗∗ (0.298)Number of regional airlines (nREG) −0.124 (0.269) 0.050 (0.101)Number of other airlines (nOT HER) 0.260 (0.377) 0.263 (0.148)N 869 2,992
Note: This table presents the results for the two-way fixed effects logit regression method on entry by both Southwest Airlines and other low-costcarriers (AirTran Airways, JetBlue Airways, and Spirit Airlines). Observations are at the route-year level. Route and year fixed effects suppressed.* indicates significance at 5% level.** indicates significance at 1% level.
The key insight from Table 6 is that regional airlines do not have an effect on either SouthwestAirlines or other low-cost carriers, which provides further support for the key implications fromTable 5. The logit coefficients for the number of regional airlines operating on a route (nREG) arestatistically insignificant in both regressions. It is not surprising that Southwest Airlines is unaf-fected by the presence of regional airlines given its reputation of being undeterred by incumbentlegacy carriers’ aggressive pricing strategies. It is interesting, however, to see that other low-costcarriers are unaffected as well. These coefficients provide further evidence that regional airlinesserve as ineffective barriers to entry to other low-cost carriers.
Regional airlines and low-cost carriers compete against each other on certain routes. For exam-ple, both American Airlines and Southwest Airlines fly nonstop between Los Angeles InternationalAirport and Austin-Bergstrom International Airport, yet American Airlines uses a regional airline,Compass Airlines, to operate that route. However, these two types of airlines do not service all ofthe same markets. There are routes that regional airlines service that low-cost carriers would con-sider too thin to be profitable.22 These routes typically link a small spoke airport with one of thelegacy carrier’s hub airports, such as when Delta Air Lines uses Atlantic Southeast Airlines to op-
22Fageda and Flores-Fillol (2012b) determine that the usage of regional airlines by legacy carriers would be moreprofitable on short-distance, thin routes with a higher proportion of business travel.
17

erate the route between Hartsfield-Jackson Atlanta International Airport and Little Rock NationalAirport. No low-cost carriers service this route.23 On the other hand, low-cost carriers operateon some routes where the distance between the two endpoints is too far for the aircraft used byregional airlines. United Airlines uses its own fleet and aircrew to operate the route between Bal-timore/Washington International Airport and Denver International Airport, where it also competeswith Southwest Airlines. Thus, certain routes are more likely than others to be serviced by bothregional airlines and low-cost carriers.
Legacy carriers could focus their use of regional airlines on routes where they anticipate entryby low-cost carriers instead of on routes where low-cost carriers are less likely to operate. If thisstrategy decreases the attractiveness of that route to a low-cost carrier, then both regional airlinesand low-cost carriers would seemingly be attracted to some of the same routes, resulting in anupward biased coefficient for nREG. In order to resolve this potential endogeneity issue, I isolatea selected sample of routes that are most likely to be served by both low-cost carriers and regionalairlines. By focusing on cases where regional airlines would have its highest potential effect asa barrier to entry to low-cost carriers, I am able to investigate whether regional airlines makeattractive routes unattractive to low-cost carriers. In order to do this, I start by truncating the fullsample to keep routes which are serviced by at least one low-cost carrier and one regional airlinein every year of the sample period (1998 - 2009). I report the summary statistics (mean, 25thpercentile, and 75th percentile) for the full sample and the truncated sample in Table 7.
The summary statistics in Table 7 report that low-cost carriers and regional airlines are bothparticularly attracted to routes that are affected by three variables: distance, secondary airports, andslot-controlled airports. First, low-cost carriers and regional airlines can both be found competingagainst each other on short-haul routes. The mean and interquartile range for the distance of theroute, distance, in the truncated sample are both much lower than that in the full sample. In fact, the75th percentile distance in the truncated sample is nearly equivalent to the 25th percentile distancein the full sample. Some metropolitan areas are serviced by multiple airports. Brueckner, Lee, andSinger (2010) identify the primary airport and secondary airport in these multi-airport markets.24
Using their airport definitions, I construct two indicator variables that identify if either endpoint onthe route is a primary airport (primaryapt) or a secondary airport (secondaryapt). If either airportis classified as either a primary airport or a secondary airport, then it is also coded to service amulti-airport city (multiapt). To be sure, it can be the case that neither endpoint is in a multi-
23Fageda and Flores-Fillol (2012a) find that regional airlines dominate thin routes in the United States, whereaslow-cost carriers tend to dominate thin routes in Europe.
24For example, the city of Dallas contains two airports: Dallas/Fort Worth International Airport (primary airport)and Dallas Love Field (secondary airport).
18

airport market.25 According to Table 7, no routes in the truncated sample appear to be identified asa secondary airport. In other words, low-cost carriers and regional airlines would never be foundto simultaneously operate routes to or from a secondary airport. Finally, the summary statisticsfor slots, which is an indicator variable that assumes the value of 1 if either endpoint is a slot-controlled airport, is different between the truncated sample and the full sample. Slot-controlledairports regulate the number of takeoffs and landings that airlines are allowed each hour.26 Table7 shows that no route with an endpoint that uses a slot allocation would be serviced by both alow-cost carrier and a regional airline.
Table 7: Summary Statistics(Truncated Sample)
All Routes Routes with Both Low-CostCarriers and Regional Airlines
25th 75th 25th 75thVariable Mean Percentile Percentile Mean Percentile PercentileRoute distance (distance) 723 440 988 425 308 493Hub airport (hub) 0.737 0 1 0.779 1 1Multi-airport market (multiapt) 0.589 0 1 0.357 0 1Primary airport (primaryapt) 0.461 0 1 0.357 0 1Secondary airport (secondaryapt) 0.181 0 0 0 0 0Slot-controlled airport (slots) 0.136 0 0 0 0 0Population (pop) 3.402 1.867 4.255 2.380 1.130 3.595Per capita income (income) 3.582 3.181 3.946 3.444 3.085 3.822Tourist market (tourism) 1.745 0.546 1.211 2.483 0.502 1.036Airport congestion (pdelay) 0.202 0.142 0.252 0.172 0.119 0.217
Note: This table reports the summary statistics for all routes and for routes where at least one low-cost carrier and one regional airline were presentthroughout the entirety of the sample period (1998-2009).
I use the interquartile range for distance, secondaryapt, and slots to set the parameters forthe selected sample incorporating the most attractive routes for both low-cost carriers and regionalairlines. I start with the full dataset, but only keep the routes that fulfill three criteria: 1) theroute must have a distance between 300 and 500 miles, 2) neither endpoint of the route can be asecondary airport, and 3) neither endpoint of the route can be a slot-controlled airport. Using thisnew selected sample, I then run the two-way fixed effects model outlined in Equation 3 using entry
25In this case, primaryapt, secondaryapt, and multiapt for the observation would all equal 0.26The four major airports using slot allocation in the United States include Chicago O’Hare International Airport,
New York LaGuardia Airport, New York John F. Kennedy International Airport, and Ronald Reagan WashingtonNational Airport.
19

by low-cost carriers (LCCentry) as the dependent variable. As with before, I am interested in theestimated sign and significance of the nREG variable.
Table 8 presents the regression estimates for the selected sample that includes routes in whichthe potential effect of regional airlines as a barrier to entry would be at its highest. The resultssuggest that low-cost carriers seem to shy away from dense markets (lndensity) with high percapita income (income), which reflects the trend that smaller, less affluent markets tend to offerattractive operational conditions, including lower operating costs. Most importantly, the numberof regional airlines operating on a route (nREG) has a statistically insignificant effect on entry bylow-cost carriers. Moreover, the number of low-cost carriers operating on the route (nLCC) is oneof the variables that seems to affect low-cost carrier entry. Therefore, it is the presence of rivallow-cost carriers, not regional airlines, that could deter entry by low-cost carriers.
Table 8: Entry by Low-Cost Carriers(Selected Sample)
Dependent variable LCCentryLogit Standard
Variable coefficient errorMarket density (lndensity) −6.663∗ (2.686)Airport congestion (pdelay) 0.011 (7.938)Population (pop) 8.551 (6.112)Per capita income (income) −22.528∗ (9.391)Tourist market (tourism) 0.514 (0.922)Route concentration (HHI) 9.029 (10.360)Maximum market share (maxshare) −4.315 (10.402)Number of legacy carriers (nLEG) 1.930∗ (0.956)Number of low-cost carriers (nLCC) −4.752∗∗ (1.457)Number of regional airlines (nREG) 0.696 (0.489)Number of other airlines (nOT HER) −0.445 (0.665)N 418
Note: This table presents the results for the two-way fixed effects logit regression method on entry by four low-cost carriers (AirTran Airways,JetBlue Airways, Southwest Airlines, and Spirit Airlines) using the selected sample. The data truncates the full sample using three criteria: 1) theroute distance is between 300 and 500 miles, 2) neither endpoint airport is slot-controlled, and 3) neither endpoint airport is a secondary airport.Observations are at the route-year level. Route and year fixed effects suppressed.* indicates significance at 5% level.** indicates significance at 1% level.
This specification corrects for a possible selection bias that arises when legacy carriers focustheir use of regional airlines on routes where low-cost carriers are most likely to enter. Moreover,it is in this subsample of routes where regional airlines would exhibit the most potential to serve
20

as an effective barrier to entry. Since regional airlines are found to have no effect even in thesemarkets, then the presence of regional airlines does not significantly reduce the likelihood of entryby low-cost carriers.
Although it seems plausible that a low-cost carrier might find a route with regional airlineoperation to be unattractive, the regression results in Tables 5, 6, and 8 suggest that this is not thecase. Legacy carriers who outsource the operation of a route to a regional airline do not inhibitlow-cost carriers from entering that particular route in the future. In fact, the regression resultsconsistently suggest that the biggest factor that could deter low-cost carrier entry is the existenceof a rival low-cost carrier. The upshot is that legacy carriers do not seem to effectively use regionalairlines as a barrier to entry to low-cost carriers.
The results from Table 4 imply, however, that legacy carriers use regional airlines as a responseto competition against existing low-cost carriers. Legacy carriers are more likely to start usingregional airlines on routes where low-cost carriers are present. Thus, legacy carriers may respondto current competition with low-cost carriers by using regional airlines, subsequently decreasingtheir average airfare.
6 Conclusion
This paper investigates whether the legacy carriers’ decision to outsource the operation of aroute to regional airlines encourages or discourages competition. I find that legacy carriers tendto decrease average prices once they switch to a regional airline. Moreover, the results suggestthat legacy carriers are more likely to start outsourcing to regional airlines on routes where theycurrently compete with a low-cost carrier; however, I find no evidence that the presence of regionalairlines on a route become an effective barrier to entry. Therefore, I conclude that legacy carriersuse regional airlines as a pro-competitive response to current competition with low-cost carriersand not as an anti-competitive attempt to preclude future entry by low-cost carriers.
Although regional airlines provide a more cost-efficient alternative to operating a route them-selves, legacy carriers are unable to use regional airlines on all routes. First, regional airlines usesmaller aircraft that can only carry between 50-100 passengers at a time. As such, legacy carrierswould not want to use regional airlines if the distance is too far or if the demand for a particularroute is too high. In these cases, it would be more profitable for a legacy carrier to operate theroute with their own fleet and aircrew. Moreover, "scope clauses" in labor agreements with legacycarriers limits the number of routes that can be outsourced to regional airlines. Despite theselimitations, regional airlines serve as a means for legacy carriers to better compete with current
21

competitors on certain routes.Industrial organization economists have long been interested in pricing phenomenons, particu-
larly in the U.S. airline industry. Previous papers have found evidence that airlines charge higherprices at their hub airport,27 that competition affects the ability for airlines to price discriminate,28
and that some incumbent airlines decrease their price in response to entry by a low-cost carrier,particularly Southwest Airlines.29 This paper analyzes yet another facet of price competition be-tween airlines by investigating how outsourcing to regional airlines enables legacy carriers to seta lower price in order to better compete with existing low-cost carriers. It would be interestingto study how the recent mergers between legacy carriers (Delta Air Lines - Northwest Airlines,United Airlines - Continental Airlines, and most recently, American Airlines - US Airways) affecttheir relationship with their respective regional airline partners and how price competition adaptsto the imminent change in the competitive environment. However, this is left for future research.
REFERENCES
Bamberger, G., and D. Carlton (2006). "Predation and the Entry and Exit of Low-Fare Carriers."in Darin Lee (ed.), Advances in Airline Economics I, Elsevier.
Borenstein, S (1989). "Hubs and High Fares: Dominance and Market Power in the U.S. AirlineIndustry." The RAND Journal of Economics 20, 344-365.
Borenstein, S (1992). "The Evolution of U.S. Airline Competition." The Journal of Economic
Perspectives 6(2), 45-73.Borenstein, S., and N. Rose (1994). "Competition and Price Dispersion in the U.S. Airline
Industry." Journal of Political Economy 102(4), 653-683.Brueckner, J., D. Lee, and E. Singer (2012). "City-Pairs vs. Airport-Pairs: A Market-Definition
Methodology for the Airline Industry." Review of Industrial Organization 44, 1-25.Brueckner, J., and V. Pai (2009). "Technological Innovation in the Airline Industry: The Impact of
Regional Jets." International Journal of Industrial Organization 27, 110-120.Cetorelli, N., and P., Strahan (2006). "Finance as a Barrier to Entry: Bank Competition and
Industry Structure in the Local U.S. Markets." The Journal of Finance 61(1), 437-461.Cotterill, R., and L. Haller (1992). "Barrier and Queue Effects: A Study of Leading US
Supermarket Chain Entry Patterns." The Journal of Industrial Economics 40(4), 427-440.Dobson, P., and C. Piga (2013). "The Impact of Mergers on Fares Structure: Evidence from
European Low-Cost Airlines." Economic Inquiry 51(2), 1196-1217.27See Borenstein (1989), Lederman (2008), and Lee and Luengo-Prado (2005).28See Borenstein and Rose (1994), Gerardi and Shapiro (2008), and Savin (2001).29See Goolsbee and Syverson (2008), Vowles (2001), and Windle and Dresner (1999).
22

Evans, W., and I. Kessides (1993). "Localized Market Power in the U.S. Airline Industry." The
Review of Economics and Statistics 75(1), 66-75.Fageda, X., and R. Flores-Fillol (2012a). "Air Services on Thin Routes: Regional Versus Low-
Cost Airlines." Regional Science and Urban Economics 42(4), 702-714.Fageda, X., and R. Flores-Fillol (2012b). "On the Optimal Distribution of Traffic of Network
Airlines." European Economic Review 56(6), 1164-1179.Forbes, S., and M. Lederman (2007). "The Role of Regional Airlines in the U.S. Airline Industry."
in Darin Lee (ed.), Advances in Airline Economics II, Elsevier.Forbes, S., and M. Lederman (2009). "Adaptation and Vertical Integration in the Airline Industry."
American Economic Review 99(5), 1831-1849.Forbes, S., and M. Lederman (2010). "Does Vertical Integration Affect Firm Performance?
Evidence from the Airline Industry." The RAND Journal of Economics 41(4), 765-790.Gerardi, K., and A. Shapiro (2009). “Does Competition Reduce Price Dispersion? New Evidence
from the Airline Industry." Journal of Political Economy 117(1), 1-37.Goolsbee, A., and C. Syverson (2008). "How Do Incumbents Respond to the Threat of Entry?
Evidence from the Major Airlines." The Quarterly Journal of Economics 123(4), 1611-1633.Hirsch, B. (2007). "Wage Determination in the U.S. Airline Industry: The Role of Unions and
Product Market Competition." in Darin Lee (ed.), Advances in Airline Economics II, Elsevier.Karlsson, J., A. Odoni, and S. Yamanaka (2004). “The Impact of Infrastructure-Related Taxes and
Fees on Domestic Airline Fares in the U.S." Journal of Air Transport Management 10, 285-293.
Lederman, M (2008). "Are Frequent-Flyer Programs a Cause of the Hub Premium?" Journal of
Economics & Management Strategy 17(1), 35-66.Lee, D., and M.J. Luengo-Prado (2005). "The Impact of Passenger Mix on Reported Hub
Premiums in the U.S. Airline Industry." Southern Economic Journal 72(2), 372-394.Martin, S (2002). Advanced Industrial Economics. 2nd. ed. Malden: Blackwell Publishers, 2002.Reiss, P., and P. Spiller (1989). "Competition and Entry in Small Airline Markets." Journal of Law
and Economics 32(2), 179-202.Vowles, T (2001). "The Southwest Effect In Multi-Airport Regions." Journal of Air Transport
Management 7, 251-258.Windle, R., and M. Dresner (1999). "Competitive Responses to Low Cost Carrier Entry."
Transportation Research Part E 35, 59-75.
23