Left Ventricular Volume from Paired Biplane Two...
10
Left Ventricular Volume from Paired Biplane Two-dimensional Echocardiography NELSON B. SCHILLER, M.D., HARRY ACQUATELLA, M.D., THOMAS A. PORTS, M.D., DENIS DREW, M.D., JON GOERKE, M.D., HANS RINGERTZ, M.D., NORMAN H. SILVERMAN, M.D., BRUCE BRUNDAGE, M.D., ELIAS H. BOTVINICK, M.D., ROBERT BOSWELL, M.D., ERIK CARLSSON, M.D., AND WILLIAM W. PARMLEY, M.D. SUMMARY To evaluate the applicability of two-dimensional echocardiography to left ventricular volume determination, 30 consecutive patients undergoing biplane left ventricular cineangiography were studied with a wide-angle (840), phased-array, two-dimensional echocardiographic system. Two echographic projections were used to obtain paired, biplane, tomographic images of the left ventricle. We used the short-axis view (from the precordial window) as an anolog of the left anterior oblique angiogram, and the long-axis, two- chamber view (from the apex impulse window) as a right anterior oblique angiographic equivalent. A modified Simpson's rule formula was used to calculate systolic and diastolic left ventricular volumes from the biplane echogram and the biplane angiogram. These methods correlated well for ejection fraction (r = 0.87) and systolic volume (r = 0.90), but only modestly for diastolic volume (r = 0.80). These cor- relations are noteworthy because 65% of the patients had significant segmental wall motion abnormalities. The volumes determined from the minor-axis dimensions of M-mode echograms in 23 of the same patients cor- related poorly with angiography. BIPLANE CONTRAST ventriculography is a stan- dard method of obtaining left ventricular images from which volumes can be determined. This method retains its accuracy in the presence of geometric dis- tortion related to regional contraction abnormalities.1 M-mode echocardiography is an accurate, nonin- vasive method of estimating left ventricular volume,2 3 but its reliability is considerably compromised by segmental dysfunction.4' Preliminary reports of ex- perience with electrocardiographically triggered B- mode echocardiographic scanning techniques indicate that this single-plane, two-dimensional approach has a distinct advantage over the M-mode for calculating area ejection fractions.4 Gehrke6 used this technique to obtain volumes and ejection fractions in a group of 20 patients. The correlations with single-plane angiog- raphy were good, but the study included only two patients with coronary disease. The advantage of this technique over M-mode techniques of estimating From the Department of Medicine, Cardiovascular Division, the Departments of Radiology, Pediatrics, Physiology, and the Car- diovascular Research Institute, University of California, San Fran- cisco, California. Supported in part by NHLBI Program Project grant HL 06285 and by the Laras fund. Dr. Schiller is the recipient of a NHLBI Young Investigator's Research Award IR23 HL 22787-01. Dr. Acquatella's present address is: Hospital Universitario de Caracas, Caracas 101, Venezuela. Dr. Drew's present address is: Chief of Cardiology, Alameda Hospital, 2070 Clinton Avenue, Alamada, California 94501. Dr. Ringertz's present address is: Sachsska Barusjukhreset, S-10064 Stockholm, Sweden. Dr. Boswell's present address is: Vanderbilt University, Nashville, Tennessee. Address for reprints: Cardiovascular Division, 1186 Moffitt Hospital, University of California, San Francisco, California 94143. Received March 21, 1978; revision accepted March 20, 1979. Circulation 60, No. 3, 1979. 547 volume was, therefore, not demonstrated. Further- more, the technique for obtaining images by this method is tedious and the quality of published images marginal. The development of an electronically phased, two- dimensional echocardiograph with a wide (840) scan- ning angle and a small (2.5 cm2) transducer enabled us to obtain orthogonal biplane images noninvasively that are in some respects analogous to angiographic projections. Our method used both the precordium and the apex impulse location as imaging windows. The investigation that forms the basis of this report tested the capability of these biplane echographic left ventricular images to approximate biplane cineangio- graphic volume information in a group of patients in whom wall motion abnormalities were common. Methods and Patients In this prospective study, we examined 42 con- secutive patients (table 1) studied by biplane, two- dimensional, sector scan echocardiography in whom biplane cineangiography was also performed. Of the 42 patients, 30 had satisfactory studies with both techniques. In four of six patients, the echogram was discarded because of inadequate images, and in two because of defective video tape. The angiograms were unsuitable for analysis in four of six patients because of inadequate opacification of the left ventricle, and in two because of ectopic beats. All patients in this study had M-mode echocar- diograms. In the 30 with adequate two-dimensional echograms, 24 were studied by commercially available equipment using standard methods for imaging the left ventricle in the minor axis. The remaining six were studied using the M-mode capabilities of the two- dimensional scanner. One study done using standard equipment was technically inadequate due to uncer- tainty about the identity of the minor axis. All studies by guest on May 10, 2018 http://circ.ahajournals.org/ Downloaded from
Transcript of Left Ventricular Volume from Paired Biplane Two...
Left Ventricular Volume from Paired BiplaneTwo-dimensional Echocardiography
NELSON B. SCHILLER, M.D., HARRY ACQUATELLA, M.D., THOMAS A. PORTS, M.D.,
DENIS DREW, M.D., JON GOERKE, M.D., HANS RINGERTZ, M.D.,
NORMAN H. SILVERMAN, M.D., BRUCE BRUNDAGE, M.D., ELIAS H. BOTVINICK, M.D.,ROBERT BOSWELL, M.D., ERIK CARLSSON, M.D., AND WILLIAM W. PARMLEY, M.D.
SUMMARY To evaluate the applicability of two-dimensional echocardiography to left ventricular volumedetermination, 30 consecutive patients undergoing biplane left ventricular cineangiography were studied with awide-angle (840), phased-array, two-dimensional echocardiographic system. Two echographic projectionswere used to obtain paired, biplane, tomographic images of the left ventricle. We used the short-axis view(from the precordial window) as an anolog of the left anterior oblique angiogram, and the long-axis, two-chamber view (from the apex impulse window) as a right anterior oblique angiographic equivalent.A modified Simpson's rule formula was used to calculate systolic and diastolic left ventricular volumes from
the biplane echogram and the biplane angiogram. These methods correlated well for ejection fraction(r = 0.87) and systolic volume (r = 0.90), but only modestly for diastolic volume (r = 0.80). These cor-
relations are noteworthy because 65% of the patients had significant segmental wall motion abnormalities. Thevolumes determined from the minor-axis dimensions of M-mode echograms in 23 of the same patients cor-related poorly with angiography.
BIPLANE CONTRAST ventriculography is a stan-dard method of obtaining left ventricular images fromwhich volumes can be determined. This methodretains its accuracy in the presence of geometric dis-tortion related to regional contraction abnormalities.1M-mode echocardiography is an accurate, nonin-vasive method of estimating left ventricular volume,2 3but its reliability is considerably compromised bysegmental dysfunction.4' Preliminary reports of ex-perience with electrocardiographically triggered B-mode echocardiographic scanning techniques indicatethat this single-plane, two-dimensional approach has a
distinct advantage over the M-mode for calculatingarea ejection fractions.4 Gehrke6 used this technique toobtain volumes and ejection fractions in a group of 20patients. The correlations with single-plane angiog-raphy were good, but the study included only twopatients with coronary disease. The advantage of thistechnique over M-mode techniques of estimating
From the Department of Medicine, Cardiovascular Division, theDepartments of Radiology, Pediatrics, Physiology, and the Car-diovascular Research Institute, University of California, San Fran-cisco, California.
Supported in part by NHLBI Program Project grant HL 06285and by the Laras fund.
Dr. Schiller is the recipient of a NHLBI Young Investigator'sResearch Award IR23 HL 22787-01.
Dr. Acquatella's present address is: Hospital Universitario deCaracas, Caracas 101, Venezuela.
Dr. Drew's present address is: Chief of Cardiology, AlamedaHospital, 2070 Clinton Avenue, Alamada, California 94501.
Dr. Ringertz's present address is: Sachsska Barusjukhreset,S-10064 Stockholm, Sweden.
Dr. Boswell's present address is: Vanderbilt University,Nashville, Tennessee.
Address for reprints: Cardiovascular Division, 1186 MoffittHospital, University of California, San Francisco, California94143.
Received March 21, 1978; revision accepted March 20, 1979.Circulation 60, No. 3, 1979.
547
volume was, therefore, not demonstrated. Further-more, the technique for obtaining images by thismethod is tedious and the quality of published imagesmarginal.The development of an electronically phased, two-
dimensional echocardiograph with a wide (840) scan-ning angle and a small (2.5 cm2) transducer enabled usto obtain orthogonal biplane images noninvasivelythat are in some respects analogous to angiographicprojections. Our method used both the precordiumand the apex impulse location as imaging windows.The investigation that forms the basis of this reporttested the capability of these biplane echographic leftventricular images to approximate biplane cineangio-graphic volume information in a group of patients inwhom wall motion abnormalities were common.
Methods and PatientsIn this prospective study, we examined 42 con-
secutive patients (table 1) studied by biplane, two-dimensional, sector scan echocardiography in whombiplane cineangiography was also performed. Of the42 patients, 30 had satisfactory studies with bothtechniques. In four of six patients, the echogram wasdiscarded because of inadequate images, and in twobecause of defective video tape. The angiograms wereunsuitable for analysis in four of six patients becauseof inadequate opacification of the left ventricle, and intwo because of ectopic beats.
All patients in this study had M-mode echocar-diograms. In the 30 with adequate two-dimensionalechograms, 24 were studied by commercially availableequipment using standard methods for imaging theleft ventricle in the minor axis. The remaining six werestudied using the M-mode capabilities of the two-dimensional scanner. One study done using standardequipment was technically inadequate due to uncer-tainty about the identity of the minor axis. All studies
by guest on May 10, 2018
http://circ.ahajournals.org/D
ownloaded from

VOL 60, No 3, SEPTEMBER 1979
TABLE 1. Details of the Patient Population
Total patients studied 42
Satisfactory echo anid angiogram 30/42
Echoes eliminated 6/42Poor image
Tape defect
Anigiograms eliminatedInadequiate contrastEictopy
Sex distributionMAlaleFemale
D)iagnosis
Coronary diseaseCoronary disease with abnormal
wall motionASL)-septal paradoxValvular diseaseNormal
4/62/6
4/62/6
17/3013/30
21/30
16/302/30
1/30
Abbreviatioin: AS) = atrial septal defect.
done using the M-mode incorporated with the two-dimensional scanner were eliminated due to poorvisualization of the endocardium. Thus, only 23 M-mode echograms were analyzed. In these, the end-diastolic and end-systolic minor-axis dimensions wereobtained and the volumes calculated according to aregression formula.4We studied 30 patients, ages 23-73 years; 17 were
male. Twenty-one patients had coronary disease, six
had valvular disease, two had atrial septal defect andone was normal (table 1). Of the 21 patients with cor-onary disease, 16 had one or more areas of segmentalwall motion abnormality. Both patients with atrialseptal defects had paradoxical septal motion on M-mode echocardiography.
Patients were studied with a clinical prototype of atwo-dimensional sector scanner commerciallydeveloped for cardiac use by Varian Associates, PaloAlto, California, and placed in our laboratory forclinical evaluation. The unit's hand-held transducerface measured 2.5 cm2 and had 32 elements excited asa phased array. The display consisted of 64 lines thatradiated from a point source on a cathode ray os-cilloscope screen, on which the images appeared inreal-time at 30 frames/sec, with 1-cm calibrationmarks in two axes superimposed.
Recordings were made in two orientations in orderto approximate orthogonal angiographic images. Inthe first, the beam passes through the left ventricularminor axis at right angles to the long axis of the heart(figs. 1 and 2). In normally oriented hearts, the beamruns from the right hip to the left shoulder. This pro-jection is known as the transverse or short-axis viewand was used as a left anterior oblique (LAO)equivalent. As shown, the septum and inferior wallsare to the viewer's left and the anterior and lateralwalls to the viewer's right. Identification of the rightventricle helped to define the septum, and visualiza-tion of the contiguous left lobe of the liver anddiaphragm was often helpful in localizing the inferiorwall. In order to come close to a reproducible, true,minor axis, we always tried to image the left ventricleat the level where the tip of the papillary muscles isseparated from the wall. This point is just apical to thepoint where mitral motion ceases.
FIGURE 1. Transducer position and beamplane for imaging the left ventricle in theshort axis. PM - papillary muscles; S =
septum; A W = anterior wall; PW = pos-terior wall; IW = inferior wall, L W =
lateral wall.
548 CIRCULATION
by guest on May 10, 2018
http://circ.ahajournals.org/D
ownloaded from

BIPLANE ECHOCARDIOGRAPHY/CARDIAC VOLUME/Schiller et al.
Fic;iURis 2. Upper left) Diagrammatic viewof the beam plane for imaging the left ven-tricular short axis. Lower left) Diagram-matic representation of short-axis echo-graphs at right. Upper right) Diastolicframe of short-axi.s echograph recorded onPolaroid film. Lower right) Systolic frameofsame beat. A anterior; D diastole; L
left; L V left ventricle; P posterior; Rright; R V = right ventricle; S = systole;
Sept = interventricular septum.
A
R - L
p
rIIIII
I
I
The second view used in this study (figs. 3 and 4)was obtained by placing the transducer on the apeximpulse location and aiming the beam toward the leftatrium. The beam plane is parallel to and below thelevel of the interventricular septum and that structureis, therefore, excluded from this projection. This long-axis view is called the two-chamber apical view andwas used as an analogue to the right anterior oblique(RAO) angiogram. It served as a long-axis view,orthogonal to the short axis. By our convention, thepatient's left is on the viewer's right. The image is dis-played with the apex at the top of the screen, theanterior wall to the viewer's right, the inferior wall tothe viewer's left, and the left atrium and mitral valveat the bottom right. Before recording these images ontape, we always attempted to exclude the right ventri-cle and septum from this view and to maximize thesize of the left ventricle by rocking the transducer inan anterior-to-posterior arc. At times, there was end-diastolic endocardial dropout as the maximumtomographic plane was achieved, necessitating the useof a slightly submaximal tomographic view. In ob-taining this view, the anterolateral wall was the mostdifficult to image. This difficulty was usually overcomeby careful transducer and gain manipulations or byslight changes in the elevation and pitch of thepatient's trunk.
After the images were recorded on video tape, theywere traced with a wax pencil on exposed x-ray film
affixed to the face of a television monitor. During thistracing, care was taken to maintain constant headposition to avoid parallax error, which was introducedby the displacement of the cathode ray tube back fromthe glass covering its face. Using the stop-frame modeof the tape recorder, and with reference to thesimultaneous ECG, end-diastolic (peak of R wave)and end-systolic (end of T wave) frames from each ofthe projections were chosen. The end of the T-wavewas chosen because of its concurrence with the aorticcomponent of the second heart sound and because ourvideo tape recorders could not be played in reverse;once the end-systolic frame was traced, the tape wasslowly advanced to insure that the tracing was made atthe smallest systolic volume and before the opening ofthe mitral valve. Since the television field rate is faster(60 frames/sec), the endocardium on a still frame ismore difficult to see in the stop-frame mode than inreal-time. The loss of visual integration imparted bymotion also contributes to this difficulty. In tracingthe echograms and the angiograms, the minorirregularities of the ventricular surface were ignored.The papillary muscles were excluded from the outlinetracings, in accordance with common practice. Thus,the circular, elliptical or irregular outline was con-tinued when a papillary muscle was encountered. Apapillary muscle was recognized as either anangiographic filling defect or an echographic incrop-ping of the wall. The designation of such a structure as
549
by guest on May 10, 2018
http://circ.ahajournals.org/D
ownloaded from
VOL 60, No 3, SEPTEMBER 1979
// I
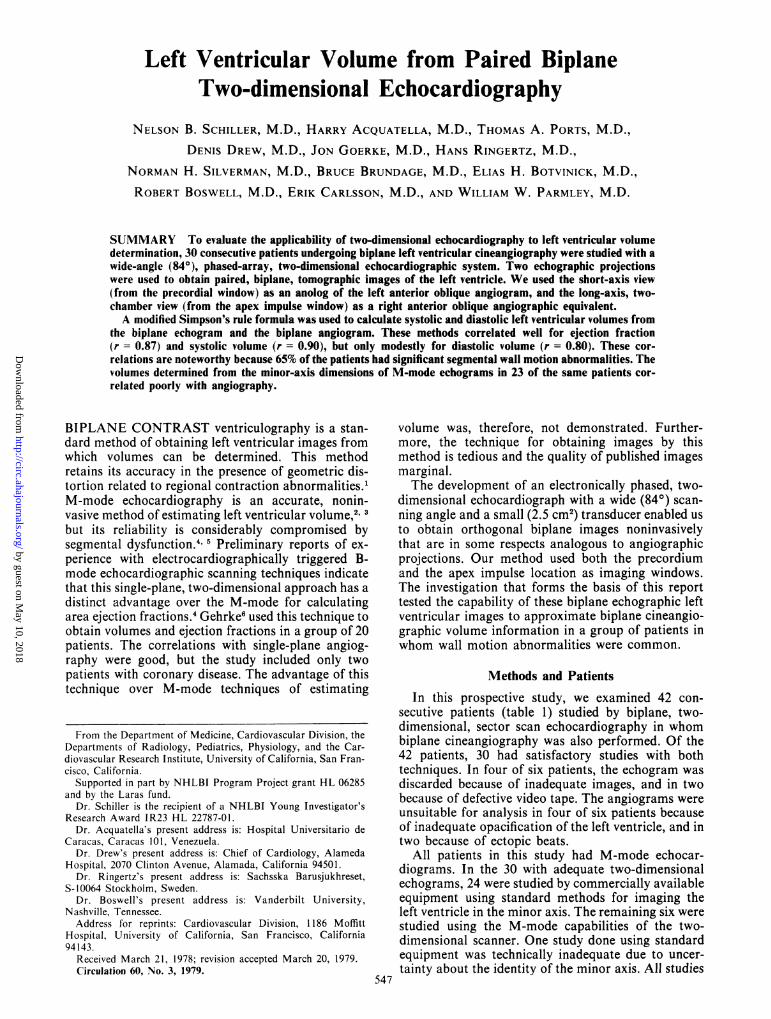
F GL[i RI 3. Transducer position and beamplane used to image the ventricle in the two-chamber, long-axis, apical view. LA = leftatrium; L V= leJi ventricle; 1W inJeriorwall; A-LW= anterolateral wall.
papillary muscle was made by careful observation ofthe real-time image. The same person traced all theechograms without knowledge of the angiograms.Another person retraced nine echograms randomlyselected from the 30. Each of these was retraced fourtimes. Two additionial persons digitized the echogramsand the angiograms.Angiographic and two-dimensional tracings were
manually digitized by a desktop computer (Hewlett-Packard 9820A) that was programmed to calculateleft ventricular volume according to the method ofGoerke and Carlsson,', 7 in which computations arebased on a modification of Simpson's rule. The two
orthogonal projections are oriented along a commonaxis and ventricular outlines are traced with thedigitizer. Each projection is divided into 20 sectionsalong the common axis and the volume is calculatedaccording to the formula:
20V F1r aibi
4 i = Iwhere F is the total magnification factor calculated ac-cording to F = f1f(f1 + f2)/2, f1 and f2 are the enlarge-ment factors calculated for the two projections fromthe geometry of the recordings, and ai and b, are theaxes of the ith elliptical cut. For angiograms, the fac-
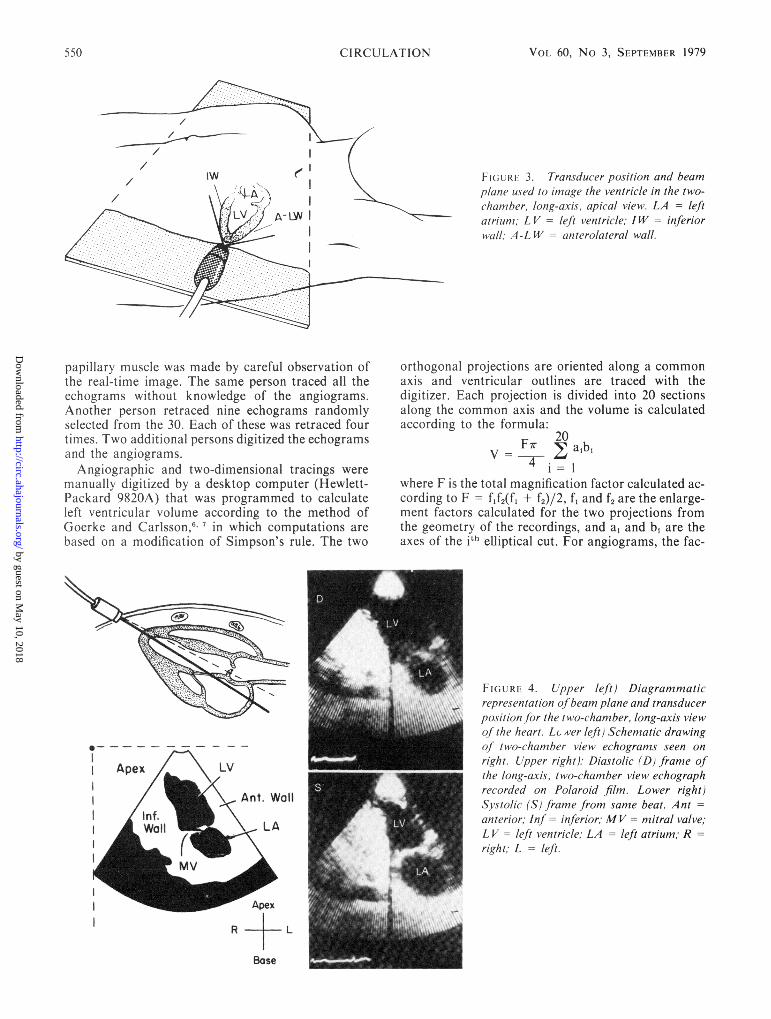
FIGLR, 4. Lpper left) Diagrammaticrepresentation of beam plane and transducerposition for the two-chamber, long-axis viewo/ the heart. Lx ver left) Schematic drawingof two-chamber view echograms seen onright. Upper right): Diastolic (D) frame ofthe long-avis, two-chamnber view echographrecorded on Polaroid film. Lower right)Systolic (S) framne from same beat. Antanterior; Inf - inferior; MV= mitral valve;L V left ventricle; LA = left atrium; Rright; L = left.
- Apex
R +L
Base
550 CIRCULATION3
by guest on May 10, 2018
http://circ.ahajournals.org/D
ownloaded from

BIPLANE ECHOCARDIOGRAPHY/CARDIAC VOLUME/Schiller et al.
tors f1 and f2 are determined by the program from cal-culated orthogonal view area centroids, marked beamcenters and measured tube-to-image distances. Whenthe echoes are digitized, f1 and f2 are taken equal to 1,as there is no magnification involved in the method.Simultaneous plotting of the ventricular outlines withnumeric readouts of the volumes and ejection fractionconstitutes the output of the computer.
This algorithm assumes that it will be presentedwith two orthogonal long axes. However, in using theRAO and LAO angiographic views, the second longaxis (the LAO) is most often foreshortened. In orderto assess the impact of this foreshortening, we ob-tained radiographs of radiopaque casts of a variety ofleft ventricles. These casts were imaged in the RAOand LAO projections and the volumes calculated withour desktop digitizer-computer. The correlation co-efficient between the calculated volume and the water-displacement volume of these casts was greater thanr = 0.95. In spite of a wide variety of ventricularshapes and sizes, there were no outlying points.Foreshortening required systematically correctingcalculated volumes by multiplying by a factor of 1.23.In applying this algorithm to our paired echographicimages, the condition of the algorithm that assumescommon long axes is also not met. However, since theangiographic correlations are reliable after applying acorrection factor, we used the same algorithm foranalyzing the echograms because these are always thesame in relationship to the heart and thus morereproducible in relationship to the cardiac axes thanthe angiogram.
Figure 5 shows the outlines of a computer-generated echogram and angiogram from the samepatient. The discrepancy in size is mainly due tomagnification of the x-ray (see Discussion). Data ob-tained from analysis of the 30 patients were evaluatedstatistically by linear regression analysis of pairedvolume data. Systolic and diastolic values wereanalyzed separately. In addition to the calculation ofcorrelation coefficients, the standard error of the es-timate was derived and the 95% confidence limits wereplotted with each set of data.
ResultsEnd-diastolic Left Ventricular Volume
The correlation coefficient (r) between biplaneechocardiographic left ventricular end-diastolicvolume and biplane echocardiographic end-diastolicvolume in 30 patients was 0.80. The relationshipbetween the echographically derived data and theangiographic data is described by the linear regressionequation:
EDVecho = 0.7 EDVangio -I
where EDV = end-diastolic volume. The standarderror of the estimate is 15 ml/m2. The mean value forangiographic end-diastolic volumes was 70.7 ml/m2,and 50.4 ml/m2 for the echographic end-diastolicvolumes. Thus, in these 30 patients, the echographic
ECHO
2 oh
ANGIO
_ _-~ LAO RAO
FIGURE 5. Computer-generated outline drawingsfrom theangiogram and echogram ofthe same patient. The solid out-line is at end-diastole, the dotted outline at end-systole. Thesize difference between the echogram (ECHO) and theangiogram (ANGIO) is mostly due to magnification in-herent in the angiographic technique. The apex, often im-aged in the left anterior oblique (LAO) angiogram, accountsfor further size of contour differences. RA0 = rightanterior oblique; 2 Ch = two chamber; SA = short axis.
determination of end-diastolic volume underestimatedthe angiographic value by 30%. Figure 6 is a plot ofthese data. The outer lines are the 95% confidencelimits of the data.
End-systolic Left Ventricular Volume
The correlation coefficient (r) between biplaneechocardiographic left ventricular end-systolic volumeand biplane angiographic end-systolic volume in 30patients was 0.90. The relationship between theechographically derived data and the angiographicdata is described by the linear regression equation:
ESVecho = 0.7 ESVangio - 2
where ESV = end-systolic volume. The standarderror of the estimate is 8.5 ml/m2. The mean value forthe angiographic end-systolic volume was 33.8 ml/m2,and 22.8 ml/m2 for the echocardiographic end-systolicvolume. Thus, in these 30 patients, the echo-graphically determined end-systolic volume under-estimated the angiographic value by 33%. Figure 7 is aplot of these data. The outer lines on the graph are the95% confidence limits of the data.
Left Ventricular Ejection Fraction
The correlation between ejection fraction calculatedfrom the biplane echocardiographic end-systolic andend-diastolic volumes and that calculated fromangiographic data in the 30 patients was good(r = 0.87). The relationship between the echo-graphically and angiographically derived ejection
551
by guest on May 10, 2018
http://circ.ahajournals.org/D
ownloaded from

CIRCULATION
EDIVECHO .=7 ANGIO -/-2 /5r=. 80n=30
VOL 60, No 3, SEPTEMBER 1979
FiGURE 6. Biplane angiographic (ANGIO)end-diastolic volumes are plotted againstbiplane echographic end-diastolic volume(EDVH,,() in 30 patients. Outer lines arethe 95% confidence limits of the data. Thesvtandard error of the estimate is given at theend of the equation.
BIPLANE ANGIO END-DIASTOLIC VOLUME ML/M2
is described by the linear regression equa-
EFecho = EFangio + 5
where EF = ejection fraction. The standard error ofthe estimate is 7.6%. The mean angiographic ejection
160_ESVECHO .7 AAG/O -22 8.5r:.90n =30
LU
E 120_J
0
0
~80
zLU
00
UJ
z ZX AXX
fraction was 54.4%, and the mean echographic ejec-tion fraction was 59.8%. Thus, in these 30 patients,there was a 10% overestimation of ejection fraction bythe echographic technique. Figure 8 is a plot of thesedata. The outer lines on the graph are the 95% con-fidence limits of the data.
FIGURE 7. Biplane angiographic (ANGIO)end-systolic volume plotted against biplaneechographic end-systolic volume (ES Vecho)in 30 patients. Outer lines are the 95% con-
fidence limits of the data.
160
BIPLANE ANGIO END-SYSTOLIC VOLUME ML/M2
552
C4
I-L_)
0
0
zu
0I
.na
z
a-1:co
fractionstion:
by guest on May 10, 2018
http://circ.ahajournals.org/D
ownloaded from

BIPLANE ECHOCARDIOGRAPHY/CARDIAC VOLUME/Schiller et al.
FIGURE 8. Biplane angiographic (ANGIO)ejection fraction, plotted against biplaneechographic ejection fraction (EFECHO) in 30patients. Outer lines are the 95% confidencelimits of the data.
I-,. -.---40 60 80 100
BIPLANE ANGIO EJECTION FRACTION %
Interobserver and Intraobserver Variation
Regression analysis of the echographic volume datacalculated by two observers yielded correlationcoefficients for end-diastole, end-systole and ejectionfraction of 0.82, 0.95 and 0.95, respectively. Themeasurements from the same observer varied ± 4%.
M-mode vs Angiography (table 2, fig. 9)
Volume data derived from the M-mode records in23 patients were compared with their angiographicdata by linear regression analysis. Correlationcoefficients for end-diastolic and end-systolic volumeand ejection fraction were 0.49, 0.56 and 0.64, respec-tively.
DiscussionWe used a paired biplane echocardiographic
technique to show that in a population where segmen-tal wall motion abnormalities were prevalent, quan-titative left ventricular volume information com-parable in some respects to biplane angiographic datacould be obtained noninvasively. The long-axis viewused in this study was obtained from a new approachthat uses the apex impulse location as an echographicwindow.8 In addition to providing a long-axis image,
this view is unique in that it allows visualization of theanterolateral and inferior left ventricular walls, whichare not usually seen by M-mode echocardiography.This apical view is analogous to the angiographicRAO projection, and, when combined with the short-axis view that served as an analogue to the LAO
angiographic projection, provides paired, orthogonal,biplane images of the left ventricle.One of the most important features of this study is
that it was conducted using a population of patientswith significant wall motion abnormalities (16 of 30from myocardial infarction and two of 20 from atrialseptal defect). Previous M-mode echographic studiesof patients with significant segmental disease have cor-related poorly with angiography.45 Poor correlationwas indeed the case when the 23 technically adequateM-mode echograms from our 30 patients were com-pared with their angiographic data. The correlationcoefficients from linear regression of M-mode volumesand biplane echographic volumes on angiographicvolumes are listed in table 2 and plotted in figure 9.These data underscore the discrepancy betweenvolume information derived from M-mode, a one-dimensional source, and that from two-dimensionalecho, a biplane source. The generally poor correlationbetween M-mode volumes and angiography in cor-
TABLE 2. Correlation Coefficients
Biplane echogram M-mode echogramvs vs
angiogram (n = 30) angiogram (n = 23)
End-diastolicvolume r = 0.80 r = 0.49
End-systolicvolume r = 0.90 r = 0.56
Ejectionfraction r = 0.87 r = 0.64
°OOF EQFCHO = ANG/O t5± 76r=.87n=30
80k
601-
z0
I-.
zQu
tooLUJ
0IULUJLuz
CD
40L
20k
v o3n
553
eu
by guest on May 10, 2018
http://circ.ahajournals.org/D
ownloaded from

VOL 60, No 3, SEPTEMBER 1979
'a
n&
* 0
.00
.0 **0
20 40 60 80 100 120 140 160 180BIPLANE ANGIO END-DIASTOLIC VOLUME (ml)
126 -
I112
) 983
4. 84)
> 70
0 56 -
j 42 -
28'-
14L
0L--
r -0.30n = 23
r a
90-i
80
60
z
50
*
14 28 42 56f 70 8f4 98 1 12 1 26
BIPLAfNE ANG-lO END-SYSTOLI VOLUME (l
0
0
4,
* *g0
%
40
30,~~~~~~~
30-10 /10
10 20 30 40 50 60 70 80 90
BIPLANE ANG1O EJECTION FRACTION (-.)
[(iU RI 9. Biplane angiographic (ANGIO) volumes and ejection fraction are plotted against volume and ejection fractioncalculated frontM-mode echograms in 23 patients. Outer lines are the 95% confidence limits of the data. Left) Angiographicend-diastolic volume vs M-mode, middle) angiographic end-systolic volume vs M-mode: right) angiographic ejection fraction vsM-niode.
onary disease has become an established fact. Our ex-perience parallels that of others,4 ' 9 and confirmsthat the close correlations obtained by early workerswere due to the virtually complete elimination ofpatients with segmental disease from their studies.
In addition to having advantages over the M-modetechnique, biplane echocardiography may have aslight advantage over single-plane angiography whenboth are compared with biplane angiography. This im-pression comes from comparing our results withreported results obtained from evaluation of bothangiographic techniques.'
While the correlations with angiography were rea-sonable, the two-dimensional echographic techniqueunderestimated ventricular size by approximately30%. This degree of underestimation appears to becaused by several factors. For example, figure 5 il-lustrates the difference between the short-axisechogram and the LAO angiogram, which shows aportion of the apex and a portion of the base, while theechogram shows only the minor axis of the left ventri-cle. Including the apex in the angiogram contributes tomaking the angiographic volumes larger. Anotherdifference between the echographic tracing and theangiogram is the difference in the size of the outlines.Much of this difference is due to the magnification ofthe image inherent in the angiographic technique.However, a portion of this size disparity is alsobecause angiography, a shadow technique, alwaysproduces a maximally sized image that two-dimen-sional echocardiography, a tomographic technique,can only approach. In spite of these shortcomings, weselected the short axis as a LAO analogue because ityielded a highly reproducible 3600 view of left ven-tricular wall motion, was orthogonal to the apicallong-axis view, and was similar to the LAO angio-gram.The two-chamber apical view was selected because
it seemed to have advantages over the other apicalview, the four-chamber view.'0 Although the four-chamber view also provides a long-axis view of the leftventricle, the axis of the tomographic slice can lie
anywhere along the septum (a structure that occupiesone-third of the ventricular circumference) and stillproduce a four-chamber view of the heart. By con-trast, to obtain a two-chamber view, the septum andright ventricle must be eliminated, which limits theplane of the slice, and, in contrast to the four-chamberview, enhances reproducibility. In our experience, thetwo-chamber view has a somewhat higher yield ofsuccessfully imaged endocardium and apexes.
Originally, we considered combining the long-axisapical views, because this combination most closelyfulfilled the assumption of our biplane algorithm thatboth planes share a common long axis. However, thegenerally excellent view of endocardial motionprovided by the short axis, the standardizability andreproducibility of the two-chamber view, and theanalogous relationship of these views to theangiogram impelled us to choose this combination forthis study. The best predictor of angiographic volumewas the end-systolic echographic image. There arethree reasons for its apparent superiority. First, en-docardial imaging was always better in systole. Sec-ond, walls that may have moved beyond the limit ofthe field or dropped out partially during atrial con-traction, were usually well imaged during systole.Third, the LAO angiogram more closely resemblesthe true short axis of the left ventricle during systole.
While the correlation between echographic systolicvolume and angiographic volume was at a level whichapproached clinical usefulness, the scatter and weakercorrelation of diastolic volume measurements appearto make general clinical use of diastolic measurementa less secure practice. The poorer quality of thediastolic image appears to be an important reason forits weaker correlation with angiography. However,other factors were also operating to introduce scatterinto our data. First, the echo studies were not per-formed simultaneously with the angiograms, but wereseparated in time by 1-3 days. Changes in basal statecan introduce changes in cardiac size. Second, we didnot combine systolic and diastolic values. Such amaneuver would have extended our range of values
'E 16
140 '
y 120.
Q 80zfX
j 60
20
0
CIRCULATION554
by guest on May 10, 2018
http://circ.ahajournals.org/D
ownloaded from

BIPLANE ECHOCARDIOGRAPHY/CARDIAC VOLUME/Schiller et al.
and partially obscured the weakness of diastole.Third, we examined only adult patients. Inclusion ofvery small hearts would have improved correlations,but would have obscured the reliability of this tech-nique in the adult patient. Fourth, the ejection frac-tions in our patients were 22-84%. Prolonging ourstudy so that patients at the extremes of cardiacfunction could be included would have also served toimprove the apparent level of correlation. Fifth, angi-ograms varied in the percentage of the long axis rep-resented in the LAO projection. This variation wasprobably less during systole, when the angiogrammore closely resembles the echogram. Finally, theparallax error introduced by our tracing technique aswell as the obfuscation of the faint endocardial boun-dary by the superimposed x-ray film are further causesfor error.
Successful use of this technique will often hinge onthe operator's skill and experience, which are essentialto obtaining optimal images. Imaging difficulties aremost often encountered in the visualization of theanterior wall endocardium in the long-axis, two-chamber view. This image must be optimal for ac-curate volume analysis. Careful transducer andpatient positioning and proper gain adjustments canusually bring this area into view. Proper patientpositioning is also essential and often requires severalchanges in the degree of lateral recumbency. An ex-treme lateral position often brings the apex impulseinto contact with the surface of the examining table, sothe patient must be brought as close as possible to theedge of the bed to allow room for the transducer. Wesolved this problem by cutting out a section from theside of a thick (20.3 cm) foam rubber mattress andpositioning the apex impulse over the excavated area.The use of apex impulse as an imaging window isfacilitated by conducting the echographic examinationfrom the patient's left side.The tedious nature of tracing ventricular outlines
from a television screen will inhibit wide acceptance ofthis technique. The potential for parallax error, theobfuscation of the endocardial surface by the x-rayfilm, and the need for analyzing the data byplanimetry or computer at a site and time removedfrom the actual tracing contribute to the in-convenience of the technique. The recent developmentof a prototype minicomputer-operated, light pen,digitizing system that can trace borders directly on thecathode-ray oscilloscope tube phosphor and canautomatically compute and quickly display volume in-formation on the same television screen promises tofacilitate the evaluation of this technique.The hazards, discomfort and expense of angiog-
raphy often prevent it from being used repetitively andlimit its application. A noninvasive technique formeasuring left ventricular volume would permit the
frequent re-evaluation of a wide variety of patients. Aparticular advantage of an echographic approach isthat it has no influence on cardiac function and doesnot produce ectopic beats. It also does not require theinjection of radioactive isotopes, whose costs andavailability are disadvantageous to their use.
Based on this initial study, we feel that this tech-nique may have wide applicability to the study of leftventricular function. Its acceptability depends onrecognition of the limitations discussed above, and onthe development of further refinements. In summary,we have introduced a biplane, two-dimensionalechographic technique for obtaining left ventricularvolumes that is relatively uncompromised by thepresence of segmental ventricular disease. It can beused to measure systolic volume and ejection fractionwith reasonable accuracy, but its capacity to measurediastolic volume, while statistically significant andsuperior to M-mode, is less than desirable for clinicalapplication.
Acknowledgments
The authors gratefully acknowledge the contributions of YinnieYee and Jan Sundstrom (technical), Marilyn Gruen and MargeWilliams (editorial), Anne Holly (statistical), and Mary Helen Stulland William Bunker (artistic and photographic).
References1. Cohn PF, Gorlin R, Adams DF, Chahine RA, Herman MV:
Comparison of biplane and single-plane left ventriculograms inpatients with coronary artery disease. Am J Cardiol 33: 1, 1974
2. Fortuin NJ, Hood WP, Sherman ME, Craige E: Determinationof left ventricular volumes by ultrasound. Circulation 44: 575,1971
3. Gibson DG, Brown DJ: Continuous assessment of left ven-tricular shape in man. Br Heart J 37: 904, 1975
4. Teicholz LE, Cohen MB, Sonnenblick EH: Study of left ven-tricular geometry and function by B-scan ultrasonography inpatients with and without asynergy. N Engl J Med 291: 1220,1974
5. Ratshin RA, Boyd CN, Rackley CE, Moraski RE, Russell ROJr: Quantitative echocardiography: correlations with ven-tricular volumes by angiography in patients with coronaryartery disease with and without wall motion abnormalities.(abstr) Circulation 48 (suppl IV): IV-48, 1973
6. Gehrke J, Leeman S, Raphael M, Pridie RB: Noninvasive leftventricular volume determination by two-dimensional echocar-diography. Br Heart J 37: 911, 1975
7. Goerke RJ, Carlsson E: Calculation of right and left ventricularvolumes: method using standard computer equipment andbiplane angiograms. Invest Radiol 2: 360, 1967
8. Schiller NB, Silverman NH: Apex echocardiology: a newmethod for detecting acquired heart disease using an 800phased array real-time two-dimensional sector scanner. (abstr)Am J Cardiol 39: 266, 1977
9. Massie BM, Schiller NB, Parmley WW, Ratshin R: Mitral-septal separation: a new echocardiographic index of left ven-tricular function. Am J Cardiol 39: 1008, 1977
10. Silverman NH, Schiller NB: Apex echocardiography: a two-dimensional technique for evaluating congenital heart disease.Circulation 57: 503, 1978
555
by guest on May 10, 2018
http://circ.ahajournals.org/D
ownloaded from

Brundage, E H Botvinick, R Boswell, E Carlsson and W W ParmleyN B Schiller, H Acquatella, T A Ports, D Drew, J Goerke, H Ringertz, N H Silverman, B
Left ventricular volume from paired biplane two-dimensional echocardiography.
Print ISSN: 0009-7322. Online ISSN: 1524-4539 Copyright © 1979 American Heart Association, Inc. All rights reserved.
is published by the American Heart Association, 7272 Greenville Avenue, Dallas, TX 75231Circulation doi: 10.1161/01.CIR.60.3.547
1979;60:547-555Circulation.
http://circ.ahajournals.org/content/60/3/547the World Wide Web at:
The online version of this article, along with updated information and services, is located on
http://circ.ahajournals.org//subscriptions/
is online at: Circulation Information about subscribing to Subscriptions:
http://www.lww.com/reprints Information about reprints can be found online at: Reprints:
document. Permissions and Rights Question and Answer information about this process is available in the
located, click Request Permissions in the middle column of the Web page under Services. FurtherEditorial Office. Once the online version of the published article for which permission is being requested is
can be obtained via RightsLink, a service of the Copyright Clearance Center, not theCirculationpublished in Requests for permissions to reproduce figures, tables, or portions of articles originallyPermissions:
by guest on May 10, 2018
http://circ.ahajournals.org/D
ownloaded from