The Left Behind* series Left Behind - Higher Intellect | Content

Left Behind By Design:
Proficiency Counts and Test-Based Accountability
"We were told to cross off the kids who would never pass. We were told to cross off the kids who, if we handed them the test tomorrow, they would pass. And then the kids who were left over, those were the kids we were supposed to focus on."†
Derek Neal University of Chicago and NBER
Diane Whitmore Schanzenbach University of Chicago
Working Paper
*Please do not quote or cite without permission
†Quote from an anonymous middle school staff member in “Rockville School's Efforts Raise Questions of Test-Prep Ethics” by Daniel de Vise, Washington Post, March 4, 2007. Paper presented at the NCLB: Emerging Findings Research Conference at the Urban Institute, Washington, D.C. on August 12, 2009. The conference was supported, in part, by the National Center for the Analysis of Longitudinal Data in Education Research (CALDER), funded by Grant R305A060018 to the Urban Institute from the Institute of Education Sciences, U.S. Department of Education and the National Center for Performance Incentives (NCPI) at Vanderbilt University. The authors thank Elaine Allensworth, John Q. Easton, and Todd Rosenkranz of the Consortium on Chicago School Research for their assistance in using the data, and Amy Nowell of Chicago Public Schools (CPS). They also thank participants in the Federal Reserve Bank of Chicago’s Labor Economics seminar, the Harris School’s Public Policy and Economics Workshop, and the joint meeting of the Institute for Research on Poverty’s Summer Research Workshop and the Chicago Workshop on Black-White Inequality, as well as Fernando Alvarez, Gadi Barlevy, Kelly Bedard, Julie Berry Cullen, Jennifer Booher-Jennings, Brian Jacob, Roger Myerson, Kalina Michalska, Phil Reny, and Balazs Szentes for useful comments and discussions, and Chloe Hutchinson, Garrett Hagemann, and Richard Olson for helpful research assistance. They owe special thanks to Phil Hansen for being so generous with his time and his knowledge of accountability within CPS. Neal thanks the Searle Freedom Trust for generous research support. The authors also thank the Population Research Center of NORC and the University of Chicago for research support. The views expressed in the paper are solely those of the authors and may not reflect those of the funders or supporting organizations. Any errors are attributable to the authors.
Abstract
Many test-based accountability systems, including the No Child Left
Behind Act of 2001 (NCLB), place great weight on the numbers of students
who score at or above specified proficiency levels in various subjects.
Accountability systems based on these metrics often provide incentives for
teachers and principals to target children near current proficiency levels for extra
attention, but these same systems provide weak incentives to devote extra
attention to students who are clearly proficient already or who have little chance
of becoming proficient in the near term. The authors show that, based on fifth
grade test scores from the Chicago Public Schools, both the introduction of
NCLB in 2002 and the introduction of similar district level reforms in 1996
generated noteworthy increases in reading and math scores among students in
the middle of the achievement distribution. Nonetheless, the least academically
advantaged students in Chicago did not score higher in math or reading
following the introduction of accountability, and the authors find only mixed
evidence of score gains among the most advantaged students. A large existing
literature argues that accountability systems built around standardized tests
greatly affect the amount of time that teachers devote to different topics. Results
for fifth graders in Chicago, as well as related results for sixth graders after the
1996 reform, suggest that the choice of the proficiency standard in such
accountability systems determines the amount of time that teachers devote to
students of different ability levels.

2
Over the past decade, test-based accountability systems have been a key element of many education reform proposals at the state and district levels, and the No Child Left Behind Act (NCLB) of 2001 created a federal mandate for test-based accountability in every state. A key feature of NCLB is the requirement that each state adopt an accountability system built, in large part, on standardized testing in reading and math for students in grades three through eight. The law seeks to hold schools accountable for student performance by mandating that schools make the results of these standardized assessments available to parents and that schools report not only aggregate results but also results specific to particular demographic groups, e.g. groups defined by race or special education status. These reports must convey the fractions of students in particular schools and demographic groups within schools who have achieved proficiency in a particular subject for their grade level. NCLB spells out a set of sanctions that schools should expect to face if they persistently report proficiency levels below the targets set by their state for each calendar year.1
In this paper, we use data from the Chicago Public Schools (CPS) to examine how a specific aspect of the implementation of NCLB affects the distribution of measured changes in achievement among students. The implementation of NCLB in most states and the design of many state and local accountability systems tie rewards and sanctions to the number of students in certain groups scoring above given proficiency thresholds. We use the introduction of two separate accountability systems in CPS, a district-wide system implemented in 1996 and the introduction of NCLB in 2002, to investigate the impacts of proficiency-count accountability systems on the distribution of student performance.
In all our analyses, we focus on test score outcomes among students in a given grade. We compare students who took a specific high stakes exam under a new accountability system with students who took the same exam under low stakes in the year before the accountability system was implemented. Further, because we restrict our comparisons to students who take exams either right before or right after the implementation of an accountability system, we can make these comparisons holding constant student performance on a similar low-stakes exam in an earlier grade. Thus, we are able to measure changes in test scores associated with the accountability system at different points in the distribution of prior achievement.
Much of the existing literature focuses on whether or not the reported test score
gains that, on average, tend to follow the introduction of accountability systems reflect general increases in subject mastery or increases in test-taking skills that are specific to a certain assessment.2 This issue is important for the current policy debate concerning accountability systems, but it will not be our focus. Rather, we focus on the distributional
1 See http://www.ed.gov/nclb/overview/intro/execsumm.html 2 See Carnoy and Loeb (2002), Grissmer and Flanagan (1998), Hanushek and Raymond (2004), Jacob (2005), and Koretz (2002). These studies are motivated by the concern that “teaching to the test” may artificially inflate scores. See Cullen and Reback (2006) for an assessment of strategic efforts among Texas schools to improve reported scores by manipulating which students are exempt from testing.

3
consequences of the NCLB design. We argue based on a simple model of effort allocation within schools that the use of proficiency counts in accountability systems may provide no benefits for some students. A proficiency count system does not reward schools for improving student performance unless the improvements bring the students up to a specific proficiency standard. Thus, schools face weak incentives to devote extra attention to students who are either already proficient or who have little chance of becoming proficient in the near term.
Lazear (2006) notes that, on a different dimension, NCLB is designed to help
those who may struggle most to become proficient. He shows that accountability systems built around assessments that are tied to a narrow set of curriculum related questions may generate a greater effort response among those who find learning difficult than systems based on more broad assessments of general subject mastery. Lazear argues that students who find learning difficult, and their teachers, may not respond to the accountability system if the preparation for the assessment requires mastery of too many topics or familiarity with too many types of questions. The results we derive are in no way in conflict with Lazear’s. Our paper simply focuses on a different feature of NCLB. We view our empirical results below as evidence that we have chosen to focus on an empirically important feature of the NCLB design.
We provide results that characterize the distribution of test score changes among fifth graders in Chicago following the introduction of NCLB in 2002, and we present similar results for fifth graders tested in Chicago in 1998 following the introduction of a school accountability system that was similar to NCLB on many dimensions. The results for both sets of fifth graders follow a strikingly consistent pattern. Students at the bottom of the distribution of measured third grade achievement score the same or lower following these reforms than one would have expected given the pre-reform relationships between third and fifth grade scores, but students in the middle of the distribution score significantly higher than expected. Further, there is, at best, mixed evidence of gains among students in the top decile.
We also present results for sixth and eighth graders tested in 1998. These
students were affected directly by both the school level accountability system instituted within CPS and a separate set of test score cutoffs used to determine summer school placement and retention decisions. Chicago’s effort to end social promotion linked summer school attendance and retention decisions to score cutoffs that were much lower than the proficiency cutoffs used to determine school level performance. Thus, sixth and eighth graders who had little chance of contributing to their school’s overall proficiency rating did face strong incentives to work harder in school. The results for these sixth and eighth graders follow the same general pattern observed in the fifth grade results. Estimated gains associated with the reform are larger in the middle of the distribution than in the tails. However, the estimated gains among sixth graders tend to be larger at each decile, and our estimated treatment effects for the least able sixth and eighth graders are never negative.
4
Our results support the hypothesis that accountability systems based on the number of students who achieve a proficiency standard provide relatively weak incentives to devote extra attention to either students who have no realistic chance of becoming proficient in the near term or students who are already proficient. Proponents of NCLB may counter that NCLB mitigates any incentives to ignore less able students by requiring a 100% proficiency rate in all schools by 2013-14. However, it is not clear that this provision of the law constitutes a credible threat,3 and even if one assumes that principals and teachers take the 100% target seriously, this feature of the law should make things worse for the current cohort of elementary school students who are far below grade level in math and reading. Schools must realize that many of their current students will be “off the books” long before their state plans require them to be near 100% proficient. Thus, NCLB provides no incentive to devote extra attention to an eighth grader who is currently reading at fifth grade level. In all likelihood, even the best efforts of teachers cannot bring this student up to proficiency in one year, and the student will usually be in a different school for ninth grade.4
The distributional consequences of the Illinois implementation of NCLB are
complex. Hanushek and Raymond (2004) argue based on National Assessment of Educational Progress (NAEP) data and differences over time and among states in the stakes associated with state-level accountability systems that test-based accountability reduces racial achievement gaps, and our results are not inconsistent with this conclusion. The Chicago Public Schools contain relatively few white students, and average test scores did increase following both NCLB and the CPS reforms of 1996. Thus, although we do not have comparable data from other school districts in Illinois, our results certainly admit the possibility that NCLB narrowed the achievement gaps between whites and minorities in Illinois. However, the group of students within CPS who were likely not helped and may have been harmed by NCLB is sizeable and predominately Black and Hispanic.
Our simple model of effort allocation within schools also highlights two
important tensions in the current debates over how NCLB should be implemented. The Department of Education has consistently encouraged states to set “high standards” for proficiency. However, our model shows that raising standards may actually increase the number of low achieving children who are “left behind” by increasing the number for whom the standard is out of reach. In contrast, higher standards reduce the number of high ability children who are already proficient and can only increase the number of high ability students who receive extra attention under NCLB. Thus, the use of a common proficiency standard at the state level may create a tradeoff between the achievement of high and low ability students.
3 NCLB contains a reauthorization requirement for 2007. Thus, goals that push the limits of credulity and are not required by NCLB until 2014 may play a small role in shaping teachers’ and principals’ expectations concerning how the law will be enforced. 4 Further, the student may not remain in school long enough to be tested as a high school student.

5
Further, the uniformity of NCLB requirements within a state works against another stated purpose of NCLB. NCLB lists the placement of highly qualified teachers in all classrooms as an explicit goal. However, because NCLB sanctions are harder to avoid in schools with large numbers of disadvantaged students, NCLB should adversely affect the supply of qualified teachers to schools that serve disadvantaged students. Under NCLB, teachers in schools filled with disadvantaged children, especially if they are located in a state with many advantaged communities and a high proficiency standard, now face constant stress and uncertainty about the consequences of sanctions even if they are doing a good job. Thus, while NCLB puts pressure on principals to hire and retain the best teachers, it creates working conditions in disadvantaged schools that should make it harder to recruit and retain good teachers. 5
We present evidence in support of a simple thesis. Accountability systems cannot
be used to raise the achievement of all students unless these systems are designed in a manner that rewards schools for all improvements in student achievement and not just those improvements that involve crossing a fixed proficiency threshold. Our paper and several related papers provide evidence consistent with the view that many students do benefit academically from NCLB and similar test-based accountability systems at the state and district levels. Nonetheless, contrary to its name, it is not designed to make sure that no child is left behind. NCLB’s use of proficiency counts as the key metric of success almost guarantees that significant numbers of academically disadvantaged students, especially those in states with high proficiency standards, will not benefit and may be harmed during its implementation.
Related work on the use of proficiency counts in accountability systems other
than NCLB provides results that are consistent with ours. Reback (2006) uses data from Texas during the 1990s to measure how schools allocated effort in response to a state-wide accountability system. He finds that achievement gains are larger among students whose gains are likely to make the greatest marginal contribution to their school’s overall proficiency rating. Burgess et al. (2005) use English data to show that achievement gains are lower among less able students if they attend schools in which a large fraction of the student body are marginal students with respect to an important score threshold in the English accountability system. These papers differ from ours methodologically because the authors do not have access to data on achievement growth prior to the introduction of accountability. Their focus is on comparisons among students who may receive differential treatment because of interaction effects between the composition of their peers and the proficiency rules of a particular accountability system. In contrast, our empirical work measures differences between students of similar ability levels who took the same test under different accountability regimes.
5 See Clotfelter et al. (2004) for empirical work on the effects of an earlier accountability system in North Carolina on teacher retention. States typically set their baseline proficiency rate as the percent proficient in the school representing the 20th percentile in state enrollment. As a result, a substantial number of schools were deemed failing from the beginning.

6
Several studies of particular schools also find results consistent with those we present below. Gillborn and Youdell (2000) coined the term “educational triage” to describe their findings from case studies of English schools. They document how these schools targeted specific groups of students for special instruction in order to maximize the number of students who performed above certain thresholds in the English system. More recently, Booher-Jennings (2005) and White and Rosenbaum (2007) present evidence from case studies of two schools serving economically disadvantaged students in Texas and Chicago respectively. White and Rosenbaum document the actions of teachers and administrators in response to the introduction of the 1996 district level accountability system in Chicago, a system we describe in detail below. Booher-Jennings documents how the staff of a school in Texas responded to the state’s accountability system. Both provide clear evidence that teachers and administrators made conscious and deliberate decisions to shift resources away from low performing students and toward students who had more realistic chances of exceeding key threshold scores. For example, White and Rosenbaum describe how the Chicago school in question targeted students near important threshold scores during the implementation of a new after-school program, and Booher-Jennings describes how the teachers in the Texas school used data on prior achievement to triage students into ability groups. These teachers then focused their efforts on the group of students for whom the state proficiency standard seemed attainable given moderate amounts of extra instruction.
In the next section, we present a simple model of teacher effort within schools.
Then, we turn to the details of the 1996 and 2002 reforms and their implementation in Chicago before turning to our empirical results. After presenting our results, we discuss the challenges that policy makers face if they wish to replace NCLB’s reliance on proficiency counts with a system of measuring progress that will value the achievement gains of all students. Currently, a number of states have been granted waivers that allow them to calculate AYP using more continuous measures of student performance than simple proficiency counts. We analyze the likely effects of these alternative schemes using variants of the same model of teacher effort that we describe in the next section. Our model clearly illustrates that these waivers make it easier to design accountability systems that do not build in direct incentives to leave some children behind, but we argue that tough design issues remain unresolved. In our conclusion, we discuss the implications of our results in the context of the existing economics literature on contests and tournaments. 1.) Keeping Score Using Proficiency Counts
Consider a school that is part of a test-based accountability system. Two policies shape the actions of teachers and principals. First, the central administration, in cooperation with parents, provides enough monitoring to make sure the school provides some minimal level of instruction to all students. Second, there is a testing system that labels each student as either passing or failing, and the principal and teachers incur costs that are a function of the number of students who fail. These costs may take many forms depending on the details of the accountability system. Under NCLB, schools must report publicly how many of their students are proficient, and they face serious sanctions if their

7
proficiency rates remain below statewide targets. In Chicago, the district adopted a system in 1996 that measured school level performance based on the number of students exceeding national norms on specific exams. In addition, Chicago schools and students faced additional pressures related to a separate set of lower thresholds (on the same tests) that determined whether or not students in grades 3, 6, and 8 were required to attend summer school and possibly repeat their grade.
The key point is that NCLB keeps score, and the earlier Chicago accountability system kept score, based on the number of students whose test scores exceed certain thresholds. Thus, we model our hypothetical accountability system as a penalty function that imposes costs on teachers and principals when students do not reach a proficiency standard, and we assume that these costs are strictly convex in the number of students who fail.
Our school can improve individual test scores by providing extra instruction at a constant cost of c per student who receives a unit of extra help. Here, extra instruction reflects efforts by principals and teachers that go beyond the minimum effort level that the district can enforce through its monitoring technology. We ignore any agency problem between principals and teachers and model the school as a unitary decision making unit.
Because the minimum level of instruction for all students is not a choice variable for the school, the school’s problem is to minimize the total cost incurred by the allocation of extra instruction among its students and the penalties associated with student failures. Suppose that there are N students in a school and each student has ability
!
"i, i =1,2,..N.
Further, assume that for any individual i, her score on the accountability test is
!
ti
= ei
+"i
+ #i
ei
= extra instruction received by student i
#i
= measurement error on i's test drawn from F(#), which has a unimodal density f(#).
The cutoff score for passing is
!
t . We assume that N is large, and we approximate the school’s objective function by treating the expected number of students who fail in each school as the actual number of failures in each school. Thus, the school’s problem is as follows:
!
(1)ei
min "[i=1
N
# F(t $ei$%
i)] + ce
i s.t. e
i& 0 'i =1,2,..N
i=1
N
#

8
Here,
!
"[.] is a penalty function that describes the sanctions suffered by a school of size N under the accountability system. This penalty function is strictly increasing and convex in the number of students who are not proficient. The first order conditions that define optimal effort require
!
"'[.] f (t # ei
* #$i) % c & i =1,2..N
Corner solutions are key to the analysis of this problem, and it is straightforward to show that zero extra effort may be given to students at either end of the ability distribution or throughout the entire distribution. However, Appendix B demonstrates that solutions do not exist that involve zero extra effort applied to a given student as well as positive extra effort applied to others students who are both more and less able. The optimal allocation of effort among students follows the pattern presented in Figure 1. Among students who receive extra instruction, the school directs the most effort to the least able and the least effort to the most able, but there may exist other students in the top or bottom of the distribution who receive no extra instruction at all. The sharp jump in extra instruction received between the most able student receiving no extra help and the least able student receiving extra help need not be present in a model that introduces uncertainty on the part of teachers regarding how able a given student may be. However, the exact shape of Figure 1 is not our main concern. Our concern is the existence of corner solutions in the extremes of the ability distribution, especially the lower tail of the ability distribution. Here, we have assumed that the marginal product of instruction is independent of student ability. If we instead made the more common assumption that ability and instruction are complements in the production of knowledge, the relative cost of raising scores among less able students would rise, and thus it would remain straightforward to construct scenarios in which students below a given ability level receive no extra attention even though more able students do benefit from the accountability system.
This simple model illustrates several noteworthy lessons about the use of proficiency counts in accountability systems. First, schools may find it optimal to ignore students who have little or no chance of reaching proficiency without intensive and costly intervention and instead concentrate on students closer to the proficiency threshold. Second, schools may also find it optimal to limit services for gifted children who are likely already proficient. These triage effects are a natural response to a system that does not reward or punish changes in achievement unless these changes increase or decrease the number of proficient students.
Third, under this type of accountability system, the choice of
!
t determines the distribution of achievement gains, and states that set “high standards” may undermine the goal of leaving no child behind. Consider an increase in the standard for proficiency
!
t . It is easy to show that this increase in the standard can only decrease and never increase the number of high ability students that receive no extra instruction. Thus, higher
9
standards can only benefit and never harm the most able students. However, a higher standard may actually increase the number of low ability students that a given school ignores by increasing the number that have little or no chance of being proficient in the near term.6 NCLB became law surrounded by political rhetoric that championed the need to end the “soft bigotry of low expectations” for disadvantaged children. It is thus ironic that “high expectations” expressed in the form of high NCLB proficiency standards may actually be detrimental to disadvantaged children.
Finally, we will not devote great attention to the most important implication of
this model because we do not have the data required to evaluate it, but one can easily imagine a more general model that imbeds our analyses of effort allocation within schools as one component in a model of the labor market for teachers and principals. Here, differences among schools in the indirect utilities associated with the solutions to the effort allocation problems faced by various schools will drive the sorting of teachers and principals among schools. Assuming the function
!
"(.) is the same for all schools of the same size, schools with more able students provide a superior working environment for principals and teachers because academically disadvantaged students raise the cost of meeting any specific passing rate given a common proficiency standard. If the distribution of initial student ability is worse in school A than school B, teachers and principals in school A must work harder than those in school B to achieve the same standing under the accountability system, and this should adversely effect the relative supply of teachers who want to teach in school A.
NCLB and any other system that holds schools to the same proficiency standards
regardless of the background of their students will adversely affect the willingness of teachers to serve disadvantaged children. A child’s test score in third grade reflects not only the quality of their instruction in school but also the gifts and abilities they have developed at home. Some children arrive at first grade knowing how to read at a second or third grade level, and others do not know the letters of the alphabet. When all children are held to the same proficiency standard, teachers are necessarily being held to different standards, and an accountability system that tells reading teachers they will be judged simply by whether or not their students read at grade level by third grade should make it even more difficult for schools in disadvantaged communities to hire good teachers and even easier for schools in affluent areas to find quality applicants. 2.) High Stakes Testing In Chicago We use data in the years surrounding the introduction of two separate accountability systems in CPS. The first, implemented in 1996, linked school level probation status to the number of students who achieved a given level of proficiency in reading on the Iowa Test of Basic Skills (ITBS). It also linked grade retention decisions concerning individual students in “promotion gate” grades to the achievement of specific
6 A higher standard does not necessarily generate this result. A higher standard also raises the baseline failure rate and, because the penalty function is convex, raises the gain associated with moving any single student up to the proficiency standard.

10
proficiency levels in reading and math. The second system is the 2002 implementation of NCLB testing in Illinois, which initially covered student performance in grades 3, 5 and 8 on the Illinois State Achievement Test (ISAT). During 1996, a new administration within the Chicago Public Schools (CPS) introduced a number of reforms, and these reforms attached serious consequences to standardized test results.7 In the fall of 1996, CPS introduced a school accountability system. Among elementary schools, probation status was determined primarily by the number of students who earned reading scores equal to or greater than the national norm for their grade. Schools on probation were forced to create and implement school improvement plans, and these schools knew that they faced the threat of reconstitution if their students’ scores did not improve. Although math scores were not a major factor in determining probation status, schools also faced pressure to improve math scores. As part of the reform efforts, CPS chose to publicly report proficiency rates in math and reading at the school level. Principals and teachers knew that the reading and math performance of their students would be reported in local newspapers, and these school report cards measured school performance using the number of students who performed at or above national norms in reading or math. With regard to sanctions and public reports, proficiency counts were the key metric of school performance in the CPS system. In addition, there were other score thresholds in reading and math that played a large role in the reform. In March 1996, before the school accountability system was introduced, CPS announced a plan to end social promotion. The new elementary school promotion policy required students in third, sixth, and eighth grades to score above specific thresholds in math and reading or attend summer school. These cutoff scores were far below the national norms that CPS would later use to calculate proficiency rates for schools, but they were clearly relevant hurdles for students in the bottom half of the CPS achievement distribution. Even the median student likely faced more than a twenty percent risk of summer school if she exerted no extra effort. Students who attended summer school were tested again at the end of summer and retained if they still had not reached the target score levels for their grade. Although this policy was announced in late March of 1996, CPS exempted third and sixth grade students from the policy until spring of 1997, but the new policy did link eighth grade summer school and retention decisions to the 1996 spring tests results.
Since the promotion policy was announced only weeks before testing began, we believe that the eighth grade exams in the spring of 1996 do not reflect many of the impacts of the reform, but we also do not believe that these exams were completely unaffected by the March announcement. For completeness, we present results for eighth graders in two appendix figures. The patterns in these figures are quite similar to those for sixth graders and are consistent with the hypothesis that the March announcement had small effects on the eighth grade exam, but we focus our discussion of the joint effects of the school accountability and retention policies on the sixth grade results because we are
7 See Bryk (2003) and Jacob (2003) for more on the history of recent reform efforts in CPS.

11
able to make a more credible designation of a treatment and control cohorts among sixth graders.
The retention policies in the CPS reforms are interesting from our perspective because CPS also built these policies around cutoff scores and because retentions forced students and their families to deal with a summer school program that they did not choose. Thus, retentions represented a source of potential frustration for parents and another source of performance pressure linked to proficiency counts. Further, the lower cutoff scores for summer school put many students at risk of summer school while still giving almost all students a real chance to avoid it. This was not the case with regard to the proficiency levels used to determine school level performance under the 1996 reforms, and it was not the case with regard to the ISAT proficiency cutoffs under NCLB in 2002. Thus, the results for sixth and eighth grade students allow us to see what the distribution of achievement gains looks like when more students have a realistic chance of meeting an important threshold score.
The 1996 CPS reforms adopted the Iowa Test of Basic Skills (ITBS) as the primary performance assessment in reading and math. Different forms of the test were given in different years, but in our analyses of ITBS data, we concentrate only on years when Form L was given. These years, 1994, 1996, and 1998, are the only years surrounding the 1996 reform that permit a comparison of pre-reform and post-reform cohorts using a common form of the ITBS. Our analyses seek to measure changes in scores relative to pre-reform baselines at different points in the distribution of prior achievement. If we use years other than the Form L years, our results will reflect not only any real differences in the effects of the reform at various ability levels but also any differences among ability levels in the accuracy of the psychometric methods used to place scores from different forms on a common scale. While it is not easy to equate scores among forms in a manner that is correct on average, the task of equating scores in a manner that is accurate at each point in the distribution of ability is even more demanding. In the 1998-99 school year, the Illinois State Board of Education (ISBE) introduced a new exam to measure performance of students relative to the state learning standards and administered the test statewide, but only in grades 3, 5 and 8. For many reasons, CPS viewed the Illinois Standards Achievement Test (ISAT) as a collection of relatively low stakes exams during the springs of 1999, 2000, and 2001.8 However, in
8 The ISAT was not a “no stakes” exam in 1999-2001. ISAT performance played a small role in the CPS rules for school accountability over this time, and the state monitored ISAT performance as well. Nonetheless, according to Phil Hansen, Chicago’s former Chief Accountability Officer, CPS began participating in ISAT under the understanding that the results would not be part of any “high stakes accountability plan.” In late fall 1999, the state made several announcements that signaled a change in this position and CPS protested. Then, in January of 2000, ISBE moderated its stance and informed CPS that it would appoint a Task Force to recommend a “comprehensive school designation system” for state-level accountability and a set of guidelines that would exempt schools

12
the fall of 2001 with the passage of NCLB looming on the horizon, the ISBE placed hundreds of schools in Illinois on a watch list based on their 1999 through 2001 scores on ISAT and also declared that the 2002 ISAT exams would be high stakes exams.
When President Bush signed NCLB in early January 2002, it became crystal clear that the 2002 ISAT would be the NCLB exam for Illinois. Further, the state announced in February that, for the purpose of calculating how long each school had failed to meet AYP under NCLB, 1999 would be designated as the baseline year and school status in the year 2000 would retroactively count as the first year of accountability. This meant that many schools in Chicago expected to start to face sanctions if their proficiency counts on the 2002 spring ISAT exams did not improve significantly. Thus, in one year, the ISAT went from a relatively low-stakes state assessment to a decidedly high stakes exam. Like the 1996 CPS reforms, the No Child Left Behind Act employs proficiency counts as the key metric of school performance. States are required to institute a statewide annual standardized test in grades three through eight, subject to parameters set by the Department of Education. States set their own proficiency standards as well as a schedule of target levels for the percent of proficient students at the school level. If the fraction of proficient students in a school is above the goal, the school is said to have met the standard for “Adequate Yearly Progress” (AYP).9 Under some circumstances, if a school does not have enough proficient students in the current year, but a substantially higher fraction than in previous years, the school may be considered to have met the AYP standard under what is called the “Safe Harbor Provision.” If a school persistently fails to meet the AYP requirement, it will face increasing sanctions. These include mandatory offering of public-school choice and extra services for current students, and at some point, the school may face reconstitution.10 We are not able to conduct our analyses of ISAT scores using a sample restricted to students who took the exact same form of the exam. ISBE typically administered ISAT using two forms simultaneously. These forms shared a large number of common items both within and across years, and thus the assessment program was designed in a manner that facilitated ISBE’s use an Item Response Theory model to place all scores on a common scale from 120 – 200. We cannot control for any form effects in our ISAT analyses because the CPS data that we use do not allow us to determine which form a given student took in a given year. Nonetheless, we note that an independent audit of the
with low ISAT scores from being placed on the state’s Academic Early Warning List if they “show evidence of continued improvement.” Thus, in the springs of 1999, 2000, and 2001, CPS took the ISAT with the expectation that the results would not have significant direct consequences in terms of the state accountability system. 9 In addition, the fraction of students passing in each subgroup above a minimum size must meet the standard. NCLB defines subgroups by race, socio-economic status, or special education category. 10 The period of sanctions (years 3-7) are sometimes referred to as years 1-5 of “school improvement status.” Reconstitution is possible at the end of this 5 year period.

13
ISAT did conclude that ISAT scores are comparable over time and among forms of the exam.11 3.) Changes in Scores All the figures presented in this section follow a common format. They display differences between mean test scores in a specific grade following the introduction of high stakes testing and mean predicted scores based on data from the period prior to high stakes testing. We create our estimation samples using selection rules that take the following form: we include persons who were enrolled in CPS in year t and year t+2 in grades n and n+2 respectively, and we restrict our samples to students who were tested in math and reading in both years.12 The two year intervals reflect the fact that 1994, 1996, and 1998 are years centered around the 1996 reform that involve assessment using the same form of the ITBS. Further, in the period surrounding 2002, ISBE administered the ISAT in only third, fifth, and eighth grades. We cannot analyze eighth grade scores in the pre-NCLB period given controls for fifth grade achievement because the ISAT was first administered in 1999, but we can use the third grade scores from 1999 and the fifth grade scores from 2001 to estimate the pre-NCLB relationship between ISAT scores in fifth and third grades.13 In all our analyses, we compare outcomes in a specific grade for two different cohorts of students. Both cohorts took tests in two grades, and both cohorts took their tests in the lower grade under low stakes. However, the latter cohort took exams in the higher grade under high stakes. For our ISAT results, these stakes reflect Illinois’ 2002 implementation of NCLB. For our ITBS results, these stakes reflect the 1996 introduction of CPS’s accountability system. Our goal is to examine how test scores in the higher grade change following the introduction of an accountability system based on proficiency counts controlling for achievement in the lower grade, and we are particularly interested in the possibility that the effects of accountability may differ among various levels of prior student achievement in the lower grade.
11 Wick (2003) provides a technical audit of the ISAT. 12 We use the last year a student was in third grade as their third grade year. We obtain similar results if we use test scores from the first year of third grade. Appendix A provides more details concerning the sample construction and the baseline characteristics of our treatment and control samples. 13 In an earlier version of this paper, we also presented comparisons between the 1999-2001 cohort and the 2001-2003 cohort. However, we subsequently learned that the interval between the 2001 third grade test and the 2003 fifth grade test was shorter than the intervals for the cohorts that we deal with here. While the patterns in these results are quite similar to those presented in Figures 2a-2b, we cannot rule out the possibility that the difference in time between assessments as well as other differences in test administration for the 2001-2003 samples affect those results.

14
For the purpose of describing our estimation procedure, we refer to the cohorts tested in both grades under low stakes as the pre-reform cohorts and the cohorts tested under high stakes in the higher grade as the post-reform cohorts. For each set of results presented below, we begin by using a pre-reform cohort to estimate the first principal component of math and reading scores in the baseline grade. We use this principal component as an index that allows us to order students in the pre-reform cohort on a one-dimensional scale of overall baseline achievement. We then use the coefficient estimates from this principal component analysis and the lower grade math and reading scores from the post-reform cohort to construct indices of baseline achievement for students in the post-reform cohort as well. These indices tell us where the post-reform students would be in the distribution of baseline achievement for the pre-reform cohort. Next, we divide the pre- and post-reform samples into ten cells. In both cohorts, the first cell contains students whose math and reading scores in the lower grade place them in the first decile of the pre-reform baseline achievement distribution in CPS. The second cell contains those who scores place them in the second decile, and we define the third through tenth cells analogously. Given these cells, we run twenty separate regressions. For each of our 10 samples of pre-reform students, we run two regressions of the form.
!
yigk = "1yi(g#2)math + "
2yi(g#2)read + "
3(yi(g#2)math * yi(g#2)read ) + uigk
where
!
yigk is the score of student i in grade g on the assessment in subject k. As an example, in our analyses of the ISBE implementation of NCLB, k is either math or reading, and g equals 5. Using the estimated coefficients from these regressions, we form predicted scores,
!
ˆ y igk , for each person in the post-reform cohort and then form the differences between these predicted values,
!
ˆ y igk , and the actual grade g scores in math and reading for the post-reform cohort. Finally, we calculate the average of these differences in math and reading for each of our ten samples of students in the post-reform cohort.14 NCLB Results
Figures 2a-2b present our estimates of the changes in fifth grade math and reading scores associated with the 2002 implementation of NCLB in Illinois. For students whose
14 The bands in the figures are 95 percent confidence intervals. We calculate these intervals accounting for the fact that we must estimate what the expected score for each student would have been in the absence of NCLB. We obtain the adjustments to the variances of our estimates of mean cell differences by taking the sample average of the elements of the matrix
!
(Z ˆ " Z ') where N is the number of fifth grade observations in 2002, Z is the 3xN matrix of third grade score variables used to produce predicted scores, and
!
ˆ " is the estimated variance covariance matrix from the regression of 2001 fifth grade math or reading scores on these third grade variables from 1999.

15
third grade scores place them in the bottom two deciles of the 1999 achievement distribution, there is no evidence that NLCB led to higher ISAT scores. Three of the four estimated treatment effects for these deciles are negative. The only statistically significant estimated effect implies that fifth graders in 2002, whose third grade scores placed them in the bottom decile of the 1999 third grade achievement distribution, scored just over one half point lower in math than expected given the observed relationship between third grade scores in 1999 and fifth grade scores in 2001. Because the ISAT scale is designed to generate a standard deviation of 15 for all scores, this estimated effect represents a decline of roughly 0.04 standard deviations. In contrast, deciles three through nine enjoy higher than expected ISAT scores in both math and reading. We observe the largest score gains in math and reading in the sixth decile where fifth graders in 2002 scored just under 0.1 standard deviations higher in reading and more than 0.13 standard deviations higher in math than comparable fifth graders scored in 2001. Figure 2c presents the expected proficiency rates in math and reading for each of the deciles included in Figures 2a and 2b.15 These are the rates expected given the third grade performance of students who were in fifth grade in 2002 and the relationship between third and fifth grade performance for the 2001 cohort of fifth graders. For example, the figure tells us that, in the absence of NCLB, the fifth graders in 2002 who fell in the fifth decile of our baseline achievement distribution would have faced just over a twenty percent chance of reaching the proficiency standard for math and just under a thirty-five percent chance of reaching the reading standard.
In light of Figure 2c, we are not surprised that we did not find that an increase in ISAT scores in 2002 among students in the bottom two deciles. The Illinois proficiency standards are lofty goals for these students, and they face less than a ten percent chance of reaching either standard. The fact the we do find significant positive effects for students in the third decile suggests that students may benefit from these types of reforms even if they have at best modest hopes of reaching the threshold for proficiency. This may reflect spillover effects that are not present in our model above, or these results may reflect differences in potential achievement growth among the students in each decile that are unmeasured yet still observed by teachers. In any event, Figures 2a-2c demonstrate that students with the lowest levels of prior achievement did not appear to achieve higher ISAT scores following NCLB, and among these students, the Illinois proficiency standards represented almost unattainable goals. Taken as a whole, these results support our contention that NCLB is not designed to leave no child behind. Interpretation and Robustness of the NCLB Results Several issues regarding the interpretation of our results deserve further attention. First, Figures 2a-2b present estimated changes in the scores on specific assessments. We have not and will not present evidence in this paper concerning whether or not measured
15 These expected proficiency rates are predicted values based on the estimated coefficients from a logit model of fifth grade proficiency in 2001 given third grade math and reading scores in 1999.

16
improvements on a specific assessment represent changes in subject mastery that generalize to other contemporaneous or future assessments. Our goal is to measure the effects of NCLB using the test scores that ISBE uses to measure performance. Nonetheless, we can state clearly that the ISBE implementation of NCLB worked better, in terms of raising ISAT scores, for some students than others and that it may have been counterproductive among the least able students in CPS. Further, this claim does not rest on a particular choice of scaling for the ISAT scores. We find no evidence of positive effects among students in the bottom two deciles but clear evidence of significant increases in ISAT scores among students in deciles three through nine. If all the estimated effects were the same sign, we might worry that any comparisons among cells concerning the magnitude of estimated effects could be sensitive to our choice of scale for reporting test scores, but our main emphasis here is a qualitative claim, not a quantitative claim. Scores are higher than expected for students who are in the middle of the baseline achievement distribution and scores are the same or lower than expected for those at the bottom of this distribution. Although NCLB raised average ISAT scores in Chicago, the implementation of NCLB in Chicago did not help and may have hurt the children who were likely the farthest behind when they began school. Our model above suggests that this outcome should not be a surprise, but it is also not consistent with the stated purpose of NCLB. We would like to conduct placebo experiments using ISAT data from the years before 2002 in order to rule out the possibility that we are simply picking up pre-existing differences among ability levels in the trends of third to fifth grade changes in test scores among CPS students. However, this is not possible because only three years of ISAT data exist prior to 2002, and we need four years of data to measure differences in third to fifth achievement trajectories between two cohorts of students. Nonetheless, we can construct comparisons in reading and math using two cohorts tested under the same policy regime. The 2005 and 2004 cohorts of fifth graders were tested in both fifth and third grade under NCLB. Thus, we construct figures describing changes in fifth grade scores between 2005 and 2004 in order to examine changes in scores between two cohorts tested under similar policy regimes. Figures 3a-3b do not offer even a hint of the clear pattern that is observed in Figures 2a-2b. We see sizeable losses in reading and some noteworthy gains in math among the top deciles, but there is no common pattern for math and reading results, and there is no evidence of important gains in the middle of the distribution relative to the lower deciles. We do not know why there are some statistically significant deviations from zero in these figures. In any pair of years, especially during the early years of a new policy regime, there may be differences in test administration or curricular priorities that create such differences. Our main point is that these figures describe differences between two cohorts that experienced broadly similar accountability environments, and these differences in no way fit the pattern observed in Figures 2a-2b. In contrast, the next section describes our estimates of the effects of the 1996 CPS reforms, and when we examine changes associated with the introduction of another accountability system built around cutoff scores, the pattern observed in Figures 2a-2b appears again.
17
There are over 400 elementary schools in Chicago and roughly 2000 fifth grade students per year in each of our baseline achievement deciles. We cannot simply add school fixed effects to our empirical model without losing a significant number of observations because many schools are represented in a given achievement cell in 2002 but not in 2001. Nonetheless, by estimating the relationship between fifth and third grade scores for the 2001-1999 cohort using decile groupings, we are able to estimate the effects of NCLB in Chicago using only within school variation in student outcomes. Given school fixed effects, we find results that are quite similar to those in Figures 2a-2b.16 We have also constructed similar graphs while restricting our samples to schools that are somewhat similar in terms of their expected proficiency rates prior to NCLB. Over a number of different types of schools, we find no evidence that students in the bottom deciles of the overall baseline achievement distribution benefit significantly from the introduction of NCLB. Nonetheless, we find noteworthy gains among students in the middle deciles of baseline achievement, and regardless of whether or not schools are under modest or great pressure from NCLB’s AYP rules, NCLB is always associated with noteworthy increases in overall average scores.17 Our results are not inconsistent with the large body of research that finds positive impacts of accountability systems on average test scores at the state, district, or school level. We are rather pointing out how the impacts of such systems differ among students with different levels of baseline achievement. Our results show that, even if such systems cause average test scores to increase in all schools, there may exist groups of students who are either harmed or receive no benefits.
Our results in Figures 2a-2b above are also robust to different methods of measuring the heterogeneous effects NCLB on test scores. Within each of the ten baseline achievement cells we construct, we treat the effect of NCLB as a constant, given controls for third grade reading and math scores, and we focus on differences among cells in the estimated effects of NCLB. However, we have also used local linear regression methods to estimate the plots in our figures as continuous functions.18 The patterns that emerge are quite similar, but as one would expect, the local linear regression methods yield smoother plots that more closely resemble a unimodal density function. We also examined numerous mean differences in pre- and post-reform test scores for samples of students grouped according to their third grade test scores. For example, we broke up the ISAT score scale into 5 regions and then placed each student into one of the 25 cells
16 We used four groups: deciles one and two, three through five, six through eight, and nine and ten. We employed a richer polynomial in third grade achievement scores to compensate for the use of four broader regression cells instead of ten. We still calculate average treatment effects for each decile to facilitate comparisons with our other results. These figures are available upon request. 17 We grouped schools according to what their 5th grade proficiency rates in math or reading would have been given their 2001 scores. Schools in our lowest achieving groups reported proficiency rates of less than 25 percent in either math or reading. 18 Further, we have conducted these analyses using 20 cells instead of ten. The results follow the same pattern observed in Figures 2a-2b, and the worst outcomes are always observed among students in the bottom 5% of the third grade achievement distribution.

18
defined by the intersection of these 5 levels of achievement for math and reading. Then, for each cell, we calculated the difference between pre-reform and post-reform scores in fifth grade. These differences are always negative for students who are at the lowest levels of reading and math in the third grade and always positive for many cells that involve the middle range of math and reading scores. Regardless of the methods we have used to define baseline ability cells or estimate treatment effects, we have found no evidence of gains in math or reading scores among students at the bottom of the third grade achievement distribution, and this is also true regarding our analyses of changes in fifth grade scores following the 1996 reforms with CPS.
Figures 2a-2c provide only indirect support for our model because we do not have direct measures of teacher effort, and other mechanisms could generate the patterns we observe in these figures. If schools, in response to NCLB, picked curricula that worked best for students near proficiency and less well for the most and least able students, a similar pattern might emerge. Nonetheless, any alternative explanation for our results must explain how NCLB leads to changes in educational practice that benefit many students but not students with the lowest levels of prior achievement.19
In our introduction, we note that ethnographic studies by Booher-Jennings (2005) and White and Rosenbaum (2007) provide clear and specific examples of ways that teachers in two schools in Texas and Chicago shifted their effort and attention toward students at the margin of proficiency in response to accountability systems built around threshold scores. Gilborn and Youdell (2000) provide similar evidence from case studies of English schools. However, the most striking description of the type of behavior our model predicts appears in a recent Washington Post article concerning the directions given by a middle school principal in Rockville, Maryland to her staff as she outlined a plan for achieving AYP. One staffer described the plan in the following terms: "We were told to cross off the kids who would never pass. We were told to cross off the kids who, if we handed them the test tomorrow, they would pass. And then the kids who were left over, those were the kids we were supposed to focus on."20
19 In our model, no student should ever be harmed directly by the introduction of an accountability system because we have made the strong assumption that districts perfectly monitor some baseline level of effort before and after the introduction of accountability, and we do not model group instruction or related choices concerning curricular selection or the pace of instruction. Nonetheless, if schools responded to NCLB by tailoring all group instruction to the needs of students near the proficiency standard, other students could be harmed directly. 20 See “Rockville School's Efforts Raise Questions of Test-Prep Ethics” by Daniel de Vise, March 4, 2007.

19
Effects of the 1996 CPS Reforms
Figures 4a-4b present estimates of the effects of the 1996 CPS reforms on reading and math scores in fifth grade. Here, we are comparing the performance of students tested in 1998 with the performance that we would have expected from similar students in 1996, the last year before the retention policy went into effect for fifth graders. The results for fifth grade reading in Figure 4a represent the effects of policy changes that most closely resemble NCLB. CPS put reading first in their reform effort and made school level probation decisions based primarily on proficiency counts in reading. Further, fifth graders did not face a threat of summer school if they did poorly on the ITBS, and thus the CPS efforts to end social promotion, which are not part of NCLB, should not have affected results for fifth graders to the same degree that they affected the performance of students in sixth or eighth grade. Fifth grade teachers and parents may well have responded to the promotion hurdles that awaited these students as sixth graders in 1999. However, we do not expect fifth grade students to make significant changes in their focus and effort based on the consequences attached to sixth grade exams because children discount the future heavily at this age. This creates an important difference between our fifth and sixth grade results.21 In a standard model of student effort, students will increase their effort in response to an immediate threat of summer school if the cost of such an increase is offset by a significant reduction in the likelihood of attending summer school, and we will see that our results for sixth graders are consistent with this hypothesis.
The pattern of results in Figure 4a is quite similar to the pattern observed in our analyses of NCLB. Here, the scale is in grade equivalents, and a 0.1 change represents roughly one month of additional achievement. The overall standard deviations of fifth grade scores in our 2002 samples are roughly 1.2 for math and 1.5 for reading. Thus, estimated achievement gains of .1 or slightly more for several cells in the middle of the ability distribution are noteworthy. Still, we find zero or negative estimated achievement effects among students in either tail. Further, Figure 4b shows a similar but slightly less dramatic pattern of changes in fifth grade math scores. The CPS proficiency standards were slightly more demanding than the ISAT proficiency standards used in 2002, and thus, it is noteworthy that fifth grade ITBS scores did increase among students in the third decile of the prior achievement distribution even though one would have expected less than 5 percent of these students to pass either the math or reading thresholds in the pre-reform period. Nonetheless, the teachers and parents of these students knew that they would face a promotion hurdle as sixth graders in 1999, and as we demonstrate below, the standards for promotion were within the reach of these students.
Figures 5a-5b present results for sixth graders. Here, we are clearly not
measuring just the effects of the school probation rules and the public reporting of proficiency counts in local newspapers. We anticipate that the rules governing summer
21 We do not analyze seventh grade scores in 1998 because the sixth grade promotion hurdle in 1997 is a source of endogenous composition changes in the 1998 seventh grade sample.

20
school attendance and retention decisions shaped not only the actions of teachers and parents, but also the effort of students during the school year. Students in sixth grade faced summer school if they performed below certain targets in reading or math, and these targets were much lower than the proficiency standards used to measure school performance. Taking all of these factors into account, we are not surprised that, while our results for sixth graders follow the same overall pattern observed among fifth graders, the estimated sixth grade gains associated the CPS reforms are larger at every decile in both math and reading, and there is some evidence of gains even in the lowest decile. Figure 5c is similar to Figure 2c except it plots, for each decile, the probabilities of exceeding the summer school cutoffs for sixth graders. The striking difference between Figures 2c and 5c may offer some insight concerning why estimated gains from accountability in Figures 5a and 5b are more apparent in the lower deciles of the achievement distribution. Even students in the lowest decile of fourth grade achievement had almost a twenty percent chance of reaching the individual math or reading cutoffs that determined summer school attendance. In contrast to the school level probation policies under NCLB or the CPS reforms, the CPS retention policies confronted many lower performing students with a challenging but attainable goal.22
Figures 5a-5b indicate that students in the third and fourth deciles of prior
achievement scores scored over 0.2 higher in math and reading than one would have expected prior to the 1996 reforms. These are large effects since 0.2 represents two full months of achievement on the ITBS grade-equivalent scale, and it is worth noting that Figure 5c implies that CPS set the summer school cutoff scores such that students in these deciles faced both a significant chance of avoiding summer school as well as a significant chance of attending summer school depending on how they progressed during the year.
We noted earlier that the 1996 eighth grade exams do not provide a completely
clean measure of pre-reform performance. Nonetheless, these students also faced a promotion hurdle in 1998, and we include Appendix Figures 1a and 1b, which describe changes in scores among eighth grade students. The overall pattern of results is similar to the pattern in Figures 5a and 5b. However, among eighth graders, there is less evidence of significant reading gains in the upper half of the prior achievement distribution.
22 However, it is not completely clear that the least able CPS students benefited from this program. In a previous version of the paper, we presented results for twenty prior achievement cells. The estimated sixth grade effects for those in the bottom 5% of the ability distribution were quite close to zero and not statistically significant. See Roderick and Engel (2001) for more work on the motivational responses of low-achieving children to the retention policy in CPS.

21
4.) Potential Reforms to Accountability Systems The central lesson of the model and empirical work presented here is that an accountability system built around threshold scores may not help students who are currently far above or far below these thresholds. The logic is similar to that in Becker and Rosen (1992). They focus on testing systems that are high stakes from the perspective of students and point out similar problems with competency testing among diverse students based on a single standard. They note that testing systems will not elicit effort from all students unless all “students compete in contests they have a chance to win.”23 NCLB is a system of common performance standards for sets of diverse schools educating populations of students who begin school with widely varying degrees of preparation at home. Thus, it is not possible to adopt a single proficiency standard that will elicit improved instruction for all students. A modest standard will minimize the likelihood that large numbers of disadvantaged children will be given little extra attention, but among the most advantaged students, modest standards offer few benefits and all the costs associated with testing. Challenging standards will shift attention toward more advantaged students but may harm the least advantaged students. If one is committed to keeping the basic structure of NCLB, what reforms could create an environment where all teachers believe each of their students has a significant chance of contributing positively to the schools overall performance rating, and they also believe that their performance as teachers will affect this outcome? Education policy makers are currently devoting significant attention to two alternatives schemes for measuring AYP at the school level. First, several states have adopted “indexing” systems based on multiple thresholds.24 In such a system, students who score above the highest threshold contribute, as in other states, one passing score toward the school’s proficiency count. However, students who fall short of this highest threshold but do manage to exceed lower thresholds count as varying fractions of a passing student depending on how many thresholds they meet. Other states have adopted value-added systems that measure how much scores have improved, on average, between two test dates.25 These approaches do not build in strong incentives to focus attention on a group of students near a single proficiency standard, and one can easily construct examples in which these systems will mitigate the number of students who receive no extra attention under NCLB. However, even if the re-authorized version of NCLB incorporated the most sophisticated variants of these systems imaginable, it is still possible that significant
23 Becker and Rosen (1992), p. 116. The logic here is closely related to the results in Lazear and Rosen (1982) who explain that tournaments designed to elicit effort should be handicapped in a way that makes the relationship between the probability of winning and the cost of effort identical for all contestants. 24 These include AL, FL, IA, LA, MA, MI, MN, MS, NH, NM, OK, PA, RI, SC, VT, WI, WY. NY also has a small indexing component in their system. 25 AR, DE, FL, NC, and TN are doing so now. AZ, CA, AK, HI, NV, OH, and UT have applied to do so but have not been approved.

22
groups of students would not benefit from NCLB. Further, these two alternatives have quite different implications concerning the labor market for teachers.
Using the notation from section 2 above, we will try to make these points within the context of our model of effort choice. Consider the following problems that could be faced by the teachers in a given school. Once again, we assume that there are many students in the school, and thus we treat the expected sum of test scores over all students as the actual total sum of scores in the school:
!
(2) ei
min "[ 1
Tu
E(ti)
i=1
N
# ] + cei
i=1
N
#
!
Tu is the maximum possible score on the high stakes assessment, and we normalize the
floor of the scale to 0. Here,
!
ti
=min[(Tu,max(0,t
i= ei
+"i
+ #i)]
Thus, all scores are constrained to be between the floor and ceiling of the scale used for assessment, i.e.
!
ti" [0,T
u] # i =1,2,...N . In a complete analysis of (2) and (3) below,
we would need to address the fact that the relationship between
!
ei and the expected value
of student i’s test score may be a function of both the floor and ceiling on the test scale. However, in our discussion, we will assume that the tests in question are designed to ensure that neither the floor nor ceiling on the scale is relevant for investment decisions regarding students, regardless of student ability.26 In the index system described by (2), proficiency for a given student is no longer zero or one but rather the student’s score expressed as a fraction of the maximum score. The penalty function I[.] describes how sanctions vary, for a school of size N, with the total proficiency count of the school. This indexing system resembles those used in some states, but it differs in two ways. First, the indexing is continuous so that all score increases count the same toward the school’s proficiency score regardless of a student’s initial ability,
!
"i. We do not think of ability as a fixed endowment but rather as the level
of competency at the beginning of a given school year, which should reflect investments
26 The existence of floors or ceilings implies that there may exist regions of ability types at the top and bottom of the ability distribution such that the return to investment in students is diminished because their observed scores are likely to remain at the ceiling or floor even if their latent scores improve. By ignoring these possibilities, we are implicitly assuming that the distribution of ability types and the distribution of measurement errors are bounded in a manner that makes the floor and ceiling scores unattainable given the optimal vector of effort choices.

23
made by both schools and parents in previous years. Second, because we have set the standard for proficiency at the maximum possible score and assumed this score is never reached, we have eliminated the existence of students for whom ei = 0 simply because they are already too accomplished relative to the proficiency standard. In sum, this is an indexing system designed to eliminate as much as possible any incentives schools may face to ignore students of a particular ability level. This characterization of an indexing system is also useful because we can easily transform it into the following value-added system:
!
(3) ei
min "[ (E(ti)
i=1
N
# $% )] + cei
i=1
N
#
Here,
!
" is the average performance in the school on a previous assessment. Because of the linearity in our model, equation (3) describes a value-added system in which schools of a given size are rewarded or sanctioned according to
!
"(.) based on their total net improvement in student achievement. With regard to the goal of leaving no child behind, both of these systems represent the best of all possible worlds in many respects. Because there is no single cutoff for proficiency, there is no incentive to concentrate effort on students around a cutoff point. Further, because we abstract from any effects caused by floors or ceilings on the test scale, the linearity assumptions in these models ensure that the marginal effort cost of increasing a student’s test score is the same regardless of the level of the student’s initial ability.
Nonetheless, even in this setting, it is easy to construct examples such that the optimal vector of effort allocations for both of the problems above includes ei = 0 for some set of students. In fact, there could be many such optimal vectors for a given school, and these models are silent concerning exactly which students might receive ei = 0.27 The key point is that, given a penalty function and the initial distribution of talent in a school of a given size, there will be a specific total sum of test scores or a total proficiency score such that the marginal cost of raising the total beyond this point is greater than the reduction in sanctions associated with such an increase, and there is nothing in the structure of this problem that guarantees ei > 0 for all i at this point. Without further assumptions about the technology of instruction, it is not possible to rule out the possibility that schools will target only a subset of students in their efforts to avoid sanctions.
Some may respond that the linear return to effort in our simple models drives this result. It is clear that if we alter (2) or (3) to include convex costs of improving the expected score of any individual student, there will exist penalty functions that guarantee a school with a given population of students will allocate extra effort to all of its students. The key is whether it costs more to raise one student’s score by two points than to raise
27 If ceiling and floor effects on the test scale are important, this is not the case. In this case, returns from investing in the most able and least able students are diminished.

24
two students’ scores by one point. If this is the case, one can construct examples such that either of the “best case scenario” systems described in (2) and (3) can be used to make sure that no children are left behind.28
Having said this, even ideal indexing systems, as in (2), may not work as well as
value added systems, like (3), when there are large between-school differences in the distributions of prior achievement. We noted in section one that the minimized value
!
"(e(
!
" )) is a function of the initial distribution of student ability and thus test based accountability systems of this type should make it more difficult to get teachers to work in disadvantaged schools. This same result holds for the continuous indexing system described in (2), and it may not be possible to solve the problem illustrated in Figures 2a and 2b above by simply having multiple thresholds for proficiency and severe sanctions for failure to meet AYP. As long as I[.] must be the same for all schools of the same size, it may be impossible to design a system that challenges the best schools without setting goals for disadvantaged schools that are not attainable given their resources. Policies that set unattainable goals may lack full credibility, but to the extent the threats implicit in such policies are credible, indexing systems will likely cause disadvantaged schools to lose the teachers they need most.
Things are different given the value-added system described in (3). Here, the total cost of achieving the optimal proficiency score is not affected by the distribution of initial ability.29 Thus, if one assumes convex costs of improving scores at the student level, it will be possible to use a value-added system to increase the quality of instruction for all students without distorting the supply of teachers among schools simply by increasing the sanctions inherent in
!
" (.).30 Putting these results together, value-added systems seem to be the more attractive
alternative to proficiency standard methods for measuring school performance under NCLB. Nonetheless, value-added methods are not a panacea because test scores are not inherently cardinal. The system described in (3) requires a team of incredibly skilled test developers. We are not only assuming that psychometricians can develop tests that allow us to abstract from the issue of floors and ceilings, but in addition, the scale specified in (2) and (3) above is such that the effort cost of increasing an individual’s score is the same for all students regardless of their initial achievement level. Because there is no natural cardinal metric for knowledge, it may be difficult to develop a test with this isocost property. Given any value-added system adopted in practice, differences in the
28 In such examples, within-school differences in prior achievement among students would be the primary source of student heterogeneity. In this setting, one can ignore the effects of the accountability system on the relative supply of teachers among different schools. 29 This can be shown easily by substituting the formula for ti into (3), if one assumes that the floor and ceiling on the test scale are never binding at the optimal effort vector. 30 Here, we are implicitly assuming that the increase in the effort cost of teaching will not generate a decline in teacher quality that offsets the increased effort given by remaining teachers.

25
costs of improving student scores by particular increments at different points on a given scale will influence the allocation of effort among students and will also mean that the effort cost of responding to the accountability system will differ among schools because it will be a function of the distribution of prior achievement at the school level. Some may respond that state education agencies can mitigate these concerns by requiring that schools meet different targets for total value-added within subgroups defined by prior achievement or aptitude if these agencies are willing to fine-tune these targets as they gain experience with their test. However, estimates of value-added are much less precise than estimates of current achievement levels,31 and precise estimates of value-added within student subgroups would not be easy to obtain. Thus, the process of calibrating these targets would not be easy, and it would be costly to require teachers and principals to work in environments where sanctions are handed out based on noisy performance measures.
In a recent paper, Reardon (2007) explores how the issue of scaling affects
conclusions researchers may draw in research on the evolution of the black-white test score gap. Reardon uses data from the Early Childhood Longitudinal Study – Kindergarten cohort (ECLS-K) to show that differences between the magnitude of the black-white test score gap in first grade and fifth grade among a single cohort of students can be quite sensitive to the specific scale used to report the scores, even if all scores from all candidate scales are standardized to have a mean of zero and a variance of one. The ECLS-K data do not permit researchers to make meaningful statements about how much bigger the black-white test score gap is among fifth graders than among first graders because there is no natural metric for knowledge that gives cardinal meaning to the distance between two scores. Value-added measures are measures of achievement growth for a population of students. A claim that value-added is greater in school A than school B is a claim that, on average, achievement growth was greater in school A than school B during the past year. Yet, if it is difficult to make robust judgments concerning whether or not achievement growth was greater among white students than black students in a nationally representative panel, it will also be difficult to make robust judgments concerning the relative magnitudes of average achievement growth in different schools. The topic of test score scales requires further study because robust information concerning relative growth rates among schools is an essential element of any effort to build a coherent accountability system based on value-added measures.
In the end, designers of accountability systems face an important tradeoff. Any
system built around cutoff scores will make it more costly to attract teachers to teach in disadvantaged schools as long as all schools are held to the same proficiency standards. On the other hand, systems built around value-added measures will provide incentives and hand out sanctions based on performance measures that may be noisy and linked to inherently arbitrary choices concerning scales. Nonetheless, both the indexing and value-added approaches do reward schools for improving the achievement of students who are not able to reach a high proficiency standard in the near term, and thus it may be possible
31 See Kane and Staiger (2002).

26
to use these methods to reduce the incentives some schools currently face to leave the least able behind. 5.) Conclusion Our results do not suggest that NCLB has failed to affect the performance of all disadvantaged students. Figures 2a and 2b show that 2002 ISAT test scores among fifth graders in Chicago were higher than one would have expected prior to NCLB over most of the prior achievement distribution, and it is important to note that even CPS students in the fourth decile of the third grade achievement distribution faced just over 20% and just under 15% chances of being proficient in reading and math respectively prior to NCLB. Thus, many low-achieving students in Chicago appear to have done better on ISAT under NCLB than they would have otherwise, and as we note above, this is true regardless of the average level of performance in a given school. However, for at least the bottom 20% of students, there is little evidence of significant gains and a possibility of lower than expected scores in math. If we assume that similar results hold for all elementary grades now tested under NCLB, we have reason to believe that at a given point in time there are more than 25,000 CPS students being left behind by NCLB. This large number is the result of several factors interacting together. First, as a state, Illinois has set standards that are challenging for disadvantaged students. According to a 2003 report by the Chicago Consortium on School Research, Easton et al. (2003), just over half of the nation’s fifth graders would be expected to achieve the ISAT proficiency standard in reading and just under half would be expected to achieve the ISAT standard in math. Second, students in Chicago are quite disadvantaged. More than 80 percent of CPS students receive free or reduced-price lunch benefits. Third, CPS is one of the largest districts in the country. We do not have data on individual test scores from other states, and we cannot assess the extent to which our results from Chicago reflect a pattern that is common among other school districts in other states. However, we have reasons to believe that while the pattern of NCLB effects we have identified may not be ubiquitous, it also not unique to Chicago. New York City, Los Angeles, Cleveland and many other cities educate large populations of disadvantaged students in states with accountability systems that are roughly comparable to the 2002 system implemented in Illinois.32 Based on our results, it is reasonable to conjecture that hundreds of thousands of academically disadvantaged students in large cities are currently being left behind because the use of proficiency counts in NCLB does not provide strong incentives for schools to direct more attention toward them. Further, NCLB may be generating this type of educational triage in non-urban districts as well. Any school that views AYP as a binding constraint and also
32 See NCES report 2007-482. On the other hand, Boston, Detroit, and Philadelphia are in states that use index systems to calculate AYP. Further, Houston, Dallas and other cities in Texas face a state accountability system built around proficiency standards that are not as demanding as the 2002 standards in Illinois and possibly more “in reach” for disadvantaged students.

27
educates a significant number of students who have little hope of reaching proficiency faces a strong incentive to shift attention away from their lowest achieving students and toward students near proficiency.33 A recent report, NCES (2007), presents evidence that the stringency of state proficiency standards varies greatly among states, and press reports make it clear that some view these differences as evidence that national proficiency standards are needed. National exams and national standards would likely provide more reliable information about the current relative performance of students in different school districts and different states, but statistics that are useful as relative performance measures are not always useful as building blocks for incentive systems. At its core, NCLB attempts to motivate schools by placing them in a contest where their AYP score determines whether they win or lose. In their early work on tournaments, Lazear and Rosen (1981) note that contests may provide efficient mechanisms for eliciting effort, but they warn that contests must be handicapped so that every contestant faces the same probability of winning given a particular choice of effort, and this insight holds whether agents are playing against each other or against a fixed performance standard. Without reliable methods for handicapping the scores of students with different levels of prior achievement and capacity for improvement, national standards will not help policy makers design an AYP system such that teachers in all schools, regardless of how disadvantaged their students may be, know that they do have an incentive to devote attention to all their students and that they have a realistic chance to make AYP if they do their jobs well. Finally, if AYP systems do not include some mechanism that adjusts measured school performance for variation in the skills and preparation of different cohorts of students entering different schools, the AYP system itself will not only increase the likelihood that some children are left behind but also generate differences in the relative willingness of teachers to teach in different schools and thus directly frustrate the stated NCLB goal of placing qualified teachers in every classroom. Clotfelter et al. (2004) examine changes in teacher retention rates in North Carolina following the introduction of a state-wide accountability system in 1996. The North Carolina system had both proficiency level and value added components but it clearly raised the relative cost of teaching in schools with large populations of disadvantaged students, and the authors document that this system was associated with significant declines in retention rates among schools with large populations of students with low achievement levels prior to the introduction of accountability. Clotfelter et al. (2004) find mixed evidence concerning the quality of teachers who left these schools following the introduction of accountability, but their results are difficult to square with the hypothesis that the additional departures from these schools were driven primarily by an increase in the departure of incompetent teachers. Accountability systems that make it relatively harder to work with disadvantaged youth will increase the number of teachers who leave the
33 Commercial software now exists that makes it easier for schools to monitor and improve their AYP status. See http://www.schoolnet.com for an example. Schools that wish to create lists of students who are most likely to become proficient given extra instruction can easily do so.

28
schools where they may be needed most. At the present time, NCLB is fostering these types of accountability systems in many states.

29
References Becker, William E. and Rosen, Sherwin. “The Learning Effect of Assessment Evaluation in High School,” Economics of Education Review, 1992, 11(2), pp. 107-118. Booher-Jennings, Jennifer. “Below the Bubble: ‘Educational Triage’ and the Texas Accountability System.” American Educational Research Journal, Summer 2005, 42(2), pp.231-268. Bryk, Anthony S. “No Child Left Behind, Chicago Style,” in No Child Left Behind? The Politics and Practice of School Accountability, eds. Paul E. Peterson and Martin R. West. Washington, D.C.: Brookings Institution Press, 2003. Burgess, Simon; Propper, Carol; Slater, Helen; and Wilson, Deborah. “Who wins and who loses from school accountability? The Distribution of educational gain in English Secondary Schools.” CMPO working paper, July, 2005. Carnoy, Martin and Loeb, Susanna. “Does External Accountability Affect Student Outcomes? A Cross-State Analysis,” Educational Evaluation and Policy Analysis, Winter 2002, 24(4), pp. 305-331. Clotfelter, Charles; Ladd, Helen; Vigdor, Jacob, and Diaz, Aliaga. “Do School Accountability Systems Make It More Difficult for Low Performing Schools to Attract and Retain High Quality Teachers.” Journal of Policy Analysis and Management, Spring 2004, 23(3), pp. 251 Cullen, Julie B. and Reback, Randall. “Tinkering Toward Accolades: School Gaming under a Performance Accountability System.” in Improving School Accountability: Check-Ups or Choice, Advances in Applied Microeconomics, T. Gronberg and D. Jansen, eds., 14 (Amsterdam: Elsevier Science). 2006. Easton, John Q. et al “How Do They Compare? ITBS and ISAT Reading and Mathematics in Chicago Public Schools, 1999 to 2002.” Research Data Brief, Consortium for Chicago School Research. February, 2003. Gillborn, David and Youdell, Deborah, Rationing Education. Open University Press, Philadelphia, 2000. Grissmer, David and Flanagan, Ann. Exploring Rapid Achievement Gains in North Carolina and Texas. National Education Goals Panel, November 1998. Hanushek, Eric A. and Raymond, Margaret E. “Does School Accountability Lead to Improved Student Performance?” NBER Working Paper No. 10591, June 2004.

30
Jacob, Brian A. “A Closer Look at Achievement Gains under High-Stakes Testing in Chicago,” in No Child Left Behind? The Politics and Practice of School Accountability, eds. Paul E. Peterson and Martin R. West. Washington, D.C.: Brookings Institution Press, 2003. Jacob, Brian A. “Accountability, incentives and behavior: the impact of high-stakes testing in the Chicago Public Schools,” Journal of Public Economics, 2005, 89, pp. 761 – 796 . Kane, Thomas J. and Staiger, Douglas O. “Volatility in School Test Scores: Implications for Test-Based Accountability Systems,” Brookings Papers on Education Policy, 2002, pp. 235-283. Koretz, Daniel M. “Limitations in the Use of Achievement Tests as Measures of Educators' Productivity,” The Journal of Human Resources, Autumn 2002, 37(4), pp. 752-777. Lazear, Edward P. “Speeding, Terrorism, and Teaching to the Test,” Quarterly Journal of Economics, August 2006, 121(3), pp. 1029-1061. Lazear, Edward P. and Rosen, Sherwin. “Rank-Order Tournaments as Optimum Labor Contracts,” Journal of Political Economy 89(5): 841-64. October 1981. Reardon, Sean. “Thirteen Ways of Looking at the Black-White Test Score Gap,” Mimeo, Stanford University, March 2007. Reback, Randall. “Teaching to the Rating: School Accountability and the Distribution of Student Achievement,” mimeo, Barnard College, Columbia University, May, 2006. Roderick, Melissa and Engel, Mimi. “The Grasshopper and the Ant: Motivational Responses of Low-Achieving Students to High-Stakes Testing,” Educational Evaluation and Policy Analysis, Autumn 2001, 23(3), pp. 197-227. Wick, John W. “Independent Assessment of the Technical Characteristics of the Illinois Standards Achievement Test (ISAT),” Commissioned by Illinois State Board of Education, (2003). White, Katie Weits and Rosenbaum, James E. “Inside the Blackbox of Accountabilty: How High-Stakes Accountability Alters School Culture and the Classification and Treatment of Students and Teachers.” forthcoming in No Child Left Behind and the Reduction of the Achievement Gap: Sociological Perspectives on Federal Education Policy. Eds. A. Sadvonik, J. O’Day, G. Bohrnstedt, and K. Borman. Routledge.

29
Figure 1: Optimal Effort Among Types
e(α)
αlow αhigh

32
Figure 2a: Change in 5th Grade Reading Scores, 2002 vs. 2001
-1.5
-1.0
-0.5
0.0
0.5
1.0
1.5
2.0
2.5
3.0
0.1 0.2 0.3 0.4 0.5 0.6 0.7 0.8 0.9 1.0
Percentile in 1999 distribution of 3rd grade achievement
Ch
an
ge
in
IS
AT
sc
ale
sc
ore
Figure 2b: Change in 5th Grade Math Scores, 2002 vs. 2001
-1.5
-1.0
-0.5
0.0
0.5
1.0
1.5
2.0
2.5
3.0
0.1 0.2 0.3 0.4 0.5 0.6 0.7 0.8 0.9 1.0
Percentile in 1999 distribution of 3rd grade achievement
Ch
an
ge
in
IS
AT
sc
ale
sc
ore
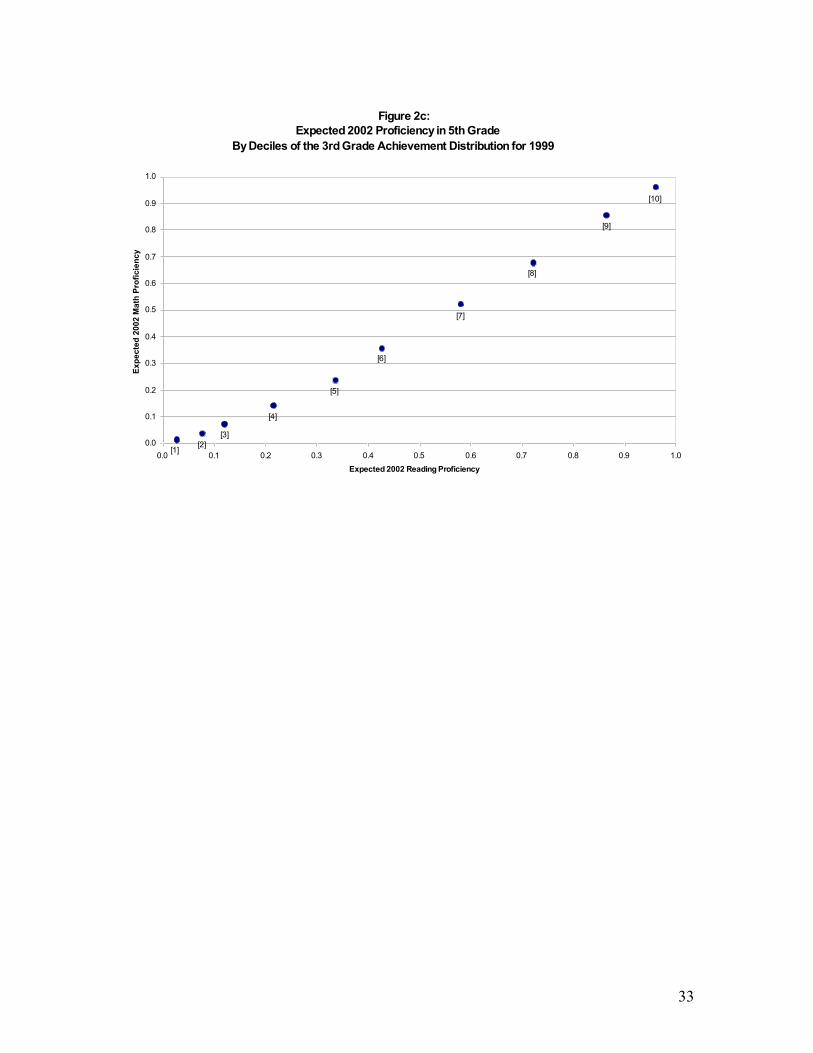
33
Figure 2c:
Expected 2002 Proficiency in 5th Grade
By Deciles of the 3rd Grade Achievement Distribution for 1999
[10]
[9]
[8]
[7]
[6]
[5]
[4]
[3]
[2][1]
0.0
0.1
0.2
0.3
0.4
0.5
0.6
0.7
0.8
0.9
1.0
0.0 0.1 0.2 0.3 0.4 0.5 0.6 0.7 0.8 0.9 1.0
Expected 2002 Reading Proficiency
Ex
pe
cte
d 2
00
2 M
ath
Pro
fic
ien
cy

34
Figure 3a: Placebo Test:
Change in 5th Grade Reading Scores, 2005 vs. 2004
-3.0
-2.5
-2.0
-1.5
-1.0
-0.5
0.0
0.5
1.0
1.5
2.0
0.1 0.2 0.3 0.4 0.5 0.6 0.7 0.8 0.9 1.0
Percentile in 2002 distribution of 3rd grade achievement
Ch
an
ge
in
IS
AT
sc
ale
sc
ore
Figure 3b: Placebo Test:
Change in 5th Grade Math Scores, 2005 vs. 2004
-3.0
-2.5
-2.0
-1.5
-1.0
-0.5
0.0
0.5
1.0
1.5
2.0
0.1 0.2 0.3 0.4 0.5 0.6 0.7 0.8 0.9 1.0
Percentile in 2002 distribution of 3rd grade achievement
Ch
an
ge
in
IS
AT
sc
ale
sc
ore

35
Figure 4a: Change in 5th Grade Reading Scores, 1998 vs. 1996
-0.20
-0.15
-0.10
-0.05
0.00
0.05
0.10
0.15
0.20
0.1 0.2 0.3 0.4 0.5 0.6 0.7 0.8 0.9 1.0
Percentile in 1994 distribution of 3rd grade achievement
Ch
an
ge in
IT
BS
gra
de e
qu
ivale
nt
Figure 4b: Change in 5th Grade Math Scores, 1998 vs. 1996
-0.20
-0.15
-0.10
-0.05
0.00
0.05
0.10
0.15
0.20
0.1 0.2 0.3 0.4 0.5 0.6 0.7 0.8 0.9 1.0
Percentile in 1994 distribution of 3rd grade achievement
Ch
an
ge in
IT
BS
gra
de e
qu
ivale
nt

36
Figure 5a: Change in 6th Grade Reading Scores, 1998 vs. 1996
-0.05
0.00
0.05
0.10
0.15
0.20
0.25
0.30
0.35
0.1 0.2 0.3 0.4 0.5 0.6 0.7 0.8 0.9 1.0
Percentile in 1994 distribution of 4th grade achievement
Ch
an
ge in
IT
BS
gra
de e
qu
ivale
nt
Figure 5b: Change in 6th Grade Math Scores, 1998 vs. 1996
-0.05
0.00
0.05
0.10
0.15
0.20
0.25
0.30
0.35
0.1 0.2 0.3 0.4 0.5 0.6 0.7 0.8 0.9 1.0
Percentile in 1994 distribution of 4th grade achievement
Ch
an
ge in
IT
BS
gra
de e
qu
ivale
nt

37
Figure 5c:
Expected 1998 Pass Rates in 6th Grade - Summer School Cutoffs
By Deciles of the 4th Grade Achievement Distribution for 1994
[1]
[2]
[3]
[4]
[5]
[6]
[7][8]
[9][10]
0.0
0.1
0.2
0.3
0.4
0.5
0.6
0.7
0.8
0.9
1.0
0.0 0.1 0.2 0.3 0.4 0.5 0.6 0.7 0.8 0.9 1.0
Expected 1998 Reading Pass Rate
Exp
ecte
d 1
998 M
ath
Pass R
ate

38
Appendix Figure 1a: Change in 8th Grade Reading Scores, 1998 vs. 1996
-0.10
-0.05
0.00
0.05
0.10
0.15
0.20
0.25
0.30
0.35
0.1 0.2 0.3 0.4 0.5 0.6 0.7 0.8 0.9 1.0
Percentile in 1994 distribution of 6th grade achievement
Ch
an
ge in
IT
BS
gra
de e
qu
ivale
nt
Appendix Figure 1b: Change in 8th Grade Math Scores, 1998 vs. 1996
-0.10
-0.05
0.00
0.05
0.10
0.15
0.20
0.25
0.30
0.35
0.1 0.2 0.3 0.4 0.5 0.6 0.7 0.8 0.9 1.0
Percentile in 1994 distribution of 6th grade achievement
Ch
an
ge in
IT
BS
gra
de e
qu
ivale
nt

39
Appendix A: Data Construction In our analyses of the effects of NCLB, we restrict our samples to students who were tested in fifth grade in 2002, the first year of NCLB, and 2001. We further restrict the sample to students who were last tested in third grade exactly two years prior. Here, we discuss two alternative procedures. First, we could have simply selected the first or last third grade test available for each fifth grade student in our 2001 and 2002 samples without restricting the sample interval between scores. We chose not to pursue this strategy because the ISAT test was not given until 1999. Students tested in fifth grade in 2001 who entered third grade in 1998 and then either repeated part or all of third grade or fourth grade do not have an ISAT score for their initial third grade year, and depending on the details of their grade progression, may not have a third grade ISAT score at all. This is not true among similar students who entered third grade in 1999 and were tested as fifth graders in 2002. Thus, the sample of fifth graders tested in 2001 with valid third grade scores contains fewer students who experienced retention problems in third or fourth grade than the comparable sample of fifth graders tested in 2002. By restricting the samples to students who last tested in third grade exactly two years prior, we are holding the progression patterns in the treatment and control samples constant. A second alternative procedure involves conditioning on a different progression pattern by restricting the samples to students tested two years prior during their first year in third grade. These samples would only include students with “normal” grade progression. We conducted analyses on these samples and found results that are quite similar to those in Figures 2a and 2b. These samples are somewhat smaller, and it is important to note that they do not include as many low achieving students because they exclude students who repeated third grade. 27,205 students with valid third grade scores took the ISAT in third grade for the final time in 1999. Among these students, the average reading and math scores were 152.2 and 152.3 respectively. The comparable sample for 2000 contains 27,851 students. The average reading and math scores among these students were slightly lower at 151.9 and 151.2 respectively. 20,060 of these 1999 third graders and 21,199 of these 2000 third graders appear in the ISAT fifth grade test files for 2001 and 2002 respectively. Thus, the sample retention rate is slightly higher in the 2000-2002 sample (73.7 percent vs. 76.1 percent). The main source of this difference in retention rates is that there are fewer student id number matches looking forward from the 1999 sample. This primarily reflects fewer exits from CPS for the 2000 sample as well as fewer student id numbers that were not coded correctly. In the end, our analyses include 18,305 and 19,651 students from the 2001 and 2002 samples respectively who have valid scores on both exams and were tested without accommodations.

40
Table A1 gives the mean math and reading scores in third grade for the samples used in the construction of Figures 2a and 2b. Even though the overall average third grade scores are lower for the 2002 sample than the 2001 sample, the means within cells are quite close to each other. Further, even though larger fractions of the 2002 sample are in the two lowest ability cells, the average scores within these cells are quite comparable to the cell averages in the 2001 sample. Table A1: Mean Math and Reading Scores in 3rd Grade
Decile N
Math
(mean)
Math
(st. dev.)
Read
(mean)
Read
(st. dev.)
1 1,833 140.8 1.77 139.6 1.93
2 1,845 144.7 0.93 144.0 2.17
3 1,825 147.0 1.20 146.4 2.10
4 1,825 149.7 1.78 149.1 2.54
5 1,826 152.6 1.54 151.6 2.50
6 1,828 154.9 1.75 154.0 2.76
7 1,838 158.6 2.41 157.1 2.69
8 1,825 162.3 2.51 160.6 2.91
9 1,840 168.0 2.89 165.3 2.56
10 1,820 178.7 5.96 174.2 5.01
Overall 18,305 155.7 11.25 154.2 10.29
Decile N
Math
(mean)
Math
(st. dev.)
Read
(mean)
Read
(st. dev.)
1 2,447 140.8 1.62 139.9 1.71
2 2,540 144.6 0.81 144.0 1.92
3 2,287 146.9 1.12 146.5 1.84
4 1,783 149.5 1.57 149.2 2.36
5 1,745 152.5 1.39 151.8 2.72
6 1,691 154.8 1.77 154.1 2.71
7 1,718 158.5 2.43 157.4 2.71
8 1,736 162.0 2.53 161.0 2.86
9 1,810 167.7 2.91 165.5 2.67
10 1,894 178.7 5.82 174.4 4.74
Overall 19,651 154.6 11.42 153.4 10.55
Third Grade in 1999, Tested in Fifth Grade in 2001
Third Grade in 2000, Tested in Fifth Grade in 2002

41
Appendix B: Proof Recall the notation from pages 6 and 7 in the text. The school’s problem is described in equation (1):
1 1
min [ ( )]i
N N
i i ie
i i
F t e ce!= =
" # # +$ $
!
s.t. ei" 0 #i =1,2..N
Define e* as the vector of effort allocations that solves (1) and consider any three elements of this vector
!
(elow* ,emed
* ,ehigh* )
that are the optimal allocation for students with abilities, " low <"med <"high .
Proposition: The following three conditions cannot hold at once e*
low > 0 e*
med = 0 e*
high > 0 Proof: By contradiction. Define
!
k*
= t " elow
*" alow = t " ehigh
*" ahigh
Form a vector of effort allocations
!
ˆ e such that ˆ e i= e
i
* "i # low,med .
Define
!
ˆ e low
="med
#"low
. Define
!
ˆ e med
= t "#med
" k* .
Define M(e) as the school’s total sum of penalties and effort costs given a vector of effort choices e. It is straightforward to show that
!
M( ˆ e ) = M(e*).
However, if
!
ˆ e is also a solution to the school’s minimization problem, the first and second order conditions require that
!
f (t " ˆ e low "# low ) = f (t "#med ) = f (t " ˆ e high "#high ) > 0
!
f '(t "#med ) > 0 , f '(t " ˆ e "#high ) > 0 However, since
!
"high >"med and
!
f (") is unimodal, both conditions cannot hold. This implies that
!
ˆ e is not a solution. Thus, e* is not a solution. Q.E.D.