Leeds City Region Housing Market Areas
89
Leeds City Region Housing Market Areas Prepared for: West Yorkshire Combined Authority October 2016 Mike Coombes, David Bradley and Colin Wymer (together with Nathaniel Lichfield & Partners, who undertook the consultations) Angel a Abbott, Liz Corry, Wendy Holland, W RR2016/11
Transcript of Leeds City Region Housing Market Areas

Leeds City Region Housing Market Areas
Prepared for: West Yorkshire Combined Authority
October 2016
Mike Coombes, David Bradley and Colin Wymer (together with Nathaniel Lichfield & Partners, who undertook the consultations)Angel a Abbott, Liz Corry, Wendy Holland, W RR2016/11
CURDS (Centre for Urban & Regional Development Studies)
www.ncl.ac.uk/curds.
Leeds City Region Housing Market Areas
Final Report July 2016
Contents
Executive Summary 2
1 Overview 5
2 Methods 6
3 Data 8
4 Visualisation 9
5 NHPAU 14
6 Results 19
7 Synthesis 32
8 Consultation 35
9 Conclusions 40
Annex 1 Consultation with Local Planning Authorities 43
Annex 2 Consultation with Registered Providers 52
Annex 3 Consultation with Developers & Agents 60
Annex 4 Key to place name abbreviations used on the conventional maps 86
Annex 5 Glossary and acknowledgements, plus end notes 87

2
Executive Summary
ES1 This is the draft Final Report from a research study commissioned by the Leeds City Region Enterprise Partnership and the West Yorkshire
Combined Authority. The study has been undertaken by the Centre for Urban and Regional Development Studies (CURDS), in conjunction with
Nathaniel Litchfield & Partners. The core task for the study was to undertake new analyses defining Housing Market Areas (HMAs) with data from the
2011 Census, updating the National Housing & Planning Advisory Unit (NHPAU) HMA definitions produced by CURDS using the 2001 Census.
ES2 National planning guidance requires local planning authorities to understand the geography of the housing market, and imposes a Duty to Co-operate
where the HMAs span several Plan boundaries and so raise strategic issues. Additional momentum has been given to the study by the March 2016
report of the Local Plan Expert Group which recommended that the NHPAU HMAs should be updated with data from the 2011 Census.
ES3 CURDS methods which defined NHPAU HMAs gained broad ‘buy-in’ at a workshop with stakeholders. After the analyses were completed the results
were summarised in a briefing document which provided the basis for a comprehensive consultation stage of the study. Annexes to this report show
the coverage of the consultation, from three different interest groups as well as all the local planning authorities, and also summarise the responses.
ES4 The results of updating the ‘best practice’ NHPAU HMA definitions indicate a reassuringly gradual evolution of the boundaries produced for NHPAU,
rather than a radical change which would not only be implausible but also unhelpful, given the use of NHPAU HMAs in the current planning evidence
bases of local authorities (LAs). It is equally important that a clear majority of the varied respondents within the study consultation process boundaries
saw the new 2011-based HMA boundaries as a recognisable depiction of housing market realities.
ES5 The following points cover the key implications of the findings from the study in terms of the housing market geography of the Leeds City Region
(LCR), and in particular the major agreements or differences between the new results and the NHPAU HMAs.
2 Strategic HMAs cover the whole of W.Yorkshire as before, but the Leeds HMA ‘gains’ some areas from the one including Bradford
Leeds ‘loses’ the bulk of the Barnsley LA which had been in its NHPAU Strategic HMA, but it has ‘gained’ the northern part of Harrogate LA
York’s 2011-based Strategic HMA is larger than its NHPAU equivalent because it extends into Ryedale LA
Calderdale is a single Local HMA (it was split by NHPAU’s Strategic HMAs and therefore also by the Local HMAs which fit within them)
Bradford LA is always split into 3 Local HMAs, though with some variation in boundaries either side of Keighley
N.Kirklees is separate from Huddersfield in all the results except for the Strategic HMA; within this area, Local HMAs are very variable
Wakefield LA in all results except for the Strategic HMA is split into 4 Local HMAs
NHPAU’s Leeds Local HMAs north-south split is not replicated with the 2011 data analysis
ES6 The analyses included several variations on the method used to update the NHPAU HMAs, thereby providing a ‘sensitivity test’ of the main results.
More importantly still, synthesising the evidence in these different sets of results to reveal which boundaries are persistent has also identified which
LAs in the LCR tend to be in the same HMA: these are the LAs between which there is the most pressing need to deliver the Duty to Co-operate

3
Map showing the synthesis of the main sets of 2011-based HMAs, indicating the strength of their evidence that pairs of adjacent areas are in different HMAs
NB: On this map, where the analysis found strong housing market links between two areas there is no boundary shown. Areas with some links are shown with a pecked
or broken line to show a ‘permeable’ housing market boundary. Where clear housing market separation was evidenced by few housing market links between areas, a solid line is shown.

4
ES7 Where there is a more robust boundary between two areas, there is less urgency in the Duty to Co-operate. The following points summarise what this
synthesis suggests about the strength of the links across – or by contrast the impermeability of – the boundaries of LCR local planning authorities.
Most of the Pennines form an impermeable boundary (apart from areas in west Craven linking to the northern part of Lancashire)
York has stronger links to the more northerly N.Yorkshire LAs than does Harrogate; Craven has no strong links to these areas
Selby LA has no robust boundaries splitting it from HMAs centred on York and on Leeds (or to eastern Wakefield LA, when this is a separate HMA)
W.Yorkshire’s boundary with S.Yorkshire is almost impermeable (suggesting that the 2001 links with Barnsley had moderated by 2011)
Bradford has strong HMA links with Craven
Leeds’ northern boundary with Harrogate LA is less permeable; Wetherby’s allocation is volatile
Leeds:Bradford is a mostly impermeable boundary, but the links to Leeds have strengthened since 2001for the Wharfedale part of Bradford LA
Bradford:Calderdale is a more impermeable boundary than it was in 2001
Kirklees:Calderdale is a largely impermeable boundary
Kirklees:Bradford is a highly permeable boundary, especially in the area round Cleckheaton
Kirklees:Leeds is a permeable boundary, especially in the area round Batley
Kirklees:Wakefield is a mostly impermeable boundary, except in their similar involvement in the wider Strategic reach of Leeds
Leeds:Wakefield is a mostly impermeable boundary, except in relation to the wider Strategic reach of Leeds
ES8 The findings of the study will be a key component of the work being undertaken by LCR and will help guide future plan making and planning for
housing at a city region level. The study provides the most up-to-date possible evidence on the HMAs across and within LCR, and highlights the
spatial relationships where there are wider implications of future planning decisions. The study results should not change the current plan-making
process in LCR, but they provide contextual evidence of relevance for the updating of Local Plans.
5
1 Overview
1.1 This is the draft Final Report from a research study commissioned by the Leeds City Region Enterprise Partnership and the West Yorkshire
Combined Authority. The study has been undertaken by the Centre for Urban and Regional Development Studies (CURDS), in conjunction with
Nathaniel Litchfield & Partners.
1.2 The background to the study is the requirement in national planning policy for Development Plans to include evidence of an understanding of the
geography of the housing market in the Plan area plus the Plan areas which are adjacent. This requirement is reinforced by the Duty to Co-operate
where housing market areas (HMAs) cross Plan boundaries and so raise strategic issues. Additional momentum was given to the study by the
March 2016 report of the Local Plan Expert Group (LPEG)i which has recommended the updating of the national study of housing market geography
for the National Housing & Planning Advisory Unit (NHPAU): this study had in 2010 published HMAs defined with 2001 Census data by CURDS.
The definition methods devised by CURDS sought to comprehensively implement the guidanceii from the Government on the definition of HMAs,
which cites the relevance of both commuting and migration data, and also the ‘model’ provided by the definition of Travel-to-Work Areas (TTWAs).
1.3 The study was commissioned in autumn 2015 following the release of the relevant data from the 2011 Census. It has taken the form of a detailed
quantitative analysis, followed by testing of the results through inputs from the city region and neighbouring local authorities (LAs), plus consultation
with a wider stakeholder group. The resulting output can sit alongside the local evidence which individual authorities hold, and will inform future plan
making in the city region. Outputs from the study will also inform emerging city region wide strategies and policy frameworks.
1.4 Leeds City Region (LCR) encompasses all the West Yorkshire LAs, plus the 3 adjacent North Yorkshire LAs, as well as Barnsley Metropolitan LA
and also York Unitary LA. The analyses use 2011 Census data to update the sets of HMA CURDS defined for NHPAU with data from the 2001 Census.
It also synthesizes results from a range of analyses to identify where HMAs persistently span across LA boundaries due to substantial ‘cross-border’
commuting and migration flows. It is these situations within the region where housing pressure is most likely to ‘leak’ across the boundaries of LAs,
and so the Duty to Co-operate is most relevant.

6
2 Methods
2.1 The methods of analysis here use the innovative CURDS software which had defined the HMAs in the research for the now-defunct NHPAUiii
.
Adoption of the CURDS approach to defining HMAs in this study is based on the fact that the NHPAU HMAs are widely seen as the ‘state-of-the-art’
HMA definitions in the UK. This approach to defining HMAs has been endorsed by the LPEG recommendations to Government which identifies the
need to update the NHPAU analysis to identify a consistent set of HMAs across all of England, thereby providing the spatial framework within which
LAs would be required to work in undertaking the objective assessment of housing need. LPEG’s recommendations also assert that where HMAs
span across LA boundaries there should be Duty-to-Co-operate discussions on how and where housing needs will be met within that wider HMA.
2.2 The basic form of analysis used here was developed by CURDS in defining TTWAs, which are the official British definition of local labour market areas
(nb. the method is currently being promoted by Eurostat as the labour market area definition method for the whole of Europe). Some further method
developments in the NHPAU study made possible the first nationally consistent analyses of both commuting and migration flows at a small area scale
(which in this case means using LA wards as ‘building block areas’). The procedure involves a huge number of small area groupings, building up a final
map that is close to being optimal in maximising the number of areas which meet the set criteria.
2.3 The criteria for the analyses require the defined HMAs to meet set levels of population size and the self-containment of flows (whether these flows are
of commuting or migration). There is also a limited trade-off between the two key requirements, so that large areas can be slightly less self-contained.
It is important to note that the size and self-containment levels set for the analyses are not ‘given’ but have to be chosen, with the choice being made
to ensure that the results meet the needs of that analysis. The choice made here was to replicate the criteria used in the analyses for NHPAU, so that
the basic results represent an updating of those results to reflect the new data from the 2011 Census. Some additional analyses were also carried out,
so that a synthesis of the different results can indicate which HMA boundaries are ‘sensitive’ to one particular set of criteria, and which are a recurring
feature across many sets of results. If two adjacent Local Planning Authorities (LPAs) are found by numerous different analyses to be within the same HMA
then there will be a strong case for them to work together under the rubric of the Duty to Co-operate. This analysis strategy was presented to stake-holders
at an early stage of the study and agreed to be the appropriate approach here.
2.4 The study applied three alternative versions of the CURDS method of analysis which utilises evidence from both commuting and migration datasets.
The underlying strategy here is to repeat the analyses carried out for NHPAU, but using recently released Census 2011 flow data (nb. the next section
of this Report outlines the limitations to this ‘replication’ due to data availability). The three alternative analysis are listed below and then shown in the
same sequence (left-to-right) in the flow chart which follows (Figure 1).
> Strategic HMAs are defined based on commuting flows, and then within these a set of Local HMAs is identified using migration flows if
sufficiently localised (ie. self-contained) migration patterns exist within a Strategic HMAs
> Single-tier HMAs are defined by first analysing commuting flows; these local labour market areas are the starting point in analysing migration
flows and if they are not sufficiently self-contained they are split up and their constituent wards re-allocated to create the Single-tier HMAs.
> An alternative way to create Single-tier HMAs substitutes TTWAs for the analysis of commuting flows (because they are based on the analysis
of commuting flows) and then groups these – without any dismembering – if they are not sufficiently in terms of self-contained migration flows.

7
2.5 The first two approaches are those reported at the site www.ncl.ac.uk/curds/research/defining/NHPAU.htm, the third approach was an option reviewed
in the research for NHPAU but not used in its published results (it is used here to provide further sensitivity testing of the results of the main methods).
It should be noted that in the NHPAU research there was a subsequent step which involved a ‘best-fit’ to whole LAs of some of the results; that step
has not been replicated here, and so the new results are compared to the NHPAU boundaries prior to any best-fit (ie. the ones still at the ward scale).
The research for NHPAU also experimented with including house price analyses in the definition of HMAs, but this extra step only had an effect on the
results in a few remote rural areas such as north Devon and so was not considered to be relevant to general purpose definitions.
Figure 1: Flow chart of the three methods used to define alternative sets of HMAs
2-tier HMAs
Single-tier HMAs
↓
↓
↓ analyse commuting with 77.5%
MINs-c:
Upper tier HMAs
analyse commuting with 72.5%
MINs-c: step 1
best-fit 2011 wards into
2011TTWAs, creating
‘2011TTWA’s
↓
↓
↓ 50% migration MINs-c areas
within upper tier areas:
Lower tier HMAs
55% migration MINs-c areas
starting with step 1 areas:
Single-tier HMAs
55% migration MINs-c
areas between
'2011TTWA's:
Alternative Single-tier HMAs
within here means each upper
tier is treated as a separate
analysis: one consequence can
be that the whole upper tier area
fails the migration % MINs-c, so
it is necessary to set a lower %
starting with here means the
step 1 areas are input as whole
proto HMAs: they can be
disaggregated and their zones
re- allocated if they fail the
migration % MINs-c
between here means the
'2001TTWAs' are input as if they
were zones: they cannot be
disaggregated so if any fail the
migration % MINs-c they have to
be grouped whole
[nb. the references to “% MIN s-c” simplify the process because there are in fact four criteria in the algorithm, however the minimum self-containment level
tends to be the most important in determining the results]
8
3 Data
3.1 The implementation of these analyses of 2001 data depended on algorithms CURDS had developed, so the software was available for this research
usind data from the Census 2011. However the relevant datasets for 2011 are not identical to those from 2001. It is not knowable whether these data
differences alone materially alter the results; what has been done here is to get a ‘feel’ of this sensitivity is to see what how far the results from each
type of analysis change depending on the decision over the age of migrants in the analyses. The following is a list of the identified changes between
the migration and commuting flow ward-level datasets from the two Censuses.
> There have been changes to ward boundaries in some areas.
> The commuting dataset for 2011 is limited to England & Wales whereas the analyses for NHPAU covered the whole of Britain (but any effects
of this limitation will be localised to areas near Scotland, and so are very unlikely to have a significant impact on the results reported here).
> The commuting dataset for 2011 excludes those working at home and also those who use their home as their base to work from.
> Migration datasets for 2011 are person counts (cf. 2001’s dataset on Household Reference Persons which was used in the study for NHPAU).
> The analyses for NHPAU included some on specific tenure groups, but migration data for such analyses is unavailable from the 2011 Census.
> The migration analyses for NHPAU excluded people aged under 25: here the basic analyses are of all persons, with analyses excluding the
under 25s provided as a sensitivity test on those results.
3.2 It should be recognised that that the 2011 data will reflect substantive changes to housing markets over the period since 200.In particular there has
been strong growth in private renting, which is associated with longer distance migration, but any effect of this change on HMA boundaries may have
been countered by the 2011 Census being taken in a recession, because that would have tended to reduce longer distance moves.
3.3 Where the new analyses produce a different HMA boundary to that which was part of the results produced from analysing 2001 data for the NHPAU,
it is not possible to identify how far this is due to changes in data definitions and how far to changes to the strengths of commuting and migration
flows in each direction between the areas concerned.

9
4 Visualisation
4.1 Numerous sets of HMA boundaries are presented here, because it is by collating different sets of boundaries that it is possible to identify which persist
and which are specific to very few analysis. Adjacent areas whose level of interaction is low will tend to have a boundary between them in most maps.
Minor differences of alignment are not important here: the aim is to identify which LAs are persistently linked by the HMA boundaries because this
will be a reflection of strong commuting and/or migration flow patterns which will need to be considered through the Duty to Co-operate. It is to help
identify such pairs of LAs that two types of map are presented below.
> There are conventional maps showing the HMAs as the top ‘layer’ in the familiar boundary form (nb.the boundaries are ‘pecked’ if they are
Local HMAs set within the upper-tier of Strategic HMAs); LAs provide the background, and the four-colour system demarcates them.
> There are also schematic ‘maps’ that generalise into rectangular ‘tiles’ localities either in, or adjacent to, the city region; here again the HMA
boundaries are lines and the area colouring demarcates LAs.
4.2 Map 1 is first a ‘master’ version of the conventional type of map, with an ‘underlay’ of topographic detailiv to help orientation. On this map type, as well
as the colouring to individuate the LAs, there are 2 character identifiers of selected localities: Annex 5 provides a ‘look-up’ between these identifiers
and the full place names.
4.3 The same places are also shown – but with full names – on the schematic map type which is illustrated by Map 2. This type of map replicates the
colouring of local authority areas. On this one map only there are also names of those LAs whose name does not appear as one of the place names:
for example the name “CALDERDALE” is shown on this map, whereas on other maps this LA is identifiable as the set of ‘tiles’ of the same colour
which include Halifax and the five other named places within its area, such as Todmorden.

10
Map 1: Master map of the Leeds City Region and the surrounding areas

11
Map 2: Template for the generalised ‘tile’ maps which can highlight substantive differences between different sets of HMAs

12
4.4 As context for the HMA boundaries in the rest of this Report, it is valuable to summarise the 2013/14 average house price geographyv of the LCR:
Map 3 shows this at the scale of Middle-layer Super Output Area. It is very clear that the higher price areas are limited to the more rural areas to the
north of the LCR, extending from the western fringes of York to the southern Yorkshire Dales as well as Ribble Valley (Lancashire). In direct contrast,
the lowest price areas are concentrated in inner areas of former textile towns and cities, plus much of the former coalfield to the south of the LCR.
Map 3: Average 2013/14 house prices in Middle-layer Super Output Areas (£)

13
4.5 Map 4 shows house price change over 7 years to 2013/14. This pattern is complex, but suggests the urban-rural price divide widened in these years.
Map 4 Middle-layer Super Output Area average house price change 2006/07 – 2013/14 (%)
14
5 NHPAU
5.1 The key reference point here is the set of HMAs defined with 2001 data for NHPAU (see end note 1). Maps 5 & 6 show in the two cartographic formats
used here the 2001-based 2-tier HMAs: note that these are the original ward-scale boundaries from the analysis, and not those best-fit to whole LAs.
Both maps use continuous lines as boundaries for upper tier Strategic HMAs, and broken (‘pecked’) boundaries for lower tier Local HMAs. (It is not
feasible to show here the full extent of the HMAs covering some parts of Barnsley LA because these extend to Sheffield and areas further south still.)

15
Map 5: NHPAU 2001-based 2-tier HMAs
16
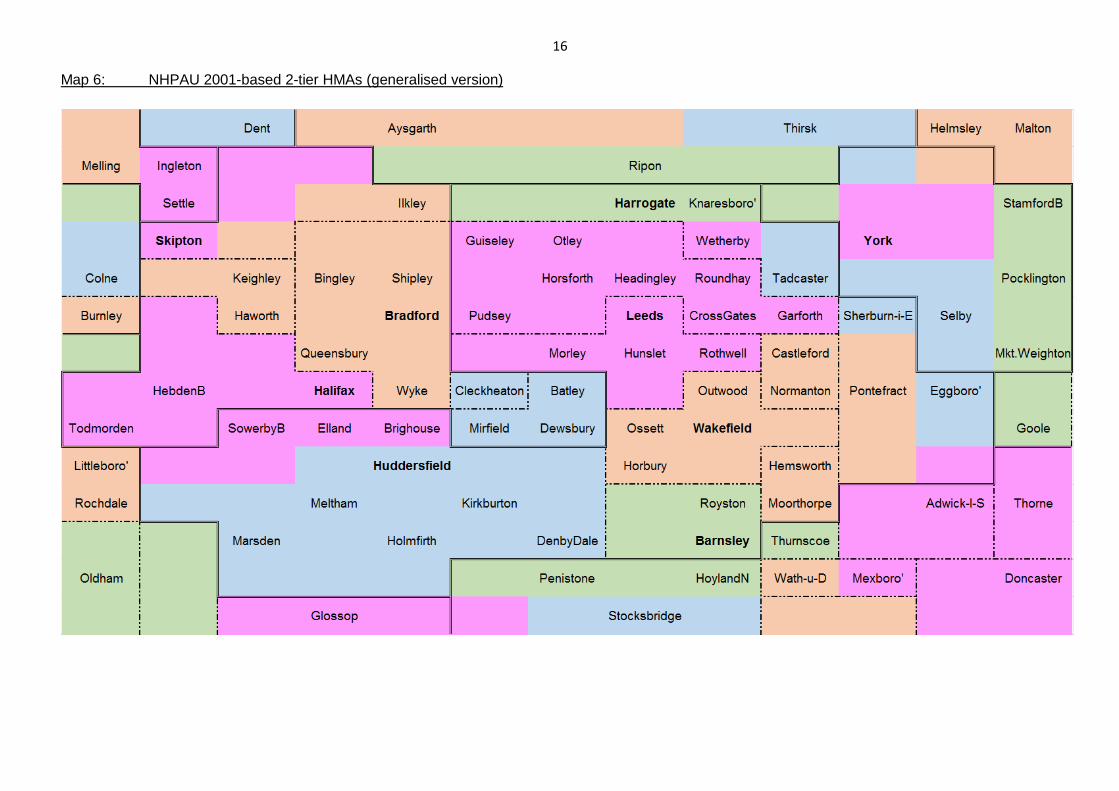
Map 6: NHPAU 2001-based 2-tier HMAs (generalised version)
17
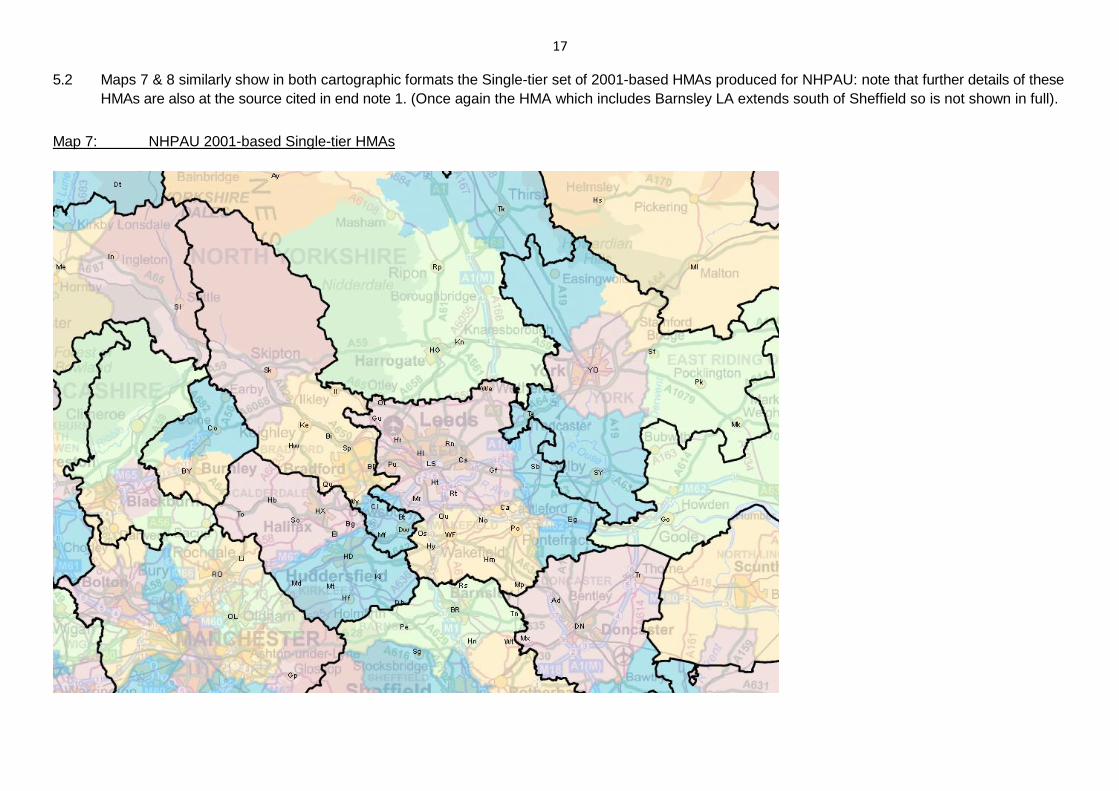
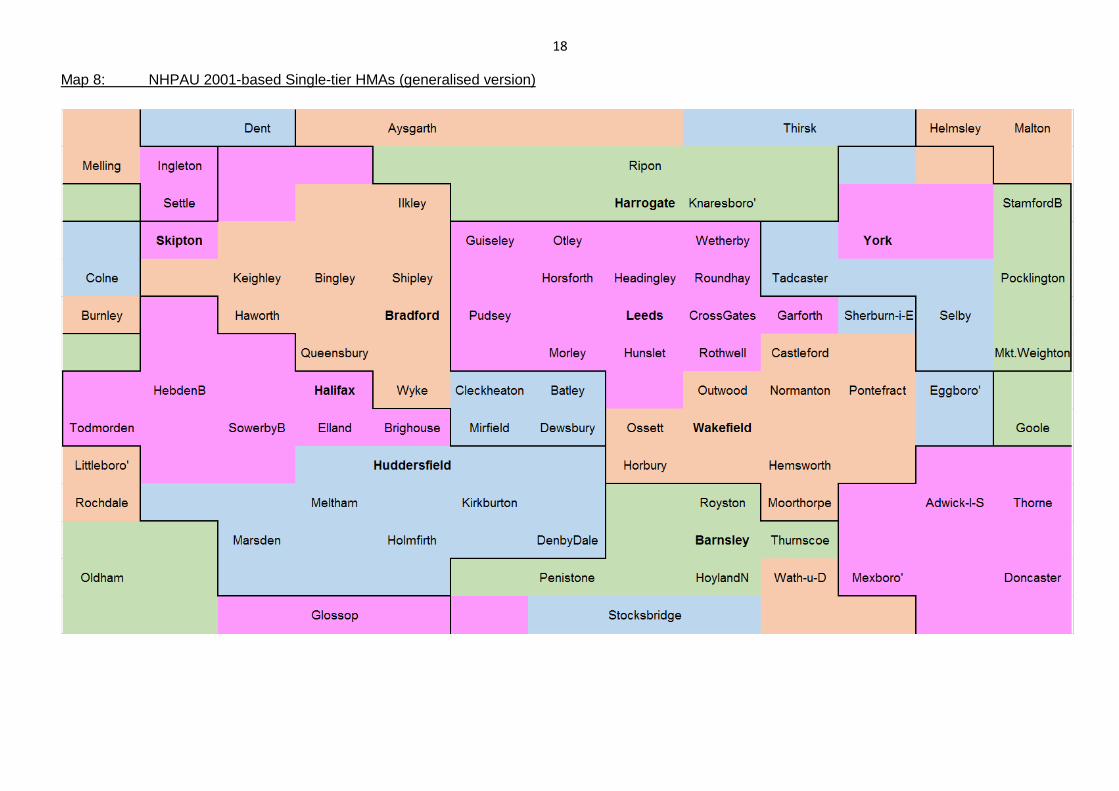
5.2 Maps 7 & 8 similarly show in both cartographic formats the Single-tier set of 2001-based HMAs produced for NHPAU: note that further details of these
HMAs are also at the source cited in end note 1. (Once again the HMA which includes Barnsley LA extends south of Sheffield so is not shown in full).
Map 7: NHPAU 2001-based Single-tier HMAs
18
Map 8: NHPAU 2001-based Single-tier HMAs (generalised version)

19
6 Results
6.1 With the previous section of the report setting the context for the research by mapping the 2001-based NHPAU HMA boundaries in the LCR, this section
now provides the sets of results produced with the new 2011 data specifically for this study. The first aim is, so far as possible, to directly ‘update’ both the
2-tier and the Single-tier sets of HMAs. The main similarities and differences between the 2001-based and the 2011-based results will then be described,
although it is relevant to reiterate here the points made in section 3 about the enforced limitations of such an ‘updating’ which arise due to differences
between the datasets from the two Censuses.
6.2 It is important to keep in mind when reviewing these results that HMA boundaries are the result of analysing flows of two kinds (commuting and migration),
in both directions, between each of the very many small areas in the datasets. This means that it would take an intensive study of all these millions of flows,
from two different Censuses, before a robust hypothesis could be put forward as to just why any one 2011-based boundary between two places differed
from the equivalent 2001-based set of HMAs. To give an example: two previously separate HMAs becoming a single HMA may not always be because the
flows between them – of whichever kind – have increased, but even if they have does this apply to the flows in both directions? It is also possible that the
flows between them stayed fairly similar, but in one or both of them the internal flows have declined, which will equally reduce its level of self-containment.
These and other flow changes can cause the HMA boundaries to change, while each of these changes may in turn be the result of a range of more familiar
planning-related ‘real world’ changes such as new house building, change in the work available in certain localities, or major transport improvements.
6.3 Map 9 shows the 2011-based 2-tier HMAs (nb. whereas the 2001 migration dataset only covered people aged 25(+), this dataset covers all migrants).
To help distinguish the 2011-based results from the 2001-based NHPAU HMAs shown earlier, here the boundaries are shown in purple instead of black.
Map 10 shows the same boundaries in the generalised format which puts the focus on the way the HMAs group or separate the main settlements,
helping to focus attention on more substantive similarities or differences between different sets of boundaries. (Map 9 is unable to show the full extent
of the Strategic HMA which includes Barnsley LA because it extends south of Sheffield; Map 9 also omits some outlying areas of the York HMAs
which have very small populations.)

20
Map 9: 2011-based 2-tier HMAs

21
Map 10: 2011-based 2-tier HMAs (generalised version)

22
6.4 The upper tier is defined by analysing commuting data, so these boundaries remain unchanged when the 2011-based analyses shift to using the
migration dataset which only cover migrants aged 25(+), so as to more closely replicate the lower tier boundaries defined with 2001 data for NHPAU.
To first highlight these upper tier Strategic HMAs, which remain unchanged in both sets of 2011-based 2-tier HMAs, Map 11 shows them separately.
Map 11: 2011-based Strategic HMAs (generalised version)

23
6.5 Maps 12 and 13 now show the set of 2-tier HMAs in which the lower tier of Local HMAs was defined by only analysing data on migrants aged 25(+).
(Map 12 is unable to show the full extent of the Strategic HMA which includes Barnsley LA because it extends south of Sheffield; Map 12 also omits
some outlying areas of the York HMAs which have very small populations.)
Map 12: 2011-based 2-tier HMAs but with only the migration of people aged 25(+) used to define the Local HMAs

24
Map 13: 2011-based 2-tier HMAs but with only the migration of people aged 25(+) used to define the Local HMAs (generalised version)
6A Updating Strategic HMAs
6A.1 The principal starting point in comparing the 2011-based results with those produced for NHPAU is to consider only the upper tier or Strategic HMAs,
not least because the two sets of 2011-based boundaries are the same at this level (ie. whether or not the migration dataset includes the under 25s).

25
Box 1 lists the key points from this comparison.
Box 1: Comparison of the Strategic HMAs based on 2011 data with those from 2001 (NHPAU)
1.1 Both sets of boundaries show that just 2 Strategic HMAs cover the whole of W.Yorkshire
1.2 Bradford is now smaller: Leeds ‘gains’ from it all parts of Calderdale & Kirklees plus part of Wharfedale within the Bradford LA
1.3 Leeds ‘loses’ the bulk of Barnsley LA which was in its NHPAU Strategic HMA, while it ‘gains’ Tadcaster plus the northern part of Harrogate LA
to encompass Ripon
1.4 York’s 2011-based Strategic HMA is larger than its NHPAU equivalent as it extends into Ryedale LA
1.5 Craven LA is still split between Bradford and a link into Lancashire, but the boundary has shifted with Settle now in the former rather than the latter
6B Updating Local HMAs
6B.1 It is rather more complicated to consider change at the level of the lower-tier (Local) HMAs. This is partly because of the difference between the sets
of results obtained using 2011 data depending on whether the under 25s were included in the migration data. It is also the case that the smaller size
of the Local HMAs makes it more likely that there is ‘turbulence’ in their definitions. Box 2 lists key points from the comparison of the Local HMAs
using the different datasets.
Box 2: Comparison of the lower-tier (Local) HMAs based on 2011 data with those from 2001 (NHPAU)
2.1 Bradford LA is always split into 3 Local HMAs, although with varying boundaries either side of Keighley
2.2 Calderdale is a single Local HMA in both 2011 sets of results (whereas it was split by NHPAU’s Strategic HMA)
2.3 N.Kirklees is separate from Huddersfield in all the results; within this area, Local HMAs are variable
2.4 Wakefield LA in all results is split into 4 Local HMAs: Castleford | Pontefract | Hemsworth | Wakefield
2.5 NHPAU’s Leeds Local HMAs split the LA north-south but this is not replicated with the 2011 dataset which is similarly limited to 25(+) migrants because
these results have Leeds as a single Local HMA; the dataset which covers all migrants splits off a new Local HMA in the east of the LA (nb. it also
replicates the NHPAU Local HMA allocation of Wetherby separately from the rest of Leeds LA, grouping it with Harrogate)
2.6 The fact that York’s 2011-based Strategic HMAs is larger than its NHPAU equivalent results in it having a split at the Local level which replicates the
NHPAU Strategic HMAs' separation of York from most of Ryedale LA

26
6C Single-tier HMAs
6C.1 The other analyses of 2011 datasets are to create Single-tier HMAs with one or other of the two methods described in section 2: either the one used
to produce the NHPAU Single-tier HMAs, or the method which defines what are here termed Alternative Single-tier HMAs. Both of these methods
involve the analysis first of commuting data and then migration data, and it is noteworthy that for each method the same boundaries are produced
whether the migration dataset includes those aged under 25s, or excludes them. As a result, it is only necessary here to show one set of boundaries
for each method, because for neither method is the boundaries it produces here sensitive to the change in migration data. Maps 14 & 15 show the
Single-tier HMAs, defined in the same way as NHPAU Single-tier HMAs, in both map formats. (Map 14 is unable to show the full extent of the HMA
which includes Barnsley LA because it extends south of Sheffield.)

27
Map 14: 2011-based Single-tier HMAs

28
Map 15: 2011-based Single-tier HMAs (generalised version)
29
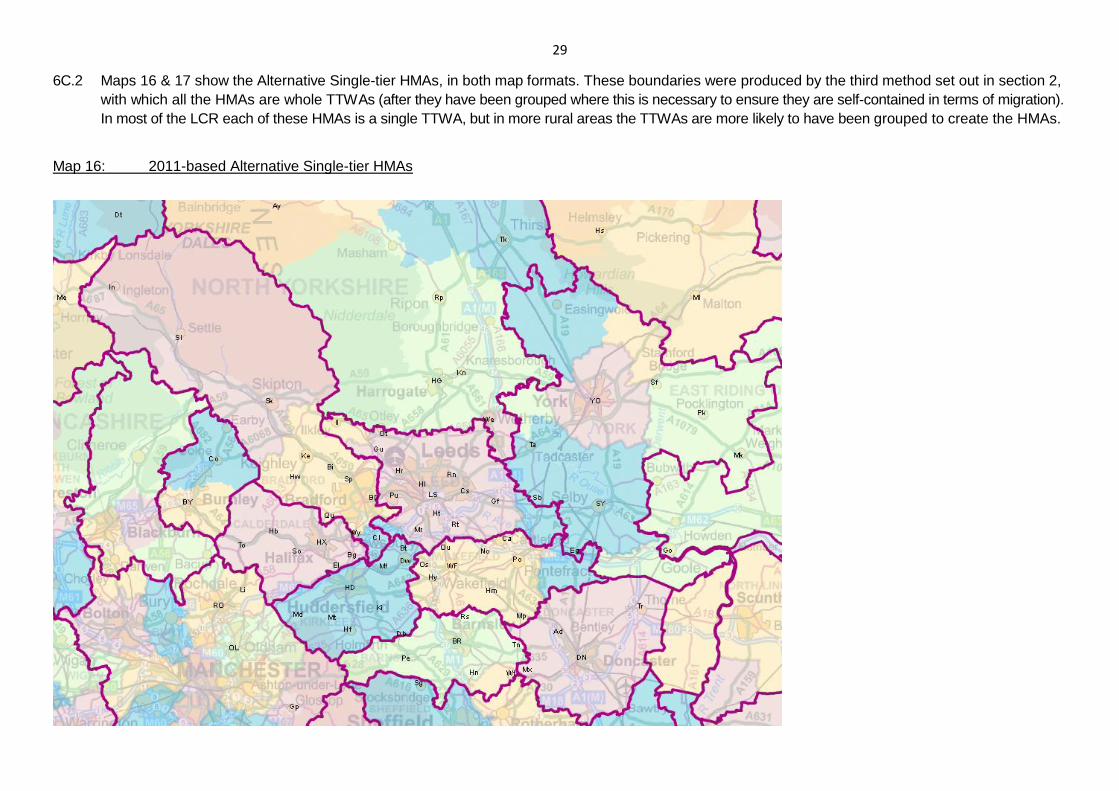
6C.2 Maps 16 & 17 show the Alternative Single-tier HMAs, in both map formats. These boundaries were produced by the third method set out in section 2,
with which all the HMAs are whole TTWAs (after they have been grouped where this is necessary to ensure they are self-contained in terms of migration).
In most of the LCR each of these HMAs is a single TTWA, but in more rural areas the TTWAs are more likely to have been grouped to create the HMAs.
Map 16: 2011-based Alternative Single-tier HMAs

30
Map 17: 2011-based Alternative Single-tier HMAs (generalised version)
31
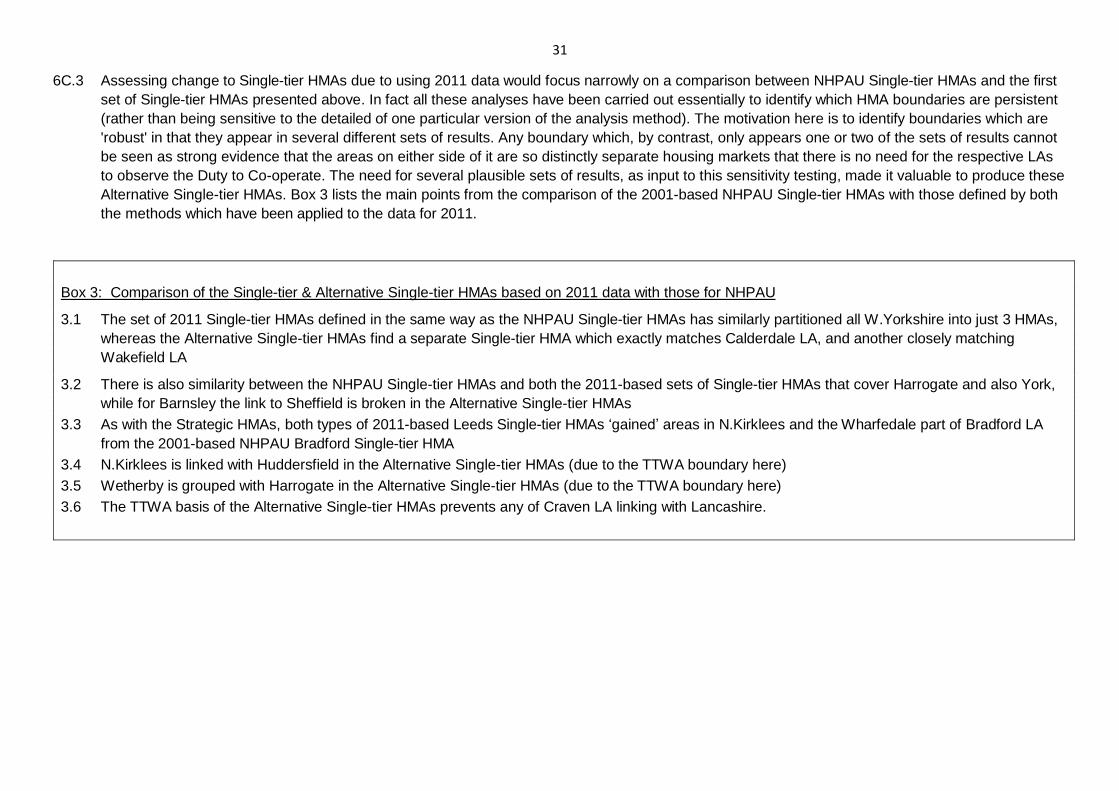
6C.3 Assessing change to Single-tier HMAs due to using 2011 data would focus narrowly on a comparison between NHPAU Single-tier HMAs and the first
set of Single-tier HMAs presented above. In fact all these analyses have been carried out essentially to identify which HMA boundaries are persistent
(rather than being sensitive to the detailed of one particular version of the analysis method). The motivation here is to identify boundaries which are
'robust' in that they appear in several different sets of results. Any boundary which, by contrast, only appears one or two of the sets of results cannot
be seen as strong evidence that the areas on either side of it are so distinctly separate housing markets that there is no need for the respective LAs
to observe the Duty to Co-operate. The need for several plausible sets of results, as input to this sensitivity testing, made it valuable to produce these
Alternative Single-tier HMAs. Box 3 lists the main points from the comparison of the 2001-based NHPAU Single-tier HMAs with those defined by both
the methods which have been applied to the data for 2011.
Box 3: Comparison of the Single-tier & Alternative Single-tier HMAs based on 2011 data with those for NHPAU
3.1 The set of 2011 Single-tier HMAs defined in the same way as the NHPAU Single-tier HMAs has similarly partitioned all W.Yorkshire into just 3 HMAs,
whereas the Alternative Single-tier HMAs find a separate Single-tier HMA which exactly matches Calderdale LA, and another closely matching
Wakefield LA
3.2 There is also similarity between the NHPAU Single-tier HMAs and both the 2011-based sets of Single-tier HMAs that cover Harrogate and also York,
while for Barnsley the link to Sheffield is broken in the Alternative Single-tier HMAs
3.3 As with the Strategic HMAs, both types of 2011-based Leeds Single-tier HMAs ‘gained’ areas in N.Kirklees and the Wharfedale part of Bradford LA
from the 2001-based NHPAU Bradford Single-tier HMA
3.4 N.Kirklees is linked with Huddersfield in the Alternative Single-tier HMAs (due to the TTWA boundary here)
3.5 Wetherby is grouped with Harrogate in the Alternative Single-tier HMAs (due to the TTWA boundary here)
3.6 The TTWA basis of the Alternative Single-tier HMAs prevents any of Craven LA linking with Lancashire.

32
7 Synthesis
7.1 Although a degree of focus has been placed on stability between the NHPAU 2001-based results and those from the analyses of datasets from 2011,
it was probably inevitable that more of the commentary relates to differences than to similarities. It is important to caution against interpreting any
apparent emphasis on change since 2001 as confirming a natural tendency for local knowledge of physical and economic change to prompt a belief
that there was a high degree of flux in the boundaries of HMAs. From a more analytical perspective, the results can be interpreted as show a higher
level of stability than might have been expected, not least given the notable differences identified earlier between the datasets from the two Censuses.
7.2 For this study “Have boundaries changed much?” is not in fact the most relevant question, because it is the answer to the question “Where do the
boundaries change least?” which will provide the more useful information. This is because boundaries which are persistent across several different
analyses can be seen to be separating areas which are not strongly linked by housing market pressures. This then implies that the LPAs on either
side of such boundaries are less obliged to co-operate with their SHMAs because housing provision on one side of the boundary is unlikely to resolve
unmet in the adjacent HMA, and investment in major sites in one Plan area is unlikely to impact upon the delivery of sites in the adjacent area.
7.3 Answering the question “Where do the boundaries change least?” requires a synthesis of the results from several sets of boundaries. To some extent
of course, the results will depend on the choice of boundaries to include in this synthesis. Here the synthesis excludes all 2001-based NHPAU HMAs;
it places slightly more weight on the 2-tier set of 2011-based HMAs by including both tiers as separate boundary sets (including both lower tier sets,
which are the only results here which differed depending on whether the migration data analysed had included the under 25s). The following list
specifies the 5 sets of boundaries included in this synthesis.
> 2011-based upper-tier Strategic HMAs, whether or not migrants under 25 are included (Map 11)
> 2011-based lower-tier Local HMAs, where migrants under 25 are included (Map 10)
> 2011-based lower-tier Local HMAs, where migrants under 25 are not included (Map 13)
> 2011-based Single-tier HMAs, whether or not migrants under 25 are included (Map 15)
> 2011-based Alternative Single-tier HMAs, whether or not migrants under 25 are included (Map 17)
7.4 Given that there are 5 sets of HMA boundaries included in the synthesis, a boundary between two adjacent localities will be present a minimum of 0
and a maximum of 5 times in the input HMAs. In the terms of Geographic Information Systems, each such boundary set is a ‘layer’ and the synthesis
then counts the number of such ‘layers’ in which the same boundary appears. At this point it becomes particularly valuable that each boundary set has
been simplified into the ‘tile’ format here, because it enables the synthesis to focus on substantial similarities or differences across the boundary sets,
rather than being distracted by any minor differences in alignment at the level of individual wards.
7.5 Map 18 provides this synthesis of the 5 sets of HMA boundaries listed above. The differing ‘weights’ of the boundaries between each pair of ‘tiles’
shows how often across the 5 HMA maps that pair of areas were in different HMAs. If they were in different HMAs on either all or 4 of the 5 maps then
there is a full line boundary between them; if they were in different HMAs on only 3 of the 5 (ie. still the majority) then a ‘pecked’ boundary is shown.

33
Map 18: Synthesis from the main sets of 2011-based HMAs, indicating the strength of their evidence that pairs of adjacent areas are in different HMAs
7.6 The earlier comparisons of each set of 2011-based HMAs with their equivalent NHPAU set are now set aside, because the following description
only considers the 2011-based results as synthesised in Map 18. The aim here is to interpret this evidence about these 5 sets of results in terms
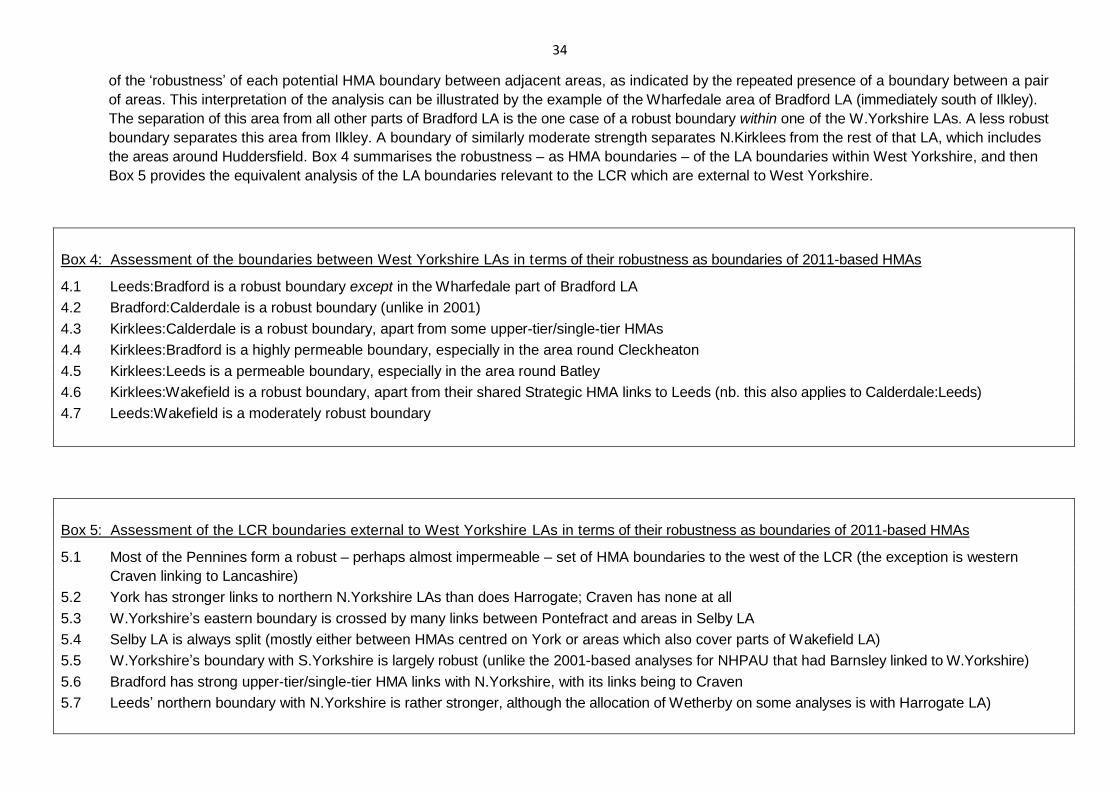
34
of the ‘robustness’ of each potential HMA boundary between adjacent areas, as indicated by the repeated presence of a boundary between a pair
of areas. This interpretation of the analysis can be illustrated by the example of the Wharfedale area of Bradford LA (immediately south of Ilkley).
The separation of this area from all other parts of Bradford LA is the one case of a robust boundary within one of the W.Yorkshire LAs. A less robust
boundary separates this area from Ilkley. A boundary of similarly moderate strength separates N.Kirklees from the rest of that LA, which includes
the areas around Huddersfield. Box 4 summarises the robustness – as HMA boundaries – of the LA boundaries within West Yorkshire, and then
Box 5 provides the equivalent analysis of the LA boundaries relevant to the LCR which are external to West Yorkshire.
Box 4: Assessment of the boundaries between West Yorkshire LAs in terms of their robustness as boundaries of 2011-based HMAs
4.1 Leeds:Bradford is a robust boundary except in the Wharfedale part of Bradford LA
4.2 Bradford:Calderdale is a robust boundary (unlike in 2001)
4.3 Kirklees:Calderdale is a robust boundary, apart from some upper-tier/single-tier HMAs
4.4 Kirklees:Bradford is a highly permeable boundary, especially in the area round Cleckheaton
4.5 Kirklees:Leeds is a permeable boundary, especially in the area round Batley
4.6 Kirklees:Wakefield is a robust boundary, apart from their shared Strategic HMA links to Leeds (nb. this also applies to Calderdale:Leeds)
4.7 Leeds:Wakefield is a moderately robust boundary
Box 5: Assessment of the LCR boundaries external to West Yorkshire LAs in terms of their robustness as boundaries of 2011-based HMAs
5.1 Most of the Pennines form a robust – perhaps almost impermeable – set of HMA boundaries to the west of the LCR (the exception is western
Craven linking to Lancashire)
5.2 York has stronger links to northern N.Yorkshire LAs than does Harrogate; Craven has none at all
5.3 W.Yorkshire’s eastern boundary is crossed by many links between Pontefract and areas in Selby LA
5.4 Selby LA is always split (mostly either between HMAs centred on York or areas which also cover parts of Wakefield LA)
5.5 W.Yorkshire’s boundary with S.Yorkshire is largely robust (unlike the 2001-based analyses for NHPAU that had Barnsley linked to W.Yorkshire)
5.6 Bradford has strong upper-tier/single-tier HMA links with N.Yorkshire, with its links being to Craven
5.7 Leeds’ northern boundary with N.Yorkshire is rather stronger, although the allocation of Wetherby on some analyses is with Harrogate LA)

35
8 Consultation
8.1 Early in the study a methodology workshop with stakeholders gained broad ‘buy-in’ to the methodology proposed for the method of defining HMAs.
After the analyses were completed the results were summarised in a briefing document and this was sent to stakeholders in the full consultation
stage of the study. This section of the report first describes the consultation process, then outlines the findings, and finally indicates their implications.
Annexes 1 to 3 provide further information on the consultees and their responses (nb. as is customary, these summaries of responses have not been
sent to the respondents for them to check, a step which would not have been possible within the schedule of the study in any case).
8A The consultation process
8A.1 LCR local authorities and neighbouring LAs had been engaged at an early stage of the project through an initial workshop, which laid the groundwork
for the detailed consultation reported in Annex 1. LPA officers attended a workshop presenting results on February 22nd, and a summary report was
circulated to strategic planning officers across the LCR and its neighbouring LPAs and city regions.
8A.2 Additional consultation efforts were directed at Developers, Agents and Registered Providers (RPs) active across the LCR. Contact details were
sought from LPA strategic planning contacts, these were supplemented by contacts identified through NLP's regional office in Leeds.
8A.3 In order to maximise the value of the consultation, a range of questions were developed (in conjunction with the client) and circulated to all contacts
prior to the telephone discussions. The questions which formed the basis of the discussions with LPAs are included in Annex 1. Table 1 presents the
number of discussions which were undertaken, and indicates which of the Annexes includes a basic outline of each of the individual responses.
Table 1 Achieved Consultation
LPAs Registered Providers Developers & Agents
Number consulted: 8 7 18
Detailed feedback in: Annex 1 Annex 2 Annex 3
8B Consultation Findings
8B.1 This section is structured to follow the questions which informed the discussions, and highlights differences between different categories of consultee.

36
Alignment of the CURDS analysis with local knowledge, and concerns with the analysis in respect of current LPA Local Plan evidence base
8B.2 Overall the majority of LPAs felt that the CURDS analysis reflected their local understanding of housing market areas. The following issues were
raised by LPAs in respect of the analysis and the boundaries identified.
Barnsley felt that the change in the upper-tier boundary (putting it with Sheffield rather than Leeds) exaggerated any change in the strength of the
relationship between itself and Wakefield; Sheffield were also keen to understand the change, feeling that it could be due to the geographic proximity
of the northern parts of Sheffield to the economic centres in the southern parts of Barnsley
Wakefield also felt that the change to the boundary between Wakefield and Barnsley was surprising and that future changes and investment will
result in greater interaction between the two areas
Harrogate felt that the change to its boundary with Leeds which highlighted the strength of the cross-boundary relationship around Wetherby does not
align with their recent Strategic Housing Market Assessment (SHMA) which suggests it is a self-contained housing market
One of the changes identified by Leeds was the inclusion of the Menston area of Bradford within its areas of local interaction: this had not been
identified as part of the HMA within the Leeds SHMA; however they acknowledged that the SHMA was undertaken with 2001 travel-to-work data
Bradford felt that additional analysis was required beyond this study to understand the links with adjacent LAs in more detail
8B.2 Developer and Agent observations regarding the HMAs identified the following points.
There are strong relationships between Leeds and Bradford, and Ilkley was specifically mentioned on a number of occasions as a settlement which
should be included within the Leeds HMA
Huddersfield and Halifax were suggested to be linked to both Leeds and Manchester, driven by the transport links
The view on the boundary between Leeds and Harrogate was that there is considerable movement across it
Some respondents felt that more of the Selby area is linked to Leeds rather than York
In terms of the Local HMAs, some agents and developers suggested Leeds should be split into 3 areas covering firstly south Leeds (with its heavy
proportion of social housing), the city centre (favoured by young professionals) and the northern/north-western areas including Ilkley (with high cost
family housing, some in more rural settings)
8B.3 RPs’ observations were that the geography of the affordable rented market is difficult to relate to the HMAs identified in the analyses, largely because
of the very local catchment area for stock (up to 4 miles), with the majority of tenants having local ties to family and friends. Most of the local house
moves involve up- or down-sizing, or relocating to a better neighbourhood. Two respondents mentioned the need to look at separating Bradford’s
local market into four areas rather than two: the central city, Airedale, Wharfedale and the villages.
Drivers of links to neighbouring LPAs including understanding of short/long term trends
8B.4 The feedback from LPAs emphasised that the primary drivers of links between local authority areas were economic, and the result of access to the
job opportunities in adjacent areas, plus the infrastructure links which facilitate movement around and across LCR. The majority felt that these were
long term trends which were widely understood across LCR.
8B.5 The majority of Developers and Agents highlighted that infrastructure investments across the LCR have driven changes within the housing market.

37
The consequence of this has been an extension of commuting areas, in particular from Leeds northwards to Harrogate LA, westwards to Bradford,
eastwards to Selby and York. Developers and Agents also identified the land supply issues/constraints in Leeds as a key driver which led Developers
to look elsewhere, with the identified locations being particularly driven by infrastructure.
8B.6 RPs identified the key short term driver of stock availability, and of stock types, rather than geographic or economic drivers. Demand has driven the
development of family housing.
Identification of possible changes in the future
8B.7 A number of LPAs highlighted future infrastructure, and economic and housing investments, which could potentially influence linkages in the future.
Barnsley has economic aspirations involving significant levels of job creation which is hoped will help retain out-commuters
Greater links are expected from Leeds through to Sheffield driven by the rail corridor; Barnsley and Wakefield both identified this investment as one
which would strengthen the links between their areas
East Riding felt that the rail infrastructure investments between Manchester and Leeds could shape markets in the future
Kirklees has aspirations for significant growth around Dewsbury/Batley through the North Kirklees Growth Zone, and this could result in changed
commuting patterns through the economic opportunities created
Selby highlighted their ambition to meet the leisure needs of residents; while not changing commuting patterns linking Selby to Leeds, it is hoped this
would develop the leisure economy and retain residents at the weekends and in the evenings
Wakefield identified investment at Meadowhall in relation to HS2 as a driver of greater links south to Sheffield through infrastructure improvements
Bradford mentioned investment around new transport infrastructure (eg. a station at Appleby Bridge) changing local commuting patterns
8B.8 Developers and Agents felt that once the Allocations DPD was established for Leeds and that additional land was identified for residential
development then Leeds would again become a strong focus for housing delivery, reducing the current drivers which have led to new housing being
displaced to other areas. The strength of Leeds should not be underestimated in terms of future drivers, while a few respondents also mentioned the
influence of Manchester to the west of the LCR, perhaps related to the Northern Powerhouse economic impact and Northern PowerHouse Rail.
8B.9 The impact of Welfare Reform was identified by RPs as a key future driver in terms of demand for stock and the expected change in demand for
certain types of stock, and in particular how they will meet the needs of single person households. A number of RPs highlighted the economic viability
of developing stock across the LCR due to the cost and the rents which can be achieved. Together with the Government's focus on helping people
onto the property market, this will shift demand towards shared ownership and rent-to-buy. RPs do not expect these changes to impact on the HMAs
identified here, as current demand will influence future investment decisions.
Dialogues with neighbouring LPAs
8B.10 LPAs within the LCR viewed the established links in respect of strategic planning as effectively facilitating discussions under the Duty-to-Co-operate.
8B.11 Developers and Agents identified 3 LPAs needing to increase joint working with Leeds: these were Bradford, Wakefield, Harrogate. In addition some
Developers and Agents felt Leeds also needed greater links with Selby and Calderdale. Developers and Agents were generally more critical of the
38
relationships between LPAs and questioned how effective discussions had been to date in respect of dealing with key issues and addressing the
Duty-to-Co-operate. Developers and Agents felt that in those areas where greater links were needed, there was a need for joint housing policies,
particularly in relation to site allocation and land release, and infrastructure investments and improvements. Developers and Agents were generally
questioning how far individual LPAs could meet their own housing needs.
How the study will be used
8B.12 The majority of LPAs identified that they would use the study as part of their evidence base, although some were still considering how they would use
the results. None of the LPAs questioned the methodology or integrity of the study but some highlighted differences between the new results and the
NHPAU research in the existing evidence base as raising issues which they would consider further.
Merit of undertaking future evidence based studies at a more strategic level, including the consideration of an appropriate boundary for any future studies
8B.5 There was a marked split in response to these issues from LPAs. LPAs located within the LCR could see merit in undertaking further studies at this
geographic level, although this came with caution as to the purpose of any further studies. The majority of LPAs confirmed that any study undertaken
should add value, and there were concerns over evidence which may undermine progress with the development of Local Plans in the short term.
LPAs from outside the LCR did not have a strong view on additional studies. A number stated that there would potentially be merit in further studies
and highlighted that the LCR boundary would be a sensible boundary given that it provided a broader geographic understanding of the context for
their local areas. However this might need to extend even further, given the links to other parts of Yorkshire. Leeds LPA felt that additional strategic
studies may become important as part of devolution.
8C Summary Implications
8C.1 Most of the LPAs have been re-assured to see that their Local Plan evidence base was aligned to the CURDS analysis results. Some local issues
warrant further research into key drivers, particularly between LPAs where the strength of relationships identified seemed to have changed, with the
possibility that different HMAs need to be identified as a consequence. These cases included:
Barnsley and Wakefield,
Kirklees and Leeds,
Barnsley and Sheffield,
Leeds and Bradford, particularly the area around Wharfedale,
Leeds and Harrogate, particularly around Wetherby.
8C.2 A much stronger view from Developers and Agents was that some of the identified HMAs may need to change to identify boundaries which reflect the

39
functioning of the housing markets of interest to them (nb. these are essentially limited to private sector housing markets).This illustrates the different
market perspectives and drivers identified by private developers which are important to keep in mind when considering their responses, but as noted
in section 2 the current available data does not allow the definition of tenure-specific HMAs.
8C.3 The analysis of the housing market geography in LCR is seen as timely, especially given the recommendations by LPEG (mentioned in the opening
section of this report) which make particular reference of the importance of updating analyses to identify HMAs for the purposes of undertaking local
objective assessments of need and so ensure that future housing needs are met within and across HMAs. The motivation of LPEG was the need for
a speeding up the Local Plan process and for improvements to a number of elements in the plan making process, notably the effective delivery of the
Duty-to-Co-operate. This study puts the LCR in a good position, should the recommendations become part of national planning policy and guidance.
Even if all of the recommendations identified by LPEG are not endorsed by Government, the need for a robust evidence base for LPAs will remain
and this study will make a valuable contribution across the LCR.
8C.4 Given that the Housing and Planning Act (12 May 2016) enables combined authorities to take over the preparation of local plans from LPAs in their
respective area should they prove too slow in bringing a plan forward, this research ensures the West Yorkshire Combined Authority and its LPA
partners will be on the front foot in responding to national planning legislation. Given the number of LPAs in the West Yorkshire Combined Authority,
it is crucial that these new powers for the Combined Authority are used in ways which enable collaboration and genuine partnership working where
decision-making is undertaken by consensus. If one of the Combined Authority’s member authorities fall behind in preparing a local plan, the other
members of the Combined Authority should work with it to overcome the problems faced. The engagement efforts in this study should ensure that the
LAs can feel a sense of ownership.
8C.5 By leading on this analysis the West Yorkshire Combined Authority is boosting its strategic planning role as enabler and facilitator in supporting LPAs
in reaching agreement on strategic matters. The analysis also provides the underpinning evidence to support the Combined Authority in its drawing
up of a strategic framework for the sub-region. The strategic planning framework for the West Yorkshire Combined Authority would in effect then
underpin the local plans for its constituent LPAs in addressing issues of housing delivery.

40
9 Conclusions
9.1 This research study has undertaken innovative analyses of the housing market geography of Leeds City Region. The motivation for the research was
the need to enhance the evidence base for Local Plans, as well as to guide the spatial framework for undertaking objective assessments of need
which can ensure housing needs are met within HMAs. The study also aimed to identify those pairs of LPAs whose shared boundaries are straddled
by the defined HMAs as a result of the strong commuting and/or migration flows between their areas. In these cases the Duty-to-Co-operate of the
LAs concerned is particularly important so as to ensure housing needs are met and the need to release strategic land for development is understood.
9.2 During the course of the study the initiative of LCR in commissioning the study was, in effect, positively endorsed by the published recommendations
to the Government of the LPEG, whose proposed changes are aimed at speeding up the Local Plan delivery process (an outcome which is a priority
for the Government). The recommendations emphasise the importance of updated and consistently defined housing market areas, both for the local
calculation of levels of unmet need, and also to plan the delivery of housing within the identified HMAs. This would require LPAs where unmet needs
were identified to highlight through submitted plans how these needs would be met elsewhere, and to work to achieve this. This is linked to ensuring
that the Duty to Co-operate is fulfilled in practice, which will impact directly on those authorities linked by the geography of HMAs.
9.3 Another new development which endorses the need for this research into the most recent evidence on housing market geography is the new
prospectus published in April 2016 by the Homes & Communities Agency (“Shared ownership and affordable housing programme 2016 to 2021”).
This prospectus states that future developments by RPs should be more market driven, with shared ownership and rent-to-buy developments
concentrated in areas of lower risk.
9.4 With this report LCR has gained evidence to enable it to meet the LPEG recommendations for improved delivery of Local Plans. The study research
has updated the ‘best practice’ definitions of HMAs which were developed for NHPAU, and has identified LPAs in the LCR between which there is the
most pressing need to deliver the Duty to Co-operate so as to meet unmet housing need. It is very valuable that the analyses of data from the 2011
Census produced results which show a reassuringly gradual evolution of the HMA boundaries produced for NHPAU. To have changed them radically
would be implausible because commuting and migration change slowly; it would also have been unhelpful, given the use of NHPAU HMAs in current
LA evidence bases. It is also noteworthy that the 2011-based HMA boundaries have been widely seen as a recognisable depiction of housing market
realities by respondents in the study consultation process. The following paragraphs review first the key of the findings from the study in terms of the
housing market geography of the LCR, and second the implications of these in terms of the Duty to Co-operate.
9.5 The 2011-based result are not greatly different to those from the NHPAU project in most areas. Where they do differ, it is important to keep in mind
that the boundaries are the result of a computer algorithm seeking to ‘balance’ the relative significance of the varied strength of commuting and
migration flows that criss-cross the region. It is inevitable that in some areas this is a finely balanced calculation, one which may tip slightly over time
with the result being that the boundaries in that area become quite different when the underlying flows have shifted only slightly, and in diverse ways.
It is for this reason that this study has undertaken several slightly varied analyses, to avoid placing too much reliance on a single set of boundaries.
This approach provides sensitivity testing of the results, with a synthesis then drawn from several sets of results so as to focus on robust findings.
9.6 The 2011-based main findings on LCR HMA geography are summarised below, noting any key differences to those in the results for NHPAU.

41
2 Strategic HMAs cover all W.Yorkshire; Bradford is now smaller as Leeds includes all of Calderdale & Kirklees and also ‘gains’ part of Wharfedale
Leeds ‘loses’ the bulk of Barnsley LA which was in its NHPAU Strategic HMA, while it ‘gains’ the northern part of Harrogate LA to encompass Ripon
York’s 2011-based Strategic HMA is larger than its NHPAU equivalent as it extends further into Ryedale LA
Bradford LA is always split into 3 Local HMAs, although with some variation in boundaries either side of Keighley
Calderdale is a single Local HMA (this was not possible in the NHPAU results because there it was split between Leeds & Bradford Strategic HMAs)
N.Kirklees is separate from Huddersfield in all the results; within this area, Local HMAs are variable
Wakefield LA in all results is split into 4 Local HMAs
NHPAU’s Leeds Local HMAs north-south split is not replicated with the 2011 data analysis
The Single-tier HMAs replicated the equivalent NHPAU results in partitioning W.Yorkshire into just 3 HMAs
As with the Strategic HMAs, 2011-based Leeds Single-tier HMA ‘gained’ from Bradford parts of N.Kirklees and also the Wharfedale part of Bradford LA
9.7 The synthesis of different sets of results provides an indication of the robustness of boundaries between adjacent areas. Where there is a more
robust boundary between two areas, there is less evidence to suggest that unmet housing need should be accommodated within neighbouring LPAs.
However within the current LPA Strategic Housing Market Assessments in the LCR and neighbouring areas, allvi the LPAs anticipate housing needs
will be met within their local authority boundaries, because each LA had previously been considered a separate HMA.
Most of the Pennines form an impermeable boundary (apart from west Craven linking to Lancashire)
York has stronger links to the other N.Yorkshire LAs than does Harrogate; Craven has no strong links to these areas
Selby LA has no robust boundaries in terms of HMAs, it is subdivided between HMAs centred on York & Leeds (or alternatively areas in Wakefield LA
when these are not in a Leeds HMA)
W.Yorkshire’s boundary with S.Yorkshire is almost impermeable (suggesting that the 2001 links with Barnsley had moderated by 2011)
Bradford has strong HMA links with Craven
Leeds’ northern boundary with Harrogate LA is less permeable; Wetherby’s allocation is volatile
Leeds:Bradford is a mostly impermeable boundary, but has ‘weakened’ in the Wharfedale part of Bradford LA
Bradford:Calderdale is a more impermeable boundary than it was in 2001
Kirklees:Calderdale is a largely impermeable boundary
Kirklees:Bradford is a highly permeable boundary, especially in the area round Cleckheaton
Kirklees:Leeds is a permeable boundary, especially in the area round Batley
Kirklees:Wakefield is a mostly impermeable boundary, apart from their similar involvement in the wider Strategic reach of Leeds
Leeds:Wakefield is a mostly impermeable boundary, apart from in relation to the wider Strategic reach of Leeds
9.8 The findings of the research have been tested with stakeholders who predominantly recognised the validity of the HMA boundaries identified by the
statistical analysis underpinning the study. Some differing views of stakeholders were the result of their belief that patterns had changed since 2011,
42
the time when the Census captured the commuting and migration patterns which are analysed to create the HMAs presented here. It is possible that
investments in infrastructure could have partially re-shaped housing markets in the intervening period.
9.9 The findings of the study will be a key component of the work being undertaken by LCR and will help guide future plan making and planning for
housing at a city region level. The study provides the most up-to-date possible evidence on the HMAs across and within LCR, and highlights the
spatial relationships where there are wider implications of future planning decisions. The study results should not change the current plan-making
process in LCR, but they provide evidence of relevance for the updating of Local Plans. The recommendations made by LPEG to the Government
are currently being considered, and the outcomes and implications will need to be monitored, particularly if changes are made as a result to national
policy and guidance.
43
Annex 1 Consultation with Local Planning Authorities
The interviews were based on the following stakeholder questions
1 Do the boundaries identified on the maps make sense based on your local knowledge?
2 Do the markets identified differ to your understanding of local markets?
3 Are there any issues in relation to your current evidence base which you have concerns with regarding the analysis?
4 In areas where there are particular links to neighbouring LPAs what are the key market drivers in these areas?
5 Are these linkages driven by short term issues or longer term trends?
6 Are there areas where you are particularly keen in the future to influence change? Perhaps in relation to releasing economic/investment opportunities
with your area and/or with other LPAs?
7 Are there already established dialogues with LPAs with which there are identified links? (Duty-to-Co-operate)
8 How will you make use of this work in your plan making and other activities in relation to planning for housing
9 Do you think there would be merit in undertaking evidence studies at a more Strategic level, recognising the Strategic housing market issues identified
by the research? e.g.the North Yorkshire SHMA (2011).
10 Should that strategic level be the whole city region of some other geography
Sheffield City Council
1 Main interest is how Barnsley sits and the relationship between Sheffield and Barnsley
2 Understand more about how Barnsley sits between the two city-regions – is it driven by housing/economics? Sheffield SHMA (2013) highlighted links
between Chapeltown & Hoyland, Higher Green and Stocksbridge – all close to Barnsley town centre. Strong relationship with Rotherham.
3/4 Sheffield Autumn (2015) consultation – mix of urban and rural allocations- proposal in the upper Don Valley up towards Barnsley. The Strategy in
Sheffield is that they will have to make some greenbelt releases to the north – the focus is on fewer areas but larger growth. City centre focus for
economic growth and the former Airport identified for Advanced Manufacturing (A57) south side links to (A57) University and Rotherham’s Waverley
housing development. This proposed growth will reinforce and strengthen links between Sheffield and Rotherham.
5 Sheffield loses 500 households to Rotherham per annum (based on migration statistics, but flows each way are high). Incoming households to
Sheffield are smaller than those who are moving out.
6 North Sheffield close to planned economic growth in Barnsley – need to consider how this affects linkages in the future
7 Dialogues already established in respect of Duty-to-Co-operate but Sheffield keen to understand the links with Barnsley and any implications of this

44
9 Additional studies not so important for Sheffield given focus on LCR. Sheffield working on a Spatial Statement for Sheffield City region.
Demographic modelling has been undertaken.
East Riding
1/2/3 Difficulties of interim report doesn’t go far enough in terms of the main bit of East Riding.
Relationship between York/East Riding: part near Pocklington, or does it go further?
Hull’s travel to work area has expanded into East Riding but York’s hasn’t.
York’s HMA one looks broadly right.
Difference between strategic and local HMAs and applicability of it in terms of plan making.
Population and household growth (CLG) projections can’t be ‘carved’ up – have to use LA boundaries for plan working.
York trying to identify housing growth for its own area – however, York’s progress has been slow and the outcomes are as yet unknown
The links of Goole to York market area (Map 11).
Black line of Map 11 north of Goole – what does this denote?
For the strategic market assessment York’s strategic market area is greater than NHPAU purposes.
Helpful to draw distinction of the NHPAU (is it silver of gold standard which the CURDS analysis is linked to) but it would be helpful if this was made
specific within the CURDS report.
This report does not make any comparison to the NHPAU Gold standard map. The view from East Riding was that the CURDS interim report needs
to provide clarity in relation to the NHPAU standards.
4 Market drivers is the York economic area from Pocklington to Market Weighton sites in Pocklington are coming forward very quickly due to the
relationship with York.
A64 junction with A1079 – needs to be upgraded – how far these infrastructure issues have a detrimental impact in future.
5 Long standing characteristic/historic but external factors may impact on long term and influence patterns in future.
Improved Manchester/Leeds rail infrastructure could influence markets in the future.
6 East Riding seeking to meet need of Vale of York area – scale of growth not intending to meet any needs of York. More about sustainable patterns of
growth but some (York seeking to meet its own needs) houses will be bought by some households from York.
7 East Riding never been asked to meet any of York’s housing need as part of Duty to Co-operate issues.
Issues in York re Green belt – critical piece of evidence needed and currently outstanding will have implications on Duty-to-Co-operate in the future
8 Population and household growth – Inspector accepted Hull & East Riding market area.
York influences but Hull is the more important link for East Riding
The report is interesting but East Riding is more focused on NHPAU – it’s ‘interesting’ but not policy defining.
Helps with other duty-to-co-operate issues eg infrastructure/transport issues.

45
This is helpful for that in terms of infrastructure planning.
9 Always merit of research.
But needs to be useful and relevant – ‘nice to have’ vs ‘need to have’
No need to review NHPAU work.
East Riding/North Yorkshire – no need for additional work/further research.
Malton/Norton – self-contained market area.
Usability for strategic plan making purposes is Jon Palmer’s main issue.
East Riding and Hull’s has been approved by inspector.
Selby District Council
1/2/3/4 Clear with the boundaries – overall outcome.
Sherburn-in-Elmet – direct train line to Leeds accessibility is a key driver
Eggborough – proximity to M62 – quick and east motorway connection.
5 Long term trends unlikely to change. Eggborough will increasingly become part of M62/Wakefield markets
6 Recognise patterns of development.
Large proportion who work outside of Selby – economic study to understand ‘leisure’ needs of households who work outside to ensure that Selby can
meet their leisure needs outside of working hours
Average income is quite high in Selby but currently missing out on spending by households
7 Links with York – other housing market Selby has an adopted care strategy. York at a different starting point.
General relationship with York and Leeds.
8 How they will use the work: updating evidence base SHMA/employment land review this work will feed into the local work. Positive piece of work.
9 Strategic work is useful but could be helpful to look to east further especially for Selby. No strategic links to Doncaster.
If Duty-to-Co-operate need sharing housing figure for York, this could be more of an issue and this study will help to build on the strategic context.
Suggestion that one map should be the recommendation map – highlight as the picture to consider.
Leeds City Council
1 Do the boundaries make sense - Ok – good alignment
2 same as 1

46
3 Main difference is the Bradford area included in the map.
Guisley (Bradford – Menston)
Sherburn-in-Elmet (Selby)
Potential issues re: HMA is different to their evidence.
2011 SHMA full
Core strategy – household formation rates were updated but not HMA geography. Leeds looking at undertaking an update to their SHMA.
4 Key market drivers
Unsure of implications for planning – what do we do about it – identifying need at the moment – how to identify housing numbers - looking for policy
steer on this from this study
Need to state cross boundary Menston/Sherburn-in-Elmet – doesn’t mean need to provide more housing to compensate for needs and links
identified.
But some growth for settlements in Leeds is different. Might need to come through other LAs/adjacent LAs.
8 How will they use the CURDS research
Housing requirement adopted 2014
Sites DPD is being delivered now – sites plan examination pressure from community groups to reduce numbers/sites.
2014 Core Strategy refresh in 5 years.
This could be used to help this and influence HMAs.
9 No need to undertake more studies at a strategic level (not now).
Possibly needed as the Devolution agenda progresses.
Barnsley
1 -4 Wakefield/Barnsley – lack of links a surprise
Further understanding on the changes between Barnsley and Wakefield (want to know more) – better understanding is needed of the changes
experienced here particularly in relation to this relationship
Barnsley/Doncaster comfortable with the level of linkages identified
7 Dialogues with LPA will take through the plan-making process: one to one issues will be picked up through this.
8 How will you make use of this: links through to the SHMA
General Comments
Leeds to Sheffield corridor approach is being pursued which will improve accessibility.
Barnsley/Doncaster travel to work issues.

47
Barnsley – aspirational jobs growth so looking to allocate considerable areas of economic growth/development
Many people commute out of Barnsley and want to retain them as economically active workers in Barnsely
SHMA 2015 date – local market issues presented in here
Harrogate
1-6 GL Hearn SHMA conclude there is a relationship with Leeds to the south of the Borough.
Different compared to SHMA – TM passed MC contact details regarding how the relationships have changed and whether the relative strength of the
relationship has changed.
Interested in exploring more.
Always assumed most in-migration is from Leeds. Strong commuting pattern to and from Leeds/Harrogate.
Harrogate residents take higher paid jobs – commute out.
Residents from outside the Borough commute into Harrogate to take lower paid jobs – hotel and conferencing.
Desire to get higher paid jobs in Harrogate over longer term – but question of how this is influenced and the extent influence.
Discussions with how planning and other influences how it might attract different economic sectors.
Harrogate is currently preparing a sites/policies DPD on this.
New ELR 2015
7 Established mechanisms there in respect of strategic links for planning purposes. (consultation on Leeds sites DPD, current work on this – not in a
position to understand).
8 Will use the evidence how and when they can – need to know how it affects them in terms of Harrogate/north west Leeds linkages.
9 Boundary would be appropriate for any additional studies
Ryedale District Council
1 Consistent with emerging SHMA work. Bit of a gap with the boundaries show to cover the full extent of Ryedale but accept the study is focused on
LCR
2 South part of Ryedale has a relationship with York.
Ryedale has a strong link to Scarborough
5 Drivers – functional economic area of York.
People who work in York live in Ryedale.

48
One train line Malton to York
Where York sites ‘dry up’ then more pressure on sites in Ryedale.
House sales on sites anecdotal of demand from York
6 Ryedale has no desire to change any links but more focused on recognising links are there.
Malton/Norton focus for growth – main centres for growth
7 Long standing relationship in York link to the RSS.
Led to spatial planning links already established – links in place to discuss any updated evidence.
Ryedale happy they will meet their own needs – the question is more how York’s growth is met and how York deal with Green Belt (the study is on
going into York’s Green Belt)
8 Will be used in evidence base.
Ryedale view is that the wider picture very helpful.
9 Economic drivers are very interesting for Ryedale.
Organised at a local level to know what is happening and not so important at a Strategic level
10 Always difficult to answer re boundaries.
City region easy to relate to.
Wakefield
1. Boundaries makes sense
3 No concerns with evidence base.
SHMA 3 years ago – updated one confirms Wakefield is self-contained market.
But links with neighbouring especially with Leeds.
Would have expected relationship with Kirklees
5 Links to Leeds these links are likely to continue living in Wakefield while working in Leeds.
Future developments – rail corridor south from Leeds to Sheffield – allocate land around this corridor
Barnsley links to Wakefield likely to get stronger due to the infrastructure improvements.
HS2 Meadowhall could make a difference in terms of future drivers
Continue to be movement Wakefield/Barnsley evidence not significant to defining where their boundaries are.
Investment around ‘5 towns’ area
Future strategy Wakefield will look to East of District for growth
7 Strategic planning group specifically deals with Duty-to-Co-operate issues
Spatial planning group – considers a range of issues.
49
8 Yes the study will be useful and will be used.
9. In order to align plan making better – there will be a need for more strategic studies.
Nothing statutory but collaboration welcomed.
LCR boundary as it stands the right level
Wakefield/Doncaster links not overly significant could be economic driver, A1M runs down east of Wakefield – not major employment or housing
markets.
Rail services – not great to ‘5 towns’ area but good links through Wakefield and Leeds.
Kirklees Borough Council
1 Local boundaries: 2 tier (maps 6/7) make sense.
Cleckheaton dashed boundary with Batley – Kirklees keen to have some additional clarity from CURDS around this – feedback provided from
CURDS=- ‘distinction is that of Local rather than Strategic HMAs’
3 Kirklees self-contained for plan making purposes
Discussions with all Las in respect of meeting housing need and Duty-to-Co-operate
4 N.Kirklees → links to Leeds are economically driven - travel to work.
In the rural areas in the south of Kirklees, people commute to Leeds.
6 Dewsbury/Batley – identified as North Kirklees growth zone.
Secure funding from development scheme
Significant growth planned in this area could impact on markets in the future
N Huddersfield
Key strategic housing and employment sites
All providing for needs of Kirklees – not expecting to meet any needs from elsewhere
7 Key links already established
8 This piece of work will underpin further work for LPAs if needed. Kirklees strategy is to get existing population into work. SHMA part 2/updated
planned – CURDS research will feed into the SHMA – reflect/update key elements of the SHMA
9 W Yorkshire each authority states they are self-contained – therefore at the moment no need for any unmet need to be met elsewhere.
10 Area aligned with SEP so it is useful and comparable.

50
Calderdale
1 Yes – Calderdale is shown to be a single housing market area with linkages to neighbouring districts (SHMA, Nov 2015).
2 Not as far as Calderdale is concerned. Not sufficiently familiar with other HMAs to comment.
3 No – the analysis generally supports the findings of the Calderdale SHMA.
4 Commuting for employment purposes although the SHMA showed that the Halifax TTWA is contiguous with the borough boundary. Just over one third
of working residents commute to work in another authority.
5 Travelling across the district boundary for employment purposes represents the continuation of a longer term trend.
6 Not clear at the moment as regards employment/economic matters with the Employment Land Review yet to report. This will inform the situation
further. There are potential employment proposals in the neighbouring Kirklees LP to which residents of Calderdale would have access. However,
whilst refinement of the draft employment land allocations and hence the spatial implications are required, broadly speaking Calderdale does wish to
strengthen its economic base. This includes bringing forward the Employment Allocation at Wakefield Road, Clifton (EM42 in the Replacement
Calderdale Unitary Development Plan).
7 Yes, particularly with Kirklees regarding land allocations and Green Belt issues in relation to meeting housing needs. Also transport links between the 2
districts, particularly the A629 corridor as well as improvements to the M62 including a possible new junction 24a.
8 Currently being discussed but cumulative implications will inform outcomes for both districts with a possible joint statement to be considered.
9 In principle this would be a logical approach as it would assist in common methodologies, base dates, data collection methods etc. It could also aid the
distribution of eg housing without having to invoke the official DTC approach as undertaken currently and would be closer to regional planning,
particularly if evidence relating to environmental thresholds were included in the evidence gathering.
However, such work should not undermine existing SHMAAs on which the current round of Local Plans is based. A higher level would be most
beneficial if it were to inform distribution at that level rather than just providing potentially more contextual evidence.
Clearly it would be of benefit to include the whole of the City Region but given the overlaps in parts of the LCR with neighbouring city regions/LAs it
would need to be broader to adequately evidence and plan for these areas. In Calderdale’s case this is less of an issue since the Pennines largely
form a barrier as far as HMAs are concerned with Greater Manchester/Lancashire to the west.
Bradford
1 Broadly agrees with the boundaries, though ‘hard’ lines between areas are difficult to interpret and there is the need to undertake further work to
interpret some of the relationships identified.
Bradford as part of the development of its Local Plan has been identified as a self-contained housing market area.
3 It will be important to identify the purpose of the analysis now and how it can be used in the future to inform future Local Plan reviews. It is important
that the analysis does not de-rail the current Local Plan progress which has been made to date in LCR.

51
4 Economic links between Bradford and Leeds are particularly strong driven by key transport connections.
5 Economic links between Bradford and Leeds are longer term issues.
6 Bradford hope to address commuting/out-commuting patterns to Leeds through economic investment particularly around Bradford and other
investment at Appleby Bridge which it is hoped will change current patterns. This will be supported by the provision of housing, predominantly
focused in and around Bradford.
7 Duty to Co-operate discussions have taken place with Leeds and to a lesser extent Kirklees and Calderdale (their plan process has been slower than
Bradford and Leeds). Accept that they will all meet their own housing needs, but when Local Plans need reviewing this work should be considered.
8 They view the work as predominantly useful for future Local Plan reviews as given where they are in this Local Plan process they would not want to
see progress halted. Bradford keen that the report from CURDS sets out what it is/what it isn’t and how it fits in with the current process.
9 Further studies may be useful but it would need to be particularly clear what the purpose of undertaking any work was.
York
1 Boundaries make sense and corroborate those identified in the recently updated SHMA for York.
2/3 SHMA identifies that the York market extends to Selby and East Riding. Strongest link is between York and Selby so the SHMA concentrated on this.
Relatively little change in the housing market boundaries of York
4 York/Selby links driven by the economic pull of York and the strategic transport links, these are long term drivers. York would like to extend their
economic role and importance and recognise there is the need to deliver housing alongside to support this. House prices a key issue which is also
a factor in the drive of people living elsewhere(Selby) and commuting into York.
6 Surrounding authorities would like York to become better at accompanying their own growth with housing development (i.e supplying a sufficient level
of housing which meets economic needs.) York would like to have households who live and work in York.
7 Current SHMA has been published and papers being taken to Members next week. Duty to Co-operate in place but difficult discussions yet to take
place about meeting housing needs.
8 This work will be referred to in York's plan-making process.
9 It may be that further more strategic studies are required, depending on how the devolution deals are shaped and this might inform future studies.

52
Annex 2 Consultation with Registered Providers
Places for People Location of office Sheffield
1 Please outline in which areas you have stock?
Leeds – City Centre, Harehills, Roundhay, Headingly, Guisley, Dewsbury, Bradford, Wakefield – including Castleford and Normanton, Huddersfield, Halifax,
York (managed by York City Council), Harrogate
2 Please compare the boundaries on the maps to your understanding of the markets in which you have stock?
To what extent/how/where do they differ? To what extent do market areas vary by housing demand?
The housing market areas for affordable rented accommodation is very different to the private sector rented/sale market due, largely a reflection of limited
alternative affordable accommodation in the area. P4P tenancies are relatively stable and tenants are generally long term. If people do move out they tend to
stay within the local neighbourhood due to ties and family links to the area.
The affordable rented housing market is more of a micro market, which makes it difficult to relate to the boundaries set out in Map 1. The main exception to
this is Halifax and Huddersfield. Whilst the M62 is a natural dividing line between the two settlements, P4P have noticed a trend of people moving between
the two areas and possibly could form a single HMA. Within the Leeds LT HMA, there is a concentration of affordable housing stock in a circle around Leeds
city centre extending to Headingly to the North and Morley to the South, Pudsey to the West and Garforth to the East which could form a LT HMA.
3 Over the past five years have the markets for your stock changed?
If so, what has changed? What have been the key drivers of change?
No real change over the past 5 years and no new schemes coming to the market.
4 In the future, do you expect to see changes in relation to the geography of demand? If so what do you think will be the key drivers of change?
Much of P4P focus over the next 5 years is going to be on developing schemes for older people and the main target areas for new schemes are Leeds and
Calderdale. Discussions are currently being held with Leeds City Council regarding development of new sites and a number of older people (age 55+) in
Leeds City Centre. Bradford is not a target area in respect of new sites, although there are plans to demolish existing schemes and rebuild in problem areas,
including Todmorden and Hebden Bridge. Calderdale in general has been identified as an area for investment. The organisation already has stock in the
area and has identified sites in some nice locations for development. Development for affordable rent will only take place where P4P is working alongside
the local authority. Shared ownership schemes, which are being pushed more and more by central government, will be much more market driven. Future
plans are unlikely to have any real impact on HMAs and little change is anticipated in respect of geographic patterns of demand. Younger people will
increasingly look at shared ownership as a means of getting onto the property ladder. The Shared Ownership and Affordable Homes Programme 2016-2021
Prospectus, which was released by HCA on 13 April 2016, includes no grant provision for affordable rented housing. The focus of the programme is on
helping people onto the property ladder through shared ownership, rent to buy and schemes for older people
53
Accent Group Location of office Shipley
1 Please outline in which areas you have stock?
Leeds – N/NW Leeds, South Leeds (Morley, Pudsey, Bramley), Kirklees (Huddersfield), Halifax, Wakefield, Bradford, Harrogate (town), Ripon,
Boroughbridge, York
Bradford is where Accent Group started and the organisation now has around 1,800 properties in Bradford. The stock includes older city centre properties,
older person developments and new build estates in the surrounding areas.
2 Please compare the boundaries on the maps to your understanding of the markets in which you have stock?
To what extent/how/where do they differ? To what extent do market areas vary by housing demand?
The Leeds LT HMA could potentially be split into a number of sub areas:
Leeds inner city
Outer ring comprising places like Pudsey, Morley, Garforth, some of which are semi-rural
South Leeds
N/NW leeds
Bradford/Craven split into 4 LT HMA rather than 2:
Bradford City Centre
Ilkley should be part of N/NW Leeds (see above) or Harrogate LT HMA
Keighley
The rest of the Bradford Strategic HMA should form a fourth LT HMA
3 Over the past five years have the markets for your stock changed?
If so, what has changed? What have been the key drivers of change?
Geographically markets have not really changed, but the type of properties and tenure have changed. In Leeds there has been development of 1 and 2
bedroom apartments to support independent living and increasing development of shared ownership accommodation (likely to comprise 90% of new
developments moving forward).
Bradford has seen a wave of eastern European migrants in the area many of whom have moved into housing schemes that Accent Group were considering
from demolition and rebuild.
Harrrogate has seen a lot of section 106 development for social rent and shared ownership. Properties have been developed for local people but have
attracted interest from people living in N/NW Leeds.
54
4 In the future, do you expect to see changes in relation to the geography of demand? If so what do you think will be the key drivers of change?
Leeds is perhaps the only area which could potentially see a change in the geographic pattern of demand. In Leeds, the City Council has approved 1,600
housing plots at a recent council meeting. The authority is pushing for housing growth to meet the current shortfall in supply, although it is anticipated that
some of these developments will attracted people from other parts of the City Region (Harrogate, York) and from outside the city region as Leeds builds on
its status as the region’s economic driver.
Changes to housing benefit in the future could have a profound effect on demand for single person one bedroom flats and see a churn of stock. From
October, housing benefit for single people under 35 will no longer cover the rent for a one bedroom flat. Instead it will be based on the shared
accommodation rate for renting a single room in a shared house. This will be a particular issue in Bradford where there is a concentration of above two
storey developments housing single person flats. It is anticipated that many tenants of these developments will move a rent a single room in a multi-tenanted
property from a private landlord.
Harrogate council does not own a lot of land and has lost 2/3 of its stock of council housing under the RTB scheme. The council uses section 106 powers to
increase the amount of social/affordable housing in the area, which is allocated to the 12 housing associations operating in the area on a rota basis.
.
In Communities Location of office Bradford
1 Please outline in which areas you have stock?
Bradford, Wakefield, Huddersfield
2 Please compare the boundaries on the maps to your understanding of the markets in which you have stock?
To what extent/how/where do they differ? To what extent do market areas vary by housing demand?
Strategic Housing Market Areas:
There is a huge amount of commuting between Bradford and Leeds supported by excellent rail links. There is a strong case for the whole of the Bradford
Metropolitan District to be part of the Leeds SHMA.
Ilkley should be part the Leeds SHMA, again due to excellent rail links via the Wharfedale line which connects Ilkley to Leeds via Burley in Wharfedale and
Guisley.
Lower Tier Housing Market Areas:
There are four different operating markets in Bradford:
Inner urban core which is home to the Asian community in Bradford and includes a large proportion of the In Communities housing stock.
Airedale (Shipley, Bingley, Keighley, Skipton)
Wharfedale (Ilkley, Burley, Grassington and up into the Dales)
The Villages – a scattering of small villages each with their own housing markets!

55
3 Over the past five years have the markets for your stock changed?
If so, what has changed? What have been the key drivers of change?
Market changes have been more about property type and tenure than geographically over the past 5 years. In Communities is actively working with private
sector house builders to increase housing stock across a range of tenure in the Bradford area. This includes houses for sale but with some section 106
provision for rent. The objective is to create mixed income and mixed tenure estates in the area. In Communities has built over 600 houses themselves over
the last 10 years. These have been mostly family homes to complement to large stock of flats and maisonettes they already own. Again, these have been for
sale, rent and shared ownership.
4 In the future, do you expect to see changes in relation to the geography of demand? If so what do you think will be the key drivers of change?
Looking forward, the objective of In Communities is to build the right properties in the right location. Welfare reforms changes are expected to have an
impact on the type and size of property, with increasing focus on developing smaller (mostly 2-bed) homes.
There will also be some 4 bed provision built in the inner city for the Asian Heritage community. Currently developing 60 four bed homes at Manningham –
an inner city location in Bradford which the private sector deemed to be too risky. So far In Communities have received 6,000 enquiries for the properties on
a sale and rental basis.
It is also anticipated that continued regeneration of the Bradford area will lead to a changing demographic in the area with different housing needs.
Riverside Group Location of office Liverpool
1 Please outline in which areas you have stock?
Leeds (16 properties). Located on the edge of the city centre (Harehills), inherited from English Churches Housing Group.
Wakefield (150 properties) – across three locations.
Gibson Close, a new development comprising 28 properties located just outside Wakefield city centre. A third of properties have been let to Eastern
Europeans through the Council lettings system (the majority have come from Wakefield and Pontefract and a small number from Leeds);
Cribblestone, which is a rural location and comprises former coal board houses in 5 terraces;
30 flats in Ossett;
Keighley – post war properties for the elderly.
2 Please compare the boundaries on the maps to your understanding of the markets in which you have stock?
To what extent/how/where do they differ? To what extent do market areas vary by housing demand?
Demand for stock is a generally a local demand and does not relate closely to the HMAs in map 1 due to the dynamics of the social and affordable housing
market. Cribblestone is off the beaten track and would not be considered by people who are not already from the area. The Polish migrants that have taken
56
properties at Gibson Close were generally employed and living locally in private tenanted properties. Demand for the flats in Ossett has been high and from
a little further afield due to a low supply of single bed flats in the Wakefield Metropolitan District area.
In Leeds, demand for housing in Harehills is generally from within a 2 mile radius.
3 Over the past five years have the markets for your stock changed?
If so, what has changed? What have been the key drivers of change?
No change
4 In the future, do you expect to see changes in relation to the geography of demand? If so what do you think will be the key drivers of change?
Demand for social and affordable housing is driven by supply and opportunities for the development of new stock are expected to be limited in parts of the
LCR due to prices and rents that can be achieved.
Wakefield had been identified as a possible growth area for the future but achievable rents are lower than in other locations outside the LCR. For example,
an affordable 4 bedroom house in Wakefield will command a rent of around £100 pw but the same property in Cheshire East will achieve £150 pw and is
therefore seen as a better investment.
Brownfield former coal board sites in attractive semi-rural locations around Wakefield have been identified for development, but the achievable social rents
for section 106 properties in these areas are still too low for them to be economically viable.
Yorkshire Housing Location of office Leeds
1 Please outline in which areas you have stock?
Leeds 2200 units; Wakefield 1000 units; Bradford 2200 units; Huddersfield 1100 units; Calderdale 1,000 units
2 Please compare the boundaries on the maps to your understanding of the markets in which you have stock?
To what extent/how/where do they differ? To what extent do market areas vary by housing demand?
Strategic HMAs
Anecdotal evidence suggests that people from Barnsley are travelling into Leeds for work due to the M1, as well as to Sheffield and Doncaster
Bradford - there are fewer available jobs in Bradford so strong commuting links for Leeds. More to do with opportunities and the economic pull of Leeds than
to do with transport between the two cities.
Grey area around Ilkley which is within the commuter belt for both Leeds and Bradford via the Wharfedale line
Excellent train services between Leeds and York, which pulls some of the villages to the West of York into the Leeds TTWA.
Huddersfield and Halifax are pulled by both Leeds and Manchester due to transport links (M62/rail)
57
Local HMAs
Dynamic of social housing market is very different to the mainstream housing rental and selling markets. This makes it very difficult to compare demand for
their own stock with the boundaries set out in Map 1.
Yorkshire Housing tenants are typical social housing tenants – they are generally unemployed or in low paid jobs working close to where they live. Based on
work undertaken by Yorkshire housing in the last 2 years, tenants that move tend to either move a few streets away for a better house or neighbourhood or
move further for health or family reasons and commitments.
3 Over the past five years have the markets for your stock changed?
If so, what has changed? What have been the key drivers of change?
Over the past 5 years there has not been much change in demand for stock, although organisationally they have changed following the transfer in of housing
stock from Craven Council.
4 In the future, do you expect to see changes in relation to the geography of demand? If so what do you think will be the key drivers of change?
Previously Yorkshire Housing has been opportunistic and developed in locations all over the City Region. However, demand for housing in rural locations
has been weak as typical social housing tenants can’t afford to live out of town without a car and employment. Future developments will focus on urban
areas with good infrastructure where there is evidence of latent/existing demand.
Not sure how the geography of demand might change in the long term, but any decisions on future developments will be driven by evidence of demand.
Leeds Federated Location of office Leeds
1 Please outline in which areas you have stock?
Currently 4,000 homes, 85% of which are in Leeds, 10% in North Yorkshire (Harrogate, Knaresborough, Ripon) and 5% in Wakefield (Wakefield, Castleford).
2 Please compare the boundaries on the maps to your understanding of the markets in which you have stock?
To what extent/how/where do they differ? To what extent do market areas vary by housing demand?
Market for housing stock is a very local market. Within Leeds, the majority of tenants that occupy stock in SW Leeds are born and bred in the area and have
typically found a residence close to their parents and extended family. There is some evidence of movement across Leeds so the area specified on the Map
1 is probably ok.
Evidence of movement of tenants between developments in Harrogate and Ripon.
The Wakefield market is probably the “most local” with the Leeds Federated stock, but fits within the Local HMA specified on the map.
Demand for stock is very strong across all areas, both for rented and shared ownership accommodation. Rent accommodation is re-let very quick when it
becomes vacant, reflecting the quality of Leeds Federated stock. For shared ownership, when schemes are appraised it is assumed that 25% of stock will
58
sell within 13 weeks. Shared ownership schemes, the majority of which are through section 106 agreements with housing developers, tend to be located in
“better lower risk” areas. In contrast, developments wholly funded by Leeds Federated tend to be in poorer areas and will all be for social rent.
The new prospectus published by HCA in April 2016 has shifted the focus away from social housing for rent to shared ownership and rent to buy properties.
Possible future issues in obtaining mortgages for shared ownership properties.
3 Over the past five years have the markets for your stock changed?
If so, what has changed? What have been the key drivers of change?
Demand for stock has strengthened over the past 5 years. Demand for rented stock has risen following an extensive investment programme to improve the
family housing offer. Demand for shared ownership properties is also rising.
In contrast, studios/apartments designed for older residents (55+) are a bit more difficult to let as older people’s requirements are different from what they
were 5-10 years ago. It is hoped that re-configuring and modernising these units will help to improve their appeal.
Leeds Federated have not developed in new areas over the past five years and instead have focused on established social rent areas and
improved/extended the offer in these locations.
4 In the future, do you expect to see changes in relation to the geography of demand? If so what do you think will be the key drivers of change?
Leeds Federated have not developed in new areas over the past five years and instead have focused on established social rent areas and
improved/extended the offer in these locations. Moving forward, however, the organisation is looking to expand its coverage into other parts of the Leeds
City Region, including Bradford, York, Selby and Barnsley. They will embrace Government investment in housing for sale products (shared ownership,
discounted sale) and any profits will be used to invest in affordable home for rent.
Currently looking for site opportunities in Bradford, York, Selby and Barnsley and assessing potential demand for premises as part of risk assessment. Also
looking to identify builders for section 106 opportunities in these areas as well as opportunities for them to develop themselves. There is a concern, however,
that in the future housing developers may side step housing associations and so their own affordable housing provision.
Home Group Location of office Leeds
1 Please outline in which areas you have stock?
North Yorkshire: Craven, Harrogate, York, Selby West Yorkshire: Leeds, Bradford, Calderdale, Kirklees
2 Please compare the boundaries on the maps to your understanding of the markets in which you have stock?
To what extent/how/where do they differ? To what extent do market areas vary by housing demand?
From a local knowledge perspective, the housing market areas set out in Map 1 would appear to be a fair reflection for general housing sales and lettings.
However, all lettings of social housing stock owned by the Home Group in the LCR is undertaken by local authorities, including North Yorkshire Home

59
Choice (which represents all of the North Yorkshire Council’s) and the individual council areas in West Yorkshire. They all operate a choice based lettings
systems where applicants bid for properties and are awarded a tenancy based on banding and choice. However, preference is given to people from the local
areas. Home Group has little affordable sale stock at the moment other than a handful of units in Leeds and is unable to give a definitive answer regarding
the catchment area for sales and enquiries.
3 Over the past five years have the markets for your stock changed?
If so, what has changed? What have been the key drivers of change?
Development of social housing for rent is driven by local authority Strategic Housing Market Assessments (SHMAs). The SHMAs identify areas where there
is mismatch between demand and supply of social housing and Home Group identify suitable sites in the right location to meet latent demand.
4 In the future, do you expect to see changes in relation to the geography of demand? If so what do you think will be the key drivers of change?
Development of affordable housing for rent will continue to be driven by SHMAs and sites selected in conjunction with the local authorities. Decisions relating
to affordable housing for sale, however, will be much more market driven and focused on established areas with lower overall risk. Developments of
affordable housing for sale will include some section 106 provision, but ultimately any profits will be used to support future development of affordable housing
for rent to replace the grants previously provided through HCA, whose focus is now on shared ownership and rent to buy.

60
Annex 3 Consultation with Developers & Agents
BARRETT HOMES & DAVID WILSON HOMES YORKSHIRE WEST (LEEDS)
1a) In what areas of the Leeds City Region do you build/sell homes?
1b) What areas do clients/buyers come from?
Leeds, Wakefield, Pontefract
Within the Leeds City Region, the main area of focus is upon Leeds and Wakefield, with greater emphasis on the latter over the past couple of years. A lot of
people can’t afford to live in Leeds or in the immediate area around the city and have relocated into neighbouring Wakefield. This has included first time
buyers and other people of non-retirement age that commute back into Leeds for work. The upgrade to the M1, with additional lanes between Leeds and
Wakefield, together with a decent rail line on the ECM, has made commuting much easier. Pontefract has also benefited from some spill over from Leeds,
but not to the same extent as Wakefield and has witnessed a higher level of local demand.
2a) Referring to Map 1 in the summary report that was emailed to you, how do the HMA boundaries compare with your understanding of the
housing markets in which you build/sell property? Are there any obvious things wrong with the HMA boundaries in your opinion? Are there any
locations where the boundaries don’t makes sense?
Huddersfield and Halifax attract more people from Greater Manchester than from Leeds. It is easier for commuters to get into Manchester than Leeds from
these two locations
2b) To what extent do market areas vary by house type or other factors (e.g. location, prestige/executive/family homes, price)?
Housing development in Leeds, Wakefield and Pontefract has largely been typical semi detached and detached units around 1,400 sq ft, with some
executive style housing of up to 2,500 sq ft. Demand for all housing types is local, including the higher value properties, and are typically from Leeds due to
affordability/VfM factors and from within the immediate area. This type of housing is not attracting buyers from further afield.
3) Over the past five years has your market area changed? If so in what areas have been added/subtracted? What have been the key drivers of change
(e.g planning policy, land availability, improved transport connections, expanded TTWAs)?
There are land supply issues in Leeds and more available land around Wakefield. The restrained supply in Leeds is for political reasons, as the council does
not want to release greenfield land for development (even though it is allocated for housing in the Local Plan). The local authority has set a high housing unit
target (70,000 units) but is not prepared to release greenbelt land to help realise this target. This has resulted in house price inflation with new housing
developed in historically less affluent areas achieving excellent revenues (e,g, Morley). Wakefield is therefore supporting the affordable housing demand of
Leeds residents, which is not sustainable in the long term

61
4) Considering longer term trends, over the past 15 years has your market area changed?
a. If so in what areas have been added/subtracted? b. What have been the key drivers of change?
10 Years ago, housing land supply in Leeds was healthy, but over time has been depleted as new schemes have been developed.
5) In to the future, do you expect to see changes to the current market area?
a. If so in what areas will be added/subtracted?
b. What will be the key drivers of change? How certain are you regarding the likelihood of these drivers/changes occurring?
The situation in Leeds needs to be resolved quickly. It will take 2-3 years for the Sites Allocation Plan to be in place to release greenfield sites. There needs
to be some sort of interim arrangement put in place to release some of the pressure short term. Once the Sites Allocation Plan is in place, development will
shift back towards Leeds, particularly the outer fringes with a semi-rural feel (Morley, Motley, Oulton, Rothwell, Garforth)
6) Where (if anywhere) do you think that local authorities should be jointly planning for housing across administrative boundaries? (which local
authority areas and why? This can include within the LCR and between the LCR and other CR/Counties. )
Housing development in some of the local authorities in the LCR is highly constrained due to land topography and flood risk. Calderdale in particular cant
meet its own housing needs and therefore needs to be planning with neighbouring authorities.
7) What sort of activities should they be working jointly on e.g. coordinating land release, joint infrastructure investment etc. Does this vary
between boundaries?
All of the planning authorities in the Leeds City Region are a different stages with their local plans which is likely to make effective coordination of housing
development very difficult. Could do with the RSS approach for the region being re-instated as this was an effective means of co-ordinating activities
between areas.
DUCHY HOMES (LEEDS)
1a) In what areas of the Leeds City Region do you build/sell homes?
1b) What areas do clients/buyers come from?
Duchy Homes is a different type of housebuilder to the typical national companies, In the Yorkshire area, its business strategy is to develop around 25
executive houses per annum on developments with small number of plots. They only target very good areas or lesser areas on very good sites, assessed
using independent assessments by two of the directors.
Within the Leeds City Region, the main areas they focus on are Leeds and Barnsley. They are currently building out a site at Thorpe Park Business Park in
Leeds – a 14 plot development for which they received more than 100 enquiries before construction work even started. Interest levels dropped to around 60
when prices were increased, the majority being from the local area in Leeds. 10 of the 14 sold, the remaining 4 will be completed before the end of the year

62
2a) Referring to Map 1 in the summary report that was emailed to you, how do the HMA boundaries compare with your understanding of the
housing markets in which you build/sell property? Are there any obvious things wrong with the HMA boundaries in your opinion? Are there any
locations where the boundaries don’t makes sense?
Don’t really have a feel for housing market areas. The business identifies good sites and undertake market testing to ensure that developed will be financially
feasible without much thought about where enquiries are coming from or the catchment area.
2b) To what extent do market areas vary by house type or other factors (e.g. location, prestige/executive/family homes, price)?
3) Over the past five years has your market area changed?
If so in what areas have been added/subtracted? What have been the key drivers of change (e.g planning policy, land availability, improved transport
connections, expanded TTWAs)?
Minimum housing densities has limited the potential of a number of sites for executive housing developments (minimum densities were introduced under
PP3). Requirements for minimum densities were removed by coalition government shortly after coming to power which has opened the market up again.
4) Considering longer term trends, over the past 15 years has your market area changed?
a. If so in what areas have been added/subtracted?
b. What have been the key drivers of change?
5) In to the future, do you expect to see changes to the current market area?
a. If so in what areas will be added/subtracted?
b. What will be the key drivers of change? How certain are you regarding the likelihood of these drivers/changes occurring?
Affordable housing requirements may be introduced for all housing sites under central government changes which are expected to be implemented in the
very near future. This will prevent some sites being developed for prestige executive housing if they are required to include affordable housing irrespective of
housing numbers in the development. Some authorities in the Leeds City Region will apply this requirement to the letter, other will hopefully be more flexible.
6) Where (if anywhere) do you think that local authorities should be jointly planning for housing across administrative boundaries? (which local
authority areas and why? This can include within the LCR and between the LCR and other CR/Counties. )
Not relevant for small scale executive housing developments?.
7) What sort of activities should they be working jointly on e.g. coordinating land release, joint infrastructure investment etc. Does this vary
between boundaries?
n/a
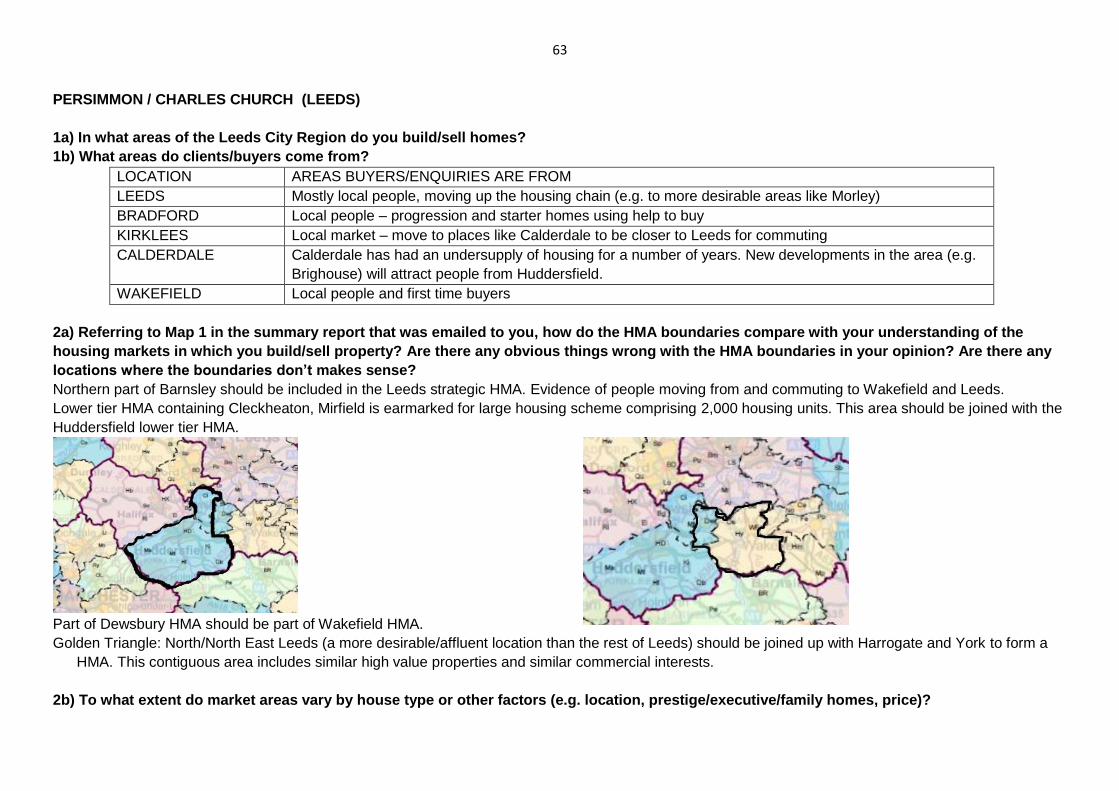
63
PERSIMMON / CHARLES CHURCH (LEEDS)
1a) In what areas of the Leeds City Region do you build/sell homes?
1b) What areas do clients/buyers come from?
A) LOCATION B) AREAS BUYERS/ENQUIRIES ARE FROM
LEEDS Mostly local people, moving up the housing chain (e.g. to more desirable areas like Morley)
BRADFORD Local people – progression and starter homes using help to buy
KIRKLEES Local market – move to places like Calderdale to be closer to Leeds for commuting
CALDERDALE Calderdale has had an undersupply of housing for a number of years. New developments in the area (e.g.
Brighouse) will attract people from Huddersfield.
WAKEFIELD Local people and first time buyers
2a) Referring to Map 1 in the summary report that was emailed to you, how do the HMA boundaries compare with your understanding of the
housing markets in which you build/sell property? Are there any obvious things wrong with the HMA boundaries in your opinion? Are there any
locations where the boundaries don’t makes sense?
Northern part of Barnsley should be included in the Leeds strategic HMA. Evidence of people moving from and commuting to Wakefield and Leeds.
Lower tier HMA containing Cleckheaton, Mirfield is earmarked for large housing scheme comprising 2,000 housing units. This area should be joined with the
Huddersfield lower tier HMA.
Part of Dewsbury HMA should be part of Wakefield HMA.
Golden Triangle: North/North East Leeds (a more desirable/affluent location than the rest of Leeds) should be joined up with Harrogate and York to form a
HMA. This contiguous area includes similar high value properties and similar commercial interests.
2b) To what extent do market areas vary by house type or other factors (e.g. location, prestige/executive/family homes, price)?

64
3) Over the past five years has your market area changed?
If so in what areas have been added/subtracted? What have been the key drivers of change (e.g planning policy, land availability, improved transport
connections, expanded TTWAs)?
Target areas have included Morley, which has seen a lot of investment in housing. It is close to Leeds and you get a lot more house for your money.
Wakefield has seen a hive of activity, attracting people from Leeds seeking value for money and an easy commute into Leeds due to upgraded M1/M62 and
excellent rail links.
4) Considering longer term trends, over the past 15 years has your market area changed?
a. If so in what areas have been added/subtracted?
b. What have been the key drivers of change?
Over the past 10 to 15 years, housing market areas have been effected limited housing land supply and rising demand. This has resulted in development in
areas that previously would not have been considered (e.g. old commercial/NHS sites) becoming attractive propositions due to greenbelt restrictions,
particularly in Leeds.
5) In to the future, do you expect to see changes to the current market area?
a. If so in what areas will be added/subtracted?
b. What will be the key drivers of change? How certain are you regarding the likelihood of these drivers/changes occurring?
Once local plans are ratified (especially in Leeds and Kirklees), housing market areas may need to be revisited. Leeds City has effectively been “closed for
business” and even proposals for development on allocated sites has been turned town. Many of these have gone to appeal and Leeds City Council has lost
all of them. New sites are expected to come forward soon in Garforth, Wetherby and Morley. This might help to stem the flow of people from Leeds to
outlying areas for more affordable and value for money housing
6) Where (if anywhere) do you think that local authorities should be jointly planning for housing across administrative boundaries? (which local
authority areas and why? This can include within the LCR and between the LCR and other CR/Counties. )
Kirklees and Calderdale Leeds and Bradford Leeds and Wakefield
7) What sort of activities should they be working jointly on e.g. coordinating land release, joint infrastructure investment etc. Does this vary
between boundaries?
Leeds and Bradford in particular need to take stock of what land they own and where it is located. There have been recent example of sites owned by Leeds
City Council that are located in Bradford and vice versa that the two authorities did not even know they owned.
Some developments (e.g. Garforth) will see a lot of new housing units coming forward which will attract interest from people working in leeds and Wakefield
that will place additional pressure on road infrastructure.

65
TAYLOR WIMPEY (WAKEFIELD)
1a) In what areas of the Leeds City Region do you build/sell homes?
1b) What areas do clients/buyers come from?
Leeds (primary), Wakefield (primary), Kirklees (primary), Calderdale (secondary), Bradford (secondary)
2a) Referring to Map 1 in the summary report that was emailed to you, how do the HMA boundaries compare with your understanding of the
housing markets in which you build/sell property? Are there any obvious things wrong with the HMA boundaries in your opinion? Are there any
locations where the boundaries don’t makes sense?
Ilkley, Menston and Burley in Wharfdale are part of the commuter belt to Leeds rather than Bradford
The South East Leeds HMA is a bit of an anomaly. Garforth, for example, is similar to Guisley and Pudsey in terms of housing stock, although perhaps with
a more semi-rural feel.
North/North East Leeds is very different market to other part of Leeds – more affluent, better quality housing stock and people will only move within this area.
Possibly a separate housing market area for inner city areas of Leeds including Beeston, Hunslet and Harehills. Less affluent areas of Leeds with lower
quality housing stock and typically areas of deprivation.
2b) To what extent do market areas vary by house type or other factors (e.g. location, prestige/executive/family homes, price)?
3) Over the past five years has your market area changed?
If so in what areas have been added/subtracted? What have been the key drivers of change (e.g planning policy, land availability, improved transport
connections, expanded TTWAs)?
Not really. The company is looking at different areas than it was 5 years ago but that reflects a change in the businesses land strategy.
4) Considering longer term trends, over the past 15 years has your market area changed?
a. If so in what areas have been added/subtracted?
b. What have been the key drivers of change?
DK – before his time
5) In to the future, do you expect to see changes to the current market area?
a. If so in what areas will be added/subtracted?
b. What will be the key drivers of change? How certain are you regarding the likelihood of these drivers/changes occurring?
Local Plan in Leeds will see new large allocations that will result in new developments in:

66
the city centre and inner city areas.
North East Leeds. Proposed allocation for 3000 new homes at Bramham has been withdrawn from the allocation process by the University which therefore
needs replacing
East Leeds extension
6) Where (if anywhere) do you think that local authorities should be jointly planning for housing across administrative boundaries? (which local
authority areas and why? This can include within the LCR and between the LCR and other CR/Counties. )
Developments proposed for North/North East Leeds are close to the Selby boundary
Outer North East is close proximity to Wetherby and Harrogate
Leeds and Bradford
7) What sort of activities should they be working jointly on e.g. coordinating land release, joint infrastructure investment etc. Does this vary
between boundaries?
A lot of housing sites around Leeds are in the greenbelt and also cross over boundaries into neighbouring authorities. There is a need for a coordinated site
allocation and site release within the greenbelt areas. As councils have to identify an adequate housing supply moving forward, there is some merit in the
above mentioned authorities undertaking a greenbelt review to jointly identify possible sites.
SANDERSON WEATHERALL (LEEDS)
1a) In what areas of the Leeds City Region do you build/sell homes?
1b) What areas do clients/buyers come from?
Bespoke residential estate agency services operating from a single office in Leeds
2a) Referring to Map 1 in the summary report that was emailed to you, how do the HMA boundaries compare with your understanding of the
housing markets in which you build/sell property? Are there any obvious things wrong with the HMA boundaries in your opinion? Are there any
locations where the boundaries don’t makes sense?
North/North East Leeds is a separate HMA – highest value properties in the whole of west Yorkshire and has close links to Harrogate and York as part of the
Golden Triangle. Together, these areas have been recognised as an informal housing market area for some time. The three locations are similar areas both
in terms of house value, type of properties and commercial activities.
The HMA to the south east of Leeds is arbitrary and should be part of the west Leeds corridor.

67
Wakefield stands on its own as a HMA. It is well served by the motorway network via the M1/M62 cross over and excellent train services to Leeds and
London. Wakefield is not an overspill area for Leeds – a lot of people have chosen to move their because it is an up and coming area with a buoyant
commercial sector, particularly along the M62 corridor between Wakefield and Pontefract.
2b) To what extent do market areas vary by house type or other factors (e.g. location, prestige/executive/family homes, price)?
3) Over the past five years has your market area changed?
a) If so in what areas have been added/subtracted? What have been the key drivers of change (e.g planning policy, land availability, improved transport
connections, expanded TTWAs)?
HMA have remained relatively unchanged. This in part reflects a desire amongst families to extend their existing property rather than relocate. Particularly if
they are in a nice area with good schools.
4) Considering longer term trends, over the past 15 years has your market area changed?
a. If so in what areas have been added/subtracted?
b. What have been the key drivers of change?
No change.
5) In to the future, do you expect to see changes to the current market area?
a. If so in what areas will be added/subtracted?
b. What will be the key drivers of change? How certain are you regarding the likelihood of these drivers/changes occurring?
Changes to the East area of Leeds where additional housing land is to be made available as the City Council relaxes its approach to releasing land following
defeat is a number of high profile planning appeals. Release of land in East and North Leeds will create new sustainable settlements and the majority of new
residents will be from outside of the area so wont effect the HMA too much.
6) Where (if anywhere) do you think that local authorities should be jointly planning for housing across administrative boundaries? (which local
authority areas and why? This can include within the LCR and between the LCR and other CR/Counties. )
Quirky areas between Leeds and Bradford that require joined up thinking including Guisley, Yeadon, Menston and Burley in Wharfdale. There is
considerable cross over between the two strategic HMAs and between planning authorities which can lead to inconsistencies in planning decisions
7) What sort of activities should they be working jointly on e.g. coordinating land release, joint infrastructure investment etc. Does this vary
between boundaries?
There is a need for better understanding of housing policies in neighbouring areas and for decisions to be coordinated better across the geographic areas
outlined in 6 above.
68
WSB PROPERTY (LEEDS)
1a) In what areas of the Leeds City Region do you build/sell homes?
1b) What areas do clients/buyers come from?
WSB is an independent multi-disciplined commercial property consultancy based in Leeds serving clients with property interests throughout Yorkshire and
the North of England.
2a) Referring to Map 1 in the summary report that was emailed to you, how do the HMA boundaries compare with your understanding of the
housing markets in which you build/sell property? Are there any obvious things wrong with the HMA boundaries in your opinion? Are there any
locations where the boundaries don’t makes sense?
Include Ilkley and Addingham in the Leeds strategic HMA. Although both are in the Bradford council area, they have a Leeds postcode, are linked to Leeds
via a rail link through Guisley and are essentially a Leeds suburb. They also have strong links with Harrogate.
Move the northern boundary of the Leeds lower tier HMA above Harrogate
Split the Leeds lower tier HMA into three areas
Combine North East segment of the Leeds LTHMA with the extended area above Harrogate (re: previous bullet)
Combine North Leeds (Guiseley down to Pudsey) with Ilkley
Southern section, which includes a high concentration of social housing.
Halifax and Huddersfield are within the Leeds SHMA, but also have strong ties with Manchester due to the M62 and good rail links/services. Essentially
shared between the Leeds and Manchester TTWAs.
2b) To what extent do market areas vary by house type or other factors (e.g. location, prestige/executive/family homes, price)?
3) Over the past five years has your market area changed?
If so in what areas have been added/subtracted?
What have been the key drivers of change (e.g planning policy, land availability, improved transport connections, expanded TTWAs)?
No real change in the last 5 years. The more desirable areas have become stronger, which is reflected in house prices, but has not had any noticeable
impact on the housing market areas illustrated in Map 1
4) Considering longer term trends, over the past 15 years has your market area changed?
If so in what areas have been added/subtracted?
What have been the key drivers of change?
Improvements to the A1 have extended the TTWA for Leeds and facilitated house development in Halton, Garforth and Colton.

69
5) In to the future, do you expect to see changes to the current market area?
If so in what areas will be added/subtracted? What will be the key drivers of change? How certain are you regarding the likelihood of these drivers/changes
occurring?
The four development sites which make up the Aire Valley enterprise zone, located along the route of the East Leeds Link Road which links Leeds city
centre to the M1 motorway. The enterprise zone is forecast to deliver new jobs in the area and act as a catalyst for further development within the wider Aire
Valley, including housing development. Castleford and Pontefract are expected to see large number of housing units being developed on brownfield sites
including former open cast mining sites. Not sure how these will impact on the defined housing market areas.
6) Where (if anywhere) do you think that local authorities should be jointly planning for housing across administrative boundaries? (which local
authority areas and why? This can include within the LCR and between the LCR and other CR/Counties. )
Leeds and Bradford need much closer working relationship. However, the Bradford authority lacks foresight and needs to look to Leeds for guidance
7) What sort of activities should they be working jointly on e.g. coordinating land release, joint infrastructure investment etc. Does this vary
between boundaries?
Infrastructure needs to be better coordinated to facilitate traffic flow and commuting times. Leeds council has made improvements to infrastructure within its
own boundary but would not be able to extend improvements into Bradford due to political tensions between the two authorities.
MILLER HOMES (WAKEFIELD)
1a) In what areas of the Leeds City Region do you build/sell homes? 1b) What areas do clients/buyers come from?
Miller Homes is currently active in Leeds, Kirklees, Bradford, Wakefield and Harrogate. 95% of house buyers/enquiries come from within the same postcode
sector of a new housing development or from an adjacent area. The majority are therefore local buyers. This can vary by location and type of property, with
people seemingly prepared to move further for a more executive home in a semi rural location that a 2/3 bed semi close to chimney pots.
2a) Referring to Map 1 in the summary report that was emailed to you, how do the HMA boundaries compare with your understanding of the
housing markets in which you build/sell property? Are there any obvious things wrong with the HMA boundaries in your opinion? Are there any
locations where the boundaries don’t makes sense?
Small amendments to the lower tier HMAs recommended:
Area comprising Hemsworth, Pontefract, Featherstone should be part of the same local HMA as Wakefield
Rothwell, Crossgates should fall within the Leeds LTHMA rather than in their own HMA
Strategic HMA amendments:
Bradford should not be a SHMA. Rather it should be a LTHMA within the Leeds SHMA as the predominant economic driver in the City Region.

70
Hebdon Bridge in Halifax sits within the Leeds SHMA but has closer economic ties with Bradford.
The Selby area within the York SHMA should be within the Leeds SHMA. Miller are currently looking at sites in this area and expect any development to
attract Leeds commuters due to the good rail links that exist between Selby and Leeds.
2b) To what extent do market areas vary by house type or other factors (e.g. location, prestige/executive/family homes, price)?
See 1b
3) Over the past five years has your market area changed?
If so in what areas have been added/subtracted?
What have been the key drivers of change (e.g planning policy, land availability, improved transport connections, expanded TTWAs)?
The main change in the last 5 years has been the improved strength of the Leeds City Centre market, which has drawn in affluent people from surrounding
areas and young professionals looking for a city centre lifestyle. The availability of high quality premises to buy or rent in the centre and a strong retail offer
has added to the draw of the city centre.
4) Considering longer term trends, over the past 15 years has your market area changed?
If so in what areas have been added/subtracted?
What have been the key drivers of change?
Boundaries of the HMAs have not really changed over the period. Some areas have strengthened and others weakened. Perhaps the exception is Harrogate
where the market has captured an increasing number of Leeds commuters due to the low levels of house building within Leeds in recent years.
5) In to the future, do you expect to see changes to the current market area?
If so in what areas will be added/subtracted?
What will be the key drivers of change? How certain are you regarding the likelihood of these drivers/changes occurring?
Over the next 5-10 years Leeds will become stronger and the position with Harrogate referred to in 4 above will be reversed. More commuters will be
seeking family homes in Leeds rather than in Harrogate and Wakefield.
6) Where (if anywhere) do you think that local authorities should be jointly planning for housing across administrative boundaries? (which local
authority areas and why? This can include within the LCR and between the LCR and other CR/Counties.
Greater coordination is needed across all areas within the city region. The biggest problem at the moment however is that Leeds City Council seemingly do
not want or expect to meet all of their housing needs themselves. Their main focus is on brownfield sites within the city centre and they are concerned that
the release of land in the suburbs will see a shift in onus from the city centre to surrounding areas.
7) What sort of activities should they be working jointly on e.g. coordinating land release, joint infrastructure investment etc. Does this vary
between boundaries?
Joint working will hopefully help to coordinate land release and provide a joined up approach to meeting the housing needs across the whole of the city
region and not rely on neighbouring authorities to meet housing needs.

71
CUSHMAN & WAKFIELD (LEEDS)
1a) In what areas of the Leeds City Region do you build/sell homes? 1b) What areas do clients/buyers come from?
Cushman and Wakefield office in Leeds covers the residential market across the whole of the Yorkshire region, Derbyshire and the Pennines.
2a) Referring to Map 1 in the summary report that was emailed to you, how do the HMA boundaries compare with your understanding of the
housing markets in which you build/sell property? Are there any obvious things wrong with the HMA boundaries in your opinion? Are there any
locations where the boundaries don’t makes sense?
Strategic HMAs
The Bradford SHMA / TTWA should not extend up into the Dales beyond Skipton. Further north than that, the number of people commuting into Bradford will
be very small.
Question whether all or part of the York SHMA should in fact be part of the Leeds SHMA due to its economic prominence within the city region
North east Huddersfield will pull to Leeds but big sections of Huddersfield and Halifax could equally be part of Manchester TTWA due to good transport links
via M62 and rail network.
Lower Tier HMAs
The Leeds LTHMA needs to be split into three sections – a North East section, North/North West above Pudsey and a Southern section. People from the
North East section are typically affluent and will not move to the North West or Southern section; people living in the North/North West aspire to move to
the North east, but inevitably wont; and the southern section is typically lower cost, lower quality stock with a high proportion of social housing.
2b) To what extent do market areas vary by house type or other factors (e.g. location, prestige/executive/family homes, price)?
3) Over the past five years has your market area changed?
If so in what areas have been added/subtracted?
What have been the key drivers of change (e.g planning policy, land availability, improved transport connections, expanded TTWAs)?
No change
4) Considering longer term trends, over the past 15 years has your market area changed?
If so in what areas have been added/subtracted?
What have been the key drivers of change?
SHMA/TTWA have been extended over the period due to improvements to A1/M62/M1 which have shortened travelling times.

72
5) In to the future, do you expect to see changes to the current market area?
If so in what areas will be added/subtracted?
What will be the key drivers of change? How certain are you regarding the likelihood of these drivers/changes occurring?
Unlikely to have any impact on HMAs without considerable investment in infrastructure first
6) Where (if anywhere) do you think that local authorities should be jointly planning for housing across administrative boundaries? (which local
authority areas and why? This can include within the LCR and between the LCR and other CR/Counties. ).
All of the planning authorities should be working together more closely. This is particularly true for Leeds and Wakefield and Leeds and Harrogate. Wakefield
and Harrogate have been meeting part of the Leeds housing needs for some time and there is a need for greater joint working/collaboration in meeting
housing market allocations.
7) What sort of activities should they be working jointly on e.g. coordinating land release, joint infrastructure investment etc. Does this vary
between boundaries?
Recognition/understanding of where people work and provide housing in the best locations to meet the needs of residents. The local authorities need to
accept that they are not insular/self sufficient and that there is a demand for new housing on district boundaries, which may result in new settlements
requiring new infrastructure.
JONES LANG LASALLE (LEEDS)
1a) In what areas of the Leeds City Region do you build/sell homes? 1b) What areas do clients/buyers come from?
Jones Lang Lasalle operate a Leeds city centre residential estate agency covering the whole of the Leeds City Region. They also operate in a commercial
capacity, selling land to housebuilders. Leeds is their main focus for housing.
2a) Referring to Map 1 in the summary report that was emailed to you, how do the HMA boundaries compare with your understanding of the
housing markets in which you build/sell property? Are there any obvious things wrong with the HMA boundaries in your opinion? Are there any
locations where the boundaries don’t makes sense?
The Leeds LT HMA needs to be separated into a western strip and a north east section. The latter in particular is a more affluent area with higher quality
housing stock. People living there are unlikely to relocate to the city centre, for example.
The North East section of Leeds is also part of the “golden triangle” which takes in the area between York, Wetherby, Harrogate and Ripon. The area is
home to an number of attractive villages and market towns and improvements to the A1 have made them more accessible for commuters.
Area north of Harrogate which has no markings would appear to be a SHMA in its own right. Should it be part of the Leeds SHMA and Harrogate LT HMA?
2b) To what extent do market areas vary by house type or other factors (e.g. location, prestige/executive/family homes, price)?
73
3) Over the past five years has your market area changed? If so in what areas have been added/subtracted?
What have been the key drivers of change (e.g planning policy, land availability, improved transport connections, expanded TTWAs)?
Leeds City centre has strengthened in response to city centre living culture
4) Considering longer term trends, over the past 15 years has your market area changed?
If so in what areas have been added/subtracted?
What have been the key drivers of change?
Golden triangle area has extended in response to improved transport and accessibility for commuters into Leeds. Driven by upgrades to the A1 north of
Ferrybridge, more “commuter villages” are now within the golden triangle.
5) In to the future, do you expect to see changes to the current market area?
If so in what areas will be added/subtracted?
What will be the key drivers of change? How certain are you regarding the likelihood of these drivers/changes occurring?
No further changes anticipated. Increase in housing units anticipated but these will be across all parts of Leeds and therefore will not impact on the HMA
boundaries.
6) Where (if anywhere) do you think that local authorities should be jointly planning for housing across administrative boundaries? (which local
authority areas and why? This can include within the LCR and between the LCR and other CR/Counties. )
Don’t Know
7) What sort of activities should they be working jointly on e.g. coordinating land release, joint infrastructure investment etc. Does this vary
between boundaries?
Don’t Know
KNIGHT FRANK (HARROGATE)
1a) In what areas of the Leeds City Region do you build/sell homes?
1b) What areas do clients/buyers come from?
Head of Harrogate office providing estate agency services for the upper end of the market across Yorkshire, but heavily focused on the area within a 20 mile
radius of Harrogate.
The KF target market is split into 4 diamond areas, the first of which comprises the fabled Golden Triangle (Leeds, Ilkey, Harrogate, Wetherby)

74
Area 2: Leeds, Skipton, Ripon to York Area 3: Leeds, Settle, Richmond to Malton
Area 4: off-lying area comprising the high value areas south of Wakefield, south of Huddersfield and North of Hull
2a) Referring to Map 1 in the summary report that was emailed to you, how do the HMA boundaries compare with your understanding of the
housing markets in which you build/sell property? Are there any obvious things wrong with the HMA boundaries in your opinion? Are there any
locations where the boundaries don’t makes sense?
The area to the east of Wetherby (comprising Tockwith, Bickerton, Walton, Boston Spa) should not be in the York SHMA. They have stronger links with
Leeds.
The boundary between the Leeds and Harrogate LT HMA should follow the river Wharfe as there are only three places between Wetherby and Otley where
you can cross the river.
Leeds LT HMA needs to be split into two, with a line across the area from Pudsey to Bramley and Harehills separating the HMA into a northern and southern
section.
Area above the H in Harrogate. Is this the Nidderdale AONB? If it is, it should also include the area to the North up to Masham to create an agricultural area
for North Yorkshire.
Boundary between the Harrogate LT HMA and the York SHMA seem to follow the boundary of the River Swale, but does not account of the position of
bridges along the river which could open up part of the York SHMA into Harrogate.
2b) To what extent do market areas vary by house type or other factors (e.g. location, prestige/executive/family homes, price)?
3) Over the past five years has your market area changed? If so in what areas have been added/subtracted?
What have been the key drivers of change (e.g planning policy, land availability, improved transport connections, expanded TTWAs)?
No change
4) Considering longer term trends, over the past 15 years has your market area changed?
If so in what areas have been added/subtracted? What have been the key drivers of change?
Noticeable impact on North Yorkshire, with improvements to the A1 pushing the commuter belt further north. Indeed, Thirsk and Ripon are now within the
commuter belt for the West Yorkshire conurbation.
5) In to the future, do you expect to see changes to the current market area? If so in what areas will be added/subtracted?
What will be the key drivers of change? How certain are you regarding the likelihood of these drivers/changes occurring?
As long as Leeds is the major driver of the LCR economy, the housing market areas will probably not change much over the next few years. Some local
authorities (e.g Harrogate) have outdated housing policies which have resisted development and increased prices. One area with potential to make a
difference, however, is the area to the East of Leeds due to its proximity to the A1 and access to rail links into Leeds.
6) Where (if anywhere) do you think that local authorities should be jointly planning for housing across administrative boundaries? (which
local authority areas and why? This can include within the LCR and between the LCR and other CR/Counties. )

75
Leeds and Harrogate Halifax and Huddersfield to overcome the M62 divide
7) What sort of activities should they be working jointly on e.g. coordinating land release, joint infrastructure investment etc. Does this vary
between boundaries?
Unlikely to happen due to the separate distinct identities of the local authorities in the area.
LAMBERT SMITH HAMPTON (LEEDS)
1a) In what areas of the Leeds City Region do you build/sell homes?
1b) What areas do clients/buyers come from?
Commercial agency covering Leeds city centre and out of town office, industrial, retail and residential markets, as well as the wider regional markets across
Yorkshire and the Humber, including Bradford, Wakefield, York and beyond. Deal in housing land sales, with residential estate agency covered by
Bridgefords which, like LSH, is part of the Countrywide group.
2a) Referring to Map 1 in the summary report that was emailed to you, how do the HMA boundaries compare with your understanding of the
housing markets in which you build/sell property? Are there any obvious things wrong with the HMA boundaries in your opinion? Are there any
locations where the boundaries don’t makes sense?
Strategic HMAs
Agrees that Barnsley is now outside of the Leeds SHMA due to closer ties and economic pull from Sheffield
Halifax and Huddersfield has a blurred boundary, with large numbers of commuters travelling to Leeds and Manchester for work. Good transport links in both
directions via M62 and rail connections
Ilkley part of the Leeds TTWA, with good rail connectivity into Leeds City Centre and easy access to Harrogate via the A59
Is the unmarked area adjacent to Harrogate an RAF base?
Lower Tier HMAs
Move boundary of Leeds LT HMA north towards Harrogate. Evidence of families relocating from North Leeds to rural villages in North Yorkshire. Cannot
quantify the trend, but is an emerging trend. A similar trend is also occurring in the Harrogate LTHMA, with evidence of a shift of families into villages in
the York HMA due to affordability…larger premises in attractive locations for lower price per sqm.
The Leeds LT HMA needs to be split into three sub-sections: The city centre is a market in its own right, particularly for young professionals seeking city
centre living. When they get married and have a family, they will relocate into North/North West Leeds and Ilkley area. Ilkley is part of the Leeds SHMA
and forms part of the North/North West Leeds subsector. Southern Leeds – south of Pudsey is an area with a concentration of poorer quality and
social housing stock. People in this area will aspire to relocate to North/North West Leeds but will not attract people from N/NW Leeds.
INTERVIEW TERMINATED AT THIS POINT

76
ADAIR PAXTON (LEEDS)
1a) In what areas of the Leeds City Region do you build/sell homes?
1b) What areas do clients/buyers come from?
Operate residential sales, letting and property management from two main sales offices. One is based in Horsforth and the other in Leeds. Cover the whole
of the Leeds area and have been involved in estate agency for over 30 years.
2a) Referring to Map 1 in the summary report that was emailed to you, how do the HMA boundaries compare with your understanding of the
housing markets in which you build/sell property? Are there any obvious things wrong with the HMA boundaries in your opinion? Are there any
locations where the boundaries don’t makes sense?
Strategic HMAs
Happy with SHMAs
Lower Tier HMAs
The Leeds market operates in a number of small pockets, but can essentially be split into three broad areas: City Centre/North/North West Leeds is the most
popular area; North East Leeds towards Wetherby; Southern Leeds – lower end housing stock
Bradford SHMA should be split into three lower tier HMAs with Ilkley becoming its own LT HMA
2b) To what extent do market areas vary by house type or other factors (e.g. location, prestige/executive/family homes, price)?
3) Over the past five years has your market area changed?
If so in what areas have been added/subtracted?
What have been the key drivers of change (e.g planning policy, land availability, improved transport connections, expanded TTWAs)?
Sought after areas such as N/NW Leeds are attracting people from further afield (Harrogate, York, Ilkley), which has caused rising demand and prices.
People that already live in the area tend to stay there unless relocating away from the LCR.
Eastern Leeds has also recovered since recession but not as strongly.
4) Considering longer term trends, over the past 15 years has your market area changed?
If so in what areas have been added/subtracted? What have been the key drivers of change?
Areas that have traditionally been strong residential markets (N/NW Leeds) together with areas that have been focal points for regeneration programmes,
including Leeds City Centre have recovered through successive recessions whilst other areas, including East and South Leeds have been more stagnant.
Not sure to what extent this has impacted on HMA boundaries.
5) In to the future, do you expect to see changes to the current market area? If so in what areas will be added/subtracted?
What will be the key drivers of change? How certain are you regarding the likelihood of these drivers/changes occurring?

77
New house building planned for Leeds is likely to be in East and South Leeds which, if accompanied by improvements to infrastructure, will result in these
areas becoming more desirable and may see a shift in HMA boundaries. The infrastructure and service improvements and a general spruce up of the
area, however, are imperative if this is to be achieved.
6) Where (if anywhere) do you think that local authorities should be jointly planning for housing across administrative boundaries? (which
local authority areas and why? This can include within the LCR and between the LCR and other CR/Counties. )
DK
7) What sort of activities should they be working jointly on e.g. coordinating land release, joint infrastructure investment etc. Does this vary
between boundaries?
DK
TITCHMARSH & CO (LEEDS)
1a) In what areas of the Leeds City Region do you build/sell homes?
1b) What areas do clients/buyers come from?
Leeds based independent residential property consultants. Established in 2008, Titchmarsh & Co specialise in site disposals, development appraisal and
viability negotiations, site identification and acquisition, development consultancy and residential investment advice
2a) Referring to Map 1 in the summary report that was emailed to you, how do the HMA boundaries compare with your understanding of the
housing markets in which you build/sell property? Are there any obvious things wrong with the HMA boundaries in your opinion? Are there any
locations where the boundaries don’t makes sense?
Strategic HMAs
Residents from Ikley, Keighley and Skipton are more likely to travel to Leeds for work than Bradford and therefore should be within the Leeds SHMA
Part of the York SHMA also drawn to Leeds, particularly Tadcaster and Selby. In respect of the latter, there is a railway connection from Selby to Thorpe
Willoughby, South Milford, Garforth and into Leeds.
Lower Tier HMAs
Move the northern boundary of the Leeds LT HMA above Harrogate and extend the western boundary to take in Ilkley
2b) To what extent do market areas vary by house type or other factors (e.g. location, prestige/executive/family homes, price)?
3) Over the past five years has your market area changed? If so in what areas have been added/subtracted?
What have been the key drivers of change (e.g planning policy, land availability, improved transport connections, expanded TTWAs)?

78
Most development over the past 5 years has been focused around safer market areas. The market has been uncertain so housebuilders have been
unprepared to build in untested areas.
4) Considering longer term trends, over the past 15 years has your market area changed?
If so in what areas have been added/subtracted? What have been the key drivers of change?
There has been a rise in city centre living in Leeds, resulting in a growth in sales and letting of apartments in the city centre. But also a trend of families
moving out of the city centre into outlying villages/settlements (e.g. Sherburn in Elmet) as commuters are prepared to travel further for work in order to get
more property for their money.
5) In to the future, do you expect to see changes to the current market area? If so in what areas will be added/subtracted?
What will be the key drivers of change? How certain are you regarding the likelihood of these drivers/changes occurring?
New sites coming forward are all on the fringes of major settlements – Leeds, Wakefield, Castleford, Pontefract. The focus is therefore expected to remain
on safe market locations due to infrastructure of untested areas and site proximity to existing chimney pot areas.
6) Where (if anywhere) do you think that local authorities should be jointly planning for housing across administrative boundaries? (which
local authority areas and why? This can include within the LCR and between the LCR and other CR/Counties. )
Leeds and Wakefield Leeds and Selby Leeds and Bradford
7) What sort of activities should they be working jointly on e.g. coordinating land release, joint infrastructure investment etc. Does this vary
between boundaries?
Infrastructure Schooling Land release (e.g. a lot of development between Hull and East Riding boundary. Most of the housing is being
built in East Riding side of the boundary but the majority of children will go to schools in Hull and adults will work in Hull)
LSL NEW HOMES (DONCASTER)
1a) In what areas of the Leeds City Region do you build/sell homes?
1b) What areas do clients/buyers come from?
LSL Land & New Homes forms part of the LSL Property Services plc which contains a number of well-known UK high street brands including New Homes,
Your Move and Reeds Rains. Through the group, LSL has knowledge and expertise in buying or selling housing land. The Doncaster office covers an area
extending to the North of Newcastle to south of Birmingham

79
2a) Referring to Map 1 in the summary report that was emailed to you, how do the HMA boundaries compare with your understanding of the
housing markets in which you build/sell property? Are there any obvious things wrong with the HMA boundaries in your opinion? Are there any
locations where the boundaries don’t makes sense?
Strategic HMAs
Put Ilkley and possibly Skipton into the Leeds SHMA rather than Bradford. Historically part of Bradford commuting area but now much more closely
associated with Leeds.
Wetherby/Tadcaster – should also be part of the Leeds SHMA rather than York. Cheaper to live here than in Leeds and commuting is facilitated by an
improved road network.
Lower Tier HMAs
Split Leeds LT HMA into three areas: northern strip extending from Ilkley to Wetherby (residents in this area will tend to remain within this area long term);
city centre residents who move could potentially move to the Northern strip or southern Leeds depending on whether they are looking to rent or buy;
south Leeds is an area below a line extending from Pudsey to the City centre and across to Selby
2b) To what extent do market areas vary by house type or other factors (e.g. location, prestige/executive/family homes, price)?
Work: ease of travel Schools: catchment area for good schools Quality of place
3) Over the past five years has your market area changed? If so in what areas have been added/subtracted?
What have been the key drivers of change (e.g planning policy, land availability, improved transport connections, expanded TTWAs)?
No change due to recession
4) Considering longer term trends, over the past 15 years has your market area changed? If so in what areas have been added/subtracted?
What have been the key drivers of change?
Some fluctuations in the performance of market areas during recession, but no changes to HMA boundary areas.
5) In to the future, do you expect to see changes to the current market area? If so in what areas will be added/subtracted?
What will be the key drivers of change? How certain are you regarding the likelihood of these drivers/changes occurring?
Not unless something happens to promote change. Areas identified for housing development would need more/improved facilities with sufficient capacity
(e.g. hospitals, schools, roads, public transport.) For example, an area South of Huddersfield has been earmarked for housing but is hard to get to and
will require improved road infrastructure
6) Where (if anywhere) do you think that local authorities should be jointly planning for housing across administrative boundaries? (which
local authority areas and why? This can include within the LCR and between the LCR and other CR/Counties. )
Leeds and Wakefield Leeds and Bradford Halifax and Huddersfield

80
7) What sort of activities should they be working jointly on e.g. coordinating land release, joint infrastructure investment etc. Does this vary
between boundaries?
Land release Infrastructure between the three areas, especially where developments are likely to take place on or close to local authority boundaries
CARTER JONAS (LEEDS)
1a) In what areas of the Leeds City Region do you build/sell homes?
1b) What areas do clients/buyers come from?
Comprehensive Commercial Property and Residential Development service, dealing with property and development projects throughout the North of
England. The office specialises in Consultancy and advice to Landlords and occupiers, dealing with investment property, substantial mixed use development
projects and residential housing land.
2a) Referring to Map 1 in the summary report that was emailed to you, how do the HMA boundaries compare with your understanding of the
housing markets in which you build/sell property? Are there any obvious things wrong with the HMA boundaries in your opinion? Are there any
locations where the boundaries don’t makes sense?
Strategic HMAs
In the Leeds SHMA, the top left area west of Ripon is too far from the A1 to be part of the Leeds TTWA. Would suggest removing the top left triangle (has
YORKSHIRE written in it). From Masham for example it can take half an hour to get to the A1.
East of Leeds SHMA and north of York City (e.g. Easingwold) should be within the Leeds SHMA. There is a lot of housing growth anticipated for the area
and is now seen as being within the Leeds commuter belt.
Move Ilkley into the Leeds SHMA. This is within the Leeds commuter belt. Skipton meanwhile is linked to Bradford via the Aire Valley Road and railway line
so is definitely within the Bradford SHMA.
Move Selby, Tadcaster and Wetherby into the Leeds SHMA.
Lower Tier HMAs
Split Leeds LT HMA into three areas: aArc from Ilkley to Harrogate to Wetherby to North Leeds (the Golden Triangle) which is home to top value properties
some 50% higher than what you might pay in South Leeds; south side (e.g.Morley) has historically been an area of poorer quality housing and social
housing, but the area is very accessible due to the rail network and has become a focal point for housebuilders; East Leeds (e.g. Garforth) where most land
is due to be released for development by Leeds City Council.
Wakefield: Remove the line between the Castleford and Pontefract LT HMA
2b) To what extent do market areas vary by house type or other factors (e.g. location, prestige/executive/family homes, price)?
Work: ease of travel Schools: catchment area for good schools Quality of place

81
3) Over the past five years has your market area changed? If so in what areas have been added/subtracted?
What have been the key drivers of change (e.g planning policy, land availability, improved transport connections, expanded TTWAs)?
Housebuilding market is becoming stronger as the UK moves out of recession and LDFs progress. Nothing was happening 5 years ago – no land deals at
all. The market is now much more active and Carter Jonas has just had its most successful year selling housing land. House prices are now 10-15% higher
and new units are being sold at a faster rate. The average used to be one per week but is now two per week, suggesting evidence of latent demand
4) Considering longer term trends, over the past 15 years has your market area changed?
If so in what areas have been added/subtracted? What have been the key drivers of change?
Improvements to the A1 has extended the commuter belt to Leeds by 10 miles, whilst improvements to railway lines have opened up places like Ilkley for
Leeds commuters. Commuting times rather than distance is now the key. More people now coming into Leeds from the York SHMA (via the A64) and from
villages to the West of York City in particular.
5) In to the future, do you expect to see changes to the current market area? If so in what areas will be added/subtracted?
What will be the key drivers of change? How certain are you regarding the likelihood of these drivers/changes occurring?
Harrogate is looking for solutions to its housing problems and has identified a site east of Knareborough which is within the Leeds commuter belt and could
potentially provide 4,000 homes in an area close to the A1 and the railway line to York and remove pressure within Harrogate itself. The concept of
brand new settlements is back on the agenda.
6) Where (if anywhere) do you think that local authorities should be jointly planning for housing across administrative boundaries? (which
local authority areas and why? This can include within the LCR and between the LCR and other CR/Counties. )
There seems to be more pressure from central government for planning authorities to co-operate more. Indeed the Kirklees deposit draft was kicked out
because of a lack of collaboration with Leeds.
York, Kirklees and Harrogate have big housing issues and need to consider new settlements to solve joint problems. New settlements should be along the
trunk roads and close to rail links, including HS2 line into Leeds.
Leeds and Harrogate should collaborate more regarding the area around Wetherby.
York and Selby don’t talk to each other at all.
7) What sort of activities should they be working jointly on e.g. coordinating land release, joint infrastructure investment etc. Does this vary
between boundaries?
SAVILLS (LEEDS)

82
1a) In what areas of the Leeds City Region do you build/sell homes?
1b) What areas do clients/buyers come from?
2a) Referring to Map 1 in the summary report that was emailed to you, how do the HMA boundaries compare with your understanding of the
housing markets in which you build/sell property? Are there any obvious things wrong with the HMA boundaries in your opinion? Are there any
locations where the boundaries don’t makes sense?
Strategic HMAs
Residents from settlements on the Leeds side of York more likely to travel to Leeds for work. Move from York SHMA to Leeds.
Leeds also easily accessible from Skipton and Ilkley via the Aire Valley Road (A65) or by train
The east side of Bradford (Atley Bridge) has a new station which also helps movement of residents into Leeds
Halifax and Huddersfield potentially shared between Leeds and Manchester TTWAs
Lower Tier HMAs
Split Leeds LT HMA into two areas: Northern band from N/NW Leeds to NE section; Southern area. Draw a line from Pudsey to Leeds city centre
2b) To what extent do market areas vary by house type or other factors (e.g. location, prestige/executive/family homes, price)?
3) Over the past five years has your market area changed?If so in what areas have been added/subtracted?
What have been the key drivers of change (e.g planning policy, land availability, improved transport connections, expanded TTWAs)?
Not hugely. The Leeds side of Bradford has become more attractive to the Leeds market due to the new station at Astley Bridge
4) Considering longer term trends, over the past 15 years has your market area changed?
If so in what areas have been added/subtracted? What have been the key drivers of change?
Road and rail improvements have extended the commuter belts across the LCR
5) In to the future, do you expect to see changes to the current market area? If so in what areas will be added/subtracted?
What will be the key drivers of change? How certain are you regarding the likelihood of these drivers/changes occurring?
Northern powerhouse agenda may change the way the LCR is viewed and, if successful, will see increased flows of people from/to Manchester if
infrastructure improvements are secured.
6) Where (if anywhere) do you think that local authorities should be jointly planning for housing across administrative boundaries? (which
local authority areas and why? This can include within the LCR and between the LCR and other CR/Counties. )
Leeds – Harrogate – York Leeds – Manchester. Links through the Northern Powerhouse will see increased links and areas in between
could potentially benefit In Greater Manchester 10 councils that produce a joint local plan. Something like this would be of great benefit to the LCR. Leeds,
Harrowgate and Bradford co-operate at city region level but there is a need for a more formal relationship to increase cooperation at a planning authority
level. Devolution is being considered at the moment and this would force the local authorities to work together.

83
7) What sort of activities should they be working jointly on e.g. coordinating land release, joint infrastructure investment etc. Does this vary
between boundaries?
Ideally a joint local plan for the LCR area (like Manchester) which will coordinate land release and set housing targets.
M J GLEESON (WAKEFIELD)
1a) In what areas of the Leeds City Region do you build/sell homes?
1b) What areas do clients/buyers come from?
Gleeson currently have 12 housing sites around the Leeds City Region – 6 ongoing and 6 in the pipeline. The sites are located around Leeds, Bradford and
Wakefield. Gleeson is generally looking at poorer areas where 2-4 bed semi and detached houses are selling at less than £150 psf. Customers/enquiries are
very local and mortgages offered are typically less than the cost of renting a council house. Indeed, many of the Gleeson developments are on the edge of
council estates and council tenants and RTB owners are common buyers. Typically first time buyers or on the second rung of the property ladder. Enquiries
are from within a 5 mile radius.
2a) Referring to Map 1 in the summary report that was emailed to you, how do the HMA boundaries compare with your understanding of the
housing markets in which you build/sell property? Are there any obvious things wrong with the HMA boundaries in your opinion? Are there any
locations where the boundaries don’t makes sense?
Strategic HMAs
Move Ilkley to Leeds SHMA
Lower Tier HMAs
Merge Castleford and Pontefract LT HMAs
Create new LT HMA comprising Ilkley/ Addingham
2b) To what extent do market areas vary by house type or other factors (e.g. location, prestige/executive/family homes, price)?
Areas to some extent are defined by physical factors including rivers, roads and railways
3) Over the past five years has your market area changed? If so in what areas have been added/subtracted?
What have been the key drivers of change (e.g planning policy, land availability, improved transport connections, expanded TTWAs)?
DK
4) Considering longer term trends, over the past 15 years has your market area changed?

84
If so in what areas have been added/subtracted? What have been the key drivers of change?
DK
5) In to the future, do you expect to see changes to the current market area? If so in what areas will be added/subtracted?
What will be the key drivers of change? How certain are you regarding the likelihood of these drivers/changes occurring?
Boundaries may change as a lot of future new build will take place on attractive green field sites in Halifax, Huddersfield and East Leeds. The areas require
some 17,500 housing units to hit targets and easy green belt sites are preferred by the house builders to tricky brownfield sites.
6) Where (if anywhere) do you think that local authorities should be jointly planning for housing across administrative boundaries? (which
local authority areas and why? This can include within the LCR and between the LCR and other CR/Counties. )
Leeds and Bradford and Leeds and Wakefield as a lot of development in the future is expected on the boundaries between these areas.
7) What sort of activities should they be working jointly on e.g. coordinating land release, joint infrastructure investment etc. Does this vary
between boundaries?
Current Gleeson development at Tyresall between Bradford and Leeds. The site is one local authority area and the associated highways and infrastructure
requirements are within the other. The legal and planning sides need to be aligned and decisions be made by the two authorities simultaneously. Other
issues include collection of council tax revenues by one authority whilst all the costs associated with highways maintenance will be burdened by the other.
KEEPMOAT (LEEDS)
1a) In what areas of the Leeds City Region do you build/sell homes?
1b) What areas do clients/buyers come from?
Currently engaged on 14 sites across East Leeds; Selby; Wakefield; Bradford
2a) Referring to Map 1 in the summary report that was emailed to you, how do the HMA boundaries compare with your understanding of the
housing markets in which you build/sell property? Are there any obvious things wrong with the HMA boundaries in your opinion? Are there any
locations where the boundaries don’t makes sense?
Strategic HMAs
Ripon is the northern limit of the Leeds SHMA. Further North (e.g. Masham) is too far out
West of York towards Harrogate (around Knaresborough) there is a blurring of geographies and it is unclear whether residents are pulled by Harrogate or
York
East Bradford/west Leeds around Guisley and Pudsey, these areas could be pulled by Bradford or Leeds for work due to the rail links in both directions
Ilkley is part of the Leeds SHMA and not Bradford
85
Lower Tier HMAs
North south divide across Leeds LT HMA. South Leeds is unlikely to pull people from North Leeds and most South Leeds residents will aspire to live in North
Leeds, but many will not achieve it. Place line across the map from PU to LS. Ardsley to be included within the Wakefield LT HMA rather than Leeds. It
is close to the A1 but possibly more affiliated with Wakefield. Include Ilkley as part of proposed North Leeds LT HMA
Possible further extension of North Leeds LT HMA to form the Golden Triangle with Harrogate, York and Wetherby. The golden triangle is wealthy and
diverse range of housing stock in market towns. It is semi rural around York and Ilkley and comprises pleasant urban areas around Harrogate and
North Leeds. The Golden Triangle is not driven by transport connectivity but by the pleasant environment.
2b) To what extent do market areas vary by house type or other factors (e.g. location, prestige/executive/family homes, price)?
Represents where people are on the housing ladder: middle income families are interested in transport and accessibility; higher income families are
interested in attractiveness of the area and quality of space; FTB are looking at price v social aspects v amount of space.
3) Over the past five years has your market area changed? If so in what areas have been added/subtracted?
What have been the key drivers of change (e.g planning policy, land availability, improved transport connections, expanded TTWAs)?
No
4) Considering longer term trends, over the past 15 years has your market area changed?
If so in what areas have been added/subtracted? What have been the key drivers of change?
Commuting distances have been extended by improved road network and rail links. Rail services between Leeds and Bradford are much more efficient
today and rail network has opened up Manchester as a possible work location for LCR based commuters.
5) In to the future, do you expect to see changes to the current market area? If so in what areas will be added/subtracted?
What will be the key drivers of change? How certain are you regarding the likelihood of these drivers/changes occurring?
Strengthening of Bradford on the back of improved rail links, new stations, lines and routes
Leeds looking to dispose of brownfield sites for housing which will improve housing stock in the East Leeds area
York/North Yorkshire authorities are less advanced with new land releases so there is likely to be less immediate impact on housing markets in those areas.
6) Where (if anywhere) do you think that local authorities should be jointly planning for housing across administrative boundaries? (which
local authority areas and why? This can include within the LCR and between the LCR and other CR/Counties)
Leeds and Bradford Wakefield and Leeds In North Yorkshire there is a strategic housing partnership which covers all boroughs/districts
which works very well and could potentially provide a model for the LCR.
7) What sort of activities should they be working jointly on e.g. coordinating land release, joint infrastructure investment etc. Does this vary
between boundaries?
Coordinate land release better between the authorities. 5 year delivery strategies need to take consideration of what the other areas are doing
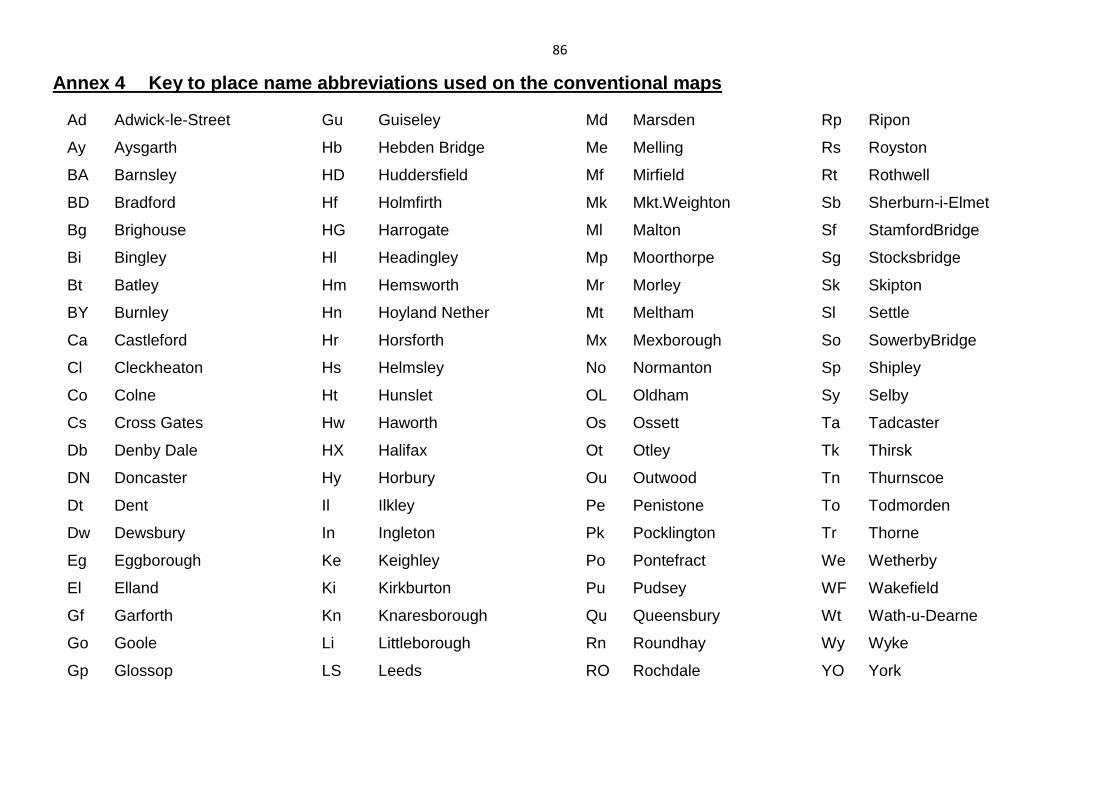
86
Annex 4 Key to place name abbreviations used on the conventional maps
Ad Adwick-le-Street Gu Guiseley Md Marsden Rp Ripon
Ay Aysgarth Hb Hebden Bridge Me Melling Rs Royston
BA Barnsley HD Huddersfield Mf Mirfield Rt Rothwell
BD Bradford Hf Holmfirth Mk Mkt.Weighton Sb Sherburn-i-Elmet
Bg Brighouse HG Harrogate Ml Malton Sf StamfordBridge
Bi Bingley Hl Headingley Mp Moorthorpe Sg Stocksbridge
Bt Batley Hm Hemsworth Mr Morley Sk Skipton
BY Burnley Hn Hoyland Nether Mt Meltham Sl Settle
Ca Castleford Hr Horsforth Mx Mexborough So SowerbyBridge
Cl Cleckheaton Hs Helmsley No Normanton Sp Shipley
Co Colne Ht Hunslet OL Oldham Sy Selby
Cs Cross Gates Hw Haworth Os Ossett Ta Tadcaster
Db Denby Dale HX Halifax Ot Otley Tk Thirsk
DN Doncaster Hy Horbury Ou Outwood Tn Thurnscoe
Dt Dent Il Ilkley Pe Penistone To Todmorden
Dw Dewsbury In Ingleton Pk Pocklington Tr Thorne
Eg Eggborough Ke Keighley Po Pontefract We Wetherby
El Elland Ki Kirkburton Pu Pudsey WF Wakefield
Gf Garforth Kn Knaresborough Qu Queensbury Wt Wath-u-Dearne
Go Goole Li Littleborough Rn Roundhay Wy Wyke
Gp Glossop LS Leeds RO Rochdale YO York
87
Annex 5 Glossary and acknowledgements, plus end notes
Glossary
CURDS Centre for Urban and Regional Development Studies
HMAs housing market area
LA local authority
LCR Leeds City Region
LPAs Local Planning Authorities
LPEG Local Plan Expert Group
NHPAU National Housing & Planning Advisory Unit
RPs Registered Providers
SHMA Strategic Housing Market Assessment
TTWAs Travel-to-Work Areas
Acknowledgements
The research team is grateful for the advice of the client steering group and in particular Justin Wilson along with Andy Haigh. The study has benefited from
the high level of response to the consultation process from the numerous stakeholders in each of the sectors contacted.
Census datasets are Crown Copyright. The migration and commuting datasets were accessed from WICID (http://wicid.ukdataservice.ac.uk).
The ward boundaries contain Ordnance Survey data and are Crown Copyright and accessed from UKBORDERS (https://census.edina.ac.uk).
End Notes
ii https://www.gov.uk/government/uploads/system/uploads/attachment_data/file/508345/Local-plans-report-to-government.pdf
ii http://planningguidance.communities.gov.uk/blog/guidance/housing-and-economic-development-needs-assessments/scope-of-assessments
iii Further details in Alternatives for the Definition of HMAs which is at www.gov.uk/government/publications/housing-market-areas
iv This is the Ordnance Survey “Miniscale” map which is open data
v Land Registry data on median sale price by all dwelling type
vi It is unknown at the time of writing this report whether York City Council are planning on meeting their identified housing need within their LA.
Centre for Urban & Regional Development Studies (CURDS), School of Geography, Politics and Sociology, Claremont Bridge, Newcastle University NE1 7RU
Tel: 0191 208 7691 Fax: 0191 208 7741 www.ncl.ac.uk/curds/ www.ncl.ac.uk/gps/geography/