LEE Mapping Analysis Reportcambridgeshirepeterborough-ca.gov.uk/assets/... · 3.5 East Anglia vs...
48
Local Energy East Mapping Analysis Report May 2018 ______________________________________________________ A narrative on conclusions drawn from the mapping work on the Local Energy East area incorporating views on network company forward plans and government policy.
Transcript of LEE Mapping Analysis Reportcambridgeshirepeterborough-ca.gov.uk/assets/... · 3.5 East Anglia vs...

Local Energy East
Mapping Analysis Report
May 2018
______________________________________________________
A narrative on conclusions drawn from the mapping work on the Local Energy East area incorporating views on network company forward plans and government policy.

Disclaimer
While Cornwall Insight considers the information and opinions given in this report and all other documentation are sound, all parties must rely upon their own skill and judgement when making use of it. Cornwall Insight will not assume any liability to anyone for any loss or damage arising out of the provision of this report howsoever caused.
The report makes use of information gathered from a variety of sources in the public domain and from confidential research that has not been subject to independent verification. No representation or warranty is given by Cornwall Insight as to the accuracy or completeness of the information contained in this report.
Cornwall Insight makes no warranties, whether express, implied, or statutory regarding or relating to the contents of this report and specifically disclaims all implied warranties, including, but not limited to, the implied warranties of merchantable quality and fitness for a particular purpose. Numbers may not add up due to rounding.

Contents 1 Executive summary 4
1.1 Geographical extent 4 1.2 Local Energy East’s ambitions 4 1.3 Summary of findings 5 1.4 Structure of document 6
2 Energy data-mapping portal 7 3 High level indicators 11
3.1 Regional energy developments 11 3.2 New Anglia economic plans 11 3.3 Cambridgeshire and Peterborough economic plans 12 3.4 Hertfordshire economic plans 12 3.5 East Anglia vs national averages 13
4 Approach and framework 14 5 Local Energy East themes 15
5.1 Housing and commercial growth sites 15 5.2 Electrification of transport 15 5.3 Secure, affordable, low-carbon domestic power consumption 15 5.4 Summary influences from LEP development priorities 15
6 Characteristics of the networks 16 6.1 Electricity transmission network 16 6.2 Electricity distribution network 18 6.3 Conclusions for the electricity system 19 6.4 Gas transmission system 21 6.5 Gas distribution system 24 6.6 Conclusions for the gas system 25
7 Existing and planned situation 27 7.1 Housing and commercial growth sites 27 7.2 Electrification of transport, including hydrogen 30 7.3 Secure, affordable, low-carbon domestic power consumption 34
8 Future developments 42 8.1 Housing and commercial growth sites 42 8.2 Electrification of transport, including hydrogen 42 8.3 Secure, affordable, low-carbon domestic power consumption 42
9 Appendix 1: Local tariffs 44 10 Appendix 2: National forecasts 45

4
1 Executive summary
1.1 Geographical extent
This report, and the energy data-mapping portal, focuses on the area of responsibility of the Local Energy East (LEE) project. LEE areas consists of the Cambridgeshire and Peterborough LEP, Hertfordshire LEP and New Anglia LEP, which covers 34 local authority (LA) areas in the East of England. We refer to this area as the ‘LEE area’.
Due to limitations on some of the data sets available, we have at times had to use data covering different areas. For example, the government provides data sets referring to the East of England, an administrative region covering most of the LEE area, but which also covers Bedfordshire and Essex, and does not cover the two areas in south Lincolnshire. We also refer to the Eastern Power Networks (EPN) area, a region of the electricity distribution system which covers the LEE area but also extends into Essex.
As these datasets do not line up precisely with the LEE area, we have minimised the use of them, and have noted where we have used these datasets.
1.2 Local Energy East’s ambitions
Local Energy East (LEE) has articulated three themes for its proposed strategy: supporting housing growth and commercial sites infrastructure, supporting the transition to transport electrification including hydrogen, and ensuring secure, affordable, low-carbon domestic energy consumption.
We review these themes separately, across the whole area, and then highlight any pertinent points of interest between the larger area, urban and rural areas, and between the three LEP areas. Figure 1: LEE project analysis and modelling scenario mix
Whole area
Urban Rural Cambs & P’boro area
Herts area New Anglia area
Housing growth and commercial sites infrastructure
Transition to transport electrification including hydrogen
Secure, affordable, low carbon domestic consumption
Source: LEE
5
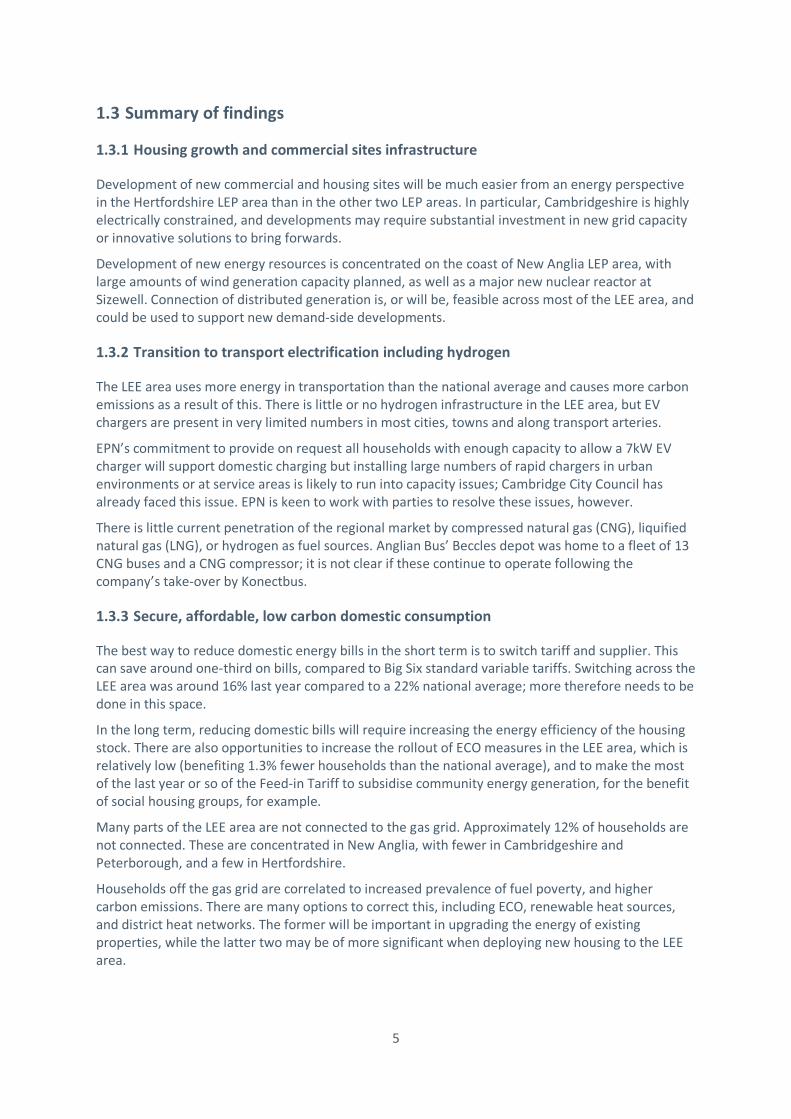
1.3 Summary of findings
1.3.1 Housing growth and commercial sites infrastructure
Development of new commercial and housing sites will be much easier from an energy perspective in the Hertfordshire LEP area than in the other two LEP areas. In particular, Cambridgeshire is highly electrically constrained, and developments may require substantial investment in new grid capacity or innovative solutions to bring forwards.
Development of new energy resources is concentrated on the coast of New Anglia LEP area, with large amounts of wind generation capacity planned, as well as a major new nuclear reactor at Sizewell. Connection of distributed generation is, or will be, feasible across most of the LEE area, and could be used to support new demand-side developments.
1.3.2 Transition to transport electrification including hydrogen
The LEE area uses more energy in transportation than the national average and causes more carbon emissions as a result of this. There is little or no hydrogen infrastructure in the LEE area, but EV chargers are present in very limited numbers in most cities, towns and along transport arteries.
EPN’s commitment to provide on request all households with enough capacity to allow a 7kW EV charger will support domestic charging but installing large numbers of rapid chargers in urban environments or at service areas is likely to run into capacity issues; Cambridge City Council has already faced this issue. EPN is keen to work with parties to resolve these issues, however.
There is little current penetration of the regional market by compressed natural gas (CNG), liquified natural gas (LNG), or hydrogen as fuel sources. Anglian Bus’ Beccles depot was home to a fleet of 13 CNG buses and a CNG compressor; it is not clear if these continue to operate following the company’s take-over by Konectbus.
1.3.3 Secure, affordable, low carbon domestic consumption
The best way to reduce domestic energy bills in the short term is to switch tariff and supplier. This can save around one-third on bills, compared to Big Six standard variable tariffs. Switching across the LEE area was around 16% last year compared to a 22% national average; more therefore needs to be done in this space.
In the long term, reducing domestic bills will require increasing the energy efficiency of the housing stock. There are also opportunities to increase the rollout of ECO measures in the LEE area, which is relatively low (benefiting 1.3% fewer households than the national average), and to make the most of the last year or so of the Feed-in Tariff to subsidise community energy generation, for the benefit of social housing groups, for example.
Many parts of the LEE area are not connected to the gas grid. Approximately 12% of households are not connected. These are concentrated in New Anglia, with fewer in Cambridgeshire and Peterborough, and a few in Hertfordshire.
Households off the gas grid are correlated to increased prevalence of fuel poverty, and higher carbon emissions. There are many options to correct this, including ECO, renewable heat sources, and district heat networks. The former will be important in upgrading the energy of existing properties, while the latter two may be of more significant when deploying new housing to the LEE area.

6
Additionally, while extending the gas grid to target these areas is a short-term solution to the problems of fuel poverty and high carbon emissions, pressures on the gas distribution grid may not be sustainable over the long term.
1.4 Structure of document
Section One – Executive summary
Section Two – Introduction to the energy data-mapping portal
Section Three – High level indicators
Section Four – Approach and framework
Section Five – LEE themes
Section Six – Characteristics of the networks and network operator plans
Section Seven – Existing situation and current planned developments
Section Eight – Anticipated future developments
Appendices – Energy supplier tariffs | National forecasts

7
2 Energy data-mapping portal
A key step in delivering the Energy Market Innovation Project (EMIP), which aims to identify and progress energy innovation projects in East Anglia, is to scope out a wide range of energy-related information in the LEE area. The findings of this undertaking will be accessible via the Energy data website, which will take the user to a portal where the data maps are presented and can be overlaid upon each other (up to five layers).
The tri-LEP LEE project – consisting of the Cambridgeshire and Peterborough LEP, Hertfordshire LEP and New Anglia LEP – which has contributed to the costs of this work.
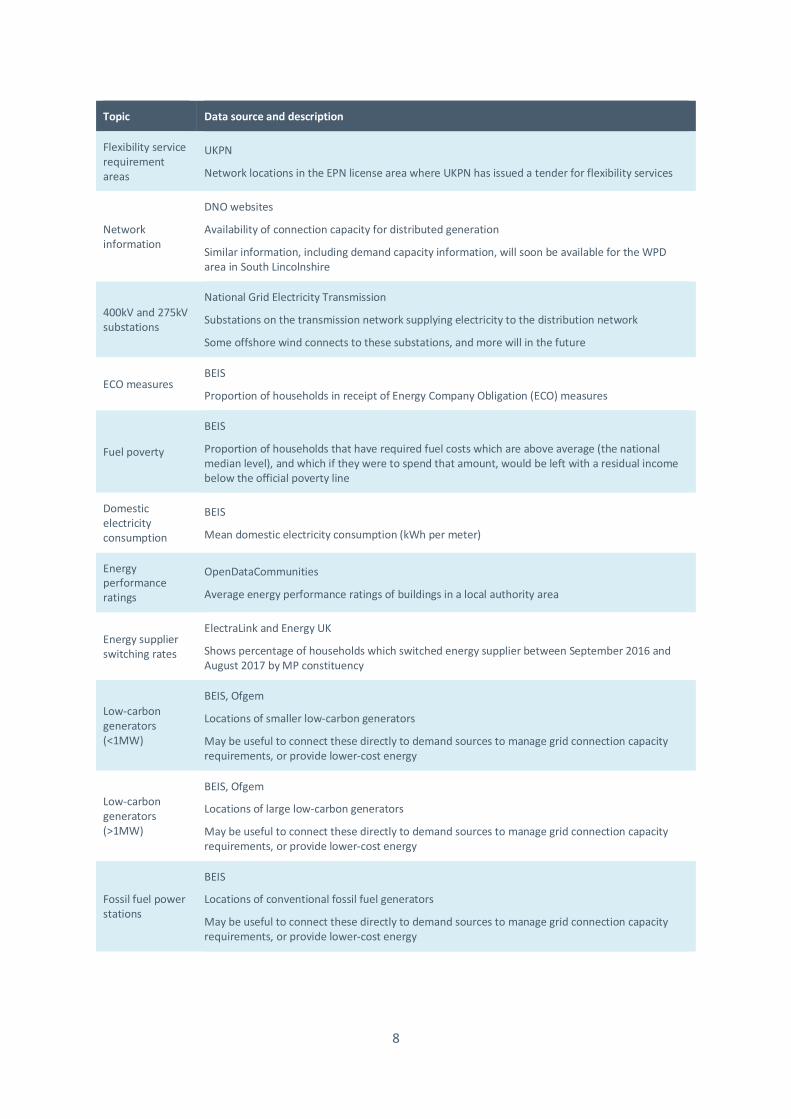
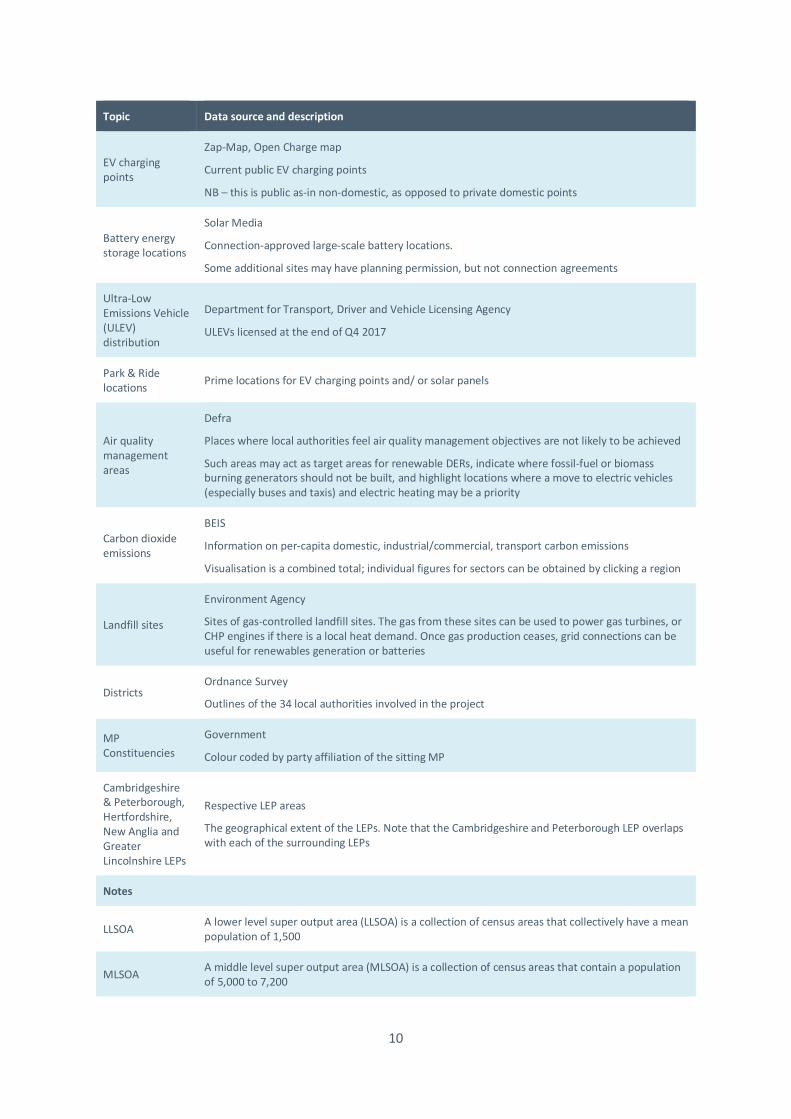
The energy data-mapping portal will provide baseline information about various aspects of energy, primarily shown through geographical placemarks, polygons and heat maps. Information will focus on the current energy landscape, as well as forecasts or projections that may be relevant (Figure 2).
The intention is that presenting the energy landscape in this way will make it easier for stakeholders to identify opportunity areas or areas of constraint in the LEE area, and thus inform their decisions and strategies going forward. Figure 2: Index of energy data-mapping portal layers
Topic Data source and description
Gas transmission network
National Grid Gas
Indication of the gas transmission pipelines in the LEE area
Gas sites
National Grid Gas
Above Ground Installations (AGIs) and Compressor Stations (CSs) are located at strategic points along the transmission pipeline. AGIs mark the start and end of cross-country pipelines and intervals along the route; CSs are facilities which compress the gas to a specified pressure
Gas connections BEIS
This correlates highly to higher domestic electricity consumption and more fuel poverty in the areas
Electricity transmission network
Shapefile of overhead transmission lines provided by National Grid
33kV substations
DNO websites
Substations where the voltage is stepped down from 33kV to 11kV
Further information about the station's 'utilisation', 'limiting constraint' and 'demand capacity' is available by clicking map points
This may be useful to potential developers and planners
132kV substations
DNO websites
Substations where the voltage is stepped down from 132kV to 33kV
Further information about the station's 'utilisation', 'limiting constraint' and 'demand capacity' is available by clicking map points
This may be useful to potential developers and planners
8
Topic Data source and description
Flexibility service requirement areas
UKPN
Network locations in the EPN license area where UKPN has issued a tender for flexibility services
Network information
DNO websites
Availability of connection capacity for distributed generation
Similar information, including demand capacity information, will soon be available for the WPD area in South Lincolnshire
400kV and 275kV substations
National Grid Electricity Transmission
Substations on the transmission network supplying electricity to the distribution network
Some offshore wind connects to these substations, and more will in the future
ECO measures BEIS
Proportion of households in receipt of Energy Company Obligation (ECO) measures
Fuel poverty
BEIS
Proportion of households that have required fuel costs which are above average (the national median level), and which if they were to spend that amount, would be left with a residual income below the official poverty line
Domestic electricity consumption
BEIS
Mean domestic electricity consumption (kWh per meter)
Energy performance ratings
OpenDataCommunities
Average energy performance ratings of buildings in a local authority area
Energy supplier switching rates
ElectraLink and Energy UK
Shows percentage of households which switched energy supplier between September 2016 and August 2017 by MP constituency
Low-carbon generators (<1MW)
BEIS, Ofgem
Locations of smaller low-carbon generators
May be useful to connect these directly to demand sources to manage grid connection capacity requirements, or provide lower-cost energy
Low-carbon generators (>1MW)
BEIS, Ofgem
Locations of large low-carbon generators
May be useful to connect these directly to demand sources to manage grid connection capacity requirements, or provide lower-cost energy
Fossil fuel power stations
BEIS
Locations of conventional fossil fuel generators
May be useful to connect these directly to demand sources to manage grid connection capacity requirements, or provide lower-cost energy

9
Topic Data source and description
Offshore wind farms
Crown Estate, 4C Offshore
Approximate locations of current and planned offshore wind farms
Each map point provides further information on capacity, construction statues and connection point onshore when clicked
Combined Heat & Power
BEIS, Defra, DECC, NNFCC
Shows, as well as large CHP plants, locations of anaerobic digesters that generate biogas, which is burned onsite to generate heat, power or both. It also shows biomethane to grid (BtG) points, where biomethane is created for injection into the national gas grid
District Heating Association for Decentralised Energy
Locations of heat networks
Feed-in tariff subsidised installations
Ofgem
Aggregations of feed-in tariff installations over 30kW – typically domestic but also small non-domestic
These installations could be particularly useful in supporting vulnerable customers through innovative schemes
Major housing and commercial developments
Various sources, including anecdotal evidence and LA/ LEP plans
A layer that is being expanded as we learn more
Airfields
Invisible works, Bing maps
Major airfields, both currently in use and disused. These areas may present significant future sites for domestic and non-domestic development once no longer used for aviation, and therefore present areas where there may be significant future energy demand
Major heat loads BEIS
Locations of large heat loads, typically industrial load
Enterprise zones
HM Government
Enterprise Zones are one of the key driving forces of local economies, unlocking key development sites, consolidating infrastructure, attracting business and creating jobs. They are prime locations for future energy demand
Major road network developments
Various
A layer that shows where major road developments are currently underway. Areas surrounding these road improvements may spawn commercial or housing developments
Non-domestic electricity consumption (HH metered)
BEIS
Shows the average consumption of half-hourly (HH) metered commercial users. These will be large- and medium-sized companies
Non-domestic electricity consumption (NHH metered)
BEIS
Shows the average consumption of half-hourly (HH) metered commercial users. These will be small companies and microbusinesses
10
Topic Data source and description
EV charging points
Zap-Map, Open Charge map
Current public EV charging points
NB – this is public as-in non-domestic, as opposed to private domestic points
Battery energy storage locations
Solar Media
Connection-approved large-scale battery locations.
Some additional sites may have planning permission, but not connection agreements
Ultra-Low Emissions Vehicle (ULEV) distribution
Department for Transport, Driver and Vehicle Licensing Agency
ULEVs licensed at the end of Q4 2017
Park & Ride locations Prime locations for EV charging points and/ or solar panels
Air quality management areas
Defra
Places where local authorities feel air quality management objectives are not likely to be achieved
Such areas may act as target areas for renewable DERs, indicate where fossil-fuel or biomass burning generators should not be built, and highlight locations where a move to electric vehicles (especially buses and taxis) and electric heating may be a priority
Carbon dioxide emissions
BEIS
Information on per-capita domestic, industrial/commercial, transport carbon emissions
Visualisation is a combined total; individual figures for sectors can be obtained by clicking a region
Landfill sites
Environment Agency
Sites of gas-controlled landfill sites. The gas from these sites can be used to power gas turbines, or CHP engines if there is a local heat demand. Once gas production ceases, grid connections can be useful for renewables generation or batteries
Districts Ordnance Survey
Outlines of the 34 local authorities involved in the project
MP Constituencies
Government
Colour coded by party affiliation of the sitting MP
Cambridgeshire & Peterborough, Hertfordshire, New Anglia and Greater Lincolnshire LEPs
Respective LEP areas
The geographical extent of the LEPs. Note that the Cambridgeshire and Peterborough LEP overlaps with each of the surrounding LEPs
Notes
LLSOA A lower level super output area (LLSOA) is a collection of census areas that collectively have a mean population of 1,500
MLSOA A middle level super output area (MLSOA) is a collection of census areas that contain a population of 5,000 to 7,200

11
3 High level indicators
Figure 3: LEP areas in the East of England (purple: New Anglia, green: Cambridgeshire and Peterborough, blue: Hertsfordshire; note that Cambridgeshire and Peterborough overlaps both other areas)
Source: energy data- mapping portal
3.1 Regional energy developments
• 13.9GW of wind generation capacity planned (14 projects)
o Major projects include East Anglia ONE & TWO and Hornsea One, Two and Three, and Norfolk Vanguard & Boreas
o Grid connection points at Killingholme, Necton, Norwich Main and Sizewell 400kV substations
• Energy demand in the LEE area has decreased 10% since 2012
• Energy generation in the LEE area has increased by 95% since 2012
o The number of generation MPANs has tripled since 2012
• Capital investment in clean energy worth £50bn is planned for the LEE area by 2020
3.2 New Anglia economic plans
• 88,000 net new jobs by 2036
• 140,000 new homes by 2036
• 30,000 new businesses by 2036

12
• £17.5bn growth in economy by 2036 (current contribution is £35.5bn)
• Second fastest growing area for high-growth firms in the UK
• Major growth areas in Suffolk:
o Greater Ipswich
o A11, A12 and A14
o Lowestoft Enterprise Zone
o Sizewell C nuclear power station (25,000 new jobs and opportunities for decommissioning of existing nuclear power facilities)
• Major growth areas in Norfolk:
o Northern Distributer Road
o Great Yarmouth Enterprise Zone and Third River Crossing
o A47 improvements linking Great Yarmouth with Norwich
3.3 Cambridgeshire and Peterborough area economic plans
• Proposals for £988mn capital investment in Cambridgeshire to 2021
• A14 between Cambridge and Huntingdon (crucial to planned major growth projects including new settlement at Northstowe and at the Enterprise Zone at Alconbury Weald)
• A47 between Wisbech and King’s Lynn (essential for housing and employment developments)
• Major urban extensions in Cambridge both in the north east to the south in South Cambridgeshire, and Peterborough (city centre regeneration)
• 156,000 additional homes planned across the Cambridgeshire and Peterborough area over the next 20 years (7,800 homes a year to 2031)
• Travel demand forecast to increase by 40% in the area to 2031
3.4 Hertfordshire economic plans
• Three major growth corridors
o M1, West Coast Mainline and Midland Mainline
o A1(M), East Coast Mainline and Great Northern Route
o A10, West Anglia Mainline and M11
• Growth Deal looks to establish 11,000 new jobs and 16,500 new homes by 2024/25
• Regeneration of key county towns of Hatfield, Hemel Hempstead, Stevenage, and Welwyn Garden City

13
3.5 East Anglia vs national averages
Figure 4 below highlights statistics related to fuel poverty, reduction of which is a key aim for many local authorities. The LEE area does not have proportionately as many residents suffering from fuel poverty as the country as a whole but has had less deployment of energy efficiency measures paid for by the Energy Company Obligation (ECO) and its predecessor schemes.
Around 5.5mn or around 22% of customers across the GB market switched electricity supplier in 2017, a record level. ElectraLink data for September 2016 to August 2017 indicated that approximately 359,000 or 16% households in the LEE area had switched supplier during the period, well below the national average. Figure 4: Comparison of statistics related to energy consumption and fuel poverty
LEE area East of England Great Britain
Households that are fuel poor (2015 data) 9.9% 7.8%
11.4%
(England only)
ECO measures per household (Sep 2017 data) 6.89% 5.26% 8.19%
Mean domestic electricity consumption (2016 data) 4,208kWh/meter - 3,794kWh/meter
Non-domestic electricity consumption (kWh per meter) (2015 data)
80,791kWh/meter - 60,306kWh/meter
Domestic electricity switches (Sept 16-Aug 17 for LEE, 2017 calendar for GB))
358,839 / 16% - 5,500,000 / 22%
Source: BEIS, ElectraLink
Looking at statistics for sectoral carbon dioxide equivalent emissions in Figure 5, the East of England causes more emissions from transport than the national average, around 22% more per person. It also causes more emissions from home heating. However, industrial emissions are lower, by around 7% per person.
This in part reflects the primarily rural nature of the area. Figure 5: CO2 emissions by sector (2015 data)
2015 data East of England
(5.85mn people)
United Kingdom
(65.11mn people)
East of England per capita emissions vs national average
Industrial and commercial total (kt CO2)
10,378 124,624 7% less
Domestic total (kt CO2) 9,939 107,338 3% more
Transport total (kt CO2) 11,100 96,333 22% more
Source: BEIS

14
4 Approach and framework
This report has been shaped to address the thematic drivers set out by the LEE group as a distillation of their core economic development priorities. The approach and framework for the outputs within the report are presented in Figure 6. The following commentary is made with reference to currently available layers of the energy data-mapping portal (Figure 2).
It also incorporates narrative around the wider network development plans published by network operators by: National Grid Electricity Transmission (NGET); UK Power Networks (UKPN), the distribution network operator for the Eastern Power Networks (EPN) region; National Grid Gas (NGG), the gas transmission network operator; and Cadent, the gas distribution network operator.
Figure 6: Framework for Local Energy East Strategy
Source: Cornwall Insight
Our aim has been to interpret the implications of the available data with respect to the thematic drivers in order to assist the participating LEPs more fully assimilate this information into their future economic development plans. The forward-looking sections will be anchored to future targets of 2030-2036, in line with LEE’s economic planning horizons.
Fig. 1. Framework for LEP Area Planning Commentary
Mapping platform index of layers
List of topics considered:
Transmission system Area development plansDistribution systemArea development plansWater systemArea development plansData system (time permitting)Area development plansAreasLocal authority boundariesFlexibility service requirement areasAir quality management areaGeneratorsLow-carbon generators (>1MW)Low-carbon generators (<1MW)Fossil fuel power stationsOffshore wind farmsCombined heat and power plantsEnergy demandFuture developmentsAirfieldsMajor heat loadsEnterprise zonesTransportDemand side initiativesEV charging pointsBattery energy storage locationsPark & Ride locationsHeatmapsECO measuresFuel povertyFeed-in tariff aggregation (>30kW)CO2 emissionsLLSOAs and domestic electricityLLSOAs and gas connected householdsLLSOAs and Network Info
Thematic drivers for commentary:
+ Economic Growth (housing & commercial) + Shift to a non-gas economy+ Electrification of transport+ Secure & affordable domestic energy
Reference back to layer index
Commentary Conclusions
Summary influences from LEP development priorities
+ Supply chain capacity building+ Innovation opportunities+ Smart, flexible grid development+ Skills availability
Economic development prioritiesGCGP LEP - + Digital & Technology+ Commercial space+ Business growth+ Transport+ Skills
New Anglia LEP -+ Our offer to the world+ Driving business growth+ Driving inclusion & skills+ Collaboration to grow+ Competitibe clusters
Hertfordshire LEP+ Maintaining global excellence in science & technology+ Harnessing our relatioinships with London (& elsewhere)+ Re-invigourating our places for the 21st century+ Foundations for growth

15
5 Local Energy East themes
5.1 Housing and commercial growth sites
Focuses on where opportunities and constraints may exist for on major housing and commercial development sites. We identify where developments are planned and whether network capacity is available, where it would be easy to reinforce the grid to accept new connections, and where it would be difficult or prohibitively expensive to do so.
5.2 Electrification of transport
Focuses on domestic and non-domestic transport electrification. This includes the need to install new charging capacity and the effect on the grid, and future uses for old service station forecourts. We look at a case study on whether service areas will be able to accept multiple fast-chargers.
5.3 Secure, affordable, low-carbon domestic power consumption
Focuses on fuel poverty and measures to reduce it, in addition to ensuring that the electricity and gas grids remain stable in face of challenges on increasing demand from heat pumps, electric vehicles charging and so on.
5.4 Summary influences from LEP development priorities
Figure 1 (page 5) summarises the key influences feeding into the themes which have been drawn from the participating LEP priority development agendas. The commentary on the thematic drivers derived from each data source will consider how these influences may be affected:
• Supply chain assessment and capacity building;
• Opportunities to innovate;
• Smart, flexible grid development;
• The skills agenda.

16
6 Characteristics of the networks
6.1 Electricity transmission network
Map layers 400kV and 275kV substations and Electricity transmission network illustrate the layout of the National Grid (NG) electricity transmission circuits. There are no 275kV circuits in East Anglia, though two exist in Hertfordshire on the London border.
Circuits are generally doubled between substations, but from Sizewell nuclear power station in Suffolk to the Bramford substation near Ipswich, lines are quadrupled. Map layer Offshore wind farms shows existing and planned offshore wind sites. Existing wind farms and mostly connected to the distribution network, while future sites are planned to be connected to the transmission network.
Key markers from NGET in its most recent Electricity Ten Year Statement include:
• It expects to assess around 80 transmission system reinforcement options in 2018, under the Network Options Assessment (NOA), and anticipates more complex requirements placed upon the system due to impacts from electric vehicles, battery storage and heat pumps
• There will be a legal separation of the electricity system operator (SO) role within National Grid. This should result in new tools to help with industry feedback in the National Electricity Transmission System planning process
To illustrate the projected changes in power flows, Figure 7 and Figure 8 show snapshots of the winter peak along major circuits, and additional infrastructure that is expected to be added from 2017/18 to 2026/27 in the East Anglian region. Figure 7: 2017/18 status of East Anglian electricity transmission system
Source: NGET Electricity Ten Year Statement

17
Figure 8: 2026/27 status of East Anglian electricity transmission system
Source: NGET Electricity Ten Year Statement
NGET, as SO, develops its Future Energy Scenarios in order to help plan for anticipated changes in the future energy landscape for electricity and gas. Of the four scenarios developed in 2017, two lead with decarbonisation agendas – Consumer Power and Two Degrees – that reflect the urgency of this requirement. The other two consider a focus on security of supply and a less progressive long term environmental strategy).
Both the Consumer Power and Two Degrees scenarios imagine a large increase in installed renewable energy capacity: up to 110GW, or 60% of total generating capacity, by 2050 in the case of Two Degrees. The Consumer Power scenario suggests that renewable energy technologies could account for 93GW, or 50% of total installed capacity.
These scenarios will impact the four key themes of this commentary through job creation, energy entrepreneurship and innovation, local supply chain capacity and skills, for example. Of the nine administrative regions in England, the East of England region is already in the top three for providing renewable energy from distributed generation, as shown in Figure 9. Figure 9: Comparative indicators for renewable energy capacity and production in England in 2016
Rank Number of sites Installed capacity MWe Generation GWh all sources
1 South West 113,166 Yorkshire & Humber 3,880.6 Yorkshire & Humber 19,315.3
2 South East 102,369 East of England 3,743.8 East of England 81,56.9
3 East of England 97,258 South East 3,536.7 South East 7,450.2
Source: BEIS

18
6.2 Electricity distribution network
UKPN is the Distribution Network Operator (DNO) of the Eastern Power Network (EPN)region. Its circuits end at the border with the East Midlands region, which is the responsibility of Western Power Distribution (WPD). In the south, EPN borders another UKPN network, the London Power Network (LPN). Other distribution networks have similar responsibilities and face similar challenges to EPN.
NGET’s grid supply points (GSPs) pass power to the EPN distribution system across the East Anglian region. It operates at several voltage levels, indicated by various map layers: 132kV (132kV substations), 33kV (33kV substations), 11kV (unmapped) and 240/400v (unmapped).
132kV substations in the EPN region include Norwich Main, Walpole, Burwell, Eaton Socon, Sundon, Wymondly, Pelham and Bramford. 33kV Substations – often but not necessarily co-located with the larger 132vK substations – feed a wider geographic area.
There are also 132kV substations marking the boundaries of the EPN 132kV networks and provide the main supply to regional towns such as Diss, Thetford, Swaffham, Stowmarket, Wickham Market, Huntingdon, Kings Lynn and others.
From 33kV substations, EPN distributes to hundreds of local substations at 11kV, providing the mainstay of supplies into housing or commercial developments in the LEE area. They are also the main recipients of upward power flows from small- and medium-sized distributed generation equipment. Larger generators will connect though 33kV substations or occasionally to 132kV directly.
Business-as-usual design and operation of the distribution network is achieved by:
• Asset reinforcement to ensure equipment has sufficient capacity to deliver adequate quality power under normal and fault conditions
• Facilitating rapid transfers from normal to back-up operation of equipment and additional back-up routes
• Extensive remote control and monitoring of the high voltage network
• Maintaining equipment reliability through diagnosis, testing or asset replacement
Emerging challenges flagged by UKPN in its Long Term Development Statement for the EPN region include the loss of night-time load from the increasing penetration of gas heating systems, increasing summer load from air conditioning and cooling equipment, and the growth in demand from electric vehicle (EV) charging. By 2030, UKPN forecast that there could be connection of 1.2 to 1.9mn EVs across its three licence areas (EPN, LPN, and the South Eastern power network (SEPN)).
UKPN has been receiving an increased level of enquiries to connect distributed generation (DG) to its EPN network: map layers Low carbon generators >1MW, Low carbon generators <1MW and Feed-in Tariff Aggregation. Distributed Generation (DG) can be an advantage to the security of supply if actively managed and adequate protection is available. As the DNO transitions to become a Distribution System Operator (DSO), it becomes more actively involved in local and regional balancing across its circuits. This includes programme such as Flexible Distributed Generation Connections, which introduced non-firm connections to allow DG to connect more rapidly and with less expense, by allowing the DNO to constrain the generator off the network a few days a year due to system stress.
By directly supplying some of end users’ demand by DG, the overall load on the regional network is reduced. Technical challenges remain in regulating power factors and voltage, fault levels, losses,

19
thermal overloads, and real-time variability of bi-directional power flows which may be responding to market price signals.
There are currently six Active Network Management zones in the EPN area, as shown in LLSOAs and Network Info:
• March and Peterborough – 15 schemes
• Norwich – 8 schemes
• Walpole East – 85MW accepted generation over the next 18 months
• Maldon-Fleethall – global network constraints
• Great Yarmouth – manages reverse power flow on five super-grid transformers
• Burwell – manages multiple global network constraints by automatically constraining participating distributed generator outputs to maintain circuit safety
These active management areas are found where the distribution network has limited capacity, and participation in active management can offer a faster and cheaper route to connect new DGs.
The recent uptake in Distributed Energy Resources (DERs) – which include flexible loads such as electricity storage and thermal devices as well as generation – offer the potential to help UKPN manage its network. In some cases, it will be able to avoid the need for reinforcement and constraint of generation.
This will also be part of the transition it undertakes from a DNO to a DSO and involve tighter coordination with regional and local energy markets. From this there will be increasing opportunities to realise value for flexibility service providers, in the form of generation and demand side response (DSR).
Map layer Flexibility service requirement areas identifies areas around Brandon and Harpendon that UKPN has identified as requiring flexibility services to manage the grid, facilitating further economic development and avoid network reinforcement.
It is likely that, in the absence of physical network reinforcement, more areas on the map will require both active network management and flexibility services in the future, as a greater amount of assets on both generation and demand-side are connected. Reflecting the need for flexibility services, NGET reports that electricity storage asset capacity nationally totalled 4GW in 2016 but could add a further 2GW by 2020.
UKPN provides data on its networks, which shows which areas currently offer its active management service, allowing connection of DG where it would ordinarily not be possible with grid reinforcement. This is replicated for our area in map layer Network Information.
6.3 Conclusions for the electricity system
Peak demand for electricity on the GB system could be around 85GW in 2050, compared to around 60GW today; EPN currently (2016-17) has peak demand of around 6.4GW. Increasing peak demand is driven by a number of factors, including the charging of electric vehicles, domestic battery storage, cooling and air-conditioning systems and heat pumps displacing gas, oil and biomass heating appliances.
These changes will add complexity at all scales of the system but could also indicate important opportunities for a regional energy economy that strategically aligns with, and potentially leads, in the national decarbonisation effort.

20
For example, smart management and local balancing of regional and local energy systems can return value to small energy generators and service providers – as well as local consumers – that have not previously been accessible for regulatory and technological reasons.
The impacts upon the four thematic drivers from the above commentary on the EPN distribution system could be summarised as follows:
• Housing and commercial developments must be weighed against the availability of sufficient network capacity to energise loads. In areas of known constraint will require commitment to flexibility:
o In the Hertfordshire area, capacity is available around Luton, Welwyn Garden City and St. Albans, deliverable from the 132kV network. But in most other areas within the target LEE area, this is not available;
o With the predicted increase in power flows on the NG super-grid, particularly as new windfarms are commissioned, the possibility of an even greater emphasis on flexibility and active network management of UKPN wires is likely, in the absence of reinforcement from the highest voltages downwards. Direct supply from DERs and local energy systems could mitigate this impact.
• As the shift to a non-gas economy for heating and commercial processes begins, looking out to 2030, the demand for electricity will increase, adding emphasis to the above. There may be a growing opportunity for a hydrogen economy to mitigate the direct pressure on gas to electricity transition:
o There will likely also be increasing requirements for air-conditioning, cooling and refrigeration as regional air temperature variation rises to more extreme levels, adding to predicted additional electricity demand.
• Transport electrification is happening and is part of the additional load composition. It will be important to plan-in EV charging infrastructure as part of the requirement for economic development, particularly at the economic growth sites highlighted in map layers.
Enterprise Zones and Park & Ride locations
o Vehicle-to-grid (V2G) solutions may be able to assist in network balancing and offer a mobile source of domestic energy storage or be aggregated to provide grid services.
o The rail network could be included in a wider understanding of how to minimise network loading, as diesel trains are replaced with battery-electric or hydrogen fuel sources.
• With increasing pressure on network owners to provide adequate capacity, taking the option to reinforce circuits will be costly to customers. This will have a negative impact on domestic energy affordability:
o DGs and DERs open increasingly attractive possibilities for direct supply from local generators, including peer-to-peer and neighbourhood generation and storage, heat networks, microgrids and municipal scale systems. Peer-to-peer transactions may allow direct access to local low-carbon generators for domestic consumers;
o Tariffs may vary more widely in the future as smart technologies are increasingly employed to actively manage circuits. An emerging underlying requirement for making domestic energy secure and affordable are local energy markets but this will require changes to the regulatory regime to be realised;
o Housing developers, in addition to building more thermally efficient dwellings for both heating and cooling, could be encouraged to plan community-wide energy solutions that

21
address direct supply, storage and EV systems. These can offer a measure of community self-support to lessen the impact on the wider electricity network and its consequences.
6.4 Gas transmission system
Map layers Gas transmission network and Gas sites illustrate the layout of gas National Transmission System (NTS) pipelines in East Anglia. Primarily, these run from the Bacton gas entry point in Norfolk into the country, with main channels stretching west towards the Midlands and south west towards London.
Map layer Fossil fuel power stations identifies the location of major natural gas loads, in the form of Combined Cycle Gas Turbine (CCGT) power stations connected to the NTS. The Five Oaks Power Plant in Suffolk, a 9MW diesel installation, is also identified.
According to the NGG TEC register, consent has been approved for an additional 1300MW gas-fired power station (Kings Lynn B) to come online in the next 3 years. This could add to the air pollution burden already established in this area, map layers Air quality management areas and CO2 emissions.
As gas supplies from the UK Continental Shelf have declined, GB now imports 55% of its gas. GB is dependent on sources from Norway, continental Europe and the world market, the former piped and the latter delivered as Liquefied Natural Gas (LNG).
Imports could be as high as 75% in three of the NG Future Energy Scenarios by 2050. In addition, the magnitude of within-day gas stock swings have almost doubled over the last 20 years. Increasing demand from existing and new gas-fired power stations and export to Ireland is adding to the challenge for the System Operator to meet contractual pressure agreements to customers across multiple regions, according to its Gas Future Operability Planning.
If these intra-day swings persist at the Bacton gas terminal, NGG is concerned that it may not be able to deliver contracted gas pressures at nearby offtakes from 2025, at all demand levels. This could question the on-going viability of natural gas fired generators in East Anglia.
In turn, this could threaten the stability of a concentrated renewable generator local power supply. This challenge brings into focus the priority of developing local resilience, possibly through a flexible local energy economy.
Bacton gas terminal is responsible for gas imports from continental Europe and helping to meet increasing demand level volatility, which could rise in 2050 to about twice the peak levels experienced in 2017. According to NGG this would mean an ‘operability solution’, which could impact on East Anglia, is required to transport sufficient gas away from Bacton to the rest of England without breaching asset pressure limits from 2025 to 2030.
Together with these challenges, gas infrastructure is ageing, some upstream facilities and storage have or will close – in particular, GB’s only large gas storage facility at Rough Undertakings is due to close – and demands upon it are changing. The reliance upon gas as a ‘transition fuel’ to a lower carbon energy system is driving the need for the gas system to become more flexible, as gas peaking plant currently couples closely to the output of intermittent energy sources, primarily wind and solar generators.
Demand variability may therefore be expected, and market pricing signals will drive power flows as well. The growing market for energy services to aid in balancing should mitigate these.
Despite its current importance, the future for natural gas is uncertain. Gas supplies more than half-again as much of final energy use compared with electricity: 34% compared to 20%. In the Eastern region, this is proportion is slightly lower, at 32% compared to 21%, and with more petroleum use

22
(see Figure 10). NGG predicts it could still provide more energy than electricity in 2050 due to its role as a transition fuel to a lower carbon future. Figure 10: Final energy consumption by fuel for Great Britain (outer ring) and East of England (inner ring)
Source: BEIS
However, an opposing outlook for 2050 is put forward by the UK Energy Research Centre in which gas usage will drop to about 10% of what it was in 2010 (see Figure 11). This is founded on the assumption, following the government's decision to remove development funding in 2015, that there will be no carbon capture and sequestration (CCS) plant deployed to remove greenhouse gas emissions from gas-fired power stations much before 2035.
32%
21%2%0%
43%
2% 34%
20%1%2%
39%
3%
Gas Electricity Coal Manufactured Petroleum Bioenergy & waste

23
Figure 11: Forecast future gas UK consumption to 2050 under three scenarios
Source: UK Energy Research Centre
A small-scale CCS demonstration is progressing in North East Scotland and suitable alternatives could be imported if developed elsewhere. As a consequence, the cost of building new gas-fired power plants may become uneconomic, as they will be forced to limit running to low load-factors in order to conform with carbon reduction targets out to 2050.
Taking the conclusion from UKERC's work and the concerns expressed by NG, in a context where new forms of renewable energy, energy storage and smarter, more efficient subsystems continue to come on-stream, the economic viability of natural gas power stations could be limited to the 2020s.
If this were the case, it would put pressure at a macro level upon East Anglian stakeholders to start to plan for greater resilience and smart local management of its regional energy supply. A key enabler in this process is the availability of biomass, which is already being utilised in digesters to create bio-methane to drive Combined Heat and Power (CHP) generators; existing engines are mapped on layers CHP plants and Major heat loads.
This data tells us that significant amounts of existing concentrated or industrial heat load is not being met by CHP units, which could pose interesting opportunities with respect to the development of lower carbon domestic and commercial developments on heat networks. See also map layer Mains connected gas households, which indicates areas where the gas network is less extensive.
In 2016, NGG announced the Customer Low Cost Connection (CLoCC) project. This is intended to reduce the cost and time taken for customers to connect to the NTS from three years to one year. In a future where the gas distribution network contains hydrogen as well as natural gas, NGG suggests that CLoCC will provide developers with an affordable and timely route to NTS connection.
In order to gain forward insight other factors to consider within the complex gas-energy scenario include: the decarbonisation of mains gas; through hydrogen injection into natural gas and gas reformation into pure hydrogen; the renewability of gas sources, through biomethane and bio-substitute natural gas; and the connection to gas or otherwise of domestic and commercial

24
customers to facilitate comfort and economic development, which is addressed in the next section on the gas distribution network.
Alternative sources of gas include the opportunity to exploit shale gas, which is being tested in Lancashire, and is supported by supplies from sand mines in East Anglia. However, UKERC conclude that a strategy to extend the usefulness of fossil fuel gas in this way is likely to be short-lived and more expensive than the alternatives such as the deployment of CCS systems.
In addition, a recent study by the National Centre for Biotechnology Information concluded that shale gas ranked between fourth and eighth relative to other electricity options, as well as requiring a 329-fold reduction in environmental impacts to become sustainable.
6.5 Gas distribution system
Issues connected to the gas distribution system concern the urgent challenge to decarbonise domestic heat, which accounts for approximately 20% of national carbon dioxide emissions. See map layer LLSOAs and gas connected households, which sets out connected domestic gas connections: note that blank areas have no gas connected households. Around 12% of households in the LEE area are not connected to the gas grid.
The provision of domestic comfort at an affordable level - see map layer Fuel poverty which highlights areas where the affordability challenge is above average – and tightening relationship between DERs, in the form of CHP engines, and the gas supply, shown in map layer CHP plants.
BEIS’ DUKES energy study showed that gas accounted for 65% of total domestic primary fuel use compared with the use of coal, petroleum, electricity and bioenergy in 2016, and domestic gas consumption accounted for 51% of national demand. According to the Committee on Climate Change (CCC), 1 in 20 homes with a gas boiler could join a heat network and save 2 tonnes of CO2 per annum. In 2015, DECC assessed that 98% of domestic CO2 emissions came from space and water heating with cooking accounting for the remaining 2%.
Various lower carbon options can be considered as alternatives to the gas-fired domestic boiler, as set out in Figure 12. Some of these will also address those properties not connected to mains gas. These measures should be considered in addition to building fabric thermal improvements for existing stock and future developments in order to reduce overall demand for heating and cooling services. Figure 12: Relative carbon footprints of different heating technologies
Non-electric technologies Carbon footprint
gCO2e/kWh Electric technologies
Carbon footprint gCO2e/kWh
Oil boiler 310-550 Electric heaters 100-370
Gas boiler 210-380 Ground source heat pumps 20-190
Gas micro-CHP 220-300 Air source heat pumps 30-250
Gas absorption heat pumps 150-200
Note: The range of carbon footprints given above are derived from different electricity generation scenarios involving a varied fuel mix.
Bio-sourced gases 20-100
Biomass boiler 5-200 (most below 100)
Geothermal heating 10

25
Solar thermal 10-35
Source: Houses of Parliament
As shown in map layer Gas connections, gas connected domestic properties follow the route of the gas transmission pipelines, although these do not form contiguous corridors of connections.
A review of this layer and layer Fuel poverty suggests a correlation between those in the most extreme fuel poverty – an area extending in an arc from Cromer in North Norfolk around to Lincolnshire – where the majority of households are unconnected to mains gas. As part of the shift to a non-fossil gas, carbon-reducing economy, this would suggest that measures for domestic heat provision described in Figure 12, as well as heat networking where feasible, should be applied to offer affordable and secure energy.
Those areas where CHP units with surplus heat are located – as shown in Combined Heat & Power and District Heating – could be investigated as a viable heat source for a local district heating network.
Cadent, the Gas Distribution Network Operator (GDNO) for East Anglia, the East Midlands and North London, has estimated in its Long Term Development Plan that the potential for renewable gas from waste and biomass feedstocks is enough to meet 50% of the domestic gas demand, or the equivalent supply to all the homes in the south of England.
Since 2013, 28 biomethane plants have been connected to Cadent’s distribution network, providing capacity to heat over 110,000 homes. Biogas plants may also be available to East Anglia beyond 2018 if the current joint venture run by Cadent and National Grid to demonstrate gasification of residual domestic and commercial waste is successful. Existing plant is included in map layer.
Combined Heat & Power
This gas could be directed towards a renewable transportation fuel, by injection into the gas network, compressed and dispensed from service stations for commercial vehicles. CNG is another commercial transport fuel vector under consideration that will address the 25% contribution road transport makes to national greenhouse gas emissions.
Looking further ahead, Cadent are working with the government to establish a hydrogen economy that delivers hydrogen through the gas distribution network for domestic heat and transport.
Forward projections to 2026 by Cadent for the East Anglian Local Distribution Zone (LDZ) project a growth reduction in gas equivalent TWh demand of around 0.5%.
6.6 Conclusions for the gas system
Gas demand in 2016 was up 12.6% on 2015 and reached the highest level since 2011. This was driven both by colder winters and the replacement of coal with gas in electricity generation.
Coupled with the decision to ban new diesel and petrol cars from 2040, we may see new opportunities for gas demand to rise. Despite the upward trend in peak demand, the actual volume of gas being burned is decreasingly primarily because of improvements to domestic gas boiler efficiency.
There still remains a strong drive to connect new customers, with more quotes for connections in 2016 (16,000) than 2015 (13,500). Marking the effort to decarbonise gas in the Cadent service areas has been the growing number of biomethane plants and anticipation of injections from biogas, hydrogen and shale gas.

26
With most of the investment over the next three years by Cadent in its East of England networks directed towards >7Bar Pressure Reduction Stations and <7 Bar Governors – as well as pipelines and offtakes – we can anticipate the further spread of its networks to connect domestic and commercial properties.
An example of this development is south of the Wootton network, but Cadent’s largest priority is meeting the housing development requirements in the Silverstone and Towcester areas on the far side of Milton Keynes, outside our area.
• Housing and commercial developments should consider the alternative options for heat requirements discussed above, especially in areas to which the gas network does not currently extend:
o A whole systems approach optimising solutions to meet the need for power, thermal efficiency and decarbonised heat is in line with wider national aims and could potentially benefit from the biomass and waste availability in East Anglia;
o The same approach could apply to the siting of future enterprise zones.
• The shift to a non-gas economy could be read as a non-fossil gas economy. It is clear from gas operator reports that gas is here to stay as a prime mover for the foreseeable future, and even fossil gas could have an extended future with the successful outcome of CCS development projects such as the Acorn project in Scotland:
o In the short to medium term we are likely to see an increase in bio-methane and biogas injections and following that possibilities exist for pure hydrogen transport through the gas distribution system;
o These possibilities place agricultural East Anglia well for developing an alternative fuel gas supply market as is in evidence already from map layer Major heat loads. It also poses potential solutions to off-grid heat requirements fed from bio residues and waste.
• Electrification of transport may be supplemented by CNG powered commercial vehicles such as were already in evidence from 2013 at Anglian Bus’ Beccles depot:
o Domestic transport is likely to heavily rely on electricity but also hydrogen if sufficient fuelling infrastructure is made available;
o Germany has started to trial hydrogen powered trains, as has Japan, which may offer Anglian railway operators a viable option to decarbonise heavy diesel branch line rolling stock across the LEE area.
• Secure and affordable domestic energy must again be linked to whole system optimisation and is context specific. There are however multiple options for solutions and willingness to work innovatively in the electricity and gas distribution utilities serving the LEE area:
o Flexibility, which may include Demand Side Response (DSR), local energy generation (direct supply, CHP) and local energy trading and collaboration (heat networks and microgrids), should be on the future agenda as domestic and commercial community planning priorities for greater local energy resilience and demand reduction.

27
7 Existing and planned situation
7.1 Housing and commercial growth sites
Broadly speaking, there is considerable capacity available to connect both generation and demand users in the Hertfordshire area, particularly in the south of the county. The network then grows more constrained across the rest of the EPN region, leaving both Cambridgeshire and Peterborough LEP and New Anglia LEP areas with much less capacity available for future growth.
UKPN typically allow a 2kW connection per domestic property. This means that a large development will require additional connection capacity in the megawatt range, ignoring potential increases in this potential demand caused by EV charging and electric heating.
However, we understand that developers are starting to increase their power demand requirements, and some are requesting 5-6kW – or up to 12kW on occasion – per property. This is a response to be expected peak power demand of heat pumps and EV charging.
7.1.1 New developments
New Anglia LEP
Developments in Norfolk concentrate on the Greater Norwich area, with expansions to many villages and at least one new dormitory village planned. Considerable development along the route of the Northern Distributor Road (NDR) – opened earlier in 2018, around the north of the city –is also expected. In Suffolk, development will focus on the large towns of Ipswich and Lowestoft.
The network in the area is highly constrained for new demand users, and major grid upgrades – or alternative solutions – are required at otherwise promising economic and housing development sites.
• c.13,000 homes on the new NDR, as well as businesses. The area is known to be electrically constrained. Although there is a limited amount of capacity available at local 33kV substations (Sprowston Primary, George Hill Primary, Boundary Park Primary and Horsford Primary), these are 1km or more away through built-up areas and unlikely to be able to support major development without major investment
o Norwich’s GSPs are to the south of the city and are being worked on to support the connection of extensive offshore wind generation capacity. Building new substations along the NDR is likely to be an expensive proposition
• Great Yarmouth Borough Council is planning 7,000 new homes in the town before 2030. Capacity is available the Magdalen Way and Bradwell 132kV substations to the south of the town, as well as the 33kV substation in the heart of the town but Caister Primary which supplies to the north is significantly constrained
• Sizewell C nuclear plant. Major infrastructure upgrades will be required to connect 3.2GW of new nuclear to the National Grid will be paid for by the developers. However, the shift of electricity from a north-south trajectory to an east-west trajectory may open further opportunities for energy users around the old route – which may have spare capacity – and the new route
• Lowesoft is expected to grow by around 4,000 homes, alongside services and new businesses; the local 33kV substation (Whapload Road Primary) is reported to have demand capacity

28
available, however the 132kV substation is constrained and therefore in the medium-term there may be an upgrade required to support additional development
• Sproughton commercial development site just outside Ipswich. This major development site is highly constrained and needs an expensive grid upgrade which may render the development uneconomic, requiring c.£5mn for a new substation. A nearby housing development may suffer similar issues
• 1,050 homes in the Slade Woods area, to the south west of Bury St Edmunds. UKPN report available demand capacity at the local 33kV substations (Boxted Primary or Glemsford Primary), though it should be noted that the former is around 4.5km distant, and the latter over 6km
• 782 homes at Chilton Leys, near Stowmarket. There are multiple 33kV and one 132kV substations in the vicinity (within 3km), but UKPN report limited demand capacity available in the area
• 566 homes on Helena Road in Ipswich. UKPN reports significant capacity available on local 33kV substations (Fore Hamlet Primary and Turret Lane Primary). The site is around 1.2km from the Cliff Quay GSP
Cambridgeshire and Peterborough LEP
Cambridgeshire has plans to build around 33,000 houses in the short term, in addition to large scale commercial expansion. LAs and developers are already finding that problems accessing electric connection capacity are endemic throughout the county, despite prolonged investment from UKPN. Plans include:
• Cambridge City Council’s ambitions to install electric vehicle chargers in the centre of the city to support an objective of requiring taxis to be electric-powered have been delayed by a lack of capacity, though we understand that UKPN has been able to assist with this more recently;
• The South Cambridgeshire Cluster is a group of 10 companies seeking around 90MVA of additional electrical capacity to the south of the city over the next 10 years. The area has little existing capacity and to meet the requirements will cost at least £50mn and likely significantly more;
o 4,000 houses planned in the same area will require around an additional 8MVA of capacity, which again will cost in the tens of millions to install.
Hertfordshire LEP
The Hertfordshire LEP area is unlike New Anglia LEP and Cambridgeshire and Peterborough LEP in not suffering endemic constraint. This means that planners in the area have more flexibility in siting developments or will not have to invest so heavily in network upgrades. Plans include:
• Over two and a half thousand houses to the north west of Bishops Stortford. This is in the immediate vicinity of the local 132kV substation, which reports significant capacity available. However, a new 33kV substation may be required in any case to provide power at a useful voltage. The local 33kV substation is around 600m south and has some capacity available;
• 1,365 new homes to the west of Stevenage. These are in the immediate vicinity of both the 132kV and 33kV substations, both of which have available demand capacity;
• 1,664 homes, of which 1,264 are planned before 2021, on an ex-commercial area in the centre of Welwyn Garden City. This location is very close to the Central Welwyn Primary 33Kv substation, which reports significant available capacity;
• 951 new homes in the north-east of Stevenage; local substations are around a kilometre away but report no constraints.

29
Rutland
• Rutland suffers from demand constraints in the north and east of the unitary area, due to the Tinwell Road 33kV substation near Ketton.
• The rest of the area is relatively unconstrained, with considerable demand capacity available on the 33kV network.
South Lincolnshire
• WPD’s network capacity mapping tool shows that there is substantial demand capacity available across the South Lincolnshire area, with the exception of Stamford. A corridor from Ketton to Crowland, through Stamford along the WPD-UKPN border is highly constrained for demand capacity on both the 132kV and 33kV networks, which will limit development in the area
Uttlesford
• Both of the 132kV substations, located in the north of the LA area, show available demand capacity.
• Of the 33kV substations, the Takeley substation near Stansted airport is constrained, though the Hanger Lea and Thorley substations just over the Hertfordshire border may be able to support development around the airport;
o Further east, the Dunmow substations both have demand capacity available;
o The White Roding substation in the south of Uttlesford is constrained.
7.1.2 Distribution connected generation
Typical small-scale distribution-connected generation in the LEE area includes solar farms, onshore wind, and landfill or bio-gas plant, including CHP engines. A number of map layers, including Low-carbon generators (>1MW), Low-carbon generators (<1MW) and Combined Heat & Power show these generators.
The generation is largely exported to the local grid, but generators might find it more economically beneficial to create private wire arrangements with local businesses. This could offer a better price for generation, and lower energy costs to the business. However, we note that network charging is a zero-sum game, and charges avoided by these businesses will fall on other users.
It should be noted that while, with the exception of the Cambridgeshire area, the incidence of onshore wind is low, it may be regarded as one of the more useful renewable technologies. Unlike solar, which generates at peak in the summer daytime, wind generators peak during winter evenings, which correlates more closely to GB peak demand.
UK Power Networks
Map layer LLSOAs and Network Info indicates the more and less constrained areas for developing new distribution-connected generation assets. This indicates that new generation can be connected to the distribution network in most of Hertfordshire, but other areas are constrained. The 33kV network is constrained throughout Suffolk and Uttlesford (red areas) and the 132kV network in the rest of Suffolk and west Cambridgeshire (purple areas).
The cyan areas indicate “flexible distributed generation zone” indicates where UKPN offers Active Network Management services. These allow the connection of additional generation to the distribution grid, where ordinarily this would not be possible.

30
This is backed by an innovative commercial arrangement wherein UKPN can require generators to curtail their output on the few days a year it would cause network issues, and considerably reduces the cost and time to set up a new connection.
UKPN has indicated that it will roll this practice out to the rest of its distribution region over time.
Western Power Distribution
According to its mapping tools, the WPD 132kV network is also highly constrained for new generation, although 33kV substations around Grantham, Spalding, Holbeach and Crowland in Lincolnshire do show headroom for additional generation.
Active network management will be available on the Staythorpe GSP – which covers Grantham – for quotes from November 2018 and commissioning from November 2019. It is not due to be implemented on the Walpole GSP – which covers the constrained area around Stamford – until 2021.
7.1.3 Transmission connected generation
The primary site for new large-scale generation capacity in the LEE area is the North Sea. Existing sites – with the exception of the Dudgeon 402MW farm – are connected to the local distribution network at 132kV. Future sites – which tend to be of higher capacity, up to 2.4GW – will be connected to the transmission network at 400kV.
NGET’s Ten Year Development Statement indicates that there will be an additional 7.2GW of offshore wind capacity connected from the East Anglia conglomeration by 2026. This power will be brought ashore by DC cables and connected to the network as indicated below.
Sites include:
• Race Bank. Partially completed, due to connect 573MW of capacity to the Walpole GSP in the King’s Lynn and West Norfolk local authority area;
• Galloper wind farm. Currently under construction and partially completed; intended to connect 353MW to Sizewell GSP;
• Hornsea Projects One, Two and Three. The former two will connect to the Killingholme grid supply point (GSP) in North Lincolnshire, while the third will connect 2.4GW of wind capacity to Norwich Main GSP in the south of Norwich;
• East Anglia One and Two will each connect 600-800MW of capacity, East Anglia One North will connect 800MW, and East Anglia Three will connect 1.2GW, all to Bramford GSP near Ipswich;
• The Norfolk Vanguard and Boreas projects will connect 1.8GW each to Necton.
There will also be an interconnector from Denmark to Bicker Fen substation in Lincolnshire, just outside the LEE area. This will connect Viking Link, a HVDC bi-directional interconnector transmitting up to 1.4GW to or from Denmark. This is expected to commission in 2022.
Other new major generators in the LEE area include the proposed new nuclear site at Sizewell (Sizewell C), which may be a 3.2GW plant on the same model as Hinkley C. It is projected that this will be commissioned in the early 2030s.
7.2 Electrification of transport, including hydrogen
Map layer EV charging points shows the geographical distribution of electric vehicle (EV) charging points across the LEE area. There are around 300 locations in the LEE area where public charging is

31
available, the most prevalent operators being POLAR and POD Point, with 88 and 71 locations respectively.
Charging points are clustered in urban areas, with Peterborough, Norwich, Cambridge and Ipswich having the most points. Hertfordshire, a relatively built up area, also has a relatively large number of charge points, though these are concentrated in the south west of the county, leaving the north east unserved. However, there are very few chargers to support the expected 1.2mn-1.9mn EVs on the roads across UKPN’s three distribution regions by 2030.
Chargers are present on arterial transport routes, but in the same small numbers as in urban areas. Rural areas are also poorly served, though rural residents may have chargers for their vehicles at home as off-road parking is more common in rural areas.
It is known from anecdotal evidence that certain areas are highly constrained against further charger deployment; in particular Cambridge has smart city ambitions focusing on transport but has thus far been unable to deploy sufficient points to allow its plan of requiring taxis in the city to be electric only.
This is a problem nationally, as reflected in the Department for Transport and BEIS’ recent joint call for local authorities to apply for funding to deploy charging infrastructure. The scheme funds residential on-street charging, but the Departments noted that only five councils had applied so far leaving £4.5mn still available.
With the typical fast charging point requiring up to 22kW, the required capacity to connect a small bank of four chargers equates to a connection for around 100 domestic properties. Future chargers requiring up to 150kW for light vehicles and 1.6MW for heavy goods vehicles are in development and will be deployed in the real world as soon as 2019.
7.2.1 Total EV demand
BEIS forecasts that EV electrical demand will rise to 1,768 kilo-tonnes of oil equivalent (ktoe) by 2035. However, predictions for the rate of increase have risen dramatically even over the past few years, as reflected in Figure 13. This reflects the increasing rate at which EVs are being adopted, faster than was originally believed likely. Figure 13: EV electrical demand projections, 2017-2035, made in four years 2014-2017
Source: BEIS
350
550
750
950
1,150
1,350
1,550
1,750
2017
2018
2019
2020
2021
2022
2023
2024
2025
2026
2027
2028
2029
2030
2031
2032
2033
2034
2035
Dem
and
(kto
e)
2014 2015 2016 2017
32
7.2.2 Air quality
Map layer Air quality management areas show locations where local authorities have indicated concerns that they will not be able to meet air quality requirements, due to emissions of, for example, nitrogen dioxide from transport.
Management of these issues may include banning diesel vehicles, buses and heavy goods vehicles in urban areas. This gives an opportunity to engage in electrifying these vehicles. Councils may want to consider electrifying their own medium- and heavy-vehicle fleets, such as refuse collection vehicles.
This could be especially beneficial where councils generate their own low-carbon energy which could be used to charge vehicles at a co-located vehicle depot. As market rates for export of energy are much lower than for import, using self-generated energy considerably improves the economics of generation and operating EVs.
Large air quality management areas in the LEE area are mostly urban and include:
• Cambridge city centre;
• Norwich city centre;
• Ipswich city centre;
• Hertford city centre;
• Wisbech town centre;
• Huntingdon town centre;
• Saffron Walden town centre;
There are also sites on key transport arteries through the LEE area:
• M11/ A428 junction to the north west of Cambridge;
• The A14 north west of the M11, towards Huntingdon;
• The A1184 through Sawbridgeworth;
• Areas on or near the northwest quarter of the M25;
• The A52 through Grantham.
7.2.3 Available capacity – non-domestic
According to National Grid, around 57% of UK drivers have access to off-road parking, leaving 43% without it. These latter individuals will likely be forced to charge electric vehicles away from their homes, on-street charging infrastructure is still in development.
Others may find it more convenient to charge away from home or find it necessary on long journeys: current high-end EV batteries can support journeys of only 300-400 miles. This will require charging points at places where cars are parked.
EU rules provisionally agreed on 20 December 2017 will also require all new or renovated non-domestic buildings with 10 parking spaces to install at least one charging point per 10 spaces, with ducting and infrastructure to enable 25% of spaces to be easily charging-enabled in the future. These rules may not be instituted before the UK exits the EU, however.
Map layers 132kv substations and 33kV substations contain information about capacity available on the local distribution network.

33
Anecdotally, we received information in 2017 that Cambridge City Council is severely inhibited in its aim to install taxi charging points around the city due to a lack of spare electrical capacity.
We anticipate, from the state of the network, that this will generally be the case across the EPN region for the deployment of large numbers of domestic slow chargers in a single location, or small numbers of high-power rapid chargers in a single location.
However, mapping for Hertfordshire indicates that electrical capacity is not a problem across most of that county, allowing more easy deployment of chargers. This is supported by anecdotal evidence from Hertfordshire local authority planners.
7.2.4 Available capacity – domestic
The relatively low power of domestic chargers – between 3.5kW and 7kW – means that unless large numbers of EVs are connected in a small area, the demand of EV charging will be “lost in the noise” of general domestic consumption.
Furthermore, EPN operator UKPN is required under its current price control, which runs to 2023, to make upgrades to the network as required to allow all homes to install an EV charger up to 7kW.
The EU rules mentioned above would require all new and renovated residential buildings to have charging points and/ or ducting and infrastructure for EV charging.
We note, however, the following affluent areas where early uptake of EVs might be expected, and where upgrades to the network may be required in the short term:
• Dacorum;
• Three Rivers;
• St Albans;
• South Cambridgeshire;
• North Hertfordshire;
• East Hertfordshire;
• Uttlesford.
7.2.5 Petrol station forecourts and service areas
The number of forecourts in use nationally has declined from around 14,500 at the turn of the millennium, to as few at 8,500 currently. Many small forecourts have been replaced with fewer, larger ones, with supermarkets becoming a “go-to” location for refuelling.
With relatively few motorways in the LEE area, there are few major service areas. The Baldock Services on the A1(M), Birchanger Green Services on the M11 and Cambridge Services of the A14 are the only major areas. Some electrical capacity is available in the relevant areas, but generation, which could be linked with private wires to offer low-cost and green energy to charge EVs, is not currently significantly available.
• Baldock services, to the north of Letchworth, are constrained on the 33kV network. The 132kV network, which may be more relevant to large-scale installation of high capacity charges, is not constrained. The local 132kV substation is around 2km from the site:
o The only local generator of size is a CHP fuelled by anaerobic digestion, with capacity of 2.3MW.

34
• Birchanger Green services, east of Bishop’s Stortford, are within 2km of three 33kV substations, all of which have some capacity available; the 132kV substation is a bit further away and on the opposite side of the town, but has significant capacity available:
o There are no generators in the immediate vicinity of Birchanger Green, though there are two small landfill gas units on the far side of Stanstead Airport, about 4-5km distant, with combined capacity of 2.1MW.
• Cambridge Services, north of the city, are around 1.5km from the constrained Longstanton Primary substation. The nearest 132kV substation is Histon Grid, about 5km distant:
o There are no generators in the immediate vicinity of Cambridge services; the closest generators are a 5MW solar farm about 6km away, and two landfill gas unit in north Cambridge 6-7km away, with combined capacity of 3.2MW. a further landfill gas unit with 2MW capacity near Huntingdon is slightly further away.
In addition to the large number of currently vacant sites, many more are likely to become vacant, which represents a substantial opportunity for development. Old stations, like most of the closed ones, are likely to be contaminated by fuel which has leaked from degraded fuel tanks, this has resulted in sites being undeveloped for many years, although perhaps as few as 10-20% of sites are actually seriously contaminated.
There may be an opportunity for the LEPs to provide a survey of ex-forecourts and help arrange redevelopment of sites which would otherwise lie vacant. Previous forecourt locations have been redeveloped into commercial, residential and mixed-use properties, with advantageous locations on transport routes.
7.2.6 Other low-carbon fuels
Other proposed future fuels for transport include CNG, LNG, and hydrogen. CNG is typically compressed on-site from a gas-grid connection, whereas LNG is typically compressed offsite at a location with a high-pressure gas connection and transported in trucks to the point of sale.
There are no public fuelling stations for these fuels in the LEE area, and currently no plans to introduce them. However, pairing hydrogen electrolysers with intermittent renewables generation, to minimise constraint and make the best use of local energy, is being trialled in Scotland among other locations and may become an option in coming years, being especially relevant to connecting generation to the network in areas of high constraint.
7.3 Secure, affordable, low-carbon domestic power consumption
Fuel poverty is defined in two ways. The old definition is households spending more than 10% of household income of energy bills. The new definition is households having required fuel costs which are above the national median level and where, if the household were to spend that amount, it would be left with a residual income below the official poverty line. There are several causes of fuel poverty including high fuel bills, hard-to-heat homes and low household incomes.
The best short-term way to tackle fuel poverty is by increasing customer engagement with the energy markets. The cheapest domestic tariffs in the LEE area are around one-third less expensive than the Big Six standard variable tariffs which most disengaged customers will be on. If electrically heating, use of storage heaters and an Economy7, Economy10 or other Time of Use tariff could also be beneficial.
Fuel poverty could be addressed in the long term by a number of measures. Gas is currently the lowest-cost heating fuel in GB and giving customers access to gas rather than electrical heating could

35
save them significant sums. Replacement of the current electrical heating solution with a heat pump would also reduce the amount of electricity used to heat homes.
Treating homes to be more energy efficient and thus require less energy to heat could also cut fuel bills. Returns on investments in insulation vary, but for example the Energy Saving Trust suggests that loft insulation will save a quarter of the energy used to heat a home, costing £300 to fit but saving £135/year in the average semi-detached home heated by gas. Cavity or solid wall insulation is more expensive (around £800 for cavity walls or £8,000 for solid walls) but could save around a third of the energy used to heat the home.
Supporting energy suppliers to install energy efficiency measures funded through the Energy Company Obligation (ECO) could reduce fuel poverty, while helping suppliers meet their obligations. This would also help to meet the government’s targets under the Clean Growth Strategy (CGS).
The CGS requires all fuel poor homes – around 2.5mn – be upgraded to at least EPC band C by 2030; this will for many homes require a move away from traditional electrical heating to gas, heat pumps or storage heaters. The CGS also noted an intention to consult on strengthening the energy performance standards in the building regulations, including low carbon heating systems. This may include heat pumps, biomass, and a specific target on building and extending heat networks.
Furthermore, it should be noted that large parts of the LEE area are not currently connected to the gas distribution grid. Encouraging future housing development to use electrical heating may, in addition to reducing emissions, save the developers considerable sums in obtaining gas connections. Implementing technologies such as heat pumps is considerably cheaper during the initial build of the property than retrofitting onto existing housing stock., and the electrical demand can be accounted for in electrical connections, managing issues before they arise, and will ensure that the necessary level of insulation is installed to make the best use of the technology.
7.3.1 Energy supplier tariffs
See Appendix 1 for a chart summarising tariff prices in the Eastern Region. This highlights the benefit to domestic consumers of engaging with the energy market and switching to a less expensive supplier: cheapest tariffs in the LEE area are around £500/year less than the most expensive, on Ofgem’s typical domestic consumption values.
Selecting the most suitable tariff for the level of consumption is the single most important factor in reducing energy spend. Providing assistance and advice to help more consumers engage with the energy markets could be the most valuable investment in helping large numbers of consumers to escape fuel poverty.
Switching rates vary across the LEE area, as shown in map layer Energy supplier switching rates. Highest is Peterborough, where around 21% of households switched between September 2016 and August 2017. Lowest was South Holland, where just 13% switched. The LEE area average was 16%, compared to a national average of 22%.
Energy tariffs are mainly made up of four elements: the wholesale price of energy (38%), network costs (26%), environment and social obligation costs (8%) and supplier operating costs and margin (22%).
More efficient trading by suppliers and lower wholesale costs can reduce the first element, and more efficient network use and expansion can (in the medium- to long-term) reduce the second. Environmental and social obligation costs cannot be altered, being mandated by the government, though it is worth noting that small suppliers – those with under 250,000 accounts – are not eligible for some of these costs and do not have to price them into the tariffs offered to consumers. However, it should be recognised some of these obligations, such as the Warm Homes Discount, benefit low income customers.

36
Supplier operating costs and margin also tend to be lower for small suppliers, partially due to lack of expensive legacy IT systems and partially due to a tendency for new entrant suppliers to operate at a loss for some or all new customers while building a customer base.
7.3.2 Fuel poverty
In general, the East of England has a fuel poverty rate nearly a third below the national average: 7.8%, versus a national average of 11.4%. However, there are significant clusters of fuel poverty identified in map layer Fuel poverty.
Areas with significantly higher-than-average levels of fuel poverty include:
• The southern area of the King’s Lynn and West Norfolk local authority area: 26.3%;
• West Barsham, East Barsham, Houghton St Giles, Great Snoring and Little Walsingham: 24.7%;
• An area around Swanton Novers, Berney and Fulmodeston: 24%;
• An area from the Wash, through Sandringham and West Newton, Flitcham, and stretching to Great Massingham: 23.9%;
• An area of Breckland around North Elmham, Gateley and Guist: 23.2%;
• South Cambridgeshire around Wendy and Shingay: 22.8%;
• The western Dedham Vale: 22.3%.
Most of these areas are primarily rural in nature, being made up of isolated households and villages.
7.3.3 ECO measures
The Energy Company Obligation (ECO) scheme requires energy suppliers to install energy efficiency measures in the homes of GB domestic consumers. Spending is in the region of £640mn/year, and over 2.2mn households have benefited from installed measures to date. These measures are primarily made up of loft insulation, cavity wall insulation, and solid wall insulation, but also include gas boiler installation or replacement, draught-proofing, double glazing, heat pumps and others.
8.01% of GB households have benefited from at least one ECO measure, but in the LEE area only 5.66% of households have received measures. Suppliers – particularly large suppliers – engage in their own marketing campaigns to source customers to meet their obligations. However, some suppliers – including small and medium suppliers – have indicated a desire to work with local authorities to identify areas to target with ECO campaigns.
Map layer ECO measures identifies several areas where the number of ECO measures is particularly low. Local authorities may find it advantageous to their fuel poverty agendas to engage with suppliers to help residents to benefit from ECO measures. Suppliers, particularly small suppliers, may find it difficult to engage customers to provide measures, and the BEIS ECO3 consultation held in 30 March to 29 April 2018 indicated that search costs for customers ran to £125/customer for those on gas-grids, and £400/customer for those off-gas-grid.
LA areas where lower than average percentages of households have benefited from ECO measures are concentrated to the south of the LEE area. Note that at the granularity we have been able to obtain this information – local authority level – a low number of ECO measures does not seem to indicate a deprived area. As only households receiving income support or benefits are able to obtain ECO support, an area with few measures deployed may in fact be well off.

37
7.3.4 ECO and Fuel poverty interaction
Comparing map layers Fuel poverty and ECO measures, we can to an extent identify areas where local authorities may wish to prioritise ECO measures. These will be areas which suffer from both from high levels of fuel poverty and low levels of installed ECO measures.
North Norfolk District Council and King’s Lynn and West Norfolk District Council may in particular wish to develop relationships with ECO-mandated suppliers. Despite the presence in their areas of elevated levels of fuel poverty, only 5.13% and 6.94% of households respectively have benefited.
7.3.5 Feed-in Tariff
Map layer FiT shows the spread of small-scale FiT generation across the LEE area. The FiT subsidises renewable generation, which includes solar PV, anaerobic digestion, CHP, hydro and wind generation, but is mostly be made up of solar panels on the rooftops of homes and small businesses. Domestic energy generation can alleviate fuel poverty in two ways:
• Reduced cost of energy imports;
• Revenue from exporting energy.
FiT generation can support the deployment of low-carbon electrical heating by defraying the cost of importing energy from the grid. However, it should be noted that the times at which solar PV generates most energy do not align with the times of the day or year at which energy would be needed for heating.
How much households with solar will save by self-generation of energy will depend on the particular consumption profile of the household. Solar generates electricity in a peak forming a rough sine-wave around 12 noon on a daily basis, and around late June/ early July on an annual basis. Those households using energy during summer day-times will therefore use more of the energy they generate than others and save more money.
Typically, GB households tend to use most energy during the morning and the evening, however. This means that the energy generated is mostly spilled to the grid, and more costly energy is purchased by the household in the mornings and evenings. Use of a battery may help to reduce this mismatch but given the low generation potential of solar panels in winter, a household is unlikely to be able to self-supply its own electrical heating demand.
Energy spilled to grid is currently remunerated by the FiT export tariff, wherein 50% of generation is deemed to be exported, and compensated at a default rate by the energy supplier. This rate is currently (post-April 2018) 5.24p/kWh for installations after 1 August 2012, considerably below the average 12-15p/kWh which domestic customers pay for energy imports.
While both solar and batteries are expensive to install, costs have fallen considerably in recent year and are forecast to continue falling: the cost of batteries in particular fell by 60% from 2014-17 and is forecast to fall a further 54-61% from current prices by 2030.
FiT currently subsidises small-scale wind generation as well, and subsidy rates can be much higher (8.46p/kWh versus 4.01p/kWh for generation, for wind up to 50kW and solar up to 10kW). Wind generation times correlate much better to peak domestic electricity demand need than solar panels.
However, according to the Energy Saving Trust, costs are higher, with an average 2.5kW system costing £10,000-19,000 vs £4,000-5,000 for solar. Planning permission is also required, and the turbine needs to stand alone away from buildings, taking up more space. Nonetheless, small- or micro-scale wind generation is currently a viable alternatively for some rural households.
38
It should be noted that the FiT scheme is likely to be closed to new accreditations in April 2019, according to an announcement in the autumn 2017 budget. It is not clear that price parity has yet been reached for these technologies to be deployed on a domestic scale, and it may be difficult to secure offtake agreements (to obtain revenue for power spilled to the grid). This may inhibit the deployment of domestic-scale generation in the short term.
7.3.6 Social housing Feed-in Tariff aggregation
Existing Feed-in Tariff (FiT) subsidised small-scale generation, under 30kW, is highlighted in map layer FiT. Combining this with map layer Social Housing, we can note that there are several areas with large number of social homes but without solar arrays.
Providing solar panels – and possibly also electrical storage units – to these homes is a way of reducing the energy bills of vulnerable tenants. It could also derive additional revenues for the social housing organisation and, in the case of storage units, provide flexibility services to support the national or regional electricity networks.
Local authorities may wish to engage with social housing providers to discuss the benefits this could bring to tenants or review their own housing stock for its solar potential.
7.3.7 Off-gas-grid
In the short-term, gas connections represent a cheaper fuel option than electricity – or indeed oil, wood or biomass – for the majority of users’ heating requirements. However, despite the presence in Norfolk of the Bacton gas terminal, and major gas transmission lines across the area – map layers Gas transmission network and Gas sites – most rural areas are mainly or entirely off the gas grid.
Map layer Gas connections shows the extent of this. These households will use oil, electricity and biomass heating. In terms of saving these customers more and alleviating fuel poverty concerns, as well as wider low carbon ambitions, these rural households would be the obvious initial targets for a push to install renewable heating, deploying district heating, or extend the gas grid. Extending connection of these areas to the grid could offer many fuel poor or otherwise vulnerable customers access to much cheaper energy to heat their homes. This is the principle aim of initiatives such as the Fuel Poor Network Extension Scheme.
Urban areas, including cities and towns, are more likely to be connected to the gas grid, with the exception of areas where there are large numbers of new-build flats – for example Norwich and Ipswich’s riverside developments – where electrical underfloor heating is the normal heat source rather than gas boilers.
7.3.8 Domestic electricity and gas consumption, and carbon emissions
High levels of electricity consumption can indicate several factors, positive as well as negative: lack of gas connection resulting in use of electric heating; hard to heat properties; alternatively, it can be a sign of wealth in the area with larger houses and less concern over minimising use of electricity use and potentially with early adopters of electric cars.
Areas with high electricity consumption are focused in Herts, and wide deviation between median and mean values indicates that there are a relatively small number of well-above-average users. High-consumption areas include:
• The outskirts of Moor Park, Hertfordshire;
• Little Gaddesden, Hertfordshire;
• An area between Chorleywood and Croxley Green, Hertfordshire;

39
• An area between Radlett and Borehamwood, Hertfordshire;
• An area to the north of Hertford.
None of these areas correlates to high levels of fuel poverty. However, some areas of slightly above average consumption, such as the Great/ Little Hormead area and the Cottered, Throcking and Westmill area, both in East Herts, do correlate noticeably to fuel poverty. Both areas are also entirely off the gas grid.
Carbon dioxide emissions (CO2) are shown in map layer Carbon dioxide emissions. In aggregate, the data measures total emissions from industry and commercial users, domestic users and transport users at the local authority level.
Domestic emissions
Domestic CO2 emissions average 195.1kt/CO2 across the local authority areas, with a high of 284.9kt/CO2 in Peterborough and with a low of 72kt/CO2 in Rutland. Emissions are above 280kt/year in three areas: Peterborough, Huntingdonshire (281.2kt/CO2) and King’s Lynn and West Norfolk (280.8kt/CO2). Emissions are below 140kt/CO2 in three areas: Stevenage (124.2kt/CO2), Forest Heath (102.1kt/CO2) and Rutland.
Domestic emissions per capita are in line with the national average, 1.7t/CO2/person compared to 1.69t/CO2/person.
Domestic gas
Looking at just domestic gas emissions, these vary between 1.2t/CO2/person and 0.6t/CO2/person, with an outlier of Mid Suffolk, at 0.4t/CO2/person. Three Rivers, St Albans and Hertsmere have highest gas-related emissions per person, and Forest Heath, North Norfolk, South Norfolk, King's Lynn and West Norfolk, and Breckland all have lowest.
Looking at emissions from other domestic fuels – including coal, biomass and fuel oil – urban areas cause relatively little: Three Rivers, Norwich, Broxbourne, Stevenage, Cambridge, St Albans, Welwyn Hatfield, Hertsmere, Watford and Ipswich are all under 0.05t/CO2/person.
Areas already identified as suffering high fuel poverty and being off the gas grid have relatively high levels of other domestic fuel emissions: Mid Suffolk, North Norfolk and King's Lynn and West Norfolk all have emissions per person of over 0.5t/CO2/person, ten times as much as the urban areas.
7.3.9 Renewable Heat
The Renewable Heat Incentive subsidises installation of renewable heating technologies in both domestic and non-domestic properties. The scheme subsidises non-domestic installations for 20 years and domestic for seven years.
Modern electric heating, in the form of heat pumps, is relatively rare in the LEE area: the latest statistics on the Domestic Renewable Heat Incentive, which subsidises heat pumps, shows just 4,823 air-source and 869 ground-source heat pumps in the East of England region at the end of March 2018.
The scheme also subsidises solar thermal and biomass installations; there are 844 of the former and 861 of the latter. Both technologies offer relatively low-carbon heating, but the latter also benefits from easier installation and wider compatibility with existing central heating setups.
Broken down by local authority area (the lowest granularity of data available), installations tend to be concentrated in the more rural areas. For example, in Cambridgeshire the 1,073 total installations include 523 in South Cambridgeshire, compared to 41 in the city itself. This may align with the

40
prevalence of connections to the gas grid, with those who have gas available being less likely to take up these new technologies.
It should be noted that many homes, especially rural, solid-walled properties, may not have the level of insulation required to make best use of low-temperature heat pump heating. Heat pumps are best installed at the time of construction, when the correct level of insulation can be built into the property, and ground-source pipes installed without damage to gardens. Figure 14: RHI-subsidised installation by Local Authority (March 2018 data)
County LA No. of installations
Cambridgeshire County total 1,073
Cambridge 41
East Cambridgeshire 142
Fenland 176
Huntingdonshire 191
South Cambridgeshire 523
Essex Uttlesford 151
Hertfordshire County total 779
Broxbourne 8
Dacorum 126
East Hertfordshire 130
Hertsmere 38
North Hertfordshire 304
St Albans 85
Stevenage 13
Three Rivers 32
Watford 10
Welwyn Hatfield 33
Norfolk County total 2,089
Breckland 349
Broadland 253
Great Yarmouth 104
King’s Lynn and West Norfolk
493

41
County LA No. of installations
North Norfolk 445
Norwich 30
South Norfolk 415
Suffolk County total 1,710
Babergh 209
Forest Heath 195
Ipswich 21
Mid Suffolk 314
St Edmundsbury 180
Suffolk Coastal 285
Waveney 506
Lincolnshire
South Holland 190
South Kesteven 210
Source: BEIS
7.3.10 Biomass heating
Biomass boilers for domestic use can be eligible for support under the RHI. This may make them attractive options for powering central heating in off-gas-grid areas, especially as they are regarded as low-carbon.
The LEE area benefits from extensive foresting around Thetford, which could become a source of local biomass for fuelling boilers. The Brandon and Elveden Forest Plan 2017-2017, consulted on 11 September to 8 October 2017, indicates that some 1,430 hectares of Forestry Commission land is available for biomass, with areas due for logging over the next ten years.
While biomass can be a relatively flexible, low carbon and low-cost solution to off-gas-grid heating for many homes, emissions of particulate matter mean that air quality management areas are unsuitable locations for new installations.

42
8 Future developments
8.1 Housing and commercial growth sites
Targets across the three LEPs are for 144,000 new homes in New Anglia by 2036, 156,000 in Cambridgeshire and Peterborough over the next 10 years, and 16,500 new homes in Hertfordshire. New Anglia is also targeting 88,000 new jobs and 30,000 new businesses by 2036. Hertfordshire is targeting 11,000.
8.2 Electrification of transport, including hydrogen
8.2.1 National Grid forecasts
National Grid’s Future Energy Scenarios document looks ahead to 2050, forecasting that 90% of cars sold will be electric by this time. since publication, the UK government announced a ban on ICE car sales in 2040, so NG’s forecasts will of necessity by out, but provide a solid baseline nonetheless.
NG notes that, if uncontrolled, EV charging could add 18GW, or 30%, to peak electricity consumption. This is based on 25mn EVs and 200,000 heavy-duty goods vehicles by the early 2040s.
8.2.2 National Grid’s forecourt thoughts
NG forecasts current 3.5kW and 7kW home chargers will be replaced by 2040 with 11kW chargers, which it sees as a sensible compromise between speed of charge and remaining within the typical domestic 60-80amp maximum demand. An 11kW charger could charge the currently typical large EV battery from 25% to 90% in 6 hours, as opposed to the 19 hours a 3.5kW charger would take.
It expects, however, that much charging will be done on the forecourts of what were previously petrol stations, where chargers as large as 350kW could provide a similar level of charge in as little as 12 minutes. With the typical forecourt forecast to have nine pumps in 2050, NG calculates that a 3.1MW connection would be needed: enough to supply 1,000 domestic connections.
Large forecourts with up to 20 pumps are also becoming more common and would require connections of 7MW. Both of these connection sizes would need connection to the 33kV or 132kV networks. Also, unlike domestic charging, scope for smart charging would not be available, though on-site batteries might be a possibility to manage peak energy use.
8.3 Secure, affordable, low-carbon domestic power consumption
8.3.1 Fuel poverty
In the immediate future energy bills are perhaps likely to fall, with an Ofgem cap on SVTs recently extended from prepayment customers to Warm Home Discount customers – a wider group of vulnerable households – and expected to be extended to a still wider group soon. Government is planning to introduce a cap for all SVT customers in time for implementation before winter 2017-18.
This may alleviate fuel poverty in some areas, though is unlikely to eliminate the problem. Full engagement in the energy market to select the appropriate tariff will be of most benefit to fuel poor customers and supporting them to do so should be a priority. Switching will save the average consumer several hundreds of pounds a year (see Appendix 1: Local tariffs), whereas the government SVT price cap is projected to save only around £100/year.

43
8.3.2 FiT and RHI amendments
The government indicated in its Autumn 2017 budget that the small-scale FiT would close to new applications from April 2019. Once the scheme is closed, there will be no subsidy route for the installation of small-scale renewable generation, considerably damaging the economics of installing, for example, rooftop solar arrays. There will also be no obvious route to market for export of excess power generated.
This may make solar thermal panels more attractive, as these will continue to benefit from subsidy via the RHI. Solar thermal panels can reduce the use of gas in boilers to heat water or make the use of electric/ immersion heaters more affordable.
BEIS announced in November 2017 that it was not currently planning to amend tariff rates for the RHI. This may not be the case in the long term as a scheme of digression is in place. This will kick in as and when the scheme begins to see numbers of installations – and therefore costs – increase.
8.3.3 ECO measures
A consultation from the government – specifically the Department of Business, Energy and Industrial Strategy – is expected shortly to consider revisions to the scheme and set up “ECO3”. Likely amendments include extension of the scheme to more suppliers, probably targeting those with at least 100,000 customer accounts, rather than the current 250,000.
The previous set of revisions were completed early in 2017 and created the current “ECO2t” scheme, which runs from April 2017 to the end of September 2018. The changes gave local authorities additional powers to designate properties to eligibility for ECO measures to be installed.
If this trend of increasing LA involvement continues, it may pay dividends to fuel poverty reduction goals for local authorities to engage closely with one or more suppliers to focus attention on deprived areas, for example with door-to-door campaigns or local surgeries to explain the scheme and help eligible residents to apply.
8.3.4 Off-gas-grid
LAs may wish to target concentrations of off-gas-grid homes as suitable for district heating projects. CHPs and boilers have been deployed successfully in this role; this has historically been mostly in cities, but villages may also be suitable targets.
Alternatively, the CCC suggested that one in four homes using oil for heating and one in three using electric heating could benefit from switching to an air-source heat pump. This could save 3.2t of CO2 emissions for oil and 0.8t of CO2 emissions for electric conversions respectively.
The domestic Renewable Heat Incentive (RHI) is a government scheme promoting low-carbon heating. Revisions to the RHI came into force on 20 September 2017, including tariff uplifts for air- and ground-source heat pumps from 7.63p/kW to 10.18p/kW and 19.64p/kW to 19.86p/kW for air- and ground-source pumps respectively.
Mass deployment of heat pumps could also, in concert with central control and flexibility, be used to engage in domestic DSR and supply grid services to the national or local networks. This could provide an income stream to offset installation costs and electricity bills.

44
9 Appendix 1: Local tariffs Figure 15: Tariff prices in the Eastern region, Ofgem TDCVs, direct debit and dual-fuel
Source: Cornwall Insight
Data is correct to 31 December 2017.
£650
£700
£750
£800
£850
£900
£950
£1,000
£1,050
£1,100
£1,150
£1,200
£1,250
Britis
h Gas
SVT
EDF E
nergy
SVT
E.ON UK
SVT
Npower
SVT
Scottis
h Pow
er SV
T
SSE S
VTSp
ark
OVO En
ergy
EDF E
nergy
Good E
nergy
M&S Ene
rgy SSE
Sains
bury'
s Ene
rgy
Utility
Ware
house
Brigh
ter W
orld E
nergy
npow
er
PFP E
nergy
Toto
Energ
y
Green S
tar En
ergy
Orbit E
nergy
ENGI
EGEN
4U
Affect
Energ
y
Ange
lic En
ergyEb
ico
Robin
Hood E
nergy
Bristo
l Ene
rgy
GnERG
Y
Go Effo
rtless
Energ
y
Co-op
erativ
e Ene
rgy
GB Ene
rgy
Extra
Energ
y
Octopu
s Ene
rgy
Flow En
ergy
ESB E
nergy
First
Utility
iSupp
ly En
ergy
So En
ergy
Green N
etwork
Energ
y
Nabuh
Energ
y
Tonik
Energ
y
Econ
omy E
nergy
OneSe
lect
Breeze
IRESA
Avro
Energ
y
Toge
ther E
nergy
Ecotr
icity
Green E
nergy
Utilita
Zebra
Power
Fische
r Ene
rgy
Solar
plicity
Pure
Plane
tBu
lb
Peop
le's En
ergy
Igloo
Energ
y
Outfox
the M
arket
Fixed tariffs Average Big Six SVT Variable tariffs

45
10 Appendix 2: National forecasts
Revised projections were published by BEIS on energy generation and demand over the period to 2035 in January
2035. Cornwall Insight’s Mike Mahoney commented on the changing picture, which we feel may be relevant to the
LEP’s future planning.
This piece is taken from Energy Spectrum issue 604.
Searching for clues among BEIS’s new energy projections BEIS’s latest Energy and Emissions Projections
(EEP) were published in early January. These
cover the period through to 2035.
In this week’s Energy Perspective we look at
what the forecasts tell us about the shifting
official view of the energy system of the
future.
Working those little grey cells
It’s the sixth time the sponsoring department
has updated the projections in this format
since they were first produced in 2012. This
time they are based on policy analysis from
July 2017 and power sector modelling from
September 2017.
Potential savings from a subset of policies in
the autumn’s Clean Growth Strategy are
included, but the full impact of new policies
and proposals from it “will be included in
future EEP editions when they are developed
more fully”.
But with several policy updates taking place
since the modelling work and important
elements of the Clean Growth Strategy still to
be detailed, there is a sense that there is
much more at play now than is captured here.
Furthermore, unfortunately many
assumptions remain opaque and have to be
derived from the supporting data annexes.
The commentary is also minimal and unlike in
previous editions a lot of it borders on the
overtly political.
Fingerprints
While much of the document is framed
against projected performance relative to
carbon budgets, we are more focused here on
changes since last time round and the factors
that are driving these. Up close, there have
been significant shifts in some assumptions,
many of which are likely to influence policy
formulation going forward.
The power generation sector must still deliver
considerable emissions reductions if progress
towards the adopted carbon budgets is to be
maintained. Changes to projected output
from the 2016 report shows substantive
changes in terms of expected build-out, and it
is the emissions impact of these that has
caught the media headlines.
Figure 1: Cumulative new capacity
In the round, while the same amount of
capacity comes onto the system by 2035, this
is much more back-loaded than the previous
projections, with consistently less new build
coming forward until 2030 (see Figure 1).
On top of this, there are significant shifts
between output levels from the different
technologies (see Figure 2). For instance, coal
output is significantly reduced in the near-
term reflecting higher than previously
expected coal prices, making a brief recovery
before disappearing in 2025.
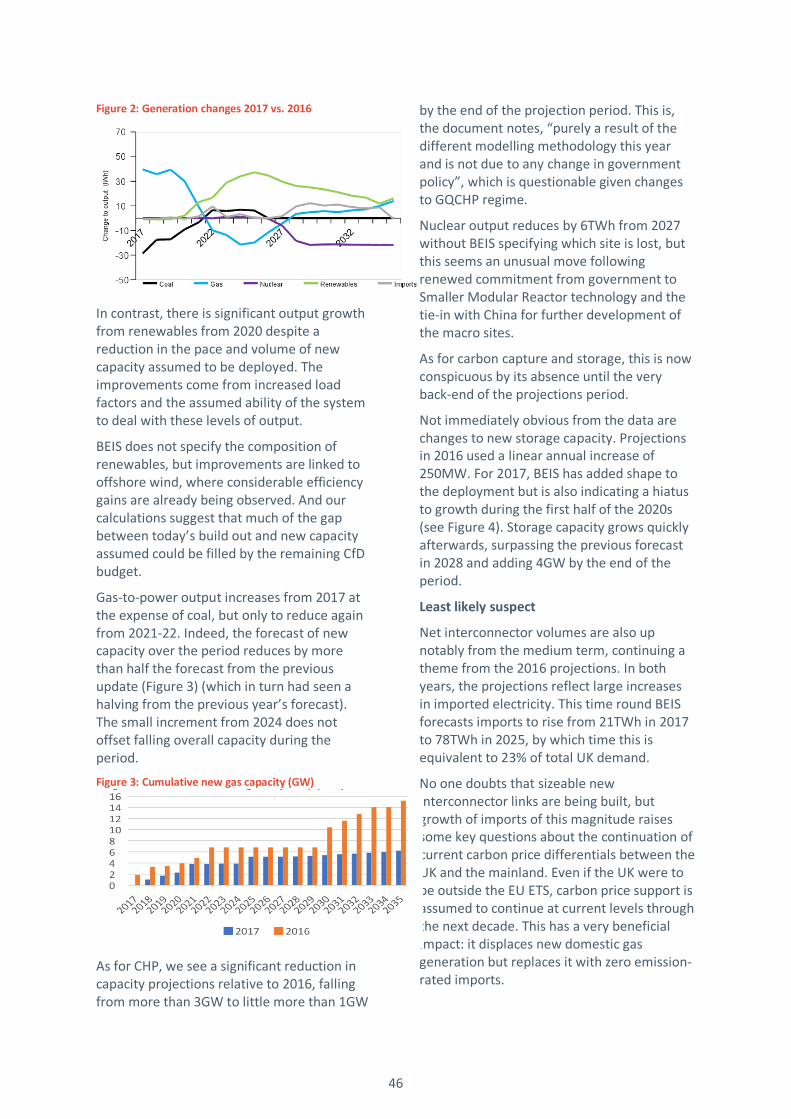
46
Figure 2: Generation changes 2017 vs. 2016
In contrast, there is significant output growth
from renewables from 2020 despite a
reduction in the pace and volume of new
capacity assumed to be deployed. The
improvements come from increased load
factors and the assumed ability of the system
to deal with these levels of output.
BEIS does not specify the composition of
renewables, but improvements are linked to
offshore wind, where considerable efficiency
gains are already being observed. And our
calculations suggest that much of the gap
between today’s build out and new capacity
assumed could be filled by the remaining CfD
budget.
Gas-to-power output increases from 2017 at
the expense of coal, but only to reduce again
from 2021-22. Indeed, the forecast of new
capacity over the period reduces by more
than half the forecast from the previous
update (Figure 3) (which in turn had seen a
halving from the previous year’s forecast).
The small increment from 2024 does not
offset falling overall capacity during the
period.
Figure 3: Cumulative new gas capacity (GW)
As for CHP, we see a significant reduction in
capacity projections relative to 2016, falling
from more than 3GW to little more than 1GW
by the end of the projection period. This is,
the document notes, “purely a result of the
different modelling methodology this year
and is not due to any change in government
policy”, which is questionable given changes
to GQCHP regime.
Nuclear output reduces by 6TWh from 2027
without BEIS specifying which site is lost, but
this seems an unusual move following
renewed commitment from government to
Smaller Modular Reactor technology and the
tie-in with China for further development of
the macro sites.
As for carbon capture and storage, this is now
conspicuous by its absence until the very
back-end of the projections period.
Not immediately obvious from the data are
changes to new storage capacity. Projections
in 2016 used a linear annual increase of
250MW. For 2017, BEIS has added shape to
the deployment but is also indicating a hiatus
to growth during the first half of the 2020s
(see Figure 4). Storage capacity grows quickly
afterwards, surpassing the previous forecast
in 2028 and adding 4GW by the end of the
period.
Least likely suspect
Net interconnector volumes are also up
notably from the medium term, continuing a
theme from the 2016 projections. In both
years, the projections reflect large increases
in imported electricity. This time round BEIS
forecasts imports to rise from 21TWh in 2017
to 78TWh in 2025, by which time this is
equivalent to 23% of total UK demand.
No one doubts that sizeable new
interconnector links are being built, but
growth of imports of this magnitude raises
some key questions about the continuation of
current carbon price differentials between the
UK and the mainland. Even if the UK were to
be outside the EU ETS, carbon price support is
assumed to continue at current levels through
the next decade. This has a very beneficial
impact: it displaces new domestic gas
generation but replaces it with zero emission-
rated imports.

47
False disguise
For all the stirring of the power generation
mix, the improved emissions outlook is largely
based on two other, demand-side factors.
Firstly, there will be fewer “heating degree
days” (days requiring internal heating) as
winter temperatures continue to moderate.
Secondly, demand from I&C consumers will
be lower because of higher energy prices.
Figure 4: Cumulative storage growth (GW)
The dominating factor here is the changing
demand base, growing steadily beyond 2023
as load increases from both renewable heat
and transport. But the recent trend of year on
year downgrades has continued in 2017,
lowering total consumption by over 3% by the
end of the period compared with the 2016
projections (see Figure 5).
Figure 5: BEIS final electricity demand projections
New witnesses
In his Cost of Energy Review, Dieter Helm
delivered a withering assessment of
government forecasts, persisting with steadily
rising commodity prices. Peter Atherton made
the point recently (ES600, p.20) that energy
prices had long decoupled from GDP, and
many other global factors are greater
influences on the market price.
But BEIS’s latest forecasts remain at odds with
the markets. Oil, gas and coal curves of
forward prices are set to fall and follow
different trajectories. Indeed BEIS’ gas price
forecast is essentially a mirror image of the
front of the current gas curve (see Figure 6),
which illustrates the vagaries of producing
accurate projections in a changing world.
Figure 6: Forward gas curves (p/therm)
These difficulties will increase as the influence
of oil, gas and coal on electricity prices is
reducing. Gas remains a key generation fuel,
but the market is well supplied over the
forecast horizon period. Increasing flows from
Russia and modest demand growth are also
protecting European prices from Asian
demand influence.
A significant element missing in the
projections, it seems, is the price
cannibalisation impact of increased
renewables under subsidy. This element
should be exerting considerable and
increasing pressure on prices during the
forecast period, reflecting increased
renewables output (see Figure 7), as
demonstrated by our own forecast, but it
appears not to weigh in the EEPs.
Figure 7: BEIS power price projections vs Cornwall Insight
Locked room
In the EEPs, BEIS put reference projected
emissions from existing and agreed policies at
closer to meeting both fourth (2023-27) and
fifth (2028-32) carbon budgets. These now
show achievement levels of 97% and 95%
48
respectively, an improvement on the
estimates posted alongside the Clean Growth
Strategy.
As noted, these projections include policies
mentioned in the Clean Growth Strategy only
if they were classed as implemented, adopted
or agreed at the cut-off point of July 2017. It
also included an initial estimate of the savings
from a further subset of planned policies
showing savings over the fourth carbon
budget period and the fifth carbon budget
periods. BEIS remains upbeat that the gaps
will be closed, as missing detail is added and
as the Clean Growth Strategy is turned into
more specific plans.
The big reveal
So BEIS has cut its projections for new gas
generation needed by 2035 by more than half
since publishing last year’s forecasts. In all we
are now looking at 4GW, with most of that
appearing in the immediate years. This marks
the demise of gas as the balancing fuel on the
system as decarbonisation runs its course,
which has been the defining feature of energy
projections for the past decade. CCS and new
CHP have now gone almost entirely.
Low-carbon sources of electricity are now
expected to overtake gas as the UK's single
largest source of power as soon as 2020,
which would represent a phenomenal
landmark. Indeed, BEIS now expects twice as
much renewable energy capacity to come
online by 2035 as it did in 2015. It also expects
twice as much battery storage capacity as it
projected a year ago. Given recent changes in
deployment costs, these shifts should not
come as a total surprise.
The figures also show there remains a gap in
the overall CO2 cuts needed to meet statutory
carbon reduction targets represented by the
later carbon budgets from 2023 onwards. This
is largely due to much lower take up of
renewable heat and transport than required,
but the impact continues to be mitigated by
demand reductions.
BEIS published the EEP update much earlier
than in previous years. It has promised further
detail over the course of 2018, and this
promise of better engagement and
explanation is welcome. We look forward to a
more transparent explanation of the
modelling methodology to improve
understanding.