
Leddar One User Guide - RobotShop | Robot Store | Robots | Robot Parts | Robot … … · ·...
53
LeddarTech Inc. 2740 Einstein Street Quebec, Quebec G1P 4S4 CANADA www.leddartech.com Leddar™One User Guide
-
Upload
truonglien -
Category
Documents
-
view
217 -
download
0
Transcript of Leddar One User Guide - RobotShop | Robot Store | Robots | Robot Parts | Robot … … · ·...

LeddarTech Inc.
2740 Einstein Street
Quebec, Quebec G1P 4S4
CANADA
www.leddartech.com
Leddar™One
User Guide

PN 54A0025-2 Printed in Canada
March 2015
Copyright © 2015 LeddarTech Inc. All rights reserved.
The Company shall not be liable for any errors contained herein or for any damages arising out of or related to this document or the information contained therein, even if the Company has been advised of the possibility of such damages.
The information contained herein is the property of LeddarTech Inc., and shall not be reproduced in whole or in part without prior written approval of LeddarTech Inc. LeddarTech Inc. assumes no responsibility for any errors or omissions in this document.
Leddar is a trademark of LeddarTech Inc. All other trademarks are the property of their respective owners.
Leddar™ Configuration software: this software is based in part on the work of the Independent JPEG Group.

Leddar™One Sensing Module 3
Table of Contents
1. INTRODUCTION ............................................................................................................5
1.1. Description ............................................................................................................................ 5
1.2. Underlying Principles .......................................................................................................... 10
1.3. Signal Processing Algorithm Overview ................................................................................ 11
2. GETTING STARTED ...................................................................................................... 14
2.1. Setup ................................................................................................................................... 14
2.2. Connecting to the Module .................................................................................................. 14
3. MEASUREMENT AND SETTINGS .................................................................................. 16
3.1. Distance Measurement ....................................................................................................... 16
3.2. Data Description .................................................................................................................. 16
3.3. Acquisition Settings ............................................................................................................. 17
3.4. Measurement Rate ............................................................................................................. 21
3.5. Serial Port Settings .............................................................................................................. 22
3.6. Modbus Protocol ................................................................................................................. 22
3.7. SDK ...................................................................................................................................... 24
4. LEDDAR™ CONFIGURATOR ......................................................................................... 26
4.1. Installing Leddar™ Configurator .......................................................................................... 26
4.2. Connecting to the Module .................................................................................................. 26
4.3. Leddar™ Configuration Main Window ................................................................................ 29
4.4. Using Leddar™ Configurator ............................................................................................... 31
5. SPECIFICATIONS ......................................................................................................... 45
5.1. General ................................................................................................................................ 45
5.2. Mechanical .......................................................................................................................... 45
5.3. Electrical .............................................................................................................................. 45
5.4. Optical ................................................................................................................................. 46

Leddar™One Sensing Module 4
5.5. Performance ........................................................................................................................ 47
5.6. Regulatory Compliance ....................................................................................................... 51
5.7. Dimensions .......................................................................................................................... 52
6. HELP .......................................................................................................................... 53

IS16 Leddar™ industrial sensor 5
1. Introduction
The Leddar™One enables developers and integrators to make the most of
Leddar™ technology through integration in systems requiring detection and
ranging. The Leddar™One Module is a more compact and low-cost alternative
that brings valuable sensing intelligence to a whole new range of finished
products.
1.1. Description
The Leddar™One package contains the sensor module with the following
features:
3° conic beam
Beam height: 3°
Real-time data acquisition (through serial port)
3.3V UART or RS-485 link for measurement acquisition
Leddar™ Software
o Leddar™ Configurator
Module configuration
Real-time display of detection and measurement data
Data recording and logging.
o Leddar™ Enabler SDK
Complete C example demonstrating parameter
configuration and data acquisition using the MODBUS
protocol over the serial link.
Leddar™One Sensing Module 6
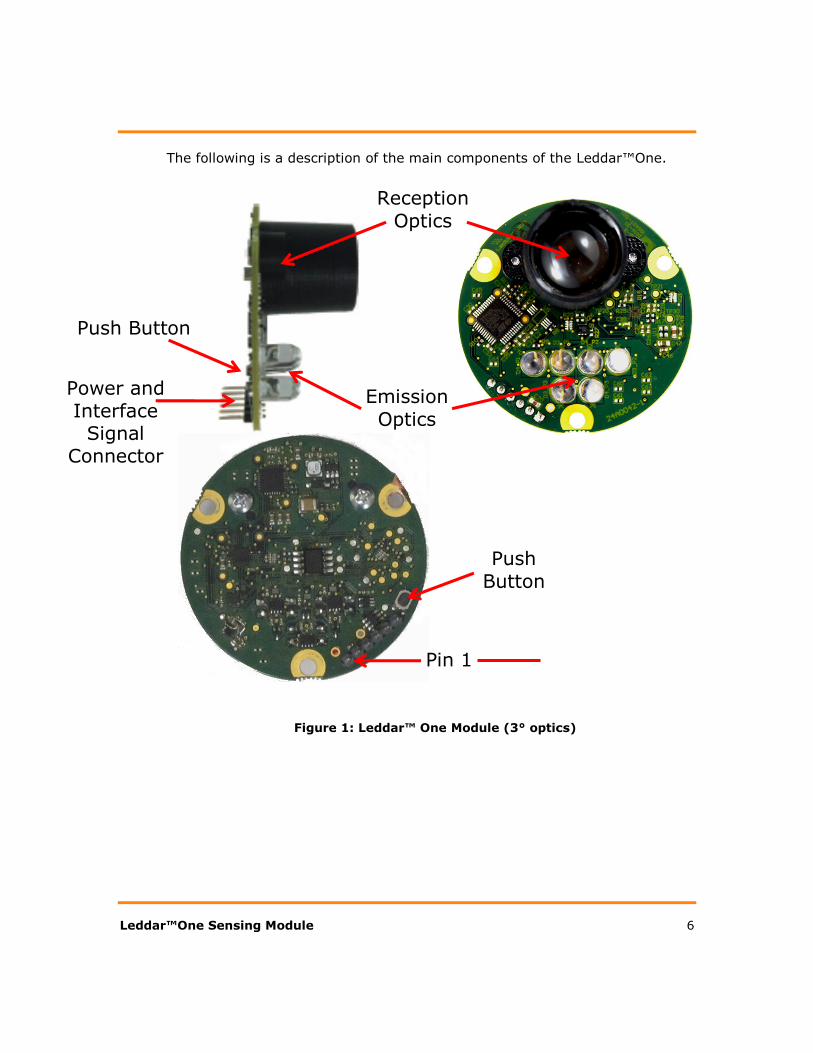
The following is a description of the main components of the Leddar™One.
Figure 1: Leddar™ One Module (3° optics)
Pin 1
Emission
Optics
Power and Interface
Signal Connector
Reception
Optics
Push Button
Push
Button

Leddar™One Sensing Module 7
The power and interface signals are included on a six-pin standard 0.1” pitch
header with the following pinout:
Table 1: Pinout of the Power and Interface Signals Header
Pin – Function Description
1 – GND Ground.
2 – IRQ Interrupt Signal, active high. Set when a new measurement is available, reset
when data read from Modbus link.
3 – Supply 5V
4 – RX or RS-485+ Serial port input.
5 – TX or RS-485- Serial port output.
6 – RESET_N This is a pulled-up input that must be pulled down below 0.8 V for at least 350 ns and then released to reset the processor.
The pin 1 position is shown in Figure 1.

Leddar™One Sensing Module 8
Push Button
The push button at the right of the six-pin interface has three functionalities:
Table 2: Push Button Functionalities
Description Action
Short press during sensor operation
Software reboot
Short press at power up (less than 10 seconds)
Reset sensor configuration. The button must be pressed before powering the sensor and
released once power is applied.
Long press at power up (more than 10 seconds)
Upload a binary file at power-up.
WARNING: It is recommended to use the Leddar™ Configurator software for upgrading the module firmware. Firmware upgrade using the following procedure should be performed only when instructed by LeddarTech’s technical support.
A PC with a serial terminal program supporting the YMODEM protocol must be available. It must be set to 115200 bauds, 8 data bits, 1 stop bit and no parity and connected to the serial port.
The button must be pressed before applying power and then continuously held for at least 10
seconds, until the text “Waiting… (press 'a' to abort)” appears in the terminal.
You can then start the YMODEM transfer of the
firmware file. Once the transfer is completed, either “Successful!” or “Failed!” will appear. On success the sensor will automatically start.
Leddar™One Sensing Module 9
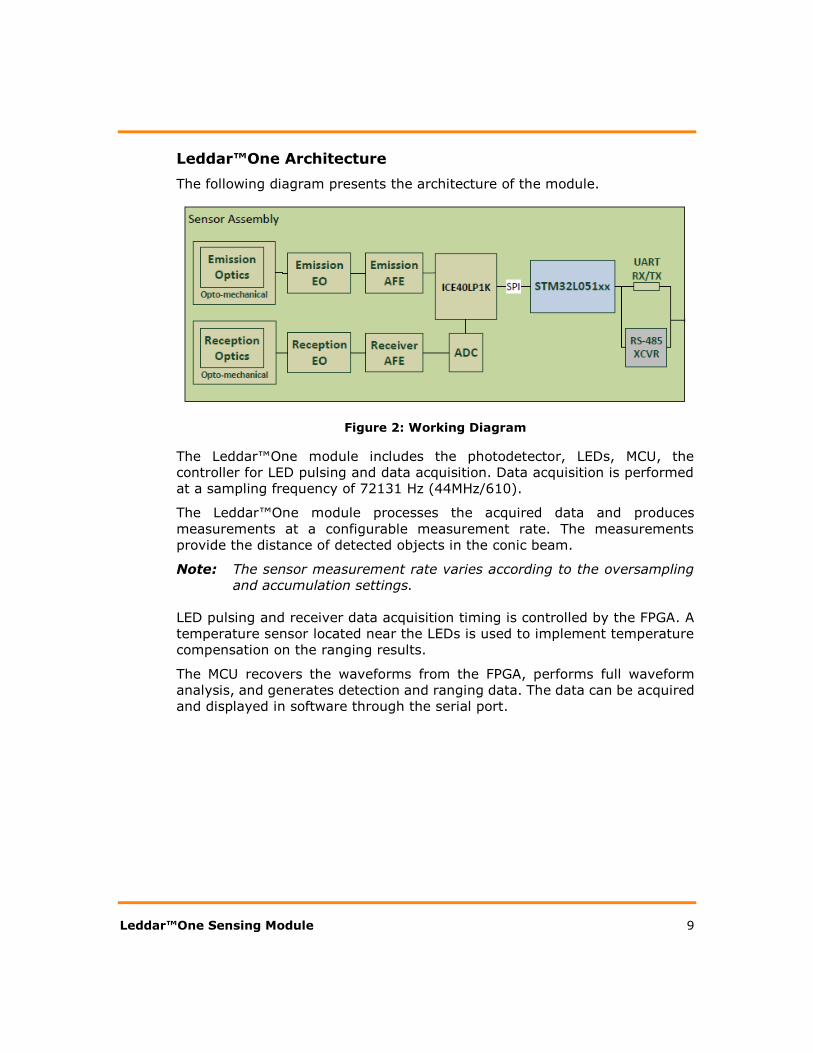
Leddar™One Architecture
The following diagram presents the architecture of the module.
Figure 2: Working Diagram
The Leddar™One module includes the photodetector, LEDs, MCU, the
controller for LED pulsing and data acquisition. Data acquisition is performed
at a sampling frequency of 72131 Hz (44MHz/610).
The Leddar™One module processes the acquired data and produces
measurements at a configurable measurement rate. The measurements
provide the distance of detected objects in the conic beam.
Note: The sensor measurement rate varies according to the oversampling
and accumulation settings.
LED pulsing and receiver data acquisition timing is controlled by the FPGA. A
temperature sensor located near the LEDs is used to implement temperature
compensation on the ranging results.
The MCU recovers the waveforms from the FPGA, performs full waveform
analysis, and generates detection and ranging data. The data can be acquired
and displayed in software through the serial port.

Leddar™One Sensing Module 10
1.2. Underlying Principles
Created by LeddarTech, LEDDAR™ (light-emitting diode detection and
ranging) is a unique sensing technology based on LED illumination (in either
the visible or the infrared spectrum) and the time-of-flight of light principle.
The LED emitters illuminate the area of interest (pulsed at high frequency)
and the single channel sensor receiver collects the backscatter of the emitted
light and measures the time taken for the emitted light to return back to the
sensor. A single photodetector is used and provides a full-beam sensing
module. Full-waveform analysis enables detection and distance measurement
of multiple objects in the beam, provided that foreground objects do not fully
obscure objects behind them. Oversampling and accumulation techniques are
used to provide extended resolution and range.
Figure 3 illustrates the illumination area and detection segments of the
Leddar™One module.
Figure 3: Illumination Area and Detection Zone
The core of Leddar™ sensing is the pulsing of diffused light, collection of
reflected light (including oversampling and accumulation), and full-waveform
analysis. The light source type, the number of light sources, the illumination
and reception beam, and the number of photodetectors can all be tailored to
Leddar™One Sensing Module 11
fit specific application requirements such as detection range, beam and spatial
resolution.
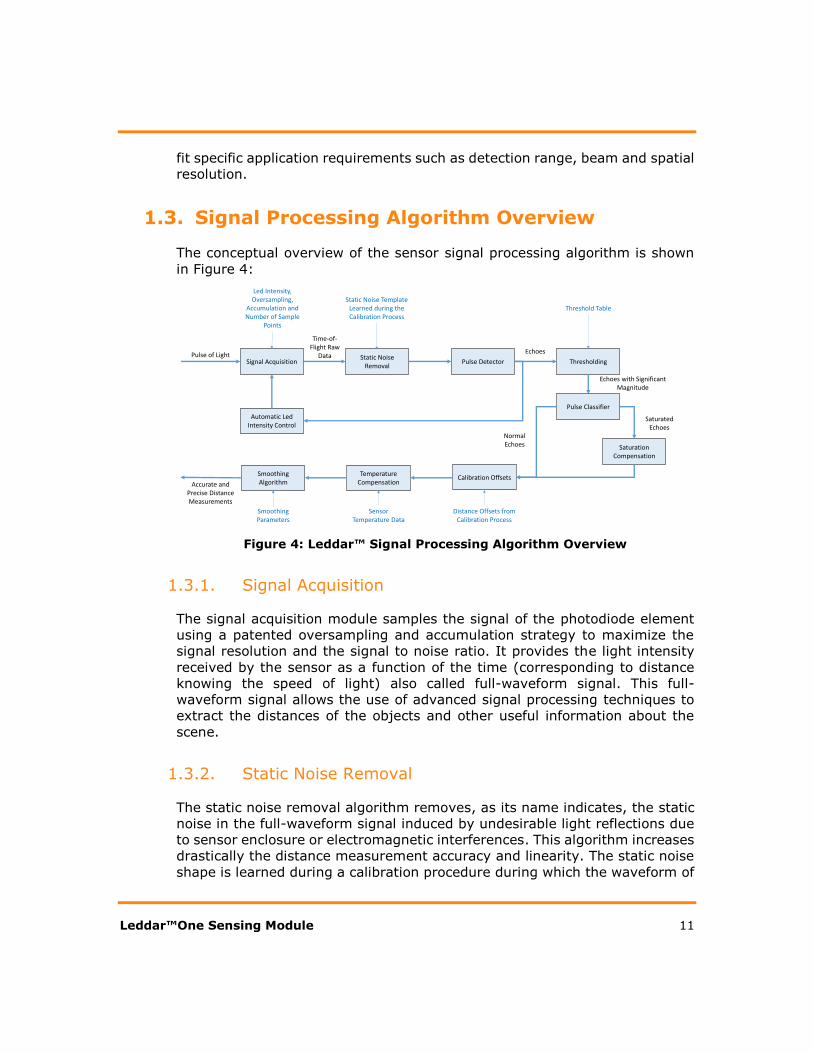
1.3. Signal Processing Algorithm Overview
The conceptual overview of the sensor signal processing algorithm is shown
in Figure 4:
Figure 4: Leddar™ Signal Processing Algorithm Overview
1.3.1. Signal Acquisition
The signal acquisition module samples the signal of the photodiode element
using a patented oversampling and accumulation strategy to maximize the
signal resolution and the signal to noise ratio. It provides the light intensity
received by the sensor as a function of the time (corresponding to distance
knowing the speed of light) also called full-waveform signal. This full-
waveform signal allows the use of advanced signal processing techniques to
extract the distances of the objects and other useful information about the
scene.
1.3.2. Static Noise Removal
The static noise removal algorithm removes, as its name indicates, the static
noise in the full-waveform signal induced by undesirable light reflections due
to sensor enclosure or electromagnetic interferences. This algorithm increases
drastically the distance measurement accuracy and linearity. The static noise
shape is learned during a calibration procedure during which the waveform of
Pulse Detector
Time-of-Flight Raw
Data
Temperature Compensation
Smoothing Algorithm
Calibration Offsets
Sensor Temperature Data
Echoes
Signal Acquisition Thresholding
Led Intensity, Oversampling,
Accumulation and Number of Sample
Points
Smoothing Parameters
Static Noise Removal
Static Noise Template Learned during the Calibration Process
Accurate and Precise Distance Measurements
Threshold Table
Saturation Compensation
Pulse Classifier
Saturated Echoes
Normal Echoes
Echoes with Significant Magnitude
Distance Offsets from Calibration Process
Pulse of Light
Automatic Led Intensity Control
Leddar™One Sensing Module 12
the signal is captured while the reception lens of the sensor is shielded from
the backscattered light. The sensor comes with a static noise factory
calibration. However, the default calibration can be updated by the user using
LeddarTM Configurator, see Section 4.4.12 for more details.
1.3.3. Pulse Detection
The objects in the sensor field of detection create a particular signature in the
full-waveform signal called pulses. The pulse detector analyses the full-
waveform signal in order to recognize these pulses and compute their
distance. By nature, time-of-flight sensor using full-waveform analysis is able
to detect several distinct objects with a single photodiode element.
The detected pulses have specific amplitudes based on their distance from the
sensor and on the reflectivity of the objects. It is well known that pulses of
small amplitudes do not lead to accurate and precise distance measurements.
Consequently, the algorithm removes all pulses with amplitudes under a given
threshold. This threshold depends on the acquisition settings of the sensor,
see Section 5.5.2 for more details.
1.3.4. Saturation Compensation
The algorithm classifies the detected pulses based on their shape. The
LeddarOneTM determines which pulses are saturated and which have a normal
shape. It is noted that other families of the products have more advanced
classification technology such as merged object discrimination. Saturated
pulse occurs when the signal backscattered by the object is so strong that the
full-waveform signal is clipped. If not treated, this phenomenon creates an
important degradation of the distance measurement accuracy. It is why a
saturation compensation algorithm is executed when saturated pulses are
detected. This innovative algorithm uses a sophisticated approach to provide
a distance measurement accuracy better than 10 cm even with a strongly
clipped signal.
1.3.5. Temperature Compensation
The signal processing algorithm also embeds an advanced temperature
compensation scheme which attenuates the distance measurement drift over
large and sudden sensor temperature changes. With this algorithm, the
distance measurements stabilize inside 1 cm in less than 10 seconds on cold
sensor startup. The temperature compensation also ensures optimal accuracy
over the full operating temperature range.

Leddar™One Sensing Module 13
1.3.6. Smoothing
The smoothing algorithm reduces the distance measurement jitter. It can be
seen as a recursive average filter which continuously adapts its cutoff
frequency (or averaging history length) as a function of the current
measurement noise. This innovative algorithm increases the precision of the
device (decreases the standard deviation of the measurements). The level of
smoothing of the algorithm can be adjusted to fit the requirements of the user
applications, please see Section 3.3.2 for more details.
1.3.7. Automatic LED Intensity Control
The automatic LED intensity control adjusts the intensity of the LEDs in real
time in order to maintain optimal pulse magnitudes at all times. For instance,
if pulses become suddenly saturated, the sensor will decrease automatically
the intensity of the LEDs to a level that ensures an optimal distance
measurement accuracy.

Leddar™One Sensing Module 14
2. Getting Started
2.1. Setup
To configure the sensor and see measurements the Leddar™ Configurator
software must be installed. This software is available for download at
www.leddartech.com/support. Once you have downloaded the file, simply
double-click on it and follow on-screen instructions.
Figure 5: Leddar™ Software Setup Dialog Box
The installer creates an icon on the computer desktop and in the Start menu.
2.2. Connecting to the Module
Once the installation is completed, you can connect to the module.
To connect to the module:
1. On the computer desktop, double-click the Leddar™ Configurator icon.
2. In Leddar™ Configurator, click the connect button ( ).

Leddar™One Sensing Module 15
Figure 6: Connecting to a Device
3. In the Connection window, select your serial port and click Connect.
Figure 7: Connection Window
The main window displays the detections (green bar) in the distance gauge.

Leddar™One Sensing Module 16
3. Measurement and Settings
3.1. Distance Measurement
Distance is measured from the surface of the module PCB.
Figure 8: Distance Measurement
The dashed lines illustrate the full-beam and the solid line indicates the
distance measured by the sensor.
3.2. Data Description
Measurement data can be displayed in the Raw Detections window (View
menu > Raw Detections).

Leddar™One Sensing Module 17
Figure 9: Raw Detections Dialog Box
An object crossing the beam of the sensor is detected and its distance is
measured. A measurement contains distance, amplitude, a flags bit field and
the segment of the detection. The latter applies to multiple-segment modules
and is fixed for the Leddar™One. The quantity of light reflected back to the
sensor by the object generates the amplitude. The stronger the reflection, the
higher the amplitude.
Table 3: Raw Detection Field Description
Field Description
Segment Beam segment in which the object is detected (Always 1 for the Leddar™One)
Distance Distance of the detected object from the sensor
Amplitude Quantity of light reflected by the object and measured by the sensor
Flag Always 1 for the Leddar™One
3.3. Acquisition Settings
Acquisition settings allow you to define parameters to use for detection.
To open the Acquisition Settings dialog box, on the Device menu, point to
Configuration and click Acquisition…

Leddar™One Sensing Module 18
Figure 10: Acquisition Setting Dialog Box
To apply the changes, click the apply button ( ) in the main window.
Table 4: Sensor Setting Description
Parameters Descriptions Effects
Accumulations Number of accumulations Higher values enhance range, reduce measurement rate and noise.
Oversampling Number of oversampling cycles
Higher values enhance accuracy/
precision/resolution and reduce measurement rate.
Points Number of base sample points
Determines maximum detection processing range.
Smoothing Distance measurement smoothing
Smoothes the sensor measurements.
The behavior of the smoothing algorithm can be adjusted by a value ranging from -16 to 16. Higher values
enhance the sensor precision, but reduce the sensor reactivity.
The smoothing algorithm can be deactivated by checking the “Disabled” check box.

Leddar™One Sensing Module 19
The measurement stabilization algorithm is advised for application
that need to measure slowly moving objects with a high precision.
The application requiring to track quickly moving objects, the stabilization should be configured with a value lower than 0 or simply deactivated.
Static Noise Removal
Disabling of the static noise removal algorithm
The static noise in the full-waveform
signal is removed using predefined
static noise templates. These templates are determined during the calibration process. The calibration of
the static noise can be conducted by the user if required. The static noise removal disabling checkbox is only available with the integrator license. This algorithm is enabled by default.
LED Control LED power control options Selects between manual & automatic
power control. In manual mode, the following approximate relative LED intensity can be selected: 10%, 20%, 35%, 55%, 75%, and 100%. In
automatic, LED power is adjusted according to incoming detection
amplitudes. The current LED power level is visible in the Device State window.
* Distance measurements of objects detected with a low signal or saturated signal may have lower accuracy and precision. It is recommended to set the LED intensity to a level that will provide a strong signal for the typical object and range. Note that setting the LED intensity below 100% will reduce the detection range.
3.3.1. LED Intensity
There are a total of 6 supported LED power levels. Their approximate relative
power is as follows: 10%, 20%, 35%, 55%, 75% and 100%.
The change delay defines the number of frames required before allowing the
sensor to increase or decrease by one the LED power level. For example, with
the same change delay, the maximum rate of change (per second) of the LED
power will be two times higher at 17.6 Hz than at 8.8 Hz.
NOTE: Since the change delay parameter is a number of measurements, the
delay will vary if the measurement rate is changed (through
modification of the accumulation and oversampling parameters).

Leddar™One Sensing Module 20
Keeping the sensor in automatic LED power mode ensures it adapts to varying
environments. Close range objects may reflect so much light they can saturate
the sensor, reducing the quality of the measurements. This mode will adapt
the light output within the change delay setting to reach the optimal
amplitude. On the other hand, low amplitudes provide lower accuracy and
precision. The automatic LED power mode will select a LED intensity that
provides the highest intensity that avoids the saturation conditions.
NOTE: When a strongly reflective or near object is present in the field of view
while monitoring farther distances, the automatic adjustment will
reduce the effective range of the sensor (reduce LED intensity) and
may prevent detection of long range or low reflectivity objects. For
these applications, manual mode with LED power set to 100% may
be a better setting.
3.3.2. Smoothing
The smoothing algorithm increases the precision of the measurements at the
cost of the sensor reactivity. The algorithm works by averaging consecutive
measurements over a given time history. The history length of the filter is
continuously adapted as a function of the current measurement noise level. It
also changes according to the oversampling and accumulation settings. The
smoothing level of the algorithm can also be adjusted by a parameter ranging
from -16 to 16. Higher values increase the sensor precision, but reduce the
sensor reactivity. An example of the behavior of the measurement smoothing
algorithm is depicted in Figure 11 below.
0 20 40 60 80 1008.9
8.905
8.91
8.915
8.92
8.925
8.93
8.935
8.94
8.945
8.95
Sample
Dis
tan
ce
(m
)
Smoothed
Disabled
True
Leddar™One Sensing Module 21
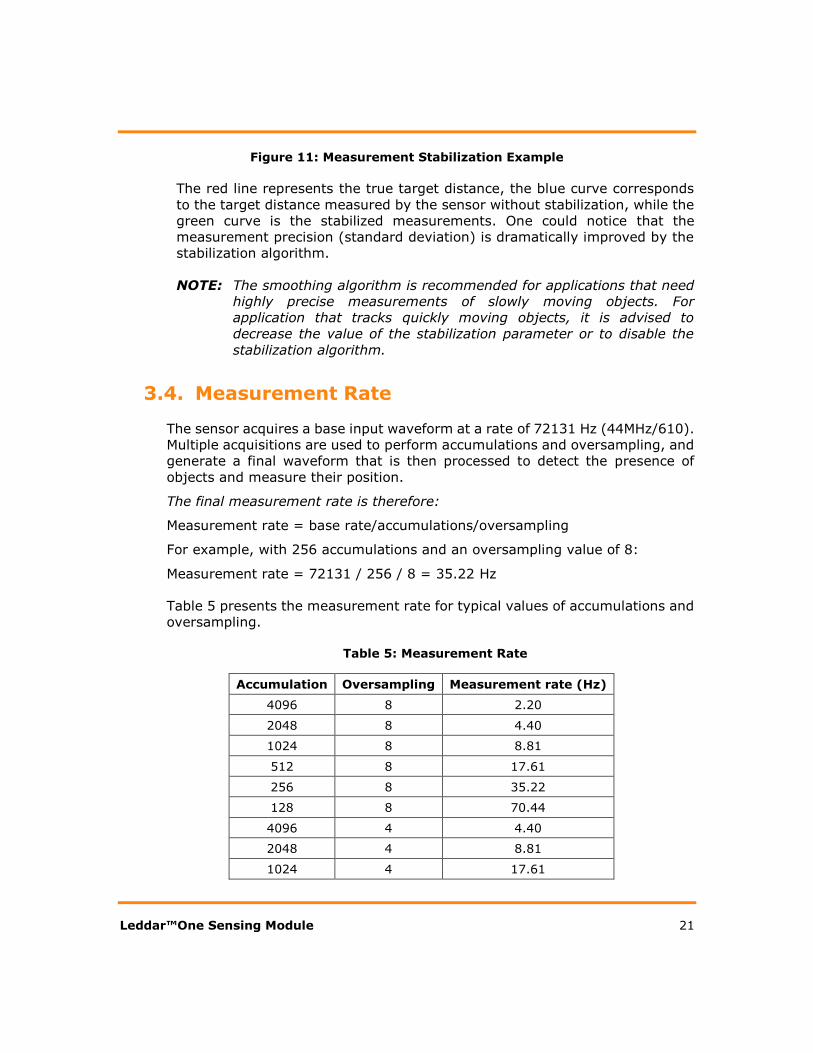
Figure 11: Measurement Stabilization Example
The red line represents the true target distance, the blue curve corresponds
to the target distance measured by the sensor without stabilization, while the
green curve is the stabilized measurements. One could notice that the
measurement precision (standard deviation) is dramatically improved by the
stabilization algorithm.
NOTE: The smoothing algorithm is recommended for applications that need
highly precise measurements of slowly moving objects. For
application that tracks quickly moving objects, it is advised to
decrease the value of the stabilization parameter or to disable the
stabilization algorithm.
3.4. Measurement Rate
The sensor acquires a base input waveform at a rate of 72131 Hz (44MHz/610).
Multiple acquisitions are used to perform accumulations and oversampling, and
generate a final waveform that is then processed to detect the presence of
objects and measure their position.
The final measurement rate is therefore:
Measurement rate = base rate/accumulations/oversampling
For example, with 256 accumulations and an oversampling value of 8:
Measurement rate = 72131 / 256 / 8 = 35.22 Hz
Table 5 presents the measurement rate for typical values of accumulations and
oversampling.
Table 5: Measurement Rate
Accumulation Oversampling Measurement rate (Hz)
4096 8 2.20
2048 8 4.40
1024 8 8.81
512 8 17.61
256 8 35.22
128 8 70.44
4096 4 4.40
2048 4 8.81
1024 4 17.61

Leddar™One Sensing Module 22
512 4 35.22
256 4 70.44
128 4 140.88
3.5. Serial Port Settings
Two settings are available to adjust data acquisition through the 3.3V UART
or RS-485 link. The baud rate can be configured to the desired value. Parity,
data bits and stop bits are fixed at None, 8, 1.
A baud rate of 115200 is recommended to provide the best data transfer rate
and measurement rate up to 50Hz. The following serial port settings are
configurable.
Table 6: Serial Port Setting Description
3.6. Modbus Protocol
The 3.3V UART link or RS-485 port on the sensor uses the Modbus protocol.
This section describes the commands that are implemented.
For more information on the Modbus protocol, please visit www.modbus.org.
Report Server ID (function code 0x11)
This function returns information on the sensor in the following format:
Table 7: Report Server ID Message Description
Offset Length Description
0 1
Number of bytes of information (excluding this one).
Currently 0x33 since the size of information returned is fixed.
1 8 Serial number as an ASCII string
9 1 Run status 0: OFF, 0xFF:ON. Should always return 0xFF, otherwise the sensor is defective.
20 11 The software part number as an ASCII string
Parameter Value
Baud Rate 9600, 19200, 38400, 57600, 115200 bps
Modbus Address 1 to 247

Leddar™One Sensing Module 23
31 11 The hardware part number as an ASCII string
39 8 The full firmware version as 4 16-bit values
43 4 The firmware 32-bit CRC
47 2 The FPGA version
49 4 Device option flags (LeddarTech internal use)
51 2 Device identification code
Write Configuration (function code 0x46)
This function writes the current configuration registers to permanent memory.
There is no data in input or output.
Read Input Register (function code 0x4)
Here are the registers implemented for this command:
Table 8: Read Input Register Description
Address Description
20 Least significant 16 bits of timestamp.
21 Most significant 16 bits of timestamp.
22 Temperature in 1/256th of a Celsius
23 Number of detections
24 Distance in millimeters of first detection
25 Amplitude of first detection
26 Distance in millimeters of second detection
27 Amplitude of second detection
28 Distance in millimeters of third detection
29 Amplitude of third detection
Note that as per the Modbus protocol, register values are returned in
bigendian format.
The timestamp is a 32 bit unsigned value giving the number of milliseconds
since the sensor was started.
Distance and amplitude are 0 for a detection that is not present (for example
if register 23 is 1, registers 26 to 29 will all be 0).
Leddar™One Sensing Module 24
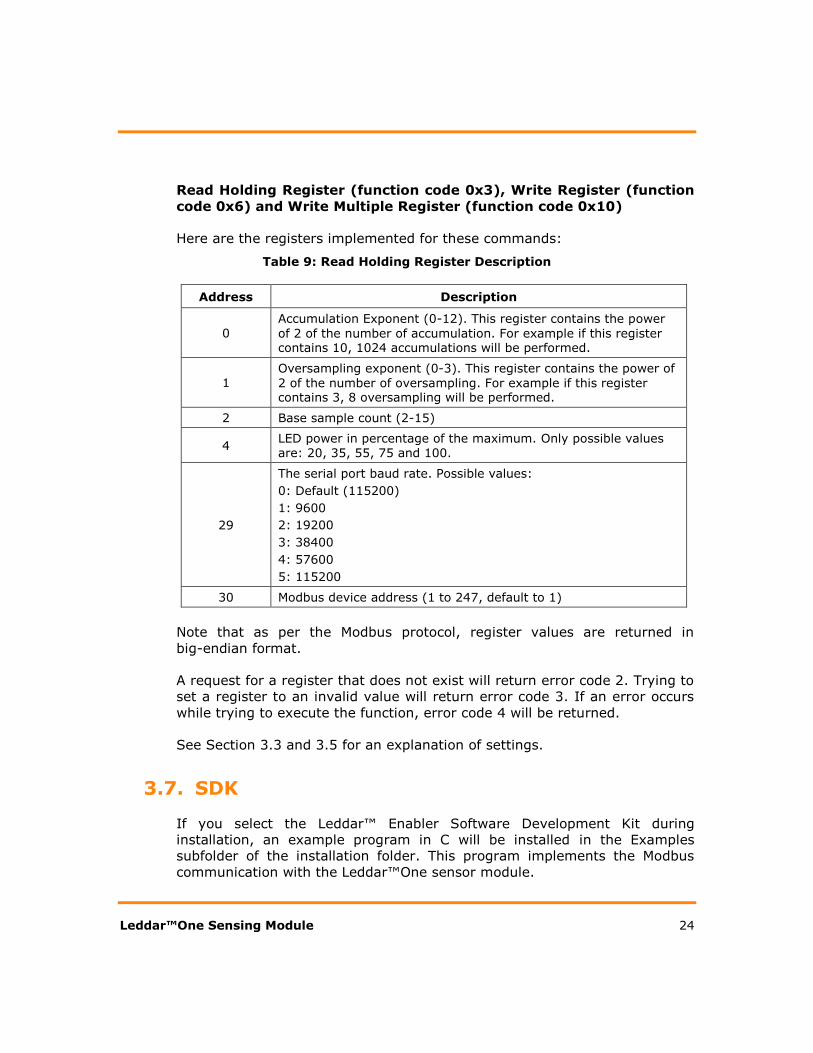
Read Holding Register (function code 0x3), Write Register (function
code 0x6) and Write Multiple Register (function code 0x10)
Here are the registers implemented for these commands:
Table 9: Read Holding Register Description
Address Description
0
Accumulation Exponent (0-12). This register contains the power
of 2 of the number of accumulation. For example if this register contains 10, 1024 accumulations will be performed.
1 Oversampling exponent (0-3). This register contains the power of
2 of the number of oversampling. For example if this register contains 3, 8 oversampling will be performed.
2 Base sample count (2-15)
4 LED power in percentage of the maximum. Only possible values are: 20, 35, 55, 75 and 100.
29
The serial port baud rate. Possible values:
0: Default (115200)
1: 9600
2: 19200
3: 38400
4: 57600
5: 115200
30 Modbus device address (1 to 247, default to 1)
Note that as per the Modbus protocol, register values are returned in
bigendian format.
A request for a register that does not exist will return error code 2. Trying to
set a register to an invalid value will return error code 3. If an error occurs
while trying to execute the function, error code 4 will be returned.
See Section 3.3 and 3.5 for an explanation of settings.
3.7. SDK
If you select the Leddar™ Enabler Software Development Kit during
installation, an example program in C will be installed in the Examples
subfolder of the installation folder. This program implements the Modbus
communication with the Leddar™One sensor module.

Leddar™One Sensing Module 25
The example is heavily commented and easy to understand. It is a command-
line application. It can be used in Windows with VisualStudio 2008 (or later)
with the provided solution. It can be used in Linux with the provided Makefile
(as long as development tools are installed).

Leddar™One Sensing Module 26
4. Leddar™ Configurator
Leddar™ Configurator provides configuration parameters and operation
functionalities for the Leddar™One Sensing Module.
4.1. Installing Leddar™ Configurator
See section 2.1 for guidelines regarding installation of Leddar™ Configurator.
Once the installation is completed, you can connect to the sensor.
4.2. Connecting to the Module
To configure the sensor, you must first connect to it.
To connect to the sensor:
1. In Leddar™ Configurator, click the connect button ( ).

Leddar™One Sensing Module 27
Figure 12: Connecting to a Device
2. In the Connection dialog box, select the serial port that you want to
establish a connection with and click Connect.
The device has default serial port parameters. Once connected, you can
modify the baud rate or/and ModBus Address (see section 4.4.1).
3. The Leddar™ Configuration main window changes to display sensor
information.
Leddar™One Sensing Module 28
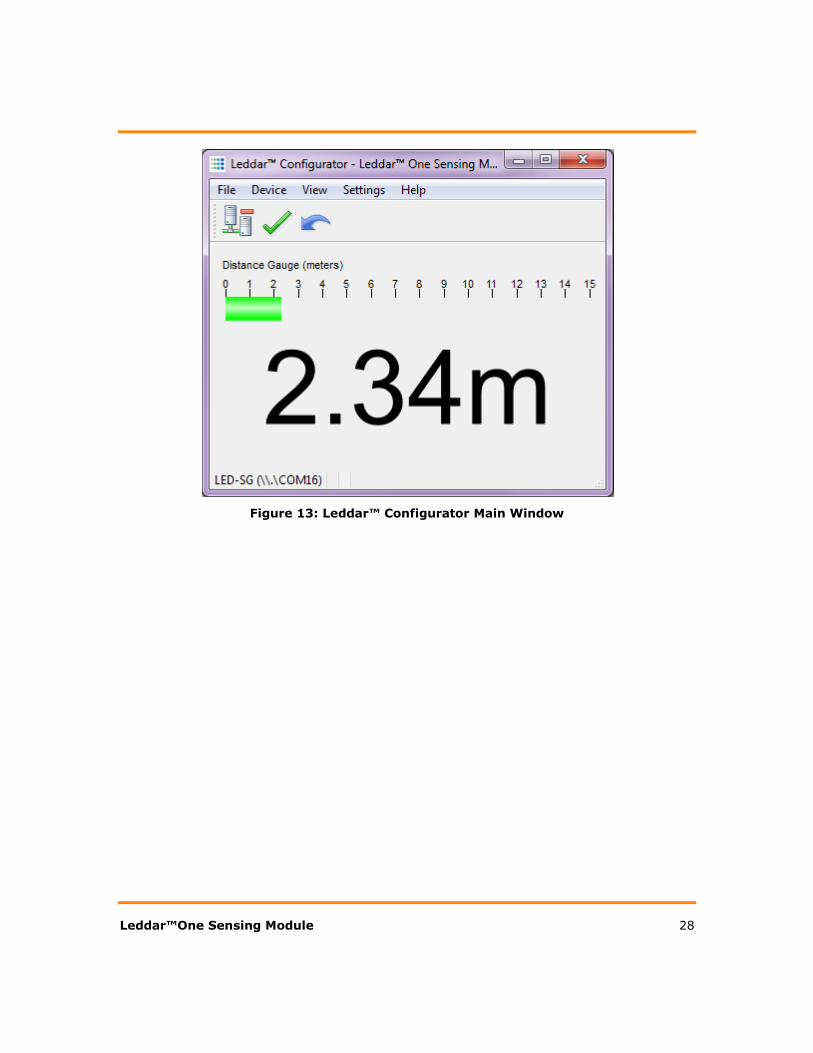
Figure 13: Leddar™ Configurator Main Window

Leddar™One Sensing Module 29
4.3. Leddar™ Configuration Main Window
This section describes the elements of the Leddar™ Configurator main
window.
At the top of the window are the menu bar and the toolbar.
Figure 14: Leddar™ Configuration Main Window
The main area displays the distance of the first detection in numerical form as
well as in a bar in a distance gauge. If present, the second and third detections
will be displayed as thin bars in the gauge (as shown in Figure 14).
The distance gauge is color-coded to represents the detection quality:
yellow for a weak detection
green for a good detection
red for a saturated detection
See section 3.3 for guidelines regarding low and saturated detections.
Leddar™One Sensing Module 30
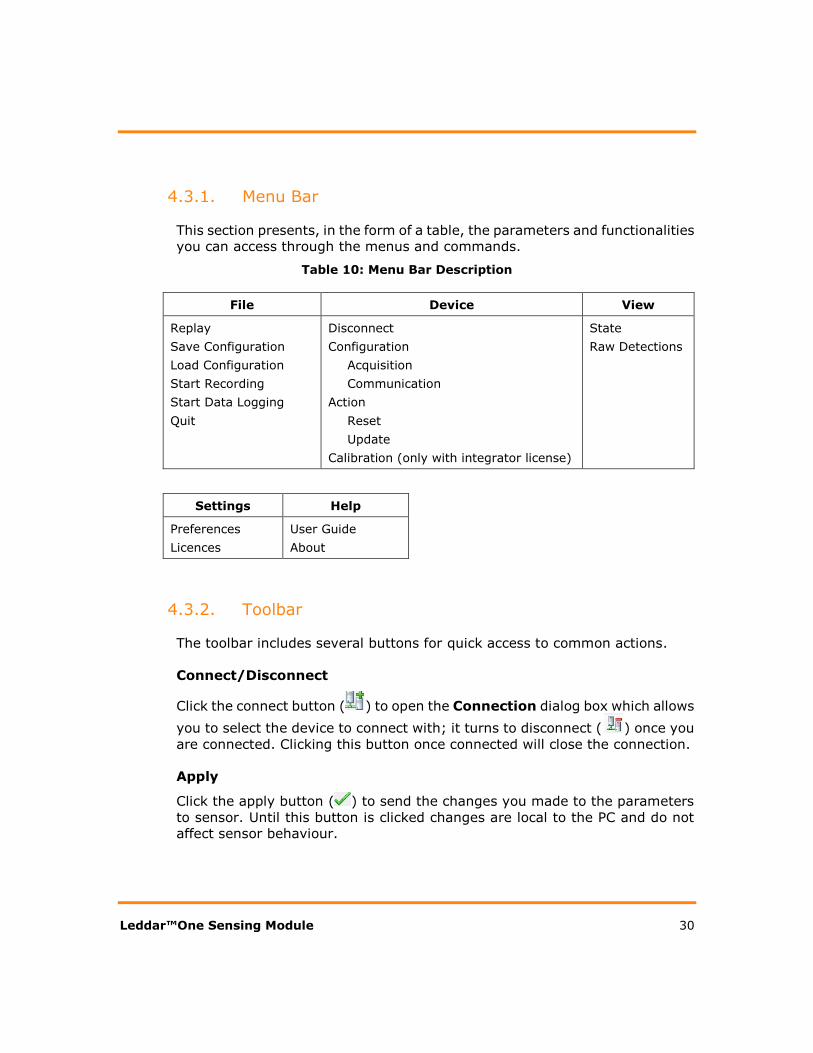
4.3.1. Menu Bar
This section presents, in the form of a table, the parameters and functionalities
you can access through the menus and commands.
Table 10: Menu Bar Description
File Device View
Replay
Save Configuration
Load Configuration
Start Recording
Start Data Logging
Quit
Disconnect
Configuration
Acquisition
Communication
Action
Reset
Update
Calibration (only with integrator license)
State
Raw Detections
Settings Help
Preferences
Licences
User Guide
About
4.3.2. Toolbar
The toolbar includes several buttons for quick access to common actions.
Connect/Disconnect
Click the connect button ( ) to open the Connection dialog box which allows
you to select the device to connect with; it turns to disconnect ( ) once you
are connected. Clicking this button once connected will close the connection.
Apply
Click the apply button ( ) to send the changes you made to the parameters
to sensor. Until this button is clicked changes are local to the PC and do not
affect sensor behaviour.
Leddar™One Sensing Module 31
Undo
Click the undo button ( ) to erases all the changes you have made to the
parameters since the last apply action or connection.
4.4. Using Leddar™ Configurator
This section presents the procedures to view, configure, and analyze
detections from the sensor using Leddar™ Configurator.
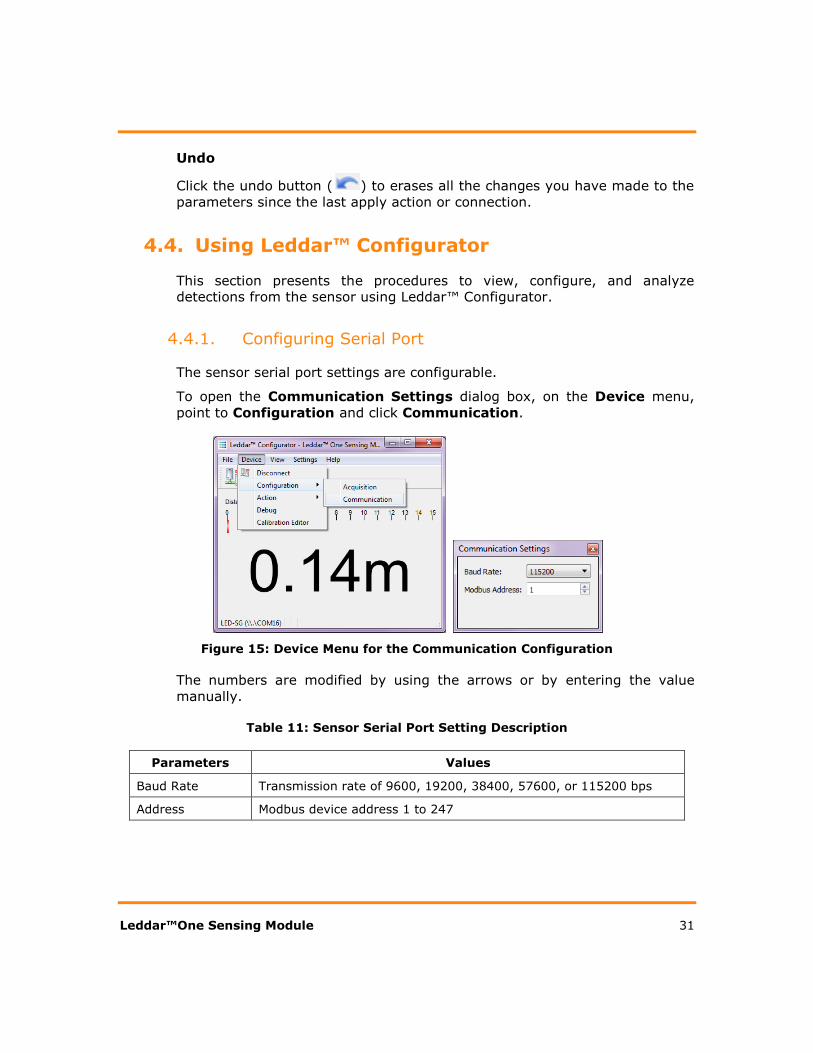
4.4.1. Configuring Serial Port
The sensor serial port settings are configurable.
To open the Communication Settings dialog box, on the Device menu,
point to Configuration and click Communication.
Figure 15: Device Menu for the Communication Configuration
The numbers are modified by using the arrows or by entering the value
manually.
Table 11: Sensor Serial Port Setting Description
Parameters Values
Baud Rate Transmission rate of 9600, 19200, 38400, 57600, or 115200 bps
Address Modbus device address 1 to 247

Leddar™One Sensing Module 32
4.4.2. Acquisition Settings
The acquisition settings allow to define the signal acquisition parameters.
To open the Acquisition Settings dialog box, on the Device menu, point to
Configuration and click Acquisition. See section 3.3 for a complete
description of each setting.
Figure 16: Device Menu and Acquisition Settings Dialog Box
To apply the changes, click the apply button ( ) in the Leddar™ Configuration
main window.
4.4.3. Saving and Loading a Configuration
The software configuration for a device can be saved to a file. This allows to
save a configuration and restore it in case of system failure or in case the user
wants to revert to earlier settings
To save a configuration:
On the File menu, click Save Configuration. A filename and then a comment
to help when re-loading the file will be asked to the user. The comment can
be left blank.

Leddar™One Sensing Module 33
Figure 17: File Menu
To load a configuration:
On the File menu, click Load Configuration and then select a file. Once the
file is selected, information on the file will be displayed and the user will be
asked if this configuration can be sent to the device.
4.4.4. Configuring Detection Records
Detection records provide a playback of detections recorded by a device. This
visual information can be useful for verification, troubleshooting, or training
purposes. Detection records allow for a full data playback stored in a *.ltl file
that can later be reloaded and replayed.
To configure the detection record:
1. On the Settings menu, click Preferences.
Figure 18: Settings Menu
2. Expand the Recording category and click on Recorder to display the
recording parameters. It is noted that a connection to a sensor must be
active for the Recording category to be available.
3. In the Directory dialog box, select the path where you want to save the
record file.

Leddar™One Sensing Module 34
Figure 19: Record Settings Dialog Box
4. In the Maximum file size box, set the maximum file size by using the
arrows or by entering the value manually.
The recording stops for the current file once it reaches the maximum file
size and automatically switches the recording to another file. This is to
keep record files of manageable sizes.
5. Under What, select the Debug check boxes if the recording is to share
with Leddartech technical support. This records additional data and results
in larger log files. It is not otherwise recommended to enable this option.
6. Under How Long, next to Maximum record time, determine the length
of time for a single log file by using the arrows or by entering the value
manually.
7. Click OK to save the settings.
To start a recording:
1. Connect to the sensor for which you want to make a detection record.
2. On the File menu, click Start Recording.
OR
On the computer keyboard, press the <F9> key.

Leddar™One Sensing Module 35
Figure 20: File Menu
To stop a recording manually:
On the File menu, click Stop Recording.
OR
On the computer keyboard, press the <F9> key.
4.4.5. Using Detection Records
Once you have completed a recording, you can review it and extract part of
the recording.
The Record Replay dialog box offers the same functions as a regular video
player: there is a stop button, a play button, and frame-by-frame forward and
backward buttons.
The Position slider lets you move directly to a desired position.
The Playback Speed slider lets you adjust the speed of the recording
playback; faster is to the left.
The Start, End, and Extract buttons allow you to select a portion of the
recording and extract it for further reference or analysis.
To play a record:
1. If you are connected to a device, disconnect from the device.
OR
Open another Leddar™ Configuration software main window.
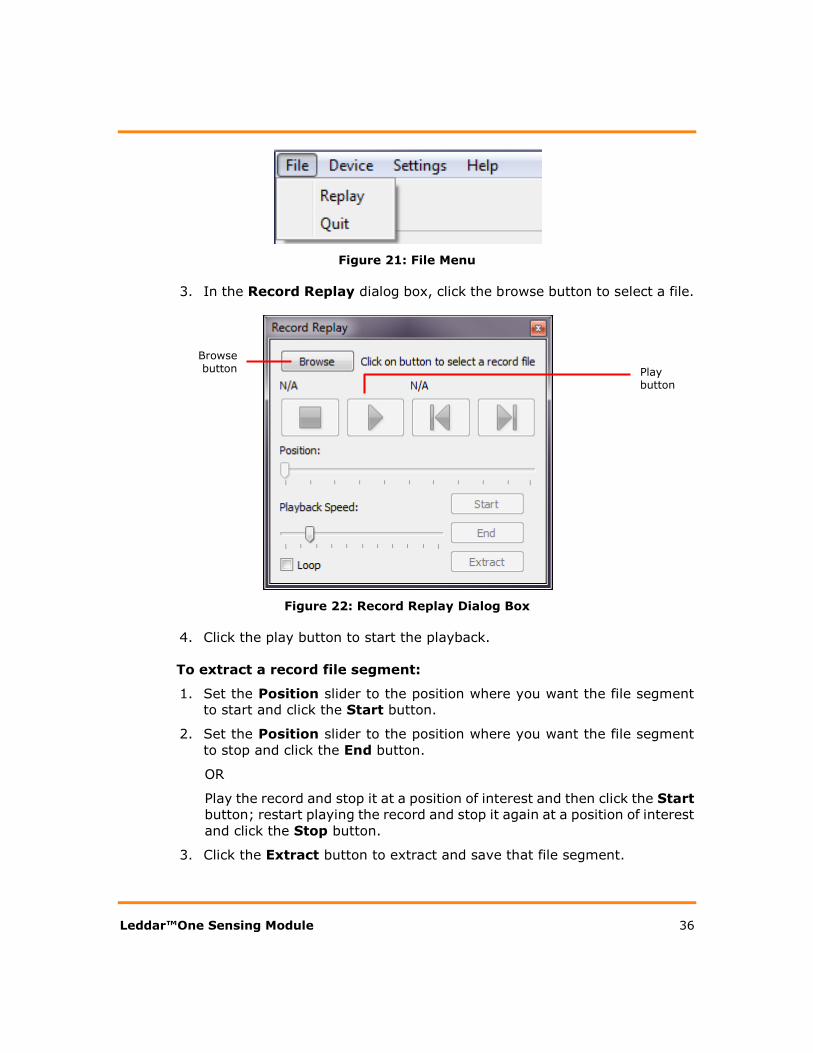
2. On the File menu, click Replay.
Leddar™One Sensing Module 36
Figure 21: File Menu
3. In the Record Replay dialog box, click the browse button to select a file.
Figure 22: Record Replay Dialog Box
4. Click the play button to start the playback.
To extract a record file segment:
1. Set the Position slider to the position where you want the file segment
to start and click the Start button.
2. Set the Position slider to the position where you want the file segment
to stop and click the End button.
OR
Play the record and stop it at a position of interest and then click the Start
button; restart playing the record and stop it again at a position of interest
and click the Stop button.
3. Click the Extract button to extract and save that file segment.
Play button
Browse button

Leddar™One Sensing Module 37
4.4.6. Data Logging
The data logging function is used to output data to a text file. This file can be
imported in a software application, such as Microsoft Excel, for offline analysis.
The duration of the logging is indicated in the status bar.
Each line of the generated text file contains the information related to a single
detection.
Table 12: Data Log Field Description
Time (msec) Segment [Always 1] Amplitude [0 128] Distance (m) Status
422530 1 127.42 6.95 1
The time of the detection is 422530 milliseconds from the time the
sensor was started.
The location of the detection is segment 1.
The amplitude of the detection is 127.42, which is very high (big, near,
or reflective object). Note: Typically the range of amplitude is between
0 and 128 but if the signal is saturated, the range can exceed 128.
The distance of the detection is 6.95meters.
The status is always 1.
To use the data logging function:
1. On the Settings menu, click Start Data Logging…
Figure 23: Setting Menu
2. In the Directory dialog box, click the browse button to select the path
where you want to save the log and click OK.

Leddar™One Sensing Module 38
Figure 24: Data Log Setting Dialog Box
3. On the File menu, click Start Data Logging.
Figure 25: File Menu
4. To stop recording, on the File menu, click Stop Data Logging.
A .txt file is saved in the selected directory.
4.4.7. Raw Detection
The Raw Detections dialog box allows you to view detection values in many
ways. It provides filters to isolate detection parameters.
To open the Raw Detections dialog box, on the View menu, click Raw
Detections. Figure presents an example of raw detections. Only the
detections that meet the amplitude and distance settings appear in the list.
Browse button

Leddar™One Sensing Module 39
Figure 26: Example of Raw Detection Dialog Box
The following is a description of the parameters available in the Raw
Detections dialog box.
Min and Max Amplitude
The value entered in the Min Amplitude box will filter detections with
amplitude lower than that value. For example, if the minimum amplitude is
set to 5, only the detections with amplitude of 5 and more will be displayed.
The value entered in the Max Amplitude box will filter detections with an
amplitude lower than that value. For example, if the maximum amplitude is
set to 8, only the detections with amplitude of 8 and lower will be displayed.
Min and Max Distance
The value entered in the Min Distance box will filter detections at a distance
smaller than that value. For example, if the minimum distance is set to 10,
only the detections at a distance of 10 and more will be displayed.
The value entered in the Max Distance box will filter detections at a distance
greater than that value. For example, if the maximum distance is set to 20,
only the detections at a distance of 20 and less will be displayed.
Segment Column
The Segment column lists the segment for which there is a detection
according to the filters used. The segment numbers are read from left to right
starting at 1. Since the Leddar™One sensor has only 1 segment, this value
will always be one.
Distance and Amplitude Columns
The Distance column displays the distance of the detection and the
Amplitude column displays its amplitude.

Leddar™One Sensing Module 40
Flag Column
The Flag column displays a number that represents a detection type.
See section 3.2 for a description of the measurements data including flags.
4.4.8. Update
This option allows you to update the firmware in your sensor. It should be
used only under the supervision of a LeddarTech support technician.
4.4.9. Preferences
Preferences are used to change various settings related to the display of the
Leddar™ Configurator software.
The Preferences dialog box is opened by clicking the Preferences command
on the Settings menu.
Figure 27: Preference Dialog Box
Under General Windows, click on “Restore window position and size
on startup” checkbox in order to keep the Leddar™ Configurator position and
size on startup or click on “Restore window layout on connection” in order
to keep the Leddar™ Configurator layout on connection.

Leddar™One Sensing Module 41
Under General Leddar™One Sensing Module, some parameters of main
window can be modified.
Select “Show all detections” in order to display multi-detection in the
distance gauge.
4.4.10. License Manager
Some features need an activation key. Contact LeddarTech for more
information.
4.4.11. Device State
Information about a device is accessible by clicking the Device State
command on the View menu.
Figure 28: View Menu
The Device State window opens.

Leddar™One Sensing Module 42
Figure 29: Device State Window
Temperature
This section indicates the temperature of the device.
Timers & Load
This feature gives the time in days, hours, minutes, and seconds since the last
sensor was started.
Acquisition State
This section gives the current intensity of the LED. It is particularly useful
when the device is set in automatic LED intensity, since the user can see the
intensity selected by the sensor.
Serial number
The serial number of the device as assigned by LeddarTech.
Versions
FPGA: The firmware version of the device.
Software: The software version of the device.
Part numbers
This provides the hardware and software part numbers of a device as assigned
by LeddarTech.
Leddar™One Sensing Module 43
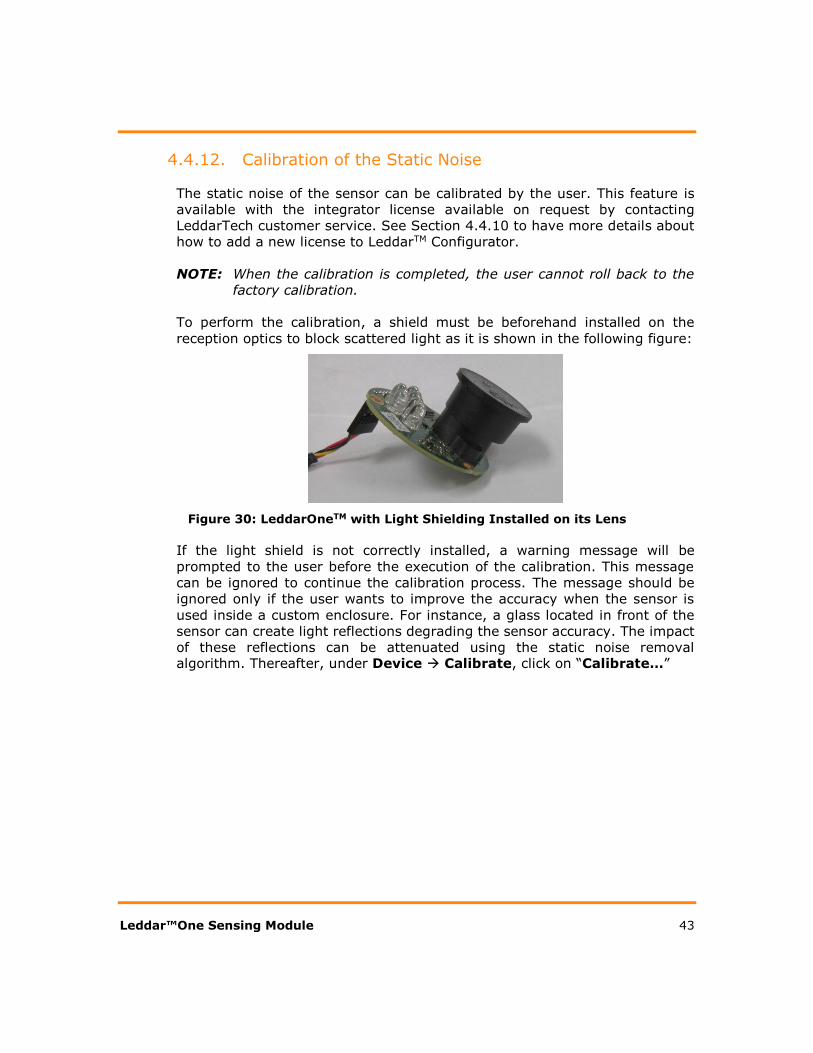
4.4.12. Calibration of the Static Noise
The static noise of the sensor can be calibrated by the user. This feature is
available with the integrator license available on request by contacting
LeddarTech customer service. See Section 4.4.10 to have more details about
how to add a new license to LeddarTM Configurator.
NOTE: When the calibration is completed, the user cannot roll back to the
factory calibration.
To perform the calibration, a shield must be beforehand installed on the
reception optics to block scattered light as it is shown in the following figure:
Figure 30: LeddarOneTM with Light Shielding Installed on its Lens
If the light shield is not correctly installed, a warning message will be
prompted to the user before the execution of the calibration. This message
can be ignored to continue the calibration process. The message should be
ignored only if the user wants to improve the accuracy when the sensor is
used inside a custom enclosure. For instance, a glass located in front of the
sensor can create light reflections degrading the sensor accuracy. The impact
of these reflections can be attenuated using the static noise removal algorithm. Thereafter, under Device Calibrate, click on “Calibrate…”

Leddar™One Sensing Module 44
Figure 31: Calibration Window
A progress bar will show the progression of the calibration. It should take
about 1 minute to execute the calibration. The calibration can be cancelled at
any time by clicking on “Cancel”.
Leddar™One Sensing Module 45
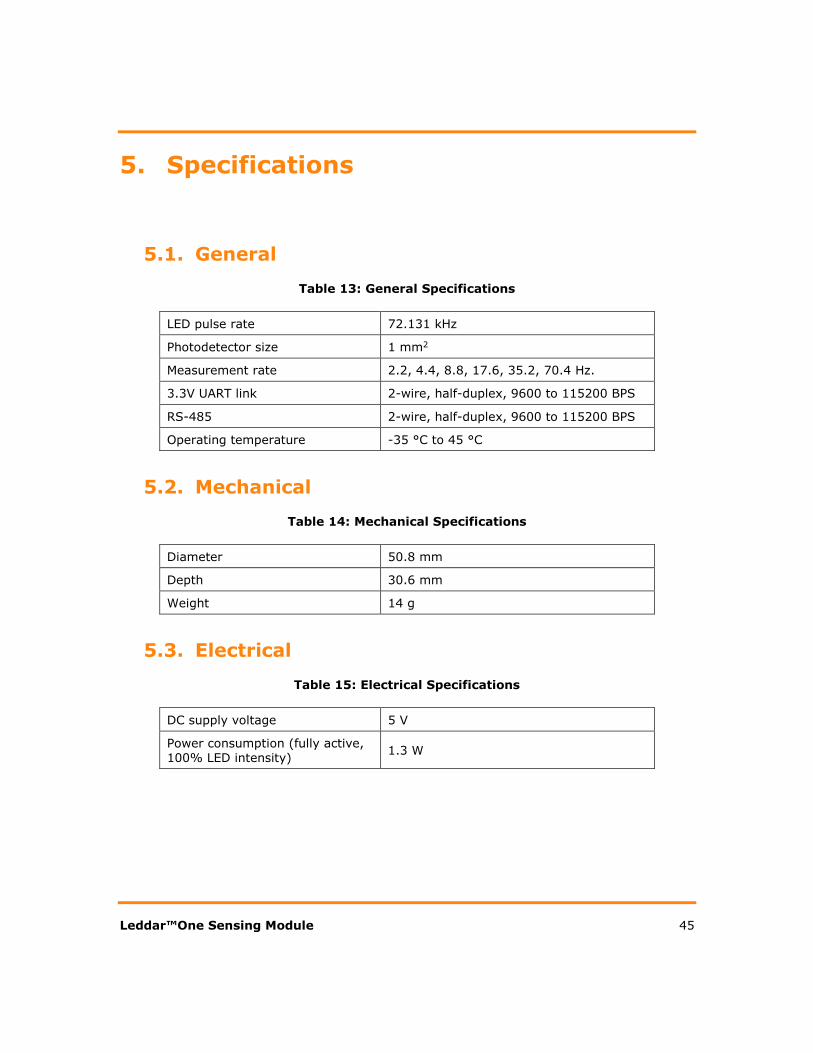
5. Specifications
5.1. General
Table 13: General Specifications
LED pulse rate 72.131 kHz
Photodetector size 1 mm2
Measurement rate 2.2, 4.4, 8.8, 17.6, 35.2, 70.4 Hz.
3.3V UART link 2-wire, half-duplex, 9600 to 115200 BPS
RS-485 2-wire, half-duplex, 9600 to 115200 BPS
Operating temperature -35 °C to 45 °C
5.2. Mechanical
Table 14: Mechanical Specifications
Diameter 50.8 mm
Depth 30.6 mm
Weight 14 g
5.3. Electrical
Table 15: Electrical Specifications
DC supply voltage 5 V
Power consumption (fully active, 100% LED intensity)
1.3 W
Leddar™One Sensing Module 46
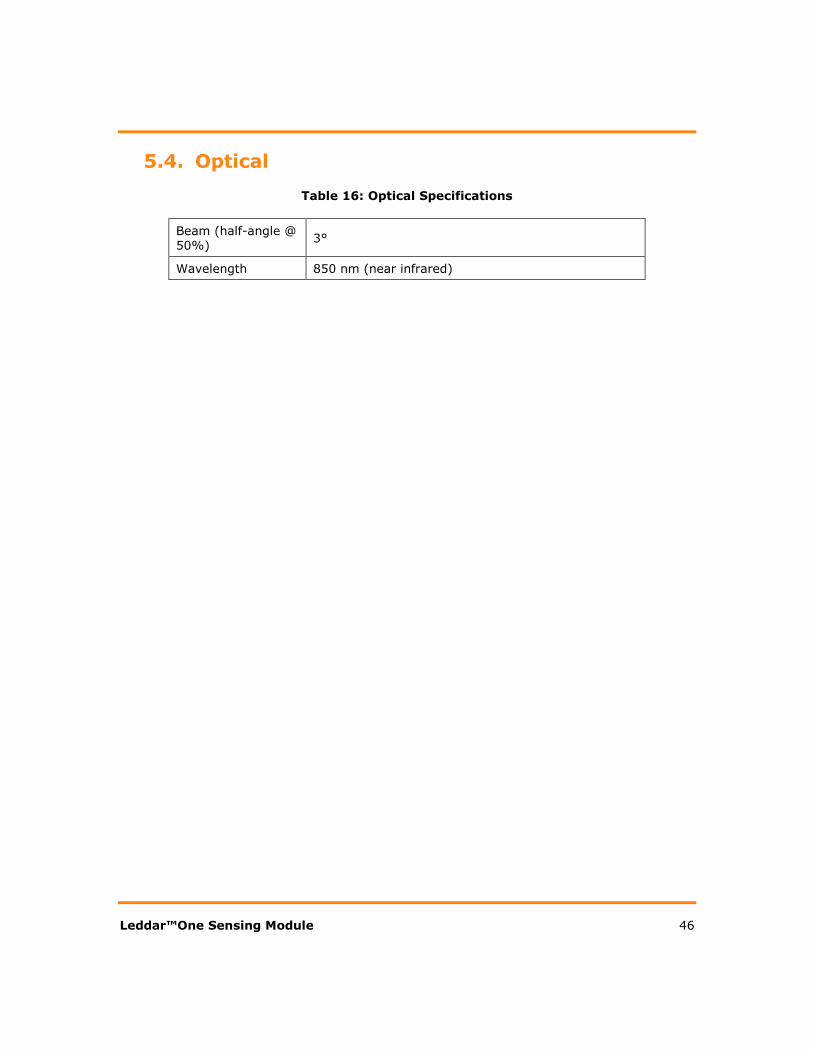
5.4. Optical
Table 16: Optical Specifications
Beam (half-angle @ 50%)
3°
Wavelength 850 nm (near infrared)

Leddar™One Sensing Module 47
5.5. Performance
Table 17: Sensor Performance Summary
Performance Metrics Values Descriptions
Measurement Accuracy* ±5 cm Distance measurement error.
Measurement Accuracy with Saturated Signal
±10 cm -
Measurement Precision 5 mm (1 𝜎) Standard deviation of
the measured distance.
Resolution** 3 mm Smallest distance variation detected by the sensor
Range (maximum LED intensity)
See Figure 34 -
Distance Measurement Settling Time on Cold Startup
< 10 s -
* Using a target returning a signal stronger than 5 counts.
** Measured with a 5x7 cm reflective tape installed at 10 m from the sensor.

Leddar™One Sensing Module 48
5.5.1. Accuracy
Figure 32: Accuracy versus Target Reference Distance (accumulation 256 and oversampling 8)
5.5.1. Supply Voltage versus Accuracy
Figure 33 shows the distance measurement offset as a function of the sensor
supply voltage.
Figure 33: Accuracy versus Supply Voltage
0 5 10 15 20 25 30 35 400
10
20
30
40
Me
su
red
Dis
tan
ce
(m
)
0 5 10 15 20 25 30 35 400
0.02
0.04
0.06
0.08
Reference Distance (m)
Err
or
(m)
Reflective Tape, 5x7 cm
Kodak White Card 90%, 20x25 cm
Kodak Grey Card 18%, 20x25 cm
4.4 4.6 4.8 5 5.2 5.4 5.6 5.8 6-0.3
-0.2
-0.1
0
0.1
0.2
0.3
0.4
Supply Voltage (V)
Dis
tan
ce
Offse
t (m
)
Led Power = 100 %
Led Power = 20 %

Leddar™One Sensing Module 49
5.5.1. Range
Figure 34: Signal Amplitude versus Target Reference Distance (accumulation 256 and oversampling 8)
0 5 10 15 20 25 30 35 4010
-1
100
101
102
Reference Distance (m)
Sig
na
l M
ag
nitu
de
(co
un
ts)
Reflective Tape, 5x7 cm
Kodak White Card 90%, 20x25 cm
Kodak Grey Card 18%, 20x25 cm
White Wall

Leddar™One Sensing Module 50
5.5.2. Detection Threshold
The detection threshold tables are designed to provide robust detections and
to minimize false detections caused by noise in the full-waveform signal. They
are presented in Figure 35.
Figure 35: Threshold Tables
The multiple lines on each graph present the thresholds for numbers of
accumulations of 1 (top curve), 2, 4, 8, 16, 32, 64, 128, 256, 512, 1024, 2048
and 4096 (bottom curve).

Leddar™One Sensing Module 51
5.6. Regulatory Compliance
Table 18: Regulatory Compliance
Test Name
Standards Test Specifications
Performance
Criterion Results
Radiated Emissions
FCC part 15 (2013) subpart B
Class A
30MHz-1GHz N/A Pass
Radiated Emissions
CISPR11 (2009) A1 (2010)
Group 1 - class A
30MHz-1GHz N/A Pass
Radiated Emissions
ICES-003 (2012)
Class A
30MHz-1GHz N/A Pass
Electrostatic Discharge
Immunity
IEC61000-4-2 (2008)
Contact : ±4kV
Air : ±8kV B Pass
Radiated Electromagnetic
Field Immunity
IEC61000-4-3 (2006)
A1 (2007) A2 (2010)
80MHz-1000MHz : 10V/m
1.4GHz-2GHz : 3V/m
2GHz-2.7GHz : 1V/m
A Pass
Power Frequency Magnetic
Field Immunity
IEC61000-4-8 (2009)
Continuous Field : 30A/m /
50Hz & 60Hz A Pass
Note: Testing results are valid for cable length less than 3 meter.

Leddar™One Sensing Module 52
5.7. Dimensions
Figure 36: Dimensions

Leddar™One Sensing Module 53
6. Help
For technical inquiries, please contact LeddarTech technical support by
registering online at www.leddartech.com/support to easily:
Follow up on your requests
Find quick answers to questions
Get valuable updates
Or by contacting us at:
+ 1 418 653 9000
+ 1 855 865 9900
8:30 a.m. - 5:00 p.m. Eastern Standard Time
To facilitate the support, please have in hand all relevant information such as
part numbers, serial numbers, etc.
Company address
LeddarTech Inc.
2740 Einstein Street
Quebec, QC G1P 4S4
Canada
www.leddartech.com