LED STRATEGY METSIMAHOLO LOCAL MUNICIPALITY
98
LED STRATEGY METSIMAHOLO LOCAL MUNICIPALITY MAY 2010
Transcript of LED STRATEGY METSIMAHOLO LOCAL MUNICIPALITY

LED STRATEGY
METSIMAHOLO LOCAL MUNICIPALITY
MAY 2010

2
SECTION ONE:
1. INTRODUCTION
The purpose of the MLM LED Strategy is to develop a framework for economic growth and
development. Whilst the development of economic sectors and industries is the focal point, the
objective is to ensure skills development, quality employment, SMME and Co-operative development
becomes part of the outcome during implementation. The Metsimaholo Local Municipality (MLM)
Integrated Development Plan (IDP) describes the overall challenges as follows:
“Like many other developing municipalities in the country, Metsimaholo Local Municipality faces a
number of developmental challenges, dominated by limited employment opportunities and
consequently unemployment and poverty among community.”1
The economic outcomes of the strategy is not intended at measuring growth only, but the ability to
respond to social needs like education, health, recreation and the general quality of life. Though the LED
Strategy review study is not going to deal with social issues, its objectives is to assist the MLM to
responds to social services. In essence, these outcomes should define the core of government’s policy
on the role and the function of a developmental government.
The over-arching government policy is to response to the Millennium Development Goals (MDGs); which
is to halve poverty in the world. Initially the time-frame to halve poverty was 2014 but due to the global
economic recession, the targets will not be met. However the main objective of halving poverty in the
world remains, and will continue to inform national governments. As per the United Nations’
declaration, the over-arching objective of the MDGs “is to increase the number of households that earn
an income, and to increase the income per household to above the minimum living level.“
2. BACKGROUND
According to the IDP of the MLM, LED is Priority Need 5, and the following table details the key
performance areas, objectives, indicators and strategies.
Priority Need 5: LED & Poverty Alleviation
Development Strategies KPA: Local Economic Development
IDP Objectives Key Performance Indicators (KPI)
To stimulate the growth of SMMEs and entrepreneurs that contributes to a significant reduction of unemployment and poverty in the region.
Number of jobs created through LED initiatives by the Municipality.
Self sufficient and sustainable
Strategy 1: Capacity Building
By implementing policies and programmes that will assist in giving preference to local SMME and upcoming
1 MLM IDP 2009/2010, p.5

3
To continue to effectively contribute a higher proposition of economic growth rate within the district.
SMMEs.
Percentage implementation of the focus areas of LED National Framework
contractors when allocating large scale projects.
Strategy 2: Marketing
By formulating and introducing incentive schemes that will attract investors and specifically light industries.
Strategy 3: Economic development
By downstream effectively exploiting all opportunities offered by local industries and to assist local entrepreneurs to establish formal business in various sectors.
By developing a process for the replacement of job losses due to rationalization, in partnership with businesses and industries.
To aggressively implement poverty alleviation programmes jointly with all sector departments that will drastically reduce the poverty levels of the area.
Strategy 4: Stimulating agricultural activities
By identifying land for the establishment of small holdings, commonage and farms for emerging farmers.
3. PURPOSE OF THE MLM LED STRATEGY
In achieving the targets of the MDGs, the MLM LED Strategy seeks to provide a framework that will
define outcomes aligned to the objectives of the MDGs. Specifically the purpose, objectives, and
intended impacts are derived from the IDP’s Priority Need Five. In consolidating the priority need, the
following summary is suggested.

4
The purpose of the MLM LED Strategy includes the following:
The development of local human capital that will provide capacity to the development of sectors
The creation of quality employment for local people in various sectors of the local economy
The stimulation of entrepreneurship through value chain development in sectors
The objectives of the MLM Strategy include the following:
To beneficiate the existing manufacturing industry and diversify the local economy (that is, the
ability to develop value chain in any industry)
To develop and position the Metsimaholo economy as the most performing economy in the
Free State Province.
To develop and position the Metsimaholo economy as a leading leisure destination in the Free
State Province
To develop and position the Metsimaholo economy as a leading retail destination in the Fezile
Dabi District.
The intended impacts include the following:
The development of highly skilled people in the local economy
The increase in employment of local people in the local economy
The development of SMMEs and Co-operatives in various sectors of the local economy
The over-riding theme of the MLM LED Strategy is that the development of value-chain in sectors is
generic. The linkage between skills development, job creation and small business is intrinsic. Inversely,
the lack of small business development is partly informed in the absence of skilled local people.
Similarly, the development of small businesses is not only defined within the establishment of centers of
support (eg. LSBDC), but in the ability of the center to employ skilled people to promote
entrepreneurship and the ultimate development of SMMEs.
4. THE STRATEGIC THRUSTS OF THE MLM LED STRATEGY
There are two main thrusts defining the MLM LED Strategy. The first is the South African government
policy, and secondly is defining the strategy as a framework to guide the implementation of economic
growth and development locally.
4.1. Understanding Government Policy on LED
The framework guiding LED in South Africa is defined within legal and policy imperatives. The white Paper on Local Government (1998) stipulates that “The Constitution states that local government is

5
responsible for promoting the social and economic development of communities. This provides municipalities with a mandate to provide special economic services, or to assist other agencies with the provision of such services, where appropriate.” This constitutional imperative is informed in a number of factors, primary among is the challenge to develop a “pro-poor” LED strategy. “Local Economic Development (LED) is a discipline still coming into its own, with competing strands of argumentation still generating conflict. At the root of the conflict is debate over whether traditional types of local strategies, applied in Southern and Eastern Africa, a) are working, and b) are generating "pro-poor" economic development - or instead, simply more "uneven development."2
The South African government policy is articulated in the Reconstruction and Development Programme LED mandate which emerged in the African National Congress campaign platform during the first democratic election in South African history:
s.4.3.5 In order to foster the growth of local economies, broadly representative institutions must be established to address local economic development needs. Their purpose would be to formulate strategies to address job creation and community development (for example, leveraging private sector funds for community development, investment strategies, training, small business and agricultural development, etc.). If necessary, the democratic government must provide some subsidies as a catalyst for job-creation programmes controlled by communities and/or workers, and target appropriate job creation and development programmes in the most neglected and impoverished areas of our country. Ultimately, all such projects should sustain themselves.
Two years later, in 1996, the Constitution established the following "socio-economic rights" that municipalities must observe:
s.24(1) Everyone has the right a) to an environment that is not harmful to their health or well-being; and b) to have the environment protected... s.26(1) Everyone has the right to have access to adequate housing... s.27(1) Everyone has the right to have access to a) health care services, including reproductive health care; b) sufficient food and water; and c) social security, including, if they are unable to support themselves and their dependents, appropriate social assistance.
The meaning of these rights are still being established in case law, including the September 2000 "Grootboom Decision" which deemed both national and municipal policies unconstitutional because neither the Department of Housing in Pretoria nor the Western Cape province's Westdene municipality offered even short-term emergency housing and municipal services to the poorest of the poor.
It is against the above-mentioned legal and policy considerations that the MLM LED Strategy is developed.
In essence, the MLM LED Strategy defines government programmes (eg. skills development, job creation, SMME and Co-operative development) as outcomes, as opposed to such programmes as either inputs or outputs.
2 Local Economic Development Debates in South Africa (February 2002, Occasional Papers Series #6: Patrick Bond)

6
4.2. What is a Strategy There are various definitions and understandings of what a strategy is all about. At one level a strategy is understood as plan with specific deliverables and is measurable; while at another a strategy is a framework that guides the formulation of certain plans for implementation. The former defines the plan as an outcome whilst the latter defines it (plan) as an output. In the context of the MLM LED Strategy, a strategy is understood as framework consisting of a series of inter-connected activities within the local economy. A strategy is about o understanding the “business” that you are in, o where competitive advantage exist within your sphere of control and then o building the competencies needed to harvest that advantage in the face of o resource constraints and future uncertainty.
A strategy is about consistent behaviour, values and principles against which managerial and planning
decisions can be tested and resources allocated.
With regard to understanding strategy in the context of this review study, a reference is made from the
Amathole Regional Economic Development Strategy (AREDS). The approach used for the MLM LED
Strategy diverges “from “strategy as a plan” and tends to “strategy as a series of processes and evolving
interventions” focused on achieving the overall objective. This implies that the strategy and framework
do not detail all projects and activities, but rather encourage and support a culture of continuous
learning, “joining-up” and innovation that builds on, and actively invests in, value chains and sectors
where
o Competitive advantage exists and
o Distinctive competencies can be built that will result in dramatic leaps forward in economic value
addition, innovation, competitiveness and higher order economic opportunity.”
Primarily, the objective of the strategy is to identify local competitiveness through sectors, industries,
and the required human capital resources to enable the environment for investment. Secondarily, the
objective is to identify challenges inhibiting an enabled environment for attracting investment, both
public and private investment. Tertiary is identification of key strategic interventions and possible
impact of the MLM LED Strategy.
5. IMPLICATIONS FOR MUNICIPAL OPERATIONS
The development of the LED Strategy is not only about the growth and development at a macro-level, but on the ability of the local municipality to champion its implementation. Specifically, the strategy seeks to communicate to the local municipality to understand the position, role and function of the LED in relation to other municipal functions. The function of LED in municipalities is located in different departments (directorates) or units. Some municipalities have placed LED in the office of the Municipal Manager (MM); others have placed in the Department of Development and Planning; others in the Department of Housing, or defined it as a separate directorate or unit that is accountable to the MM. Besides the placing, most of the LED

7
functions are limited to facilitating social initiatives in communities. Often than not, the role of LED in most municipalities is peripheral. This is visible in the way each municipality place and resources LED. For instance, the MLM does not have a LED unit or directorate. Instead, LED is integrated within the Directorate of Housing, Planning and LED. Similarly, currently the directorate has an Assistant LED Manager as the one and only human resource. The proposed MLM IDP is suggesting the recognition of LED as central to the operation of the municipality, as well as key to service delivery. By implication, the proposed MLM IDP is presented as follows:
Municipal Manager
Chief Operation Officer
ICT
Internal Audit
Unit Managers
(Geographic Integration
Points)
IDP
PMS
Security
Directorate:
Organisational
Corporate & Services
Directorate: Financial
Services
Directorate: Technical &
Infrastructural Services
Directorate: Economic
Development & Planning
HR Management
Record Services
Legal Services
Talent Management
Administration /
auxiliary services
Parks, Recreation &
Cultural Services
Public Safety, Fire and
Disaster Management
Waste Management
Budgets & Expenditure
Income Division
Assets & Statements
Supply Chain
Management
Directorate: Social
Development
Project Management
Civil Engineering
Electrical & Mechanical
Engineering
Urban Planning
Housing & Property
Management
Economic Development
Functional View of Metsimaholo Municipality - Proposed
Legend
Newly proposed
function
Functional areas /
directorates
Sub-function
Relocated sub-
functions
Sub-directorates
Sub-directorates
Sub-directorates
Sub-directorate
Sub-directorate
However, the importance of LED in the MLM IDP is presented as a Priority Need Five. According to the MLM Integrated Development Plan (IDP), since 2007, there are 18 initiatives identified for LED and poverty alleviation. The total budget for LED and poverty alleviation is about R82 million. These initiatives are defined over five years. Of the total budget, 20% is allocated to development of plans, schemes and strategies; 10% for small business; 01% for training; 15% for a retail facility; 12% for recycling plant; 30% for infrastructure for tourism; and the rest is allocated to other poverty alleviation

8
initiatives. Despite the allocation, the IDP notes that most of the initiatives are not yet funded. A summary of the initiatives are presented as follows:
Project Name Project Specifications
Funding Details Project Time Frames Funding Source Estimated
Amount
LED and Poverty Alleviation
Removal of Ash Dump at Molsteen Pan, Gortin
R5 000 000
2007 – 2011
Sand Stone Project at Molesteen Pan,Gortin
R100 000 2009 – 2012
Development of portion of Subdivision 52 of Farm Herewarde 409 for shopping mall
Unidentified R15 000 000 2007 – 2011
Development of Local Economic Development Strategy
DPLG R500 000 2007 – 2011
Developing the business services incubator
Anglo Coal R9 000 000
2009 – 2012
Investigate feasibility for creation of local business service centre and business incubator
Own Revenue, DPLG and DTI
R760 000 2007 – 2011
Facilitate training of emerging farmers and other sectors
Own Revenue R20 000 2007 – 2011
Facilitate at least 3 business seminars per annum
Own Revenue R30 000 2009 /10
Finalization of land use management scheme
DPLG R270 000 2008 / 09
Brick and paving block manufacturing plant
Sasol Mining R3 000 000 2009 – 2012
Recycling plant Anglo Coal R9 000 000 2009 – 2012
Building of bridge Dept. of Public R13 000 000 2010 – 2012

9
and scenic walkways and creation of Art and Flee Market on both sides of Vaal River
works
Hydroponics Farm (Amelia)
Dept. of Land Affairs / Dept.of Agriculture
R1 500 000 2007 – 2011
Poultry and piggery farming
Sasol Mining R3 000 000 2009 – 2012
Vegetable farming Sasol Mining R3 000 000 2009 – 2012
Urban renewal strategy
In-house, DBSA & DPLGH
R3 000 000
Housing sector plan In-house R500 000
Vaal 21 projects FDDM,In-house R5 000 000
Tourism Strategy/ Master plan
In-house
The projected budget for the next three financial years is estimated around R1, 7 billion, and the specific LED and poverty alleviation budget to about R82 million. In essence, the LED budget is less than 10% of the total municipal budget. The contrast between the municipal budget and specific budget explains the MLM’s state of LED. However, the development of the MLM LED strategy will have huge bearing on the LED status quo. Some of the implications are as follows:
Defining the LED within a developmental local government
The centrality of LED in the municipality
The location of LED within the municipal organogram
The capacity needed for LED
The resource implications to drive LED The interventions proposed in the MLM LED strategy are not necessarily new to municipal roles and functions. However, prioritization of certain functions and specific initiatives are definitive to other directorates within the municipality. For instance, the provision of infrastructure through the Directorate of Technical Services will be informed by strategic economic imperatives. The development of infrastructure to promote the real estate sector may dictate the priorities of the directorate. Currently the directorate’s priority may be the provision of social services, but the LED strategic imperative may suggest that investment in real estate is a priority. This analogy provides the central nature of LED in defining service delivery within the MLM. To harmonizing the IDP and the SDF of the Metsimaholo Local Municipality is critical, the LED strategy is a platform and a vehicle to achieve congruency and the ultimate balance between the IDP and the SDF. Currently the MLM IDP and SDF do not sing from the hymn, or rather, are not on the same wavelength. For instance, the infrastructural projects in the IDP are informed by social needs, rather than economic imperatives. For example, the absence of the infrastructure in Orangeville in the IDP does not prioritise

10
the development of the real estate, the Lizard Point. It is in this instance that the LED strategy seeks to assist the MLM to prioritise its response to socio-economic needs.
6. CONCLUSION The MLM LED strategy seeks to provide a guide for implementing economic growth and development. The constant emphasis on growth and development is deliberate. This is intended at distinguishing between an economy that is contributing enormously to the district and province, yet the levels of poverty and unemployment are similar to the least contributing locality. The purpose, objectives and intended impacts are based on the need to activate a skilled community that will define the direction the local economy will take, as well as ensuring viability and sustainability. Specifically, the strategy strives for defining the economic needs of the local economy, as well as the strategic interventions to respond to the opportunities of such an economy. The prioritization and development of relevant skills for the local economy are fundamental is defining a pro-poor LED.
SECTION TWO: METHODOLOGY
The terms of reference (TORs) of the review study determines the nature of the report. In approaching
the review, a number of propositions and activities are made and undertaken in ensuring an appropriate
methodology. These include the following:
a) Proposition One: Inception

11
During the inception, a preliminary briefing session was held with the Department of Economic
Development, Housing and Planning, wherein the ToRs were discussed and consensus reached between
the Metsimaholo Locality Municipality and Baitseanape Investments.
Thereafter Baitseanape Investments developed a framework that informs the MLM LED Strategy. The
first presentation was made to the Executive Management of MLM, the second presentation was made
to the Mayoral Executive Committee of the MLM Council, and the third presentation was made to the
Local Business Forum.
b) Proposition Two: Desk-top Research
On desk-top research, preliminary data informing the review study is derived from the 15-year Review
of the Presidency, the ANC Manifesto 2009, the Free State Growth and Development Plan (FSGDP), the
Free State Provincial Economic Review and Outlook (PERO), The Fezile Dabi Integrated Development
Plan, Integrated Development Plan of the MLM, and MLM the Spatial Development Framework (SDF)
Review 2010/11. Comparison to that LED Strategies is made to determine similarities and differences in
the review study.
The following areas were dealt with during this process:
The comparison of economic performances across the three spheres of government
The economic contrast between the three spheres of government
The focus on the district of Fezile Dabi
The specific economic performance of the Metsimaholo economy
The general outlook of the national and provincial economy
Challenges and opportunities facing the Metsimaholo economy
Through the desk-top study, the objectives included determining the economic status quo,
demographics, and the state of local competitiveness (eg. assets and human capital).
c) Proposition Three: Fieldwork
Three participatory processes define the data of the LED review process. These include the following:
The IDP Review Process
The SDF Review Process
Interaction with the Local Business Forum
As per the legal prescription, the annual review of the IDP forms the integral part of each municipality.
During the review, various stakeholders and role-players are invited to make submissions on broader

12
social and economic needs. Similarly, the municipality utilizes the participatory process to communicate
certain issues relating to service delivery.
The outcome of the current IDP review has not fundamentally changed the social and economic needs
of the Metsimaholo community. Instead, the impact of the recession has increased the need for skills
and jobs in the area. The process reinforces the proposition to focus the strategy on utilizing the
development of human capital as one of the objectives in implementing LED.
The SDF review process was undertaken jointly with the LED participatory process. The main reason to
undertake a joint process is underpinned in the understanding of a Spatial Economic Development
approach. Since the end of apartheid there has been a new thinking in understanding economic
development and redressing the inequality in South Africa. Specifically, the dawn of the apartheid
coincided with three inter-linked economic paradigms. The first is informed in some fundamental
failures in the market economy, and the need for state intervention in certain areas; hence the idea of a
Developmental State. Secondly is the impact of globalization, which economically dismantled national
bodies and relegated economic activity along local regional lines; hence the concept Local Economic
Development (LED).
Lastly is the concept of Spatial Economic Development (SED), where the understanding is that the
economic imperatives be the primary drivers of spatial development. Though the historiography of the
three approaches emanated from the different strands, the overarching theme is that all of them are
located within the South African government’s realm of legal and policy thinking and practice. It is then
in this regard the strategic thinking around the Metsimaholo Local Municipality LED will be approached.
Similarly, the review process of the SDF expanded on a number of issues, particularly from the local
business community. The issue of land acquisition, approvals, the Environmental Impact Assessment
(EIA) processes, the informal sector and infrastructure investment dominated the participatory process.
1.1.1. Limitations to the Review Study
As a review, the study does not provide for a detailed methodological approach. This means that the
terms of reference do not require from the service provider to undertake a full research study on
changes on the nature of the needs of the community, the economic competitiveness of the municipal
area, and the impact on growth and development. Instead the outcomes of the reviews will be based on
approximation.
Secondly, it is noted that the amount of resources (particularly the cost) are limiting on the amount of
work that will undertaking in this study.
1.1.2. Mitigating factors
It is the understanding of this study that the development of a LED Strategy is informed in a number of
considerations within the municipality. These include the primary role of the Integrated Development
Plan (IDP) in informing and determining LED. As required by legal imperatives, the annual review of the
IDP includes community participation. This includes interaction with the stakeholders, role-players, and

13
the broader community. The main objective of the community participation is to determine the
community’s social and economic needs. These include infrastructure, education, health, recreation,
skills development, jobs, and the general service delivery needs. It is then in this regard that the IDP
Review Process will serve as a data mining exercise towards the review of the LED Strategy of
Metsimaholo.
Secondly, the review of the Metsimaholo Spatial Development Framework will also serve as reservoir for
the LED Strategy Review Process. The reviews of both the SDF and the LED Strategy were concurrently
being undertaken and defined within the Spatial Economic Development (SED) paradigm. In this
paradigm, the understanding is that, it is not the movement of goods and service that primarily informs
spatial development, but the economic competitiveness of the area that will inform the spatial planning
and development. It is against the backdrop that the mitigation will be presented.
SECTION THREE: THE METSIMAHOLO ECONOMY IN CONTEXT
According to the Global Insight Regional Explorer 2009, “the global economy is in the midst of the most severe recession since the Great Depression of the 1930s. Massive amounts of wealth have been and are being destroyed across many countries and industry sectors. The global financial sector continues to experience serious strains and many governments and monetary authorities are struggling to define the right combination of monetary and fiscal stimuli to jump start the global economy. Global growth projections continue to be adjusted downwards, with the most recent estimates pointing towards outright contractions in real gross domestic product (GDP) in the US, euro area and some other

14
developed economies. The International Monetary Fund (IMF) downgraded its forecast for the global economy from the previous forecast of 2.2% and 3.8% for 2009 and 2010 respectively to 0.5% and 3.0% respectively. This year, the advanced economies are expected to contract by 2.0%, while the emerging markets will expand by just 3.3%. Among the major advanced economies, GDP is projected to decline by 1.6% in the US, 2.0% in the euro-zone and 2.6% in Japan. Among the major emerging markets, GDP is projected to rise by 6.7% in China, 5.1% in India and 1.8% in Brazil, but will slip 0.7% in Russia (SSGA, 2009).” With global demand deteriorating rapidly, the prices of commodities fell sharply. For instance, the international price of crude oil declined from a peak of more than US$147 per barrel in mid-2008 to levels around US$50 per barrel at the end of December 2008, while international prices of food commodities receded by approximately 30% over the same period. Commodity prices, which have been trending higher since 2003, continued the robust rise that began in 2007 into the first half of 2008. As of mid-November, prices have fallen sharply, giving up most of their gains of the first half of the year. This contributed to significantly lower projected inflation rates (SARB, 2009). However, it seemed clear that Africa and other developing areas and countries would not be able to escape a slowing of economic growth in the wake of weaker global demand and declining prices of export commodities. The crisis in advanced economies will affect Africa via two channels. Firstly, the drop in commodity prices, combined with falling demand, will translate into weaker export earnings. Secondly, foreign direct investment will be sharply reduced; forcing businesses and governments to shelve much needed capacity expansion and infrastructure spending plans (Nedbank, 2009). Sub-Sahara Africa’s growth has been revised downwards from 5.1% and 5.7% in 2009 and 2010 respectively to 3.5% and 5.0% respectively (IMF, 2009). Growth in the Republic of South Africa trailed growth in other African economies in 2008, slowing markedly to an estimated 3.4% from 5.1% in 2007. Power outages in 2008 plagued output growth in the mining sector, and household consumption slowed sharply, undercut by slower growth of credit, falling asset prices, and higher food and fuel prices (World Bank, 2009). The South African economy weakened considerably in the third quarter of 2008, recording the lowest quarterly growth rate in ten years. After a rebound in the second quarter of 2008, growth in real gross domestic production decelerated from a revised annualised rate of 5.1% in the second quarter of 2008 to a mere 0.2% in the third quarter. A substantial contraction in real value added was registered by the mining sector, which was directly affected by weaker international demand, falling commodity prices and interruptions due to maintenance, safety procedures and strikes. In a similar vein, the real output originating in the manufacturing sector declined significantly in the third quarter. However, the harvesting of a bumper maize crop was reflected in a brisk positive growth rate recorded by the agricultural sector. Year-on-year CPIX inflation peaked at 13.6% in August 2008, more than double the upper limit of the inflation target range of 3% to 6%, decelerating somewhat to 10.3% in December. Headline producer price inflation amounted to a year-on-year rate of 19.1% in August 2008, the highest rate of increase in almost 22 years, before decelerating to 11.0% in December (SARB, 2009). 1.1.3. The Provincial Context
The Free State Province (the third largest in South Africa) lies in the heart of South Africa. Its surface area is 129480 km² [approximately 10,6% of South Africa`s land area], with the Kingdom of Lesotho nestling in the hollow of its bean-like shape. It is further surrounded by the KwaZulu-Natal province to the east, the Eastern Cape to the south east, the Northern Cape to the south and west, North-West, Gauteng to the north and the further Northern Province, Mpumalanga and the Western Cape Province. In essence, the centrality of the province is perceived as an economic advantage nationally.

15
Population
The population of the Free State is estimated 2.9-million (which is 6.2% of the national total). The predominant languages include Sesotho (64%) and Afrikaans (12%). The racial demography of the province is as follows:
16
The biggest and more important cities / towns in the Free State, include (1) Bloemfontein, (2) Welkom, the dynamic pulsing heart of the goldfields - one of the few completely pre-planned cities in the world; (3) Kroonstad, an important agricultural, administrative and educational centre founded in 1855; (4) Parys on the banks of the Vaal River; (5) Sasolburg, also known as Metsimaholo Municipality, with one of the largest “Chemical Related Industries” in South Africa, including large sections of the Vaaldam [12 228,05 ha] – the North-Eastern boundary, and (6) Bethlehem, gateway to the Eastern Highlands of the Free State.
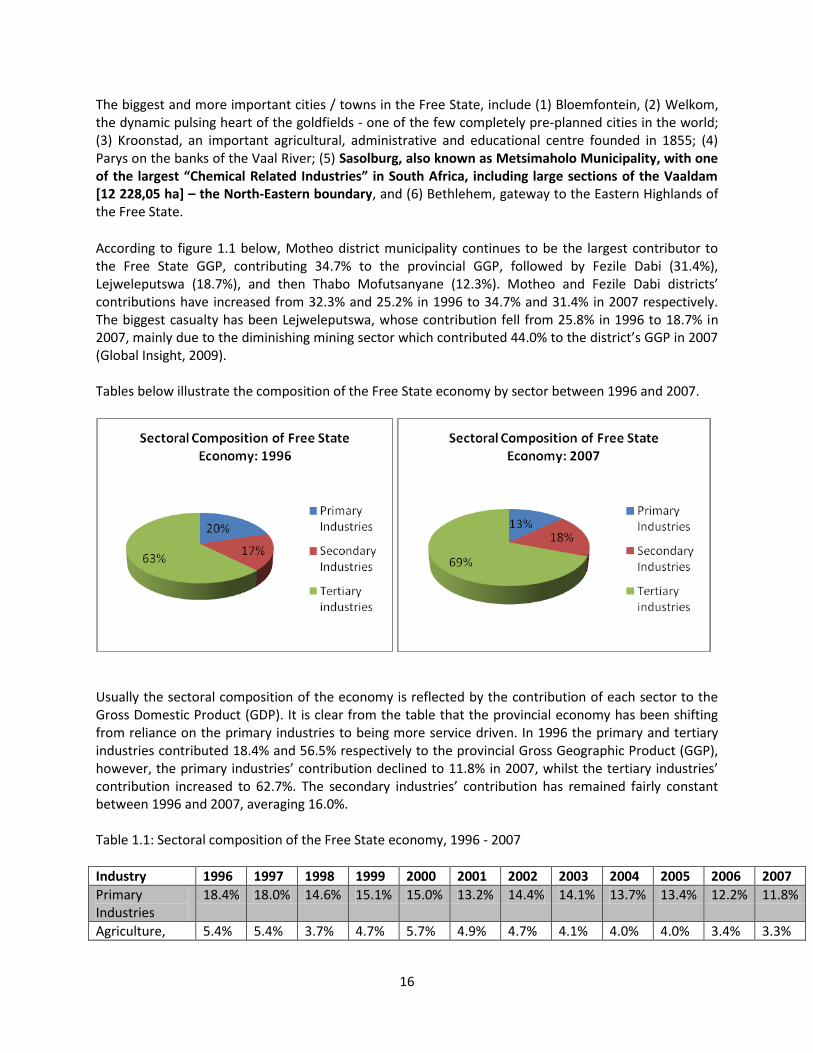
According to figure 1.1 below, Motheo district municipality continues to be the largest contributor to the Free State GGP, contributing 34.7% to the provincial GGP, followed by Fezile Dabi (31.4%), Lejweleputswa (18.7%), and then Thabo Mofutsanyane (12.3%). Motheo and Fezile Dabi districts’ contributions have increased from 32.3% and 25.2% in 1996 to 34.7% and 31.4% in 2007 respectively. The biggest casualty has been Lejweleputswa, whose contribution fell from 25.8% in 1996 to 18.7% in 2007, mainly due to the diminishing mining sector which contributed 44.0% to the district’s GGP in 2007 (Global Insight, 2009). Tables below illustrate the composition of the Free State economy by sector between 1996 and 2007.
Usually the sectoral composition of the economy is reflected by the contribution of each sector to the Gross Domestic Product (GDP). It is clear from the table that the provincial economy has been shifting from reliance on the primary industries to being more service driven. In 1996 the primary and tertiary industries contributed 18.4% and 56.5% respectively to the provincial Gross Geographic Product (GGP), however, the primary industries’ contribution declined to 11.8% in 2007, whilst the tertiary industries’ contribution increased to 62.7%. The secondary industries’ contribution has remained fairly constant between 1996 and 2007, averaging 16.0%. Table 1.1: Sectoral composition of the Free State economy, 1996 - 2007
Industry 1996 1997 1998 1999 2000 2001 2002 2003 2004 2005 2006 2007
Primary Industries
18.4% 18.0% 14.6% 15.1% 15.0% 13.2% 14.4% 14.1% 13.7% 13.4% 12.2% 11.8%
Agriculture, 5.4% 5.4% 3.7% 4.7% 5.7% 4.9% 4.7% 4.1% 4.0% 4.0% 3.4% 3.3%

17
forestry and fishing
Mining quarrying
13.0% 12.6% 10.9% 10.4% 9.3% 8.3% 9.7% 10.0% 9.7% 9.4% 8.8% 8.4%
Secondary Industries
15.4% 15.8% 15.8% 15.3% 16.3% 16.7% 16.4% 16.1% 16.1% 16.0% 16.0% 16.2%
Manufacturing 10.1% 10.2% 10.6% 10.7% 11.4% 11.8% 11.7% 11.3% 11.3% 11.2% 11.2% 11.2%
Electricity and water
3.3% 3.5% 3.4% 3.2% 3.1% 3.1% 3.1% 3.0% 3.0% 3.0% 2.9% 2.9%
Construction 1.9% 2.0% 1.8% 1.9% 1.7% 1.8% 1.6% 1.7% 1.7% 1.9% 1.9% 2.1%
Tertiary industries
56.5% 56.3% 59.8% 59.6% 59.4% 60.9% 60.3% 61.0% 61.3% 61.6% 62.5% 62.7%
Wholesale & retail trade; hotels & restaurants
11.1% 10.9% 11.5% 11.8% 12.2% 11.3% 11.3% 12.0% 12.0% 12.3% 12.6% 12.6%
Transport and communication
7.4% 7.8% 8.4% 8.3% 8.6% 9.0% 9.1% 9.1% 8.9% 8.9% 9.0% 9.1%
Finance, real estate and business services
13.8% 14.0% 14.8% 14.9% 14.2% 15.7% 15.7% 15.6% 16.2% 16.4% 16.8% 17.0%
Community, social and other personal services
9.6% 9.4% 10.4% 10.3% 10.6% 11.0% 10.8% 11.0% 10.8% 10.8% 10.9% 10.9%
General government services
14.6% 14.2% 14.9% 14.4% 13.9% 13.9% 13.4% 13.5% 13.4% 13.2% 13.2% 13.1%
All industries at basic prices
90.3% 90.0% 90.3% 90.5% 90.7% 90.8% 91.1% 91.1% 91.1% 91.1% 90.7% 90.7%
Taxes less subsidies on products
9.7% 10.0% 9.7% 9.5% 9.3% 9.2% 8.9% 8.9% 8.9% 9.0% 9.3% 9.3%
Source: Stats SA, GDP Fourth Quarter, 2008 Turning to the individual sectors, the biggest sectors in 2007 were finance, real estate and business services (17.0%), general government services (13.1%), wholesale and retail trade (12.6%), and manufacturing (11.2%). The smallest sectors, on the other hand, were construction (2.1%), electricity and water (2.9%) and agriculture, forestry and fishing (3.3%). It is worth noting that the contribution of general government services, even though it is still the second highest, is on a decline. As illustrated in figure 1.2 below, the largest contribution the province makes to national output is in agriculture, fishing & forestry (9.4%), mining & quarrying (8.0%), electricity & water (6.9%) and community services (6.8%). Only manufacturing and community services have increased their contributions, from 3.5% and 6.4% in 1997 to 4.2% and 6.8% in 2007 respectively.

18
The Free Sate’s contribution to the national economy has decreased from 5.9% in 1997 to 5.4% in 2007, mainly due to the decreasing contributions of agriculture, fishing & forestry and mining & quarrying. It is important to note that Free State is represented in the production output of all sectors, making the top five provinces in four sectors; namely mining of gold and uranium ore (1), agriculture and hunting (3), Fuel, petroleum, chemical and rubber products (4), and Electricity, gas, steam and hot water supply (5). Free State is the leading province in the mining of gold and uranium with a contribution of 36.3%, followed by North West (29.4%) and Gauteng (21.8%). With regard to agriculture and hunting, the Free State is the third largest contributor after Western Cape (23.7%) and KwaZulu-Natal (23.1%). Free State is also in the top four producers of fuel, petroleum, chemical and rubber products, namely Gauteng (31.9%), KwaZulu-Natal (17.2%), Mpumalanga (16.6%), and Free State (13.2%). The province is the least contributor to the national output of forestry and logging (0.3%), mining of metal ores (0.1%), and other non-metallic mineral products (0.6%). Profile of the employed and unemployed by gender Table 3.1 below indicates that the province had 840 000 or 43.6% of its working age population not economically active in 2007, as compared to 1 087 000 or 56.4% who are active. Of those that are active, the province is home to 287 000 (26.4%) individuals that are unemployed. Women in the Free State constitute the highest percentage of individuals who are not economically active (514 000 or 61%) as compared to their male counterparts (326 000 or 39%); this indicates that the province still has a large source of productive potential which still remains untapped, and also the unemployment rate among males is still lower than that of females at 19.4% and 34.6% respectively. The situation is the same across all the provinces and at a national level, females account for most of the unemployed at 30.8% against 21.1% for males. Surely this should inform policy makers that all employment creation initiatives should and must target more females than their male counterparts to address this inequality in the provincial labour market. Although Free State’s unemployment rate is continuing to decline; the provincial economy has not been able to create enough job opportunities for its growing labour force. This outcome was, however, expected as the country has experienced the first instance of two consecutive quarters of negative growth (i.e. technical recession) since the fourth quarter of 1992 and worst quarterly decline since the third quarter of 1984. The South African economy grew by -1.8% and -6.4% in the fourth quarter of 2008 and the first quarter of 2009 respectively. The provincial labour force participation rate increased slightly by 0.9% due to an increase in the labour force by 17 000, whilst there was a slight decline in the absorption rate or employment to population ratio (-1.0%) in the same period. This is an indication that the provincial economy has been unable to create employment at the rate at which new entrants are entering the labour force. Much still remains to be done in the creation of sustainable employment opportunities especially for new entrants in the provincial labour market, particularly women and the youth in general. Sectors that were labour intensive in 2007 were trade, agriculture and construction. A sector is labour intensive when it has an employment/GDP ratio larger than 1 and capital intensive when the ratio is less than 1. Agriculture was the most labour intensive sector in 2007 with an employment/GDP ratio of 5.5, followed by construction with an employment/GDP ratio of 3.5. The water and electricity sector was the most capital intensive sector with a ratio of 0.1. Community services sector was the biggest contributor to both GDP (24.0%) and employment (23.9%) in the province. The construction sector was the least contributor to GDP with 2.1%, whilst the water and electricity sector was the least contributor to employment with 0.3%. The mining sector was the only sector that lost its labour intensiveness since

19
2002; this can be attributed to the closing of mines and the increasingly massive capital required for ventilation, cooling, hoisting, underground tunneling and surface processing plants. 1.1.3.1. Remarks on the Provincial Context The structure of the provincial economy is continuing to take shape with the tertiary sector contributing more and more to the provincial GGP at the expense of the primary sector. The latest data from Stats SA reveal that the tertiary sector is the biggest sector with a contribution of 62.7%, followed by the secondary sector (16.2%) and then the primary sector (11.8%), with the balance being attributed to taxes minus subsidies on products. According to Global Insight (2008), the biggest district in the province, measured in terms of their contribution to the provincial GGP, is Motheo (35%), followed by Fezile Dabi (31%), Lejweleputswa (19%), Thabo Mofutsanyane (12%) and lastly Xhariep (3%). The provincial economy has consistently performed below the national economy over the past twelve years. GDP growth in the Free State averaged 2.4% over the period 1996 to 2007, compared to the national average of 3.6% for the same period. During this period, Free State, together with North West, were the second worst performing economies with average growth rates of 2.6%, the worst being Eastern Cape with average growth rate of 2.5%. The two best performing provinces were Western Cape (4.1%) and Gauteng (4.0%). Turning to the performance of the industries, for the period 1997 to 2007, the tertiary industries in Free State were the highest growing of the three industries with a growth rate of 3.3%. The secondary industries grew by 2.8% during the period under review, while the primary industries had a negative growth of -1.4%. Sectors that were labour intensive in 2007 were trade, agriculture and construction. Agriculture was the most labour intensive sector in 2007 with an employment/GDP ratio of 5.5, followed by construction with an employment/GDP ratio of 3.5. The water and electricity sector was the most capital intensive sector with a ratio of 0.1. Community services sector was the biggest contributor to both GDP (24.0%) and employment (23.9%) in the province. The construction sector was the least contributor to GDP with 2.1%, whilst the water and electricity sector was the least contributor to employment with 0.3%. The Free State economy is not an isolated closed economy; it is part of the global economy and therefore will not be exempted from the current global financial crises. As a result of these financial crises, the provincial GGP forecasts have been downgraded to 2.6% and 1.6% in 2008 and 2009 respectively. After four years of relatively high growth of 4.1% on average, the province is projected to slow to its lowest growth in six years in 2008 and decline even further in 2009. Given the current global economic meltdown it would be unrealistic to expect the province to achieve its FSGDS targets of growing the economy by 6% by 2010. Global Insight (2008) project the provincial economy to grow by 2.9%, 3.9% and 4.5% in 2010, 2011 and 2012 respectively, which is way lower than the envisaged 6%. What is of great importance is to come with policies that would shield the provincial economy as much as possible from the current economic meltdown and limit the impact of the financial crisis. However, it is not only important to find solutions to the real economy, but also to deal with problems relating to it such as job losses. The mining sector is expected to be the hardest hit sector with growth projected to be in the negatives and consequently resulting in job losses, therefore it is only natural for the provincial government, in coalition with the national government, to come up with policies that will directly impact positively on the mining sector. In conclusion, no matter what policy the province may implement, we have to be realistic in our expectations and revise the FSGDS targets to be aligned with

20
the current economic environment, and the key priorities of the ruling party (ANC); which are job creation, education, health, crime and rural development. According to the latest data, the specific sectors are projected to be performing well. The outlook is presented in the following table:
Indicator Average 1997 - 2001
Average 2002 - 2006
2007 2008 (forecast)
2009 (forecast)
2010 (forecast)
2011 (forecast)
2012 (forecast)
GDPR(R million, constant prices)
48,536 54,528 61,198 62,789 63,793 65,643 68,203 71,272
Real GDPR % growt
Agriculture 1.9% 1.3% 3.1% 9.8% 3.1% 2.8% 2.6% 2.8%
Mining -7.8% -3.3% -0.7% -1.2% -1.0% -0.7% -0.6% -0.3%
Manufacturing 3.7% 3.9% 4.1% 4.7% 2.4% 3.7% 4.7% 5.2%
Electricity -0.8% -1.8% 3.0% -1.7% 0.5% 1.8% 2.5% 3.3%
Construction 0.3% -3.0% 14.8% 12.5% 3.8% 5.5% 7.4% 7.9%
Trade 1.2% 1.7% 4.0% 3.5% 1.8% 3.7% 4.8% 5.0%
Transport 4.4% 4.2% 5.2% 1.7% 1.2% 2.8% 3.8% 4.6%
Finance 3.4%
3.4% 5.8% 2.7% 1.8% 3.4% 4.4% 5.1%
Community services
1.2% 1.5% 3.7% 1.8% 1.3% 2.6% 4.0% 4.7%
Source: Stats SA, GDP Fourth Quarter, 2008 and Global Insight, ReX, 2008
The outlook suggests opportunity for the primary and secondary sectors to growth in the Free State. 1.1.4. The District Context
At sub-district level the Local Municipalities of Moqhaka (FS 201 – Kroonstad), Ngwathe (FS 203 – Parys), Metsimaholo (FS 204 – Sasolburg) and Mafube (FS 203 – Frankfort) are situated within the area of jurisdiction of the Fezile Dabi District Municipality. The following map depicts the character of the district. In economic terms, the sparsely defined district and the concentration of the neighbouring Gauteng explains the location of the market as well as implications for logistics and investment within the district.

21
For the period 1996 to 2007, the Fezile Dabi district was the highest growing district with 4.4%, followed by Motheo (3.0%), Xhariep (2.3%) and Thabo Mofutsanyane (1.3%), while Lejweleputswa was the only district with negative growth (-0.6%). As shown in figure 1.16 below, Fezile Dabi district is expected to be the highest growing district in the Free State province, averaging 3.8% between 2008 and 2012, followed closely by Motheo (3.3%) and Thabo Mofutsanyane (3.0%).
32.30%
25.20%
25.80%
16.70%
District Economic Perfomance 1996
Motheo
Fezile Dabi
Lejweleputswa
Thabo Mofutsanyane
34.70%
31.40%
18.70%
12.30%
District Economic Perfomance 2006
Motheo
Fezile Dabi
Lejweleputswa
Thabo Mofutsanyane
Xhariep and Lejweleputswa are forecast to be the lowest growing district with projected growth rates of 2.8% and 1.7% respectively. Fezile Dabi and Motheo districts are the drivers of the Free State economy, together contributing 66.1% to the provincial GGP in 2007, while they are expected to grow by 3.6% on average from 2008 to 2012, which is above the provincial average of 3.1% forecast for the same period.

22
Lejweleputswa is the perennial underperformer of the province, averaging -0.6% from 1996 to 2007, and forecast to grow by a mere 1.7% for the period 2008 to 2012. The low growth of Lejweleputswa can be attributed to the diminishing mining sector which contributes 39.5% to the district’s GGP. The district economic performances of the province are presented as follows:
In essence, Fezile Dabi has been leading in economic performance. SECTION FOUR: CONTEXTUAL ANALYSIS The economic outlook is encouraging in the Free State. The following projection is captured.

23
The change from the dominance of the primary and secondary industries to tertiary industry in South African economy is informed in a number of factors. The main structural changes in the economy of South Africa are informed in a number of factors. Primarily, “economic investment in South Africa has historically been focused on the Minerals-Energy Complex (MEC) in around Gauteng, and on the linkages between that economy and the rest of the world. Investment in the MEC has to some extent been balanced by investment in agriculture, particularly massive irrigation schemes.”3 As the global economic structure changed, South Africa had to adapt and align its economy to global trends. “South Africa embarked on an ambitious set of tariff and trade policy reforms in themid-1990s. Multilateral liberalisation through the World Trade Organisation (WTO) was combined with efforts to modernise industry. Growth sectors like autos and tourism and cross-cutting sectors such as information and communications technology (ICT) received special attention in the form of industrial development resources, including science and technology and human resource development funds. These measures, together with global trends, contributed to structural change in the economy. A large contraction in the primary sector – mining and agriculture in particular – and a smaller one in the secondary sector went with substantial growth in the tertiary sector which contributed two thirds to GDP by 2006.” For the period 1997 to 2007, the tertiary industries were the highest growing of the three with a growth rate of 3.3%. The secondary industries grew by 2.8% during the period under review, while the primary industries had a negative growth of -1.4%. As has been the case since 2003, the primary industries were the least growing in 2007, growing by a mere 0.3%, which again was due to the continued sluggish growth in the mining and quarrying sector. Mining and quarrying was the worst performing sector in 2007 with growth of -0.7%, followed by electricity and water (3.0%), and agriculture, forestry and fishing (3.1%). The best performing sectors in 2007 were construction (14.8%), finance, real estate and business services (5.8%), transport and communication (5.2%), and manufacturing (4.1%).
3 Towards a 15-year Review

24
Accordingly, the Free State provincial economy’s contribution to the national GDP has been on a decline since 1996; from 6.0% to 5.4% in 2007. This has had a negative impact on the provincial revenue envelope as the revenue distributed from National Treasury by means of the provincial equitable share (PES) has shrunk. The historic and current economic structural metamorphosis has benefitted the Metsimaholo local
economy. In both epochs, the development of the tertiary industry increased economic activity and
performance. The specific development of the petrochemical industry was linked to then then MEC.
Metsimaholo is hosting one of the most significant petro-chemical hubs in the Southern Hemisphere.
A total number of 6901 people are employed by the major industries producing a wide variety of
products from waxes, synthetic rubber, polymers, liquid fuels, solvent blends, phenol, polypropylene
product, nitrogenous products etc. The main factories are Sasol (responsible for 13% of the GGP of the
Free State) Natref (the only inland oil refinery in the country provides approximately 12% of the
country’s fuel and diesel) Karbochem, Safripol and Omnia. Two industrial parks have been developed
that includes Chem. City and Naledi Industrial Park. Chem City is a Sasol owned initiative aimed at the
development and establishment of small businesses in the downstream chemical industry. Naledi
Industrial Park is privately owned and approximately 95 stands have been sold out.
Since 1994, the economy has become more open, more productive and more outward orientated with both exports and imports growing rapidly. The table below provides the national review of the South African economy. Table: Structure of South Africa’s economy
1980 1990 2000 2006
Primary sector 15,5 13,1 10,8 8,8
Secondary sector 27,6 26,0 24,2 23,6
Tertiary sector 56,9 61,0 64,9 67,6
Source: Rustomjee and Hanival, 2008, paper commissioned for the Fifteen Year Review, p.36 The second contributor to the growth of the tertiary sector is the increase in public sector employment in the Metsimaholo locality. However, the community service industry is not healthy and viable for economic growth and development. The Spatial Development Framework (SDF) of the Metsimaholo Local Municipality identified a number of economic activities in its review. The development of tourism, the real estate and retail point to the increased focus on the tertiary industry in the Metsimaholo economy. The allocation of land to various locations defines the economic thinking in the SDF. The development of real estate and retail in Sasolburg, particularly around the Vaalpark area; the development of retail and tourism in and around Zamdela; the development of tourism and retail in Deneysville and Refengkgotso; and the development of real estate and tourism in Orangeville and Metsimaholo demonstrate the growth of the tertiary industry in the local economy.

25
Despite the emphasis on the tertiary industry, the development of the primary industry is identified in
the MLM SDF. The proposed development of agriculture in Mooidraai and further areas outside
Zamdela; and the development of mining around the Amelia area suggest the opportunity in promoting
the primary sector in the locality. The prospect of the mining industry is further enhanced by the fact
that, “although not a big contributor to the local economy approximately 50% of the land area of
Metsimaholo has the potential for coal mining. There are currently two operative coal mines in the area
i.e. Sigma Colliery that mainly supplies coal to Sasol for its power and steam plants and New Vaal
Colliery that supplies coal to the Lethabo Power Station.”
The contrast between a tertiary industry that is growing and a declining primary sector is not adequate in explaining the lack of development in the Free State. A closer focus on the employment potential of sectors assists in getting a clearer picture. As the GDP contribution of the province declined, the employment contribution also declined from 7.0% in 1996 to 5.2% in 2007, indicating that the economy is not creating as many jobs compared to other provinces. The fact that the province’s contribution to the national population is higher than its GDP contribution indicates that the province is underperforming. The declining population contribution also has a negative impact on the revenue received from the PES and restricts the productive capacity of the province due to smaller, younger and inexperienced labour force. An examination of Statistics South Africa’s Labour Force Survey results reveals a shrinking pool of active labour market participants in the Free State. As indicated by figure 3.1 below, provincial participation rate seems to be on a downward turn, this is disturbing as it implies that the dependency ratio in the province is likely to increase.4 The slowdown in domestic economic activity alongside considerably weaker global demand contributed to a moderation in formal non-agricultural employment growth during 2008. Table 3.4 indicates that between the fourth quarter of 2008 and the first quarter of 2009, the Free State recorded job losses in most industries in the formal economy, with most of them surprisingly being in the community and social services which accounted for 21 000 of the job losses, followed by finance for 5 000 and trade for 4 000. Utilities and Transport both accounted for about 2 000 job losses collectively. On average, a total of 32 000 jobs were lost from the above-mentioned industries. The table below illustrates some of the trends over time:
Industry Jan – March 2008
Oct-Dec 2008
Jan-Mar 2009
Qrt-Qrt Change
Year-on-year change
Qrt-Qrt Change
Year-on-year change
Thousand Percentage
Total 516 527 501 -26 -15 -4.8 -2.9
Mining 23 30 33 3 11 10.9 46.5
Manufacturing 77 66 68 1 -10 2.0 -12.3
Utilities 5 6 5 -1 0 -21.4 1.2
Construction 45 49 51 2 6 5.1 12.3
Trade 129 115 111 -4 -18 -3.4 -14.0
Transport 32 28 27 -1 -5 -4.9 -15.4
4 Free State’s Labour Force Participation rates, March 2001 to Marc 2007

26
Finance 55 62 58 -5 2 -7.8 4.4
Community and Social Services
150 170 149 -21 -1 -12.4 -0.6
Table 3.4: Formal sector employment by industry, 1st and 4th Quarter 2008 and 1st Quarter 2009, Free State Owing to the above-mentioned, certain economic realities persist, and the following status quo
abounds:
The decrease in employment is primarily attributed to the fact that the primary industry is the primary
absorber of labour, while the tertiary industry remains capital intensive. This phenomenon is presented
in the table below.
Table: GDP and Employment contribution by sector in the Free State economy, 2002 & 2007
Industry 2002 2007
GDP Employment Emp/ GDP Ratio
GDP Employment Emp / GDP Ratio
Agriculture 4.7% 19.5% 4.1 3.3% 18.3% 5.5
Mining 9.7% 13.5% 1.4 8.4% 5.8% 0.7
Manufacturing 11.7% 11.2% 1.0 11.2% 10.7% 1.0
Water an electricity
3.1% 0.4% 0.1 2.9% 0.3% 0.1
Construction 1.6% 3.2% 2.0 2.1% 7.4% 3.5
Trade 11.3% 18.6% 1.6 12.6% 22.5% 1.8
Transport 9.1% 4.2% 0.5 9.1% 4.0% 0.4
Finance 15.7% 6.4% 0.4 17.0% 7.3% 0.4
Community and social services
24.2% 23.0% 0.9 24.0% 23.8% 1.0
Source: Stats SA, Labour Force Survey, September 2006 & 2008 In summarizing the labour market in the Free Stat, the following points are made:
The community services industry is biggest contributor of employment in the province, district and local municipal areas
As the tertiary industry increase, there is minimal employment creation in the province, district and local municipal areas
There is no concerted effort to build a human capital that will respond to the economic growth informed in the tertiary industry
The absence of economic diversification limits the ability of the primary sector to growth and provides the necessary employment
Conclusion Similarly, the economic restructuring in South Africa in the 1990s was primarily informed in the development of the tertiary industry; hence the projected increase in economic growth in Metsimaholo.

27
However, the growth is not linked to development through skills development, job creation and SMME and Co-operative development. For instance the benefician of the petrochemical industry in Chem City creates huge opportunities to skill local people as entrepreneurs and the ultimate establishment of SMMEs. As a means to link economic growth and development, the MLM LED strategy is informed in leveraging the projections of continued economic growth in the Metsimaholo local economy. The projections are presented:
The provincial economic outlook suggest a GGP increase of 2,9%, 3,9% and 4,5% over 2010, 2011 and 2012 respectively
The Fezile Dabi District is projected at an economic growth of 3,9% The economic projects are only based on the current economic activities within existing industries in the Free State. Specifically, the outlook is predicated on the continued on the tertiary industry, particularly on the community services, as drivers on employment in the Free State. However, the challenge is to develop a strategic fit that will firstly, maintain the status quo. Secondly, the strategic fit needs to diversify the sectors, particularly the increase in primary industries, to increase the GGP/employment ratio in the Free State. As stated earlier “sectors that were labour intensive in 2007 were trade, agriculture and construction. A sector is labour intensive when it has an employment/GDP ratio larger than 1 and capital intensive when the ratio is less than 1. Agriculture was the most labour intensive sector in 2007 with an employment/GDP ratio of 5.5, followed by construction with an employment/GDP ratio of 3.5. The water and electricity sector was the most capital intensive sector with a ratio of 0.1. Community services sector was the biggest contributor to both GDP (24.0%) and employment (23.9%) in the province. The construction sector was the least contributor to GDP with 2.1%, whilst the water and electricity sector was the least contributor to employment with 0.3%. The mining sector was the only sector that lost its labour intensiveness since 2002; this can be attributed to the closing of mines and the increasingly massive capital required for ventilation, cooling, hoisting, underground tunneling and surface processing plants.” In the context of Metsimaholo, the ability to increase the real estate industry and activate the construction industry will have a huge impact on job creation. Secondly, the ability to develop the retail industry, the tourism industry, the agricultural industry, and the mining industry, will have huge implications in creating jobs and promoting entrepreneurship. In essence, the success of the MLM LED strategy will be measured on its ability to diversify the local economy through labour intensive industries rather than the current status quo. It is in this regard the MLM LED strategic direction is defined and informed.

28
SECTION FIVE: THE LOCAL ECONOMIC CONTEXT
The Locality
The Local Municipality of Metsimaholo (Sasolburg) is located in the northernmost corner of the Free State province, which forms part of the Vaal Triangle [Vanderbijlpark, Vereeniging and Sasolburg region(s)], approximately latitudinally 27,8ºS and longitudinally 26,7ºE and approximately 1470 metres above sea level. The new category B local municipality FS 204, surface an area of approximately 1705,4253 km².
At sub-township level the following townships / villages are situated within the area of jurisdiction of the municipality, namely: Sasolburg, Zamdela, Deneysville, Refengkgotso, Oranjeville and Metsimaholo townships and Kragbron-, Viljoensdrift Villages, etc.
Sasolburg and Zamdela as the youngest townships (in the Free State) owe their existence directly to the petro-chemical industry, and was formally established during September 1954.
The new municipality known as the Local Municipality of Metsimaholo, has been established as a Category B Municipality, with effect from 8 December 2000 and in terms of Provincial Notice no 185 of 2000, published in the Free State Provincial Gazette no 113 dated 28 September 2000, as amended and as per Map 1 hereinafter;

29
1.1.4.1. Population
The determination of accurate data on demographics in South Africa has been a contested area. Until
the Community Survey 2007, the Census 2001 has been the only source of data on demographics in
South Africa. Though the Community Survey 2007 has become a more reliable source of demographic
data, some of the institutions like the Demarcation Board have not yet updated its data. However, the
current reliable database is sourced from the Metsimaholo IDP, indicating that the population of the
Metsimaholo is estimated at 164 000, as opposed to 134 000. The chart below illustrates the
distribution of the population within the Metsimaholo municipal area.

30
Figure 1: Metsimaholo Population Distribution
The gender differentiation of Metsimaholo is similar to the national and provincial character, suggested
at 55% Female and 51% Male. The figure below explains the whole demographic character of the
municipal area.
2.1.3.3 Monthly Household Income

31
2.1.3.4 Employment
Figure 3: Metsimaholo Employment
1.2. THE ECONOMIC CONTEXT
In understanding the economic status quo of Metsimaholo, the following realities are noted:
According the Centre for Development Support, University of the Free State the Metsimaholo Region contributed to approximately 21,6% of the GDP in the Free State during 2004.
Metsimaholo contributes 68,1% to the GDP in the District

32
“…Metsimaholo has been earmarked as the development nodal point for the following 20 years! …” General Economic Tendencies: According the Centre for Development Support, University of the Free State the Metsimaholo Region contributed to approximately 21,6% of the GDP in the Free State during 2004. The growth rate has been 2,6% per annum since 1996 – 2004, which is significant higher than the rest of the Free State. The current GDP for 2004 confirmed R13`222`440`000.” However, between 2005 and 2009 there has been some economic downturn which affected the continued growth rate of the Metsimaholo Region to the provincial economy. Secondly, there has been shift in sectoral contribution to regional output, with the tertiary sector becoming more valuable than the primary and the secondary sectors.
Accordingly, the Metsimaholo economic performance has been rated highly compared to other municipal areas in the Free State Province. The following table provides some of the data in this regards.
Municipality GDP contribution %
Population
Size
%
Employment
Contribution
Rate
Unemployment
rate
Poverty
rate
Mangaung (Bloemfontein) 31.35 21.5 59.6 37.8 41.0
Matjhabeng (Welkom) 15.04 18.7 52.9 39.5 48.1
Maluti-A-Phofung
(Phuthaditjhaba and
Bethlehem)
4.33 13.2
34.1 61.7 65.7
Metsimaholo (Sasolburg) 21.61 4.2 76.2 33.4 31.6
“According to the table Metsimaholo performs extremely well compared to the other larger
municipalities. Its population is only 4.2% of the Free State but it contributes 21.6 to the GDP of the
province with the highest employment rate of 77.2%, lowest unemployment rate of 33.4%, and lowest
poverty rate of 31.6%. This favourable condition is mainly due to the large chemical industries in
Sasolburg and large percentage of wealthy pensioners staying in the area. In addition, Metsimaholo
produces almost 92% of the manufacturing, 96% of the water and electricity, and 100% of the mining
and quarrying in the district.” (Economic Analysis: 2009).
Driving the economic performance of Metsimaholo is primarily the petrochemical industry.
Metsimaholo is hosting one of the most significant petro-chemical hubs in the Southern Hemisphere.
A total number of 6901 people are employed by the major industries producing a wide variety of
products from waxes, synthetic rubber, polymers, liquid fuels, solvent blends, phenol, polypropylene
product, nitrogenous products etc. The main factories are Sasol (responsible for 13% of the GGP of the
Free State) Natref (the only inland oil refinery in the country provides approximately 12% of the

33
country’s fuel and diesel) Karbochem, Safripol and Omnia. Two industrial parks have been developed
that includes Chem. City and Naledi Industrial Park. Chem City is a Sasol owned initiative aimed at the
development and establishment of small businesses in the downstream chemical industry. Naledi
Industrial Park is privately owned and approximately 95 stands have been sold out.
1.2.1. The main components of Metsimaholo
Sasolburg is located in the heart of worldly renowned coalfields. This modern and predominantly
industrial town is further located in close proximity (20km) to the nationally well-known industrial areas
of Vereeniging / Vanderbijlpark. The Sasolburg / Zamdela urban area is 340km from Bloemfontein and
80km from Johannesburg. Apart from the internationally known SASOL “oil from coal refinery”, a vast
number of by-products including olefins, waxes, alcohols, tar products, inorganic chemicals, rubber,
gases, plastics, fertilizers, etc are manufactured in the area.
The Deneysville / Refengkgotso urban area is situated in the north-eastern section of the Metsimaholo
Region, approximately 36km east of Sasolburg and 350km north-east of Bloemfontein. Other larger
centres such as Vereeniging and Vanderbijlpark are all within 50km from Deneysville. There are non-
worth mentioning industrial activities present in the community. Industrial activities are exclusively
related to the boating industry. The town’s close proximity to the coal mining and industrial activities in
Sasolburg and its nearby location to the large industrial complexes of Vereeniging and Vanderbijlpark,
definitely and perhaps negatively, influence economic activities in Deneysville. The strong recreational
character of the town further enhances this phenomenon. The largest number of the inhabitants of
Refengkgotso, is employed in Sasolburg and the adjacent industrial complexes of Vereeniging and
Vanderbijlpark. Refengkgotso can thus be labeled as a typical satellite residential town to the
surrounding industrial areas. These factors contribute to the relatively low level of economic activity in
the Deneysville area.
The Oranjeville / Metsimaholo urban area is located within the former district of Heilbron. Oranjeville is
situated on the riparian of the Vaal Dam in close proximity to the northern boundary of the Free State
Province. The area is accessible by road and within 55km from Sasolburg, Vereeniging, Frankfort,
Heilbron and Villiers. Although the prominent economic sector of the area is agriculture, it is
subsequently strategically situated from a recreation and tourism point of view. This is in view of the
fact that the town is bound on three sides by the Vaal Dam and located in close proximity to the
Gauteng metropolitan area. It is also linked to several other towns in the vicinity.
The Vaal River and Vaal Dam form the northern boundary of the area, which also serve as the
boundary between the Free State and Gauteng Province. A significant portion of the Metsimaholo
Region is included in the Vaal River Complex Regional Structure Plan, 1996 (former Vaal River Complex
Guide Plan, 1982). Vaal River Regional Structure Plan is a statutory land use control document, which is
applicable to amongst other land located along important water resources such as the Vaal Dam, Vaal
River and Barrage. All Guide Plans compiled in terms of the Physical Planning Act (Act 88 of 1967) were
declared Regional or Urban Structure Plans in terms of Section 37 of the Physical Planning Act (Act 125
of 1991). The Vaal Dam often referred to as the Highveld’s Inland Sea, is the most prominent

34
topographical feature in the region. This vast expanse of water covers some 300 square kilometers. It
serves as Gauteng’s principal source of potable water and is a popular water sports and water related
adventure venue.
Current Development Initiatives
Regional Government Department offices are relocated in Sasolburg according to Government
policy.
Additional industrial park is proposed to be developed in Metsimaholo Local Muncipality
The Chem City industrial development and Naledi Park industrial development in the Sasolburg
Industrial Area.
Development along the river banks of the Vaal River.
A real estate development policy, regarding holiday accommodation, is endorsed in Oranjeville
to stimulate growth of the tourism sector.
The Deneysville community consists of an active tourism forum which was recently awarded
R15 000–00 to enhance the tourism in the area.
Water from the Lesotho Highlands Project will ensure permanent full levels of the Vaal Dam and
it is envisaged that the potential of the dam as tourism destination will be improved.
Proper and strict development control adjacent the Vaal Dam and Vaal River Barrage by means
of the Vaal River Complex Regional Structure Plan, 1996 (formerly known as the Vaal River
Complex Guide Plan, 1982) ensure a sustainable environment and enhances the tourism
potential of the area.
The Lizard Point development could be considered as an entire new town, comprising of nearly
600 residential erven which are in the process of being developed, immediately north of
Oranjeville/Metsimaholo.
1.1. Mining
Although not a big contributor to the local economy approximately 50% of the land area of
Metsimaholo has the potential for coal mining. There are currently two operative coal mines in the
area i.e. Sigma Colliery that mainly supplies coal to Sasol for its power and steam plants and New
Vaal Colliery that supplies coal to the Lethabo Power Station.
1.1.1. Molensteen Pan 129 (Zamdela)
“General Smuts *former Transvaal Government+ made approximately £ 1,180,000 available for the
construction of the Union Buildings [Presidents Offices] on Meintjieshill, Pretoria, during 1910 until
1913. Interesting to note is that some of the building material utilized in the construction of the
buildings, more specific sand stone building – blocks, was inter alia exploited from an area, situated
south of the existing Harry Gwala, Sasolburg. This area is better known as Molensteen Pan 129.”

35
Considering the weight of the building blocks and the fact that these blocks were transported by means
of ox – wagons, over pure sand, to the Sasolburg Railway station, the workmen constructed a road
paved with sandstone. Some of the farm houses in the area can still be identified where farm owners
utilized the same building material. Molensteen Pan was sold to Taaibosch Power Station during 1954.
1.2. Agriculture
Agriculture is an important character of the area although it does not provide a significant
contribution to GGP of Metsimaholo. There are approximately 853 farms in the region with 693
commercial farmers that mainly produces maize, sorghum, sunflower, wheat, and dairy farming.
However, a lot of identified agricultural land in owned by the Anglocoal and SASOL. According to
Anglocoal’s expansion initiative, most of the agricultural land will be mined in future.
There is an identified municipal land areas for agriculture, and this includes the Mooidraai area.
1.3. Tourism
Tourism currently contributes a small percentage GGP of Metsimaholo. There are not many tourism
facilities and attractions available in the area although it has the potential to develop into a preferred
destination area, if properly planned and marketed. The areas of real attraction include the Vaaldam at
both Deneysville and Oranjeville with the Jim Fouche Holiday Resort, Abrahamsrust, Etienne Rousseau
Theatre, and environmental facilities such as the Highveld Gardens, Bird Sanctuary, and Riemland Eco
Park. There is only one cinema in Sasolburg with limited restaurants in the area
Because of its diverse tourism potential and attractions i.e. Sasolburg (Sport and Nature) Deneysville and
Oranjeville (Vaal dam), a proper and coherent tourism strategy needs to be developed that will assist in
managing the tourism potential of the area. The following products are identified in the area:
The History of Zamdela (the heritage initiative)
The Vaal Dam with boating and sail sure week during September including Bird Watching
opportunities
Gallery 88 Art Gallery at Sasolburg
The Zamdela Arts and Cultural Centre
The Highveld Gardens in Sasolburg
Abrahams Rust Recreational Area
Jim Fouche Resort
The Vrefort Dome at Vredefort
The Viljoensdrift Police Station as one of the “oldest” developments in the Northern Free State
The National Heritage Site in Deneysville
Coal broock Mine Accident (1968) on the Farm Mooi Draai (Zamdela)

36
Three scenic routes were recently identified as having tourism potential, although upgrading thereof is
a prerequisite. Two thereof run virtually parallel to the Vaal River in the Koepel area and comprise of
extreme beauty, unique topography and landscape features. Development of the identified scenic
routes should be endeavored to enhance the tourism potential of the area. In a sense, these roads
should be considered as "tourism development corridors" and land use changes adjacent thereto,
relating to tourism, should favorably be considered. The following roads are highlighted in this regard:
The Koepel Scenic Route (Sections of Roads S 264, 212, 80 & 713);
The Vaal Eden Scenic Route (Sections of Roads S 1052 & 171); and
Road R 716 (north of the Vaal Dam) and sections of road S 159 (south of the Vaal Dam to Jim
Fouché Resort) providing relatively good access to various sections of the Vaal Dam.
1.4. SMME Development
There is a surprising number of SME’s and informal businesses operative in Zamdela. There is however
a general lack of support available for the emerging entrepreneurs that includes aspects such as
facilities, financing, business skills, and business equipment etc.
A survey was conducted amongst these entrepreneurs and the outcome of the survey will be
provided later in the sector. An exception is the recently established Kgodiso Business Center, a
container city; that will accommodate 28 informal businesses. This business sector has a huge
potential to grow and to make a significant contribution in reducing unemployment and contribute
to the GGP of the area. Much more support will however be required to develop and sustain this
sector. SEDA (Small Enterprise Development Agency) has recently established an office in Sasolburg
and can make a meaningful contribution to support the emerging entrepreneurs.
1.5. Status of SMME’s:
A survey of SMME’s survey was done extensively in 2005 in Zamdela and 770 businesses were surveyed. In Oranjeville and Deneysville most of the businesses were surveyed.
According to the above table 80% of the businesses are informal and their survey is therefore much more biased towards the informal/SMME type businesses.
37% of the business survey exists less than 2 yrs. This means that almost 342 new entrants come into market during the past 2 yrs. For the past 5 yrs the number of businesses increased by 593. Only 3% of the businesses are longer than 20 years in business. If one considers the maturity rate of businesses to be 7 years one can expects that a large percentage of the 593 businesses will seize to exist. This reinforces the importance of providing proper mentoring support and capacity building of new businesses.
reinforces the need for more formal planning and creation of a business area/center for Zamdela.
The above profile reinforces the importance to ensure that SME’s get the necessary support to sustain and grow.
Registered business such as a private company and closed corporation is not the popular choice to do business and only represents 7% of all the businesses. Informal businesses represent

37
almost 37% of all the businesses and once again reinforce the importance of providing support, advice, and assistance to informal traders
The most popular business is general dealer (36%) fruit and Vegetables (17%) and Beauty and Hair (11%). Other products that have a high number of dealers is Clothing (7%) motor Industry (6%), public phones (5%) alcohol (4%).
In reviewing the LED Strategy, a deeper focus will be placed on challenges, constraints as well as
opportunities in maximizing individual sectoral competitiveness, and intersectoral linkages to aggregate
the municipal economic competitiveness. In essence, this means the need to identify enablers to attract
both public and private sector investments in the municipal area.
SECTION SIX: KEY INTERVENTIONS
INTRODUCTION
The development of key interventions in the development of the economy of Metsimaholo is informed
in a number of submissions:
The MLM IDP – the limited employment, high unemployment and poverty
Key stakeholders – primarily the business community
The provincial review and outlook – the dominance of the tertiary sector and declining
employment

38
The participatory processes identified a range of needs from stakeholders and role-players. These needs
include infrastructure, efficient governance, lack of communication, and issues around red-tape, to
name a few. Similarly, the development of strategic sectors to increase economic growth and create job
opportunities and entrepreneurship lies in investment on infrastructure, reducing red-tape, efficient
governance, skills development and communication among stakeholders. In essence, addressing the
challenges presented through the participatory processes will assisting in stimulating sectors, thus
creating an enabling environment for investment in strategic sectors.
The objective of the MLM LED strategy is to develop a framework that will redress the above-mentioned
challenges, primarily being creating an enabling environment for job creation.
Complimenting the processes and IDP, is the outcome of the analysis in the previous section. The
analysis spelled out the challenge to creating jobs and increase employment in the whole Free State
province. The challenge is to promote the secondary and tertiary sectors because they are labour-
intensive in character and nature. This means the MLM LED strategy must identify what sectors and how
investment in those is going to be leveraged. Secondly, the strategy needs to spell out how skills, job
opportunities and impact on entrepreneurial activity are going to be promoted and implemented in
Metsimaholo.
GENERAL PRINCLES OF LOCAL ECONOMIC DEVELOPMENT
The development of the MLM LED Strategy is based on a broad, inclusive and integrated approach
defined within Spatial Economic Development. This means that the principle of “local competitiveness”
defines priority sectors and the required capacity needed to render the former viable and sustainable.
This slightly differs from the principle of “systemic competitiveness”, wherein primarily individual
enterprises are defined as the alpha and omega of LED. Besides the principle of local competitiveness,
the “diversification of the local economy”, partly through benefician, forms part of the intrinsic
understanding of the MLM LED Strategy. The over-reliance on one sector or industry often distorts the
local economic potential, thus rendering it inefficient. As part of the government’s approach and
practice, the other principles include the following:5
o Spatial integration of the local economy through building Linkages between the established urban
economy and the rural areas o Equity and economic empowerment o Beneficiation and value addition o Building a synergistic relationship between Local Economic Development and Social Upliftment o Social, Economic & Environmental integration is interdependent and will always be the first test when
evaluating opportunities. (i.e. triple bottom line) o LED focused around realistic catalytic initiatives natural to the locality and wherever possible building
on the uniqueness of local competitive advantage and market differentiation o Building on capacity to nurture effective and mutually beneficial partnerships based on fair and
equitable business principles o Maximization of total months of employment in the long-term
5 Though this strategy approach differs from other local strategies, it acknowledges generic principles in LED like
the ones espoused in the AREDS.

39
o Minimizing the divestiture of local assets to external parties. The review of the MLM SDF (2010) identifies a number of sectors to grow the local economy. The sectors include the Real Estate, Tourism, Agriculture, and Mining. According to the SDF review, the following is suggested:
SECTOR NO. OF INITIATIVES LOCATION
REAL ESTATE 5 The millionaire’s bend Orangeville, Deneysville, Vaalpark and quarry site.
RETAIL 3 Zamdela, Sasolburg and Deneysville/Refengkgotso area
TOURISM 2 Deneysville and Zamdela
AGRICULTURE 2 Mooidraai and the outskirts of Zamdela
MINING 1 Zamdela outskirts
In essence, the SDF review suggests that the opportunity for the existence of labour-intense industries in
Metsimaholo is viable. Whether these primary and secondary industries are viable or not, is yet to be
determined. The viability of such industries lies in the investment in infrastructure, human capital
development, efficient governance, communication and the reduction of red-tape to attract both public
and private sector investment in Metsimaholo.
As a means to determine the status quo in Metsimaholo, a SWOT analysis will assist in suggesting
specific interventions to stimulate the primary and secondary industries.
LOCAL COMPETITIVE ADVANTAGE (STRENGTHS & WEAKNESSES OF THE REGION)
Competitive advantage of the local relates to those aspects which compete on cost, quality, and/or
availability with that which other localities can offer. Certain regions have built competitive advantage
on “comparative” advantage – ie: those natural endowments which give the locality an advantage.
Other localities have built competitive advantage in the absence of any obvious comparative advantage.
An example of the latter is Hong Kong, which has little land and few natural resources, but has become a
consumer goods, banking and financial services hub. Competitive disadvantages are those aspects which
increase the cost of doing business, present barriers, and result in enterprise establishing elsewhere.
These can be insurmountable (for example: distance from markets) and will then influence the choice of
niche markets where these barriers have a low relevance.
Table 1.3.1: Assessment of advantages and disadvantages of the Metsimaholo economy
Advantages (comparative and
competitive)
Competitive disadvantages
Efficient petrochemical industry Poor infrastructure

40
Proximity to Africa’s largest economy, Gauteng
Significant pool of skilled people committed to the area
An alternative route to the coast from inland
The Vaaldam as a water resource
Leisure as a vibrant activity in the whole province
High proportion of strong and healthy people in all ages
Existing tourism sector
Road and rail network needs upgrading, routes sub-optimal Lack of educational institutions in the area Poor tourism economic activity Brain drain Economic leakages Poor retail activity in the area Lack of provincial investment in the local economy Red tape, particularly on land and property issues
COMPETITIVE POSITIONING (THREATS & OPPORTUNITIES)
The advantages provide guidance on the opportunities for the local economy, including the
diversification of sectors (tourism, agriculture, mining, etc.), development of the people, and benefician
of the existing industry. The disadvantages provide guidance on sectors to be avoided more importantly,
“it provides guidance on areas of pubic sector action and investment (improved education, reduced red
tape, improved functioning of institutions, and support to socio-economic adaptation).”
External threats will impact the economy of the locality over time, and may offer opportunities. Threats
include
o Global competition for resources (oil, steel, cement, investment capital and skills)
o Global competition on labour costs from China, India and Eastern Europe
o Global warming which may destroy the local asset, result in water scarcity, increase human and
crop disease, destroy value in low-lying commercial and residential property, increase in risk due
to weather intensity and variability increase, increase immigration pressure from central African
and European areas, etc.
o Exponentially increasing cost of carbon-based fuels
o International and local political instability as poverty, HIV/Aids and rich-poor divide increase
o International economic practices, including mobility of global capital and manipulation of financial
markets investors, the trend to increased private equity holdings, high indebtedness of major
economic powers, increased occurrence of speculation and bubbles.
However, threats internal locally are more likely to be more significant than external threats in the next
ten years. Apart from the threats listed above, the primary threats to Metsimaholo will be
o failure to transform and build an equitable and inclusive economy which neither penalises those
with the capital to grow the economy nor those who have historically been excluded
o failure to achieve public sector institutional efficiency and effectiveness
o a national financial system / fiscal policy / perception of risk combination which reward the short
term and consumptive rather than long-term productive investment.

41
FOUR MAIN STRATEGY INTERVENTIONS
The ultimate strength of the strategy is defined within its ability to create the link between the
objectives and intended impacts. This link is referred to as interventions. The interventions are informed
in a number of factors, including the desktop research combined with growth theory, a process of
interaction with the business sector, and competitiveness theory. The trends and issues from these
sources should be aligned as well.
In responding to the key strategic interventions, the German Development Foundation, GTZ, has
developed a tool to which such interventions can be explained. The tool, COMPASS, is utilized to define
the linkages of four areas of intervention.
The four areas of interventions are defined as High Impact Investment; Governance; Knowledge, Skills,
and Human Capital; and Communication and Interaction. The diagram below indicates the four areas.

42
The first intervention area is High Impact Investment, which is the core of the four interventions in local
economic development. The result areas include the following:
o Locality development includes infrastructure, spatial development (including access and linkages),
protection and development of the environmental assets, urban renewal, tourism facilities and
even lifestyle facilities.
o Subsectoral development, which includes diversification of the economy, value chain
development and business retention, all focused on development of the competitive advantage of
the locality. For the locality, urban development and development of the district have been linked
under corridor developments to strengthen the integration of the economy and support value
chain development across the municipal area.
o Public good investment: this refers primarily to investment in land, the environment, economic
assets, production facilities, machinery, equipment and other productive assets that are used by
multiple stakeholders. An example may be the development of public buildings in the city centre
to provide improved shopping environment, the development of a produce market, small
business hives, agricultural showgrounds, etc.
o Local venture capital fund: while it is not necessary that such a fund be limited to the district, or
“owned” by anyone in the district, it is necessary that access to investment funds that target the
locality, syndicate risk and respond to criteria that address the constraints of investors in the
locality.
o Stimulate new sectors: public and private investment is required to stimulate sectors which build
on the advantages (strengths) of the locality. The approach should be to stimulate a diversity of
sectors to see which “take” – ie: which sectors find champions and investors. Sectors include high-
technology products, innovative products, knowledge sectors, arts (visual, performance and
written), experiential tourism, alternative technology, banking, business process outsourcing,
education and sports development.

43
In the context of municipal policy imperatives, some of the responsibilities for High Impact Investment
fall within the realm of either the district, provincial and national jurisdiction. This calls for cooperation
and coordination. This explains the interlinkages and relationship between and among interventions.
“However, it is essential to bear in mind that, while high impact investment is a necessary requirement
for economic development, it is not a sufficient condition. It is dangerously easy to focus only on this
aspect of the strategy, to the detriment of sustainability, equity, diversification, competitiveness and
catalytic / multiplier effects. The other three areas (efficient governance, human capital development,
and communication and integration) provide the “enabling environment”, supporting the efficiency,
effectiveness of economic activities.”
The second intervention area is Knowledge, Skills and Human Capital. This is the strategy intervention
which focuses on knowledge, learning and growth. It has five result areas, namely:
o Collaboration to improve competitiveness. This result area addresses aspects such as networking
of similar companies to learn from each other and share experiences and research
o Targeted vocational training. This includes improvement of academic skills development to meet
the needs of the economy, lifelong education and training, to improve skills and education of
those already in the workforce and the unemployed to allow for improved employability, and
improvement programmes for management in both public and private sectors
o Targeted skills attraction and retention. This includes affordable middle-income housing,
affordable quality education and health services, affordable public transport systems, good
personal safety and security, and leisure and entertainment facilities and choices.
o Targeted capacity development to undertake economic development in the public sector
o Business development support, especially to new business (SMMEs)
o Development of a subsector research and innovation capacity.
Critical is the role of the all educational institutions to focus priorities to provide skills for the local
economy.
The third area of intervention is Efficient Governance. This strategy intervention has seven main result
areas, namely:
o Reduced red tape – ie: decision-making criteria are clear and processes are efficient and effective.
Legislation and bylaws are clear and are implemented equitably, effectively and efficiently
o Needs-specific operational planning and budgeting: Improved planning and budgeting at all levels
to meet the identified economic development needs. This area includes effective co-ordination
between public sector role players in planning, budgeting and implementation
o Effective land-use management: Land use planning and management balance economic
development with social and environmental needs, have clear criteria and are efficient. Also, land
claims are finalized to transfer
o Transparent and principled government. This would include availability of information on
government decisions, and cost-effective recourse against inappropriate, ad-hoc or damaging
decisions
o Effective public procurement and investment to stimulate economic development

44
o Organisational responsibility is aligned to interventions – the appropriate organizations undertake
interventions, and organizations are structured, resourced, have systems and activities
appropriate to their mandates
o Quality, current and accessible economic and investment data. This result area is placed under
the governance intervention because it is a public good and affects decision-making within the
public sector and the private sector. It does overlap somewhat with the “learning” intervention
and with the monitoring and evaluation function of the “collaboration” intervention.
The last strategy intervention is Stakeholder Communication and Interaction. This is the intervention
which provides a framework for support interactions between stakeholders, a communication service
and supports a planning and monitoring function. It has six result areas, namely:
o Facilitate and support a Local Growth Coalition. The Coalition will act as an advisory “Board” and
act as a structure for co-ordination and shared problem identification, planning and monitoring
between public and private sectors.
o Inter-governmental relations forums promote joint planning, budgeting and aligned
implementation
o Promotion of organization of private sector stakeholders across sectors and localities
o Support to policy and programme linkage: provision of analysis, advocacy and access to decision-
makers to influence policy to improve the business environment in the district, and draw down
support from existing programmes to support local initiatives
o Partnership programme to promote PPPs and business-business partnerships, including
partnerships to optimize use of public assets o Monitoring and evaluation of economic development.
CATALYSING SECTORAL DEVELOPMENT THROUGH KEY INTERVENTIONS: A CASE STUDY FOR
AGRICULTURAL, TOURISM AND SMME DEVELOPOMENT
A. AGRICULTURE
There is a growing need to solve the host of problems faced by the Agriculture sector in a more
integrated manner, within the framework of sustainable development. Agricultural sector strategies
have veered between maximizing agricultural growth through promoting commercial crops and
emphasizing food production / self –sufficiency and import substitution on the other. There are however
various strategies to improve this sector, e.g.
Agriculture Diversification
Agriculture Beneficiation (Agribusiness)
Tools & Instruments

45
Each of these components is synoptically discussed in the subsequent paragraphs in order to highlight
the salient features which must be incorporated into the strategic framework that is developed in the
subsequent section.
Agriculture Diversification
Farmers on a global scale have become increasingly diverse in their agricultural produce over the
last few decades. This means that traditional crops such as maize and wheat less important as a
source of livelihood while other farming practices such as permanent crops, hydroponics, organic
farming, bio-technology etc. have become more important and profitable. Some degree of
diversification has always existed in the Agriculture sector. After all, farming is grounded in the
seasonality and risky nature of planted crops. Diversification is thus seen as a method to cope
with risk and crop vulnerability.
In terms of Local Economic Development, Agriculture diversification is seen as a livelihood coping
strategy for the farmer; increasing profits through new products such as olives, organic farming
and essential oils; broadening the local export base; and the creation of additional employment
opportunities. Agriculture diversification also has indirect spin-off effects on the Secondary
sector. Opportunities are now created in the agro-industrial sector in terms of packaging and
value adding, which creates even more employment opportunities.
Viable agricultural crops, with clearly defined markets therefore need to be identified for
available agricultural land and planning programmes initiated within the municipal area. As part
of these strategies, new and innovative agricultural practices need to be taken into cognisance.
It has become evident that traditional agricultural production methods will not be able to meet
the demands of a growing South African population for much longer. Towards the end of the 20th
century, Research and Development subsequently focused on the development of alternative
food production techniques that would be able to address increasing demand in a safe and
sustainable way. In this context, the biotechnology industry gained momentum towards the end
of the 20th century. Biotechnology is defined as “the application of scientific and engineering
principles to the processing of materials by biological agents to provide goods and services”
(OECD, 1982: 18).
The application of biotechnology in value-added agricultural production in Metsimaholo is
therefore an important strategy to improve the output of the sector and to contribute towards
the diversification of the economy.
Agriculture Beneficiation (Agribusiness)
Agribusiness may be defined as all market and private business–oriented entities involved in the
production, storage, processing and distribution of agro–based products, in the supply of
production inputs, and in the provision of services. Agribusiness is an integral component of rural

46
development, and forms part of the strategy to improve regional and local economic
development and ensure food security.
Since earnings from the simple sale of raw produce may be lower and more volatile, the addition
of such “downstream” activities can improve a community’s local economy, create new
employment opportunities and contribute to environmental sustainability. Agricultural value -
added enterprises represent excellent business development opportunities for the local
community. This is mainly because the community is located near raw agricultural inputs, which
can be turned into a competitive advantage.
Agribusiness enterprises are primarily labour intensive small and medium enterprises located
near agricultural production sites in rural areas or in rural centres. Economic success of these
agricultural enterprises is increasingly determined by the performance and capacity of upstream
and down stream sectors. Agribusiness entities need to respond by improving their efficiency and
market orientation. What is required in agribusiness is access to expertise, the availability of
market information, and sufficient management skills.
Agribusiness support in it-self must be an integral part of the economic development concept,
and must be targeted towards the creation of jobs and income in rural areas. In line with a
common business concept, the guiding principle is always the market orientation of all support
services. Employment promotion and poverty alleviation in rural areas are additional goals of
promoting agribusiness. Agribusiness does not only focus on the primary production of products
but also requires additional workers. New employment opportunities are created in the
processing industry and, especially, in the service sector.
Experience shows that there are some areas that offer particularly high potential for the
successful promotion of the agribusiness sector. These interventions include:
Product quality trade
Management of agribusiness –related support services
Development and management of market infrastructure
Management of food chains
Voluntary organisations and co-operation in production and marketing
With declining employment in the South African Agricultural sector, workers leaving farms are
more likely to be able transfer their skills to value-added enterprises than to non-agriculture
manufacturing and service industries. Creating value-added jobs can improve the diversity of the
local economy, increase local incomes, capture higher profits locally, and use the local natural
resource base more efficiently and sustainably.
Tools and Instruments
Tools and instruments are defined as something that gives the ability, capacity, responsibility and
accountability to achieve the desired goals and objectives. Efficient tools and instruments in key

47
interventions are needed in the Agricultural sector, to facilitate the cost-effective delivery of
agricultural services to the community. Some of the most important instruments that can be
utilised for the capacitation of communities relates to the transfer of knowledge in term s of:
HIV/AIDS and its influence on productivity. This instrument is best implemented and utilised if the
coordination of the relevant (health) authorities with the rural development initiatives is viewed as a
priority. The influence of HIV/Aids should be anticipated / viewed as a long term.
Knowledge management is a relatively new instrument to agriculture LED. This instrument entrails
the improvement and optimal utilisation of tacit knowledge within the communities. However this
also includes the transfer of explicit knowledge to the communities within the local area. Usually this
instrument is placed under the ambit of the “human resources development programme” and is also
included under this heading in the strategic plan.
The use of appropriate agricultural technologies and techniques is a major element that requires
attention. The rational behind the utilisation of appropriate technologies and techniques will
increase the agricultural yields in addition to the protection of the environmental resources. This
increased productivity can be viewed as the relationship between the input and output ratios. The
following prerequisites need to be in place afore such activities can be successfully implemented:
o Better and more effective co-ordination between government agencies.
o More effective communication of agriculture policies and application procedures to
front line staff.
o Practical training, education and awareness building.
o Technology demonstrations.
The improved communication between all the local role-players and stakeholders are required as
the primary element that influences the implementability of the agriculture expansion initiatives.
This should also be strengthened through the formalisation of collaboration between the agriculture
and other sectoral activities.
These above mentioned approaches to the agriculture services are by no means exhausted, but provide
a clear indication of the specifics required in order to utilise LED as a vehicle to improve the “wealth
situation” of especially the rural and poor communities.
Ongoing policy developments should anticipate/consider the long-term impact of development activities
and therefore strive to continuously “update” the information database of the economic situation
within Metsimaholo. This should be done through ongoing research which should inform the
implementation strategy of the initiatives.
It is vital that poverty reduction objectives are translated into straightforward operational guidance for
programme preparation, implementation and monitoring. Therefore it must be set out how poverty
reduction approaches, at all stages of sectoral programming, might be introduced into Agriculture sector
approaches.

48
The following guidelines should be incorporated to facilitate the utilisation of agriculture development
in order to reduce poverty:
Coherent Pro–Poor Agricultural Sector Policy Framework.
o Increase agricultural productivity; lower transport costs; increase rural, employment
and food security; and integrate remote and lower potential areas into the growth
strategy.
o Use appropriate institutional structures to encourage the private sector and civil society
(e.g. decentralized services).
o Encourage the private sector and enhance market reforms (increase competition
between traders).
Public and Private sector institutions.
o Define the roles and responsibilities of the public and private sectors, taking account of
local situations.
o Build institutional capacity to manage the programme, and to provide rural services,
especially at the local level (note that once again strong linkages with the human
resource development component).
o Introduce new management practices to tackle biases against poor farmers and women.
Improve the target resources.
o Increase funding of agricultural activities.
o Target a greater proportion of funds, directly at groups of poor farmers and women.
o Increase investment in lower potential areas, and develop services for the poor and
women, to integrate them into the growth process.
Ensure the participation of the poor and women in programme preparation and services.
o Organisations representing poor farmers and women must be consulted in programme
preparation reviews.
o Donors and governments may need to encourage the development of institutions that
represent the poor and women.
o Invest in information systems to allow effective programme design and evaluation.
o Establish systems for evaluating the impact of measures on poverty.
Agriculture plays an important role in determining the livelihoods and standard of living of the poor in
the region, particularly when the poor are asked to pay for their use of basic social services. Increasing
agricultural productivity is therefore, a key area in the fight against poverty. For the poorest, whose only
asset is their labour, returns are vital.
There is an urgent need to ensure that poverty objectives are better integrated into a strategy for
growth promotion, and reflected in the programme design and operational guidelines.
Economic Infrastructure Support

49
Basic infrastructure has an impact on the socio-economic conditions of a community. The lack of
infrastructure and basic services induces a risk adverse environment. The efficiency of a
municipality in terms of infrastructure provision influences business location and investment as
well as the feasibility of tourism initiatives. Infrastructure includes access to land, buildings, road
networks, and services such as electricity, water, waste collection and sewerage services.
Infrastructure development is regarded as one of the most prominent methods of employment
creation, due to the high level of labour intensity that can be related thereto.
It is imperative that the Municipality provides sufficient basic infrastructure and services to the
residents, in order to improve the living conditions as well as to create an attractive business and
investment environment. Infrastructure development should be done in a labour intensive way,
creating employment opportunities for the local community, including women, children and the
disabled. This form of employment generation has been recommended as a successful method of
government intervention for local economic development in South Africa.
Labour intensive public works start to show results relatively quickly. Urban-clean-up programmes
for example, can be implemented within a year. Unlike income grants – which require immense
state capacity to target their intended beneficiaries while avoiding fraud – low-wage, labour
intensive public works are self-targeting. Unlike grant systems, labour intensive public works are
easily stopped when they are no longer necessary. However, the most important difference
between a universal income grant and a labour-intensive public works strategy is that the latter is
affordable (Business Report, 10 April 2003).
The main reason these public-works programmes have stayed small in South Africa is that they
lack the involvement of the private sector (and corporative state enterprises such as Telkom and
Eskom). Experience has shown that government departments cannot provide large-scale delivery
on their own.
If the Metsimaholo Local Municipality should implement a new expanded labour -intensive public
works programme, it would have a significant impact on public morale and investor confidence. It
must however take the form of a public-private partnership (PPP). Because the business
conditions in Metsimaholo are still of elementary nature, organised institutions and business
collaborations should first be established in the area.
The Metsimaholo Local Business Chamber should include a network of all formal organised
business stakeholders (farmers, industrialists, and other businessman) in the area that could
consequently start working together with the Municipality in order to implement large scale
ventures such as the public-works programme. A large-scale labour-intensive public works
strategy would bring together the municipality and business to build infrastructure, provide
training and create jobs for the unemployed.
The unemployed would gain income, marketable skills, confidence and dignity.

50
Business would gain directly from contracts won in return for use of labour -intensive techniques
and indirectly from improved infrastructure and a better investment climate (Business Report, 10
April 2003). In this way, the business community and residents will feel that government is doing
something tangible about unemployment.
B. TOURISM DEVELOPMENT
According to Gunn (1994) tourism is defined as “the temporary movement of people to
destinations outside their normal places of work and residence, the activities undertaken during
their stay in those destinations and the facilities created to cater to their needs.” The
development of the Tourism industry has been identified as one of the sectors with the most
significant opportunity for development, growth and job creation in the country.
Tourism is regarded as a cross-sectoral industry because it represents linkages with the retail,
manufacturing, transport, electricity and financial sectors. During the LED Indaba conducted in
Carletonville, tourism was identified as a sector, which must be embraced as a viable economic
development option that can contribute to the municipality’s economic characteristic.
Therefore, tourism must be recognised as a (potential) generator of wealth and jobs, if
Metsimaholo is to reach its full potential at both local and national level. Tourism has the
potential to contribute to the development of local infrastructure, creating and supporting
amenities and facilities that benefit local residents and business. Tourism potent ial to enhance
both the natural and built environment must be recognised.
CRITICAL SUCCESS FACTORS
In order to successfully implement tourism activities that will act as a driver of LED in the Study
Area, a number of preliminary requirements must first be considered. These requirements
determine the success and implementability of tourism and are dependant on the enhancement
of the following factors:
A. Working Partnerships
This aim of these working partnerships must be to maximise the benefit that tourism generates
and is based on forging stronger links between tourism and the other economic sectors such as
retail and transport. The working partnerships should be forged between the following entities:
Business with business (B2B)
Business with support agencies
Support agencies with each other
Communities with business and support agencies
This is vitally important as these two sectors in particular have a major influence on the tourism”
experience”, and which also benefit from tourism. It is important that the needs of both residents
and visitors are balanced throughout the development of appropriate policies and planning. The

51
decision makers should be convinced in the other sectors that their interests are interdependent
with tourism. It is also essential that the agencies, who are involved in protecting and restoring
the built environment, and managing the natural environment, implement policies that will
support the development of sustainable tourism.
B. Increased Profile Of Tourism
It must be well demonstrated that tourism is vital to the economy. It has important economic
value, and benefits both rural and urban communities. It also enhances the value of culture,
heritage and the natural environment. The entire community has a vitally important role to play if
tourism is to become more successful, for example by welcoming and helping visitors, ensuring
the maintenance of a litter-free environment, and involving visitors in local events and festivals.
Worldwide tourism is growing. There are thousands of travel options to the consumer. Therefore,
any municipality or city must market itself aggressively and consistency to ensure that it remains
at the forefront of the potential visitors mind as it jostles for attention with an increasing number
of alternatives.
The challenge should be to develop a distinctive market position that competes with many other
destinations, some of which will be offering similar experiences and packages. An understanding
of how people perceive Metsimaholo as a destination, including its natural and built environment,
culture, its quality of service and value for money.
Suitable markets must be identified and targeted using strong branding and a clear message
about what is offered. The key should be to identify the most likely customer leads, and convert
more of them into firm bookings. These markets must be developed in a manner that is suitable
for the position that the area envisages itself, in relation to the strategic market position. For a
region to position itself as a tourist leader in the key market requires:
High brand awareness-amongst target market groups.
Increased conversion from awareness to sales in target market.
Increased direct access opportunities from the target markets.
These requirements should be supported by the following guidelines that will ensure that the
place marketing of the region keeps constant alignment with the trends within the target market
as well as the industry as a whole.
Keep marketing under consistent review, adapting it as customers change and new cost-effective techniques evolve.
Identify key products; assess their scale of opportunity and the resource requirements needed to exploit the potential, in order to develop the product portfolio.
Provide support to tourism business with reference to the development of marketing skills, marketing opportunities and effective use of the internet for marketing.
Identify target markets and consumer segments that will offer best return on investment and use appropriate media to maximise return on investment.

52
Lobby as a group to increase the number of direct access routes. Undertake joint marketing with appropriate direct access transport operations. Inform
customers of their direct access options.
Additionally the success of the entire municipality is based on the following key support factors:
Successful business leadership. Enhanced product and service. Invest in people and skills. Promote sustainability and activities in an environmentally friendly manner. Promote community based approaches and capacity building. Maximise geographic comparative advantage in tourism development. The promotion of cost sharing.
C. SMME DEVELOPMENT
Small, Medium and Micro Enterprises (SMME) are recognised worldwide for their
potential to generate job opportunities, particularly when the economy is in a downward
trend. In the first part of this study, which included the assessment of the local economy,
it was found that the formal economy is simply not able to absorb all the newcomers to
the labour market in wake of the declining gold mining sector. It is furthermore highly
unlikely that this trend in the local economy will be reversed, at least not in the short to
medium term. This situation suggests strongly that SMMEs provide one of the only
possible ways to reduce the current high level of unemployment and poverty in
Metsimaholo.
In the wake of structural adjustment (due to the withdrawal of government incentives)
and comprehensive external trade liberalisation, the comprehensiveness of small and
medium enterprises has deteriorated somewhat. Obvious indicators for this lack of
competitiveness are for instance products of insufficient quality, low productivity,
outdated plants and the productivity of the entrepreneur and his staff. Therefore, SMMEs
need business development services such as information about new markets,
technologies or quality standards as well as advice and training in various fields.
Efforts that entrepreneurs may undertake themselves to remedy these deficiencies on the
enterprise level will be successful only within limits. In many countries there is no
supportive institutional environment that will assist them in their modernisation
endeavours in an efficient and competitive way. Existing services offered by private or
public providers frequently do not correspond to their needs or they are too expensive. As
SMMEs are underrepresented in established business associations and their own SMME
associations are weakly politicised, they are lacking an efficient lobbying group.

53
Therefore, the creation of an enabling institutional environment for SMMEs, including
service providers specialised on SMMEs as well as component lobbying organisations, is
an important task in SMME promotion.
This sub-section presents SMME development as a possible strategy to exploit the
potential as listed in the aforementioned sub-paragraphs. A critical prerequisite for
successful SMME development is entrepreneurship. Entrepreneurship in this regard does
not only refer to knowledge and experience in business administration, but most
importantly, to a high level of motivation, drive and work ethics.
SMME promotion interventions
Interventions need to be geared towards strengthening the performance and
competitiveness of enterprises. Target groups are medium sized business and small
business that have a sustainable potential for growth and typical interventions include:
Promotion of the sector–political dialogue between SMME representatives (e.g.
chambers, associates) and the government administration (e.g. ministries) through
capacity building on both sides and intensifying the dialogue;
Improvement of framework conditions and creation of an enabling environment
through advise to provincial departments for industry and economic affairs and other
relevant public institutions on the design of economic, legal and institutional frame
conditions for private sector;
Organisational development of SMME organisations, thus enabling them to contribute
to improved SMME competitiveness through enhanced lobbying capacity and
professional competence;
Facilitating access to business development services (BDS) through the development of
markets for services. Private and public providers need to offer specifically those
services that SMME ask for and willing to pay for. Support for such a market includes
networking, role clarification and advice to different protagonists (private service
providers, SMME promotion agencies, ministries, donors etc.).
Support of horizontal and vertical cooperation between enterprises, in particular by
using cluster and value chain approaches including advice for building up linkages
between several SMMEs and between SMMEs and large or international enterprises.
Export promotion for the SMME sector through brokering of contacts to African and
European importers and information about quality standards, market trends and
participation in fairs.
Management and business consulting on enterprise level through capacity building of
local consultants and consulting of firms including advise in order to increase efficiency

54
in all enterprise domains such as procurement, production, sales and financing as well
as special issues such as joint ventures and privatisation.
Experiences in SMMEs promotion over the last few years have shown that an
improvement in SMME competitiveness cannot be achieved solely on the level of the
individual enterprise. What is needed is an approach where interventions target different
levels simultaneously: the macro level (stability oriented and enabling economic policy),
the meso level (capacity building of private sector organisations, development of support
strategies and policies for enterprises) and the micro level (enhancing enterprise
performance and their horizontal and vertical integration into a network of linkages and
subcontracting relationships). As a consequence, today’s SMME promotion ties together
many different partners simultaneously.
Localised SMME support
The promotion, establishment and expansion of SMMEs are weighed against the establishment of larger
businesses. Larger businesses are mostly multi-locational operations. They are less dependent on their
geographic location than SMMEs and do not perceive the local level as a high-priority level of action.
They are rarely part of local economic development initiatives and usually deal directly with national
government when contributions to development are made. If a given location does not offer satisfactory
conditions, it is not rare that a large firm/factory will close down its operation and move elsewhere
rather than getting involved in the cumbersome effort of getting involved in a local dialog to negotiate
for new incentives and/or services.
The focus of this LED strategy is on SMME development because the mobility of these businesses is
much more limited. For SMMEs, the trade-off between the cost of changing location and the cost of
participating in local dialog and development efforts tends to be solved in favour of the latter. SMMEs
sometimes get actively involved in LED efforts, and they certainly are an important target group for LED
initiatives.
SMME promotion and support includes a series of core activities to which several other activities should
be added gradually. The core activities and the respective activities are as follow:
To make the service of economic promotion more transparent and more accessible to the
enterprises through enterprise visits, round tables, newsletters and intensification of public
relations.
To enforce the exchange of experiences among enterprises and to create a basis for enterprise co-
operation through the organisation of focus groups working on cross-cutting or sector specific
topics, initiation of workshops and regular meetings for new entrepreneurs or technical and
management staff of existing enterprises, creation of an internet data base to inform on services
offered and requested, on free production capacities.

55
To intensify the SMME co-operation with the municipality and to strengthen its promotional
capacities through the creation of a special training and capacity enhancement programme, for local
officers responsible for economic promotion and the organisation of working groups.
To make the local administration more responsive to the needs of the business community and to
facilitate access to administrative services through an institutionalised exchange of experiences
between enterprises and the administration.
Tools for SMME promotion
There are several types of strategies or tools that one can use as part of a home-grown strategy to
support SMME development in a local economy. These range from the relative simple intervention such
as setting up an SMME information desk at the local municipal offices to something more complex such
as facilitating the establishment of trade and information sharing networks and technology transfer.
These tools are based on international and national best practice activities and are included to provide a
point of departure against which the strategic framework can be formulated and suggests a variety of
strategies that can be used to stimulate and promote SMME development. These tools should, however,
not be seen as a blueprint for success and it is required that innovative and creative thinking be applied
during the implementation of these strategies. These instruments include:
Public sector procurement
Policy review
Funding programmes
Business development services
Establishment networks
Matchmaking
Infrastructure provision
Typical facilities aimed at SMME support
A. Public Sector Procurement
Local, provincial and national government is increasingly using its participation in the economy to create
opportunities for SMME development. Examples include the allocation of public sector contracts to
small and emerging entrepreneurs. These programmes can either take on the form of the delivery of
core or non-core government services by SMMEs. SMMEs are therefore used to provide services such as
cleaning, paper and stationary provision, maintenance, catering etc.
By informing the procurement and tender processes, local authorities can help ensure that SMMEs,
especially emerging contractors and micro enterprises, gain access to the mainstream procurement
activities of local government. On a national and provincial level, tender processes are increasingly being
reviewed to create systems, which are more transparent to small contractors.

56
Additionally, most of these programmes are implemented alongside some sort of a support structure,
designed to ensure that SMMEs comply with quality standards, understand how to apply for the
opportunities created and can assemble the network required to deliver the qualities of products
desired. These programmes can be extremely useful in developing new markets for SMMEs and
expertise in the sector.
B. Funding
Sufficient funding is one of the instruments used to increase the ability of SMMEs to perform more
effectively in the local economy. Based on demand, access to finance is often seen as the most critical
issue in developing a successful SMME community, as insufficient funding is often one of the root causes
of the high mortality rates amongst these businesses.
It is important to remember that it is not within the local authority’s power to directly finance SMMEs.
The municipality should rather take on the role as facilitator in bringing SMMEs and funding
organisations together. Municipalities can also liaise with financial institutions and banks on behalf or
together with SMMEs that are involved in special initiatives by the municipality, such as special loan
assistance or start-up financing for SMMEs to be localised in a Local Industrial Park set up by the local
authority.
A number of financial programmes and incentives are currently available to which SMMEs can be
referred to. These programmes range from government incentives (such as through the DTI) to funding
assistance by NGOs, private sector programmes and government agencies. The banking sector also plays
an important role in the provision of finance and is increasingly looking at new ways to support the
SMME sector. The critical issue is to ensure that the variety of financial models available is successfully
used to support the SMMEs that need it.
C. Policy Review
Government often do not realise the impact that the regulations, policies and by–laws of local
authorities have on the operation of the small business sector. On a national /provincial scale, SMMEs
are often negatively influenced by a combination of:
Trade policy, such as export duties, taxes or subsidies and foreign exchange control.
Fiscal policy, i.e. government expenditure, infrastructure, the provision of government services.
Labour policies such as minimum wage levels, fringe benefits and labour codes.
Output prices, including consumer and producer prices.
Direct regulatory control such as land control, enterprise licensing, monopoly privileges.
General bureaucratic system that add to the cost of doing business.
Regulations and by-laws are also tools that local government can use to govern activities within their
areas of jurisdiction. They may be created through national and provincial legislation or through the

57
formulation of regulations based on the competencies of local authorities. These regulations involve
seemingly simple arrangement such as the placement of informal trading stalls near busy intersections
or more complex regulations such as zoning, the establishment of City Improvement Districts, building
and safety regulations or levy structures. The procedure of passing a by-law includes local authority
approval on reasonable notice and proposal of the envisaged changes for public comment. Additionally,
any new by-law that causes conflict with national or provincial legislation is invalid. Careful
consideration should therefore be given to the motivation of the proposed changes.
D. Business Development Services
Apart from the start–up and venture finance, SMMEs need assistance with their day–to-day operations.
Municipalities can play a crucial part in assisting local SMMEs in this regard by providing business
development services, in partnership with key role players that will address the specific needs of the
small business sector in terms of training, technology transfer, information and marketing. For this
reason, a Local Business Service Centre (LBSC) should be established to assist SMMEs in attaining
business skills, networking and funding through the right channels.
However, recent studies have shown that although Local Business Service Centres have been
implemented throughout the country, they have not delivered many results because of fraudulent
issues that have handicapped these ventures. These inhibiting factors could be ascribed to the
fact that funding for these centres was left in the hands of individuals, instead of a collective,
transparent body such as, for example, Local Government.
Therefore it is recommended, that, should such a venture be initiated for Metsimaholo, the LBSC
should form part of the Metsimaholo Local Municipality, so that it can be transparent and its
progress be evaluated at all times.
E. Technology Transfer
Tools that are generally used worldwide to enhance technology transfer to SMMEs include partnerships
with the universities and technology institutions, SMME Consortia and the establishment of incubators
and science parks.
Technology and tertiary institutions, can best provide applied research and development in technology
fields, perform contract research for SMMEs, conduct generic research that can be aligned with SMMEs
and provide additional consulting services such as demonstration and pilot projects, workshops on new
technologies and technical training.
SMME Consortia are usually formed in situations where SMMEs cannot afford to pay many of the
upgrading requirements needed to modernise production. This is especially true when finding technical
solutions for common problems within different sectors that increase costs for small business
operations. On the international front, many SMMEs pool their resources to form a Consortium (that

58
consist of trade unions, chambers of commerce and industry organisations) to provide the financial basis
to appoint a university or technology institution.
Incubators and science parks provide assistance to technology–intensive SMMEs through shared
services and facilities, such as administrative services, reduced rent facilities, shared laboratories and
research assistance. Technology is developed through these incubators for specific SMME sectors.
Science parks have been established with success in countries such as Japan and the United Kingdom.
F. Information
Information is one of the cornerstones of any business, whether it is information on market dynamics
and penetration, product design, technological development or client demand.
Additionally, any government department will also need up-to-date information to make informed
strategic decisions with regards to what it intends to reach with SMME development in the area. It has
been founded that relative few municipalities in the country have sufficient information available on the
SMMEs in their areas of jurisdiction. This often results in LED/SMME strategies being based on perceived
needs in the small business environment, as opposed to what local SMMEs really requires.
Linked to this is the fact that other activities need to be exposed and linked to the SMMEs. Such
availability of information supports the brokerage processes of linking opportunities and SMMEs.
G. Market And Trade Assistance
Many SMMEs experience problems in penetrating markets and consequently in developing products
that will be able to answer to consumer demands. This may be due to several factors, such as
geographical isolation, inadequate technology and lack of sufficient resources. Limited marketing
channels and know-how also contributes to great entrepreneurial ideas not reaching the right
audiences, resulting in many entrepreneurs facing failure.
A local or district municipality can act as facilitator bringing together marketing service providers and
SMMEs that need marketing assistance. The marketing intermediaries can come from the private or
NGO sectors. Access to up-to-date information is required in order to assess the feasibility of SMME
products because much effort and money is invested in developing these ideas.
A number of opportunities are furthermore created for SMMEs that want to exploit international
markets through the establishment of trade agreements between South Africa and foreign countries.
Examples of these include the African Growth and Opportunity Act (AGOA), the SA/European Union and
the SADC agreement. SMMEs need assistance in taping these benefits, as there are lists of pre-
qualifications for companies wishing to participate.
H. Networks

59
Networks are fast becoming a key business tool for small and medium sized companies to work together
to boost their bottom line. The nature and size of networks varies considerably and depends on the local
economic and business environment, the nature of the SMMEs participating and the aims of the
network. A distinction can be drawn between two types:
Flexible manufacturing networks, where co-operative efforts by SMMEs are involved to produce a
final product or a series of products. Each small firm specialises in one part of a complex, multistage
production process and coordinates its activities through market –based exchanges with other firms.
Commercial networks, which offer SMMEs access to more rapidly growing, more profitable market
opportunities and to technology and know-how that is required in meeting the demands of such
markets. Typical programmes include low-cost –of entry franchising, programmes by larger
companies to outsource procurement of goods and services and market development initiatives that
work closely to buyers and agents to help SMMEs.
I. Infrastructure
A municipality can play a vital role in assisting local SMMEs through a dedicated and strategic business
infrastructure role–out programme that is formulated and prioritised on the basis of the needs of the
local SMMEs. Vehicles that can be most efficiently used to enable the municipality to increase
infrastructure delivery include,
The Consolidated Municipal Infrastructure Investment (CMIP) Programme
The Integrated Development Planning (IDP) Process
Municipal Service Partnership (MSP)
Other public–private sector or public sector community partnerships
The LED Fund for employment creation
Labour–intensive delivery of the infrastructure or Poverty alleviation

60
SECTION FOUR: CONTEXTUAL ANALYSIS The economic outlook is encouraging in the Free State. The following projection is captured.
The change from the dominance of the primary and secondary industries to tertiary industry in South African economy is informed in a number of factors. The main structural changes in the economy of South Africa are informed in a number of factors. Primarily, “economic investment in South Africa has historically been focused on the Minerals-Energy Complex (MEC) in around Gauteng, and on the linkages between that economy and the rest of the world. Investment in the MEC has to some extent been balanced by investment in agriculture, particularly massive irrigation schemes.”6 As the global economic structure changed, South Africa had to adapt and align its economy to global trends. “South Africa embarked on an ambitious set of tariff and trade policy reforms in themid-1990s.
6 Towards a 15-year Review

61
Multilateral liberalisation through the World Trade Organisation (WTO) was combined with efforts to modernise industry. Growth sectors like autos and tourism and cross-cutting sectors such as information and communications technology (ICT) received special attention in the form of industrial development resources, including science and technology and human resource development funds. These measures, together with global trends, contributed to structural change in the economy. A large contraction in the primary sector – mining and agriculture in particular – and a smaller one in the secondary sector went with substantial growth in the tertiary sector which contributed two thirds to GDP by 2006.” For the period 1997 to 2007, the tertiary industries were the highest growing of the three with a growth rate of 3.3%. The secondary industries grew by 2.8% during the period under review, while the primary industries had a negative growth of -1.4%. As has been the case since 2003, the primary industries were the least growing in 2007, growing by a mere 0.3%, which again was due to the continued sluggish growth in the mining and quarrying sector. Mining and quarrying was the worst performing sector in 2007 with growth of -0.7%, followed by electricity and water (3.0%), and agriculture, forestry and fishing (3.1%). The best performing sectors in 2007 were construction (14.8%), finance, real estate and business services (5.8%), transport and communication (5.2%), and manufacturing (4.1%).
Accordingly, the Free State provincial economy’s contribution to the national GDP has been on a decline since 1996; from 6.0% to 5.4% in 2007. This has had a negative impact on the provincial revenue envelope as the revenue distributed from National Treasury by means of the provincial equitable share (PES) has shrunk. The historic and current economic structural metamorphosis has benefitted the Metsimaholo local
economy. In both epochs, the development of the tertiary industry increased economic activity and
performance. The specific development of the petrochemical industry was linked to then then MEC.
Metsimaholo is hosting one of the most significant petro-chemical hubs in the Southern Hemisphere.
A total number of 6901 people are employed by the major industries producing a wide variety of
products from waxes, synthetic rubber, polymers, liquid fuels, solvent blends, phenol, polypropylene
product, nitrogenous products etc. The main factories are Sasol (responsible for 13% of the GGP of the

62
Free State) Natref (the only inland oil refinery in the country provides approximately 12% of the
country’s fuel and diesel) Karbochem, Safripol and Omnia. Two industrial parks have been developed
that includes Chem. City and Naledi Industrial Park. Chem City is a Sasol owned initiative aimed at the
development and establishment of small businesses in the downstream chemical industry. Naledi
Industrial Park is privately owned and approximately 95 stands have been sold out.
Since 1994, the economy has become more open, more productive and more outward orientated with both exports and imports growing rapidly. The table below provides the national review of the South African economy. Table: Structure of South Africa’s economy
1980 1990 2000 2006
Primary sector 15,5 13,1 10,8 8,8
Secondary sector 27,6 26,0 24,2 23,6
Tertiary sector 56,9 61,0 64,9 67,6
Source: Rustomjee and Hanival, 2008, paper commissioned for the Fifteen Year Review, p.36 The second contributor to the growth of the tertiary sector is the increase in public sector employment in the Metsimaholo locality. However, the community service industry is not healthy and viable for economic growth and development. The Spatial Development Framework (SDF) of the Metsimaholo Local Municipality identified a number of economic activities in its review. The development of tourism, the real estate and retail point to the increased focus on the tertiary industry in the Metsimaholo economy. The allocation of land to various locations defines the economic thinking in the SDF. The development of real estate and retail in Sasolburg, particularly around the Vaalpark area; the development of retail and tourism in and around Zamdela; the development of tourism and retail in Deneysville and Refengkgotso; and the development of real estate and tourism in Orangeville and Metsimaholo demonstrate the growth of the tertiary industry in the local economy. Despite the emphasis on the tertiary industry, the development of the primary industry is identified in
the MLM SDF. The proposed development of agriculture in Mooidraai and further areas outside
Zamdela; and the development of mining around the Amelia area suggest the opportunity in promoting
the primary sector in the locality. The prospect of the mining industry is further enhanced by the fact
that, “although not a big contributor to the local economy approximately 50% of the land area of
Metsimaholo has the potential for coal mining. There are currently two operative coal mines in the area
i.e. Sigma Colliery that mainly supplies coal to Sasol for its power and steam plants and New Vaal
Colliery that supplies coal to the Lethabo Power Station.”
The contrast between a tertiary industry that is growing and a declining primary sector is not adequate in explaining the lack of development in the Free State. A closer focus on the employment potential of sectors assists in getting a clearer picture. As the GDP contribution of the province declined, the employment contribution also declined from 7.0% in 1996 to 5.2% in 2007, indicating that the economy

63
is not creating as many jobs compared to other provinces. The fact that the province’s contribution to the national population is higher than its GDP contribution indicates that the province is underperforming. The declining population contribution also has a negative impact on the revenue received from the PES and restricts the productive capacity of the province due to smaller, younger and inexperienced labour force. An examination of Statistics South Africa’s Labour Force Survey results reveals a shrinking pool of active labour market participants in the Free State. As indicated by figure 3.1 below, provincial participation rate seems to be on a downward turn, this is disturbing as it implies that the dependency ratio in the province is likely to increase.7 The slowdown in domestic economic activity alongside considerably weaker global demand contributed to a moderation in formal non-agricultural employment growth during 2008. Table 3.4 indicates that between the fourth quarter of 2008 and the first quarter of 2009, the Free State recorded job losses in most industries in the formal economy, with most of them surprisingly being in the community and social services which accounted for 21 000 of the job losses, followed by finance for 5 000 and trade for 4 000. Utilities and Transport both accounted for about 2 000 job losses collectively. On average, a total of 32 000 jobs were lost from the above-mentioned industries. The table below illustrates some of the trends over time:
Industry Jan – March 2008
Oct-Dec 2008
Jan-Mar 2009
Qrt-Qrt Change
Year-on-year change
Qrt-Qrt Change
Year-on-year change
Thousand Percentage
Total 516 527 501 -26 -15 -4.8 -2.9
Mining 23 30 33 3 11 10.9 46.5
Manufacturing 77 66 68 1 -10 2.0 -12.3
Utilities 5 6 5 -1 0 -21.4 1.2
Construction 45 49 51 2 6 5.1 12.3
Trade 129 115 111 -4 -18 -3.4 -14.0
Transport 32 28 27 -1 -5 -4.9 -15.4
Finance 55 62 58 -5 2 -7.8 4.4
Community and Social Services
150 170 149 -21 -1 -12.4 -0.6
Table 3.4: Formal sector employment by industry, 1st and 4th Quarter 2008 and 1st Quarter 2009, Free State Owing to the above-mentioned, certain economic realities persist, and the following status quo
abounds:
The decrease in employment is primarily attributed to the fact that the primary industry is the primary
absorber of labour, while the tertiary industry remains capital intensive. This phenomenon is presented
in the table below.
7 Free State’s Labour Force Participation rates, March 2001 to Marc 2007

64
Table: GDP and Employment contribution by sector in the Free State economy, 2002 & 2007
Industry 2002 2007
GDP Employment Emp/ GDP Ratio
GDP Employment Emp / GDP Ratio
Agriculture 4.7% 19.5% 4.1 3.3% 18.3% 5.5
Mining 9.7% 13.5% 1.4 8.4% 5.8% 0.7
Manufacturing 11.7% 11.2% 1.0 11.2% 10.7% 1.0
Water an electricity
3.1% 0.4% 0.1 2.9% 0.3% 0.1
Construction 1.6% 3.2% 2.0 2.1% 7.4% 3.5
Trade 11.3% 18.6% 1.6 12.6% 22.5% 1.8
Transport 9.1% 4.2% 0.5 9.1% 4.0% 0.4
Finance 15.7% 6.4% 0.4 17.0% 7.3% 0.4
Community and social services
24.2% 23.0% 0.9 24.0% 23.8% 1.0
Source: Stats SA, Labour Force Survey, September 2006 & 2008 In summarizing the labour market in the Free Stat, the following points are made:
The community services industry is biggest contributor of employment in the province, district and local municipal areas
As the tertiary industry increase, there is minimal employment creation in the province, district and local municipal areas
There is no concerted effort to build a human capital that will respond to the economic growth informed in the tertiary industry
The absence of economic diversification limits the ability of the primary sector to growth and provides the necessary employment
Conclusion Similarly, the economic restructuring in South Africa in the 1990s was primarily informed in the development of the tertiary industry; hence the projected increase in economic growth in Metsimaholo. However, the growth is not linked to development through skills development, job creation and SMME and Co-operative development. For instance the benefician of the petrochemical industry in Chem City creates huge opportunities to skill local people as entrepreneurs and the ultimate establishment of SMMEs. As a means to link economic growth and development, the MLM LED strategy is informed in leveraging the projections of continued economic growth in the Metsimaholo local economy. The projections are presented:
The provincial economic outlook suggest a GGP increase of 2,9%, 3,9% and 4,5% over 2010, 2011 and 2012 respectively
The Fezile Dabi District is projected at an economic growth of 3,9%

65
The economic projects are only based on the current economic activities within existing industries in the Free State. Specifically, the outlook is predicated on the continued on the tertiary industry, particularly on the community services, as drivers on employment in the Free State. However, the challenge is to develop a strategic fit that will firstly, maintain the status quo. Secondly, the strategic fit needs to diversify the sectors, particularly the increase in primary industries, to increase the GGP/employment ratio in the Free State. As stated earlier “sectors that were labour intensive in 2007 were trade, agriculture and construction. A sector is labour intensive when it has an employment/GDP ratio larger than 1 and capital intensive when the ratio is less than 1. Agriculture was the most labour intensive sector in 2007 with an employment/GDP ratio of 5.5, followed by construction with an employment/GDP ratio of 3.5. The water and electricity sector was the most capital intensive sector with a ratio of 0.1. Community services sector was the biggest contributor to both GDP (24.0%) and employment (23.9%) in the province. The construction sector was the least contributor to GDP with 2.1%, whilst the water and electricity sector was the least contributor to employment with 0.3%. The mining sector was the only sector that lost its labour intensiveness since 2002; this can be attributed to the closing of mines and the increasingly massive capital required for ventilation, cooling, hoisting, underground tunneling and surface processing plants.” In the context of Metsimaholo, the ability to increase the real estate industry and activate the construction industry will have a huge impact on job creation. Secondly, the ability to develop the retail industry, the tourism industry, the agricultural industry, and the mining industry, will have huge implications in creating jobs and promoting entrepreneurship. In essence, the success of the MLM LED strategy will be measured on its ability to diversify the local economy through labour intensive industries rather than the current status quo. It is in this regard the MLM LED strategic direction is defined and informed.

66
SECTION FIVE: THE LOCAL ECONOMIC CONTEXT
The Locality
The Local Municipality of Metsimaholo (Sasolburg) is located in the northernmost corner of the Free State province, which forms part of the Vaal Triangle [Vanderbijlpark, Vereeniging and Sasolburg region(s)], approximately latitudinally 27,8ºS and longitudinally 26,7ºE and approximately 1470 metres above sea level. The new category B local municipality FS 204, surface an area of approximately 1705,4253 km².
At sub-township level the following townships / villages are situated within the area of jurisdiction of the municipality, namely: Sasolburg, Zamdela, Deneysville, Refengkgotso, Oranjeville and Metsimaholo townships and Kragbron-, Viljoensdrift Villages, etc.
Sasolburg and Zamdela as the youngest townships (in the Free State) owe their existence directly to the petro-chemical industry, and was formally established during September 1954.
The new municipality known as the Local Municipality of Metsimaholo, has been established as a Category B Municipality, with effect from 8 December 2000 and in terms of Provincial Notice no 185 of 2000, published in the Free State Provincial Gazette no 113 dated 28 September 2000, as amended and as per Map 1 hereinafter;

67
1.2.1.1. Population
The determination of accurate data on demographics in South Africa has been a contested area. Until
the Community Survey 2007, the Census 2001 has been the only source of data on demographics in
South Africa. Though the Community Survey 2007 has become a more reliable source of demographic
data, some of the institutions like the Demarcation Board have not yet updated its data. However, the
current reliable database is sourced from the Metsimaholo IDP, indicating that the population of the
Metsimaholo is estimated at 164 000, as opposed to 134 000. The chart below illustrates the
distribution of the population within the Metsimaholo municipal area.

68
Figure 2: Metsimaholo Population Distribution
The gender differentiation of Metsimaholo is similar to the national and provincial character, suggested
at 55% Female and 51% Male. The figure below explains the whole demographic character of the
municipal area.
2.1.3.3 Monthly Household Income

69
2.1.3.4 Employment
Figure 3: Metsimaholo Employment
1.3. THE ECONOMIC CONTEXT
In understanding the economic status quo of Metsimaholo, the following realities are noted:
According the Centre for Development Support, University of the Free State the Metsimaholo Region contributed to approximately 21,6% of the GDP in the Free State during 2004.
Metsimaholo contributes 68,1% to the GDP in the District

70
“…Metsimaholo has been earmarked as the development nodal point for the following 20 years! …” General Economic Tendencies: According the Centre for Development Support, University of the Free State the Metsimaholo Region contributed to approximately 21,6% of the GDP in the Free State during 2004. The growth rate has been 2,6% per annum since 1996 – 2004, which is significant higher than the rest of the Free State. The current GDP for 2004 confirmed R13`222`440`000.” However, between 2005 and 2009 there has been some economic downturn which affected the continued growth rate of the Metsimaholo Region to the provincial economy. Secondly, there has been shift in sectoral contribution to regional output, with the tertiary sector becoming more valuable than the primary and the secondary sectors.
Accordingly, the Metsimaholo economic performance has been rated highly compared to other municipal areas in the Free State Province. The following table provides some of the data in this regards.
Municipality GDP contribution %
Population
Size
%
Employment
Contribution
Rate
Unemployment
rate
Poverty
rate
Mangaung (Bloemfontein) 31.35 21.5 59.6 37.8 41.0
Matjhabeng (Welkom) 15.04 18.7 52.9 39.5 48.1
Maluti-A-Phofung
(Phuthaditjhaba and
Bethlehem)
4.33 13.2
34.1 61.7 65.7
Metsimaholo (Sasolburg) 21.61 4.2 76.2 33.4 31.6
“According to the table Metsimaholo performs extremely well compared to the other larger
municipalities. Its population is only 4.2% of the Free State but it contributes 21.6 to the GDP of the
province with the highest employment rate of 77.2%, lowest unemployment rate of 33.4%, and lowest
poverty rate of 31.6%. This favourable condition is mainly due to the large chemical industries in
Sasolburg and large percentage of wealthy pensioners staying in the area. In addition, Metsimaholo
produces almost 92% of the manufacturing, 96% of the water and electricity, and 100% of the mining
and quarrying in the district.” (Economic Analysis: 2009).
Driving the economic performance of Metsimaholo is primarily the petrochemical industry.
Metsimaholo is hosting one of the most significant petro-chemical hubs in the Southern Hemisphere.
A total number of 6901 people are employed by the major industries producing a wide variety of
products from waxes, synthetic rubber, polymers, liquid fuels, solvent blends, phenol, polypropylene
product, nitrogenous products etc. The main factories are Sasol (responsible for 13% of the GGP of the
Free State) Natref (the only inland oil refinery in the country provides approximately 12% of the
71
country’s fuel and diesel) Karbochem, Safripol and Omnia. Two industrial parks have been developed
that includes Chem. City and Naledi Industrial Park. Chem City is a Sasol owned initiative aimed at the
development and establishment of small businesses in the downstream chemical industry. Naledi
Industrial Park is privately owned and approximately 95 stands have been sold out.
1.3.1. The main components of Metsimaholo
Sasolburg is located in the heart of worldly renowned coalfields. This modern and predominantly
industrial town is further located in close proximity (20km) to the nationally well-known industrial areas
of Vereeniging / Vanderbijlpark. The Sasolburg / Zamdela urban area is 340km from Bloemfontein and
80km from Johannesburg. Apart from the internationally known SASOL “oil from coal refinery”, a vast
number of by-products including olefins, waxes, alcohols, tar products, inorganic chemicals, rubber,
gases, plastics, fertilizers, etc are manufactured in the area.
The Deneysville / Refengkgotso urban area is situated in the north-eastern section of the Metsimaholo
Region, approximately 36km east of Sasolburg and 350km north-east of Bloemfontein. Other larger
centres such as Vereeniging and Vanderbijlpark are all within 50km from Deneysville. There are non-
worth mentioning industrial activities present in the community. Industrial activities are exclusively
related to the boating industry. The town’s close proximity to the coal mining and industrial activities in
Sasolburg and its nearby location to the large industrial complexes of Vereeniging and Vanderbijlpark,
definitely and perhaps negatively, influence economic activities in Deneysville. The strong recreational
character of the town further enhances this phenomenon. The largest number of the inhabitants of
Refengkgotso, is employed in Sasolburg and the adjacent industrial complexes of Vereeniging and
Vanderbijlpark. Refengkgotso can thus be labeled as a typical satellite residential town to the
surrounding industrial areas. These factors contribute to the relatively low level of economic activity in
the Deneysville area.
The Oranjeville / Metsimaholo urban area is located within the former district of Heilbron. Oranjeville is
situated on the riparian of the Vaal Dam in close proximity to the northern boundary of the Free State
Province. The area is accessible by road and within 55km from Sasolburg, Vereeniging, Frankfort,
Heilbron and Villiers. Although the prominent economic sector of the area is agriculture, it is
subsequently strategically situated from a recreation and tourism point of view. This is in view of the
fact that the town is bound on three sides by the Vaal Dam and located in close proximity to the
Gauteng metropolitan area. It is also linked to several other towns in the vicinity.
The Vaal River and Vaal Dam form the northern boundary of the area, which also serve as the
boundary between the Free State and Gauteng Province. A significant portion of the Metsimaholo
Region is included in the Vaal River Complex Regional Structure Plan, 1996 (former Vaal River Complex
Guide Plan, 1982). Vaal River Regional Structure Plan is a statutory land use control document, which is
applicable to amongst other land located along important water resources such as the Vaal Dam, Vaal
River and Barrage. All Guide Plans compiled in terms of the Physical Planning Act (Act 88 of 1967) were
declared Regional or Urban Structure Plans in terms of Section 37 of the Physical Planning Act (Act 125
of 1991). The Vaal Dam often referred to as the Highveld’s Inland Sea, is the most prominent

72
topographical feature in the region. This vast expanse of water covers some 300 square kilometers. It
serves as Gauteng’s principal source of potable water and is a popular water sports and water related
adventure venue.
Current Development Initiatives
Regional Government Department offices are relocated in Sasolburg according to Government
policy.
Additional industrial park is proposed to be developed in Metsimaholo Local Muncipality
The Chem City industrial development and Naledi Park industrial development in the Sasolburg
Industrial Area.
Development along the river banks of the Vaal River.
A real estate development policy, regarding holiday accommodation, is endorsed in Oranjeville
to stimulate growth of the tourism sector.
The Deneysville community consists of an active tourism forum which was recently awarded
R15 000–00 to enhance the tourism in the area.
Water from the Lesotho Highlands Project will ensure permanent full levels of the Vaal Dam and
it is envisaged that the potential of the dam as tourism destination will be improved.
Proper and strict development control adjacent the Vaal Dam and Vaal River Barrage by means
of the Vaal River Complex Regional Structure Plan, 1996 (formerly known as the Vaal River
Complex Guide Plan, 1982) ensure a sustainable environment and enhances the tourism
potential of the area.
The Lizard Point development could be considered as an entire new town, comprising of nearly
600 residential erven which are in the process of being developed, immediately north of
Oranjeville/Metsimaholo.
1.6. Mining
Although not a big contributor to the local economy approximately 50% of the land area of
Metsimaholo has the potential for coal mining. There are currently two operative coal mines in the
area i.e. Sigma Colliery that mainly supplies coal to Sasol for its power and steam plants and New
Vaal Colliery that supplies coal to the Lethabo Power Station.
1.6.1. Molensteen Pan 129 (Zamdela)
“General Smuts *former Transvaal Government+ made approximately £ 1,180,000 available for the
construction of the Union Buildings [Presidents Offices] on Meintjieshill, Pretoria, during 1910 until
1913. Interesting to note is that some of the building material utilized in the construction of the
buildings, more specific sand stone building – blocks, was inter alia exploited from an area, situated
south of the existing Harry Gwala, Sasolburg. This area is better known as Molensteen Pan 129.”

73
Considering the weight of the building blocks and the fact that these blocks were transported by means
of ox – wagons, over pure sand, to the Sasolburg Railway station, the workmen constructed a road
paved with sandstone. Some of the farm houses in the area can still be identified where farm owners
utilized the same building material. Molensteen Pan was sold to Taaibosch Power Station during 1954.
1.7. Agriculture
Agriculture is an important character of the area although it does not provide a significant
contribution to GGP of Metsimaholo. There are approximately 853 farms in the region with 693
commercial farmers that mainly produces maize, sorghum, sunflower, wheat, and dairy farming.
However, a lot of identified agricultural land in owned by the Anglocoal and SASOL. According to
Anglocoal’s expansion initiative, most of the agricultural land will be mined in future.
There is an identified municipal land areas for agriculture, and this includes the Mooidraai area.
1.8. Tourism
Tourism currently contributes a small percentage GGP of Metsimaholo. There are not many tourism
facilities and attractions available in the area although it has the potential to develop into a preferred
destination area, if properly planned and marketed. The areas of real attraction include the Vaaldam at
both Deneysville and Oranjeville with the Jim Fouche Holiday Resort, Abrahamsrust, Etienne Rousseau
Theatre, and environmental facilities such as the Highveld Gardens, Bird Sanctuary, and Riemland Eco
Park. There is only one cinema in Sasolburg with limited restaurants in the area
Because of its diverse tourism potential and attractions i.e. Sasolburg (Sport and Nature) Deneysville and
Oranjeville (Vaal dam), a proper and coherent tourism strategy needs to be developed that will assist in
managing the tourism potential of the area. The following products are identified in the area:
The History of Zamdela (the heritage initiative)
The Vaal Dam with boating and sail sure week during September including Bird Watching
opportunities
Gallery 88 Art Gallery at Sasolburg
The Zamdela Arts and Cultural Centre
The Highveld Gardens in Sasolburg
Abrahams Rust Recreational Area
Jim Fouche Resort
The Vrefort Dome at Vredefort
The Viljoensdrift Police Station as one of the “oldest” developments in the Northern Free State
The National Heritage Site in Deneysville
Coal broock Mine Accident (1968) on the Farm Mooi Draai (Zamdela)

74
Three scenic routes were recently identified as having tourism potential, although upgrading thereof is
a prerequisite. Two thereof run virtually parallel to the Vaal River in the Koepel area and comprise of
extreme beauty, unique topography and landscape features. Development of the identified scenic
routes should be endeavored to enhance the tourism potential of the area. In a sense, these roads
should be considered as "tourism development corridors" and land use changes adjacent thereto,
relating to tourism, should favorably be considered. The following roads are highlighted in this regard:
The Koepel Scenic Route (Sections of Roads S 264, 212, 80 & 713);
The Vaal Eden Scenic Route (Sections of Roads S 1052 & 171); and
Road R 716 (north of the Vaal Dam) and sections of road S 159 (south of the Vaal Dam to Jim
Fouché Resort) providing relatively good access to various sections of the Vaal Dam.
1.9. SMME Development
There is a surprising number of SME’s and informal businesses operative in Zamdela. There is however
a general lack of support available for the emerging entrepreneurs that includes aspects such as
facilities, financing, business skills, and business equipment etc.
A survey was conducted amongst these entrepreneurs and the outcome of the survey will be
provided later in the sector. An exception is the recently established Kgodiso Business Center, a
container city; that will accommodate 28 informal businesses. This business sector has a huge
potential to grow and to make a significant contribution in reducing unemployment and contribute
to the GGP of the area. Much more support will however be required to develop and sustain this
sector. SEDA (Small Enterprise Development Agency) has recently established an office in Sasolburg
and can make a meaningful contribution to support the emerging entrepreneurs.
1.10. Status of SMME’s:
A survey of SMME’s survey was done extensively in 2005 in Zamdela and 770 businesses were surveyed. In Oranjeville and Deneysville most of the businesses were surveyed.
According to the above table 80% of the businesses are informal and their survey is therefore much more biased towards the informal/SMME type businesses.
37% of the business survey exists less than 2 yrs. This means that almost 342 new entrants come into market during the past 2 yrs. For the past 5 yrs the number of businesses increased by 593. Only 3% of the businesses are longer than 20 years in business. If one considers the maturity rate of businesses to be 7 years one can expects that a large percentage of the 593 businesses will seize to exist. This reinforces the importance of providing proper mentoring support and capacity building of new businesses.
reinforces the need for more formal planning and creation of a business area/center for Zamdela.
The above profile reinforces the importance to ensure that SME’s get the necessary support to sustain and grow.
Registered business such as a private company and closed corporation is not the popular choice to do business and only represents 7% of all the businesses. Informal businesses represent

75
almost 37% of all the businesses and once again reinforce the importance of providing support, advice, and assistance to informal traders
The most popular business is general dealer (36%) fruit and Vegetables (17%) and Beauty and Hair (11%). Other products that have a high number of dealers is Clothing (7%) motor Industry (6%), public phones (5%) alcohol (4%).
In reviewing the LED Strategy, a deeper focus will be placed on challenges, constraints as well as
opportunities in maximizing individual sectoral competitiveness, and intersectoral linkages to aggregate
the municipal economic competitiveness. In essence, this means the need to identify enablers to attract
both public and private sector investments in the municipal area.
SECTION SIX: KEY INTERVENTIONS
INTRODUCTION
The development of key interventions in the development of the economy of Metsimaholo is informed
in a number of submissions:
The MLM IDP – the limited employment, high unemployment and poverty
Key stakeholders – primarily the business community
The provincial review and outlook – the dominance of the tertiary sector and declining
employment

76
The participatory processes identified a range of needs from stakeholders and role-players. These needs
include infrastructure, efficient governance, lack of communication, and issues around red-tape, to
name a few. Similarly, the development of strategic sectors to increase economic growth and create job
opportunities and entrepreneurship lies in investment on infrastructure, reducing red-tape, efficient
governance, skills development and communication among stakeholders. In essence, addressing the
challenges presented through the participatory processes will assisting in stimulating sectors, thus
creating an enabling environment for investment in strategic sectors.
The objective of the MLM LED strategy is to develop a framework that will redress the above-mentioned
challenges, primarily being creating an enabling environment for job creation.
Complimenting the processes and IDP, is the outcome of the analysis in the previous section. The
analysis spelled out the challenge to creating jobs and increase employment in the whole Free State
province. The challenge is to promote the secondary and tertiary sectors because they are labour-
intensive in character and nature. This means the MLM LED strategy must identify what sectors and how
investment in those is going to be leveraged. Secondly, the strategy needs to spell out how skills, job
opportunities and impact on entrepreneurial activity are going to be promoted and implemented in
Metsimaholo.
GENERAL PRINCLES OF LOCAL ECONOMIC DEVELOPMENT
The development of the MLM LED Strategy is based on a broad, inclusive and integrated approach
defined within Spatial Economic Development. This means that the principle of “local competitiveness”
defines priority sectors and the required capacity needed to render the former viable and sustainable.
This slightly differs from the principle of “systemic competitiveness”, wherein primarily individual
enterprises are defined as the alpha and omega of LED. Besides the principle of local competitiveness,
the “diversification of the local economy”, partly through benefician, forms part of the intrinsic
understanding of the MLM LED Strategy. The over-reliance on one sector or industry often distorts the
local economic potential, thus rendering it inefficient. As part of the government’s approach and
practice, the other principles include the following:8
o Spatial integration of the local economy through building Linkages between the established urban
economy and the rural areas o Equity and economic empowerment o Beneficiation and value addition o Building a synergistic relationship between Local Economic Development and Social Upliftment o Social, Economic & Environmental integration is interdependent and will always be the first test when
evaluating opportunities. (i.e. triple bottom line) o LED focused around realistic catalytic initiatives natural to the locality and wherever possible building
on the uniqueness of local competitive advantage and market differentiation o Building on capacity to nurture effective and mutually beneficial partnerships based on fair and
equitable business principles o Maximization of total months of employment in the long-term
8 Though this strategy approach differs from other local strategies, it acknowledges generic principles in LED like
the ones espoused in the AREDS.
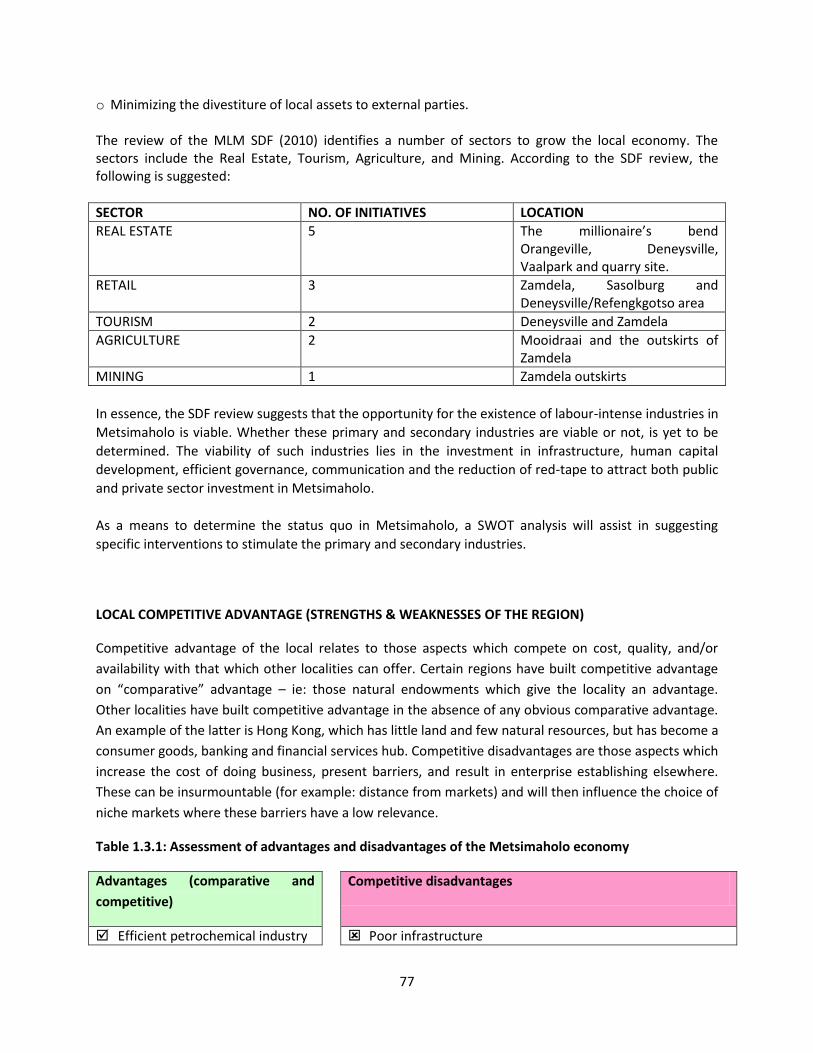
77
o Minimizing the divestiture of local assets to external parties. The review of the MLM SDF (2010) identifies a number of sectors to grow the local economy. The sectors include the Real Estate, Tourism, Agriculture, and Mining. According to the SDF review, the following is suggested:
SECTOR NO. OF INITIATIVES LOCATION
REAL ESTATE 5 The millionaire’s bend Orangeville, Deneysville, Vaalpark and quarry site.
RETAIL 3 Zamdela, Sasolburg and Deneysville/Refengkgotso area
TOURISM 2 Deneysville and Zamdela
AGRICULTURE 2 Mooidraai and the outskirts of Zamdela
MINING 1 Zamdela outskirts
In essence, the SDF review suggests that the opportunity for the existence of labour-intense industries in
Metsimaholo is viable. Whether these primary and secondary industries are viable or not, is yet to be
determined. The viability of such industries lies in the investment in infrastructure, human capital
development, efficient governance, communication and the reduction of red-tape to attract both public
and private sector investment in Metsimaholo.
As a means to determine the status quo in Metsimaholo, a SWOT analysis will assist in suggesting
specific interventions to stimulate the primary and secondary industries.
LOCAL COMPETITIVE ADVANTAGE (STRENGTHS & WEAKNESSES OF THE REGION)
Competitive advantage of the local relates to those aspects which compete on cost, quality, and/or
availability with that which other localities can offer. Certain regions have built competitive advantage
on “comparative” advantage – ie: those natural endowments which give the locality an advantage.
Other localities have built competitive advantage in the absence of any obvious comparative advantage.
An example of the latter is Hong Kong, which has little land and few natural resources, but has become a
consumer goods, banking and financial services hub. Competitive disadvantages are those aspects which
increase the cost of doing business, present barriers, and result in enterprise establishing elsewhere.
These can be insurmountable (for example: distance from markets) and will then influence the choice of
niche markets where these barriers have a low relevance.
Table 1.3.1: Assessment of advantages and disadvantages of the Metsimaholo economy
Advantages (comparative and
competitive)
Competitive disadvantages
Efficient petrochemical industry Poor infrastructure

78
Proximity to Africa’s largest economy, Gauteng
Significant pool of skilled people committed to the area
An alternative route to the coast from inland
The Vaaldam as a water resource
Leisure as a vibrant activity in the whole province
High proportion of strong and healthy people in all ages
Existing tourism sector
Road and rail network needs upgrading, routes sub-optimal Lack of educational institutions in the area Poor tourism economic activity Brain drain Economic leakages Poor retail activity in the area Lack of provincial investment in the local economy Red tape, particularly on land and property issues
COMPETITIVE POSITIONING (THREATS & OPPORTUNITIES)
The advantages provide guidance on the opportunities for the local economy, including the
diversification of sectors (tourism, agriculture, mining, etc.), development of the people, and benefician
of the existing industry. The disadvantages provide guidance on sectors to be avoided more importantly,
“it provides guidance on areas of pubic sector action and investment (improved education, reduced red
tape, improved functioning of institutions, and support to socio-economic adaptation).”
External threats will impact the economy of the locality over time, and may offer opportunities. Threats
include
o Global competition for resources (oil, steel, cement, investment capital and skills)
o Global competition on labour costs from China, India and Eastern Europe
o Global warming which may destroy the local asset, result in water scarcity, increase human and
crop disease, destroy value in low-lying commercial and residential property, increase in risk due
to weather intensity and variability increase, increase immigration pressure from central African
and European areas, etc.
o Exponentially increasing cost of carbon-based fuels
o International and local political instability as poverty, HIV/Aids and rich-poor divide increase
o International economic practices, including mobility of global capital and manipulation of financial
markets investors, the trend to increased private equity holdings, high indebtedness of major
economic powers, increased occurrence of speculation and bubbles.
However, threats internal locally are more likely to be more significant than external threats in the next
ten years. Apart from the threats listed above, the primary threats to Metsimaholo will be
o failure to transform and build an equitable and inclusive economy which neither penalises those
with the capital to grow the economy nor those who have historically been excluded
o failure to achieve public sector institutional efficiency and effectiveness
o a national financial system / fiscal policy / perception of risk combination which reward the short
term and consumptive rather than long-term productive investment.

79
FOUR MAIN STRATEGY INTERVENTIONS
The ultimate strength of the strategy is defined within its ability to create the link between the
objectives and intended impacts. This link is referred to as interventions. The interventions are informed
in a number of factors, including the desktop research combined with growth theory, a process of
interaction with the business sector, and competitiveness theory. The trends and issues from these
sources should be aligned as well.
In responding to the key strategic interventions, the German Development Foundation, GTZ, has
developed a tool to which such interventions can be explained. The tool, COMPASS, is utilized to define
the linkages of four areas of intervention.
The four areas of interventions are defined as High Impact Investment; Governance; Knowledge, Skills,
and Human Capital; and Communication and Interaction. The diagram below indicates the four areas.

80
The first intervention area is High Impact Investment, which is the core of the four interventions in local
economic development. The result areas include the following:
o Locality development includes infrastructure, spatial development (including access and linkages),
protection and development of the environmental assets, urban renewal, tourism facilities and
even lifestyle facilities.
o Subsectoral development, which includes diversification of the economy, value chain
development and business retention, all focused on development of the competitive advantage of
the locality. For the locality, urban development and development of the district have been linked
under corridor developments to strengthen the integration of the economy and support value
chain development across the municipal area.
o Public good investment: this refers primarily to investment in land, the environment, economic
assets, production facilities, machinery, equipment and other productive assets that are used by
multiple stakeholders. An example may be the development of public buildings in the city centre
to provide improved shopping environment, the development of a produce market, small
business hives, agricultural showgrounds, etc.
o Local venture capital fund: while it is not necessary that such a fund be limited to the district, or
“owned” by anyone in the district, it is necessary that access to investment funds that target the
locality, syndicate risk and respond to criteria that address the constraints of investors in the
locality.
o Stimulate new sectors: public and private investment is required to stimulate sectors which build
on the advantages (strengths) of the locality. The approach should be to stimulate a diversity of
sectors to see which “take” – ie: which sectors find champions and investors. Sectors include high-
technology products, innovative products, knowledge sectors, arts (visual, performance and
written), experiential tourism, alternative technology, banking, business process outsourcing,
education and sports development.

81
In the context of municipal policy imperatives, some of the responsibilities for High Impact Investment
fall within the realm of either the district, provincial and national jurisdiction. This calls for cooperation
and coordination. This explains the interlinkages and relationship between and among interventions.
“However, it is essential to bear in mind that, while high impact investment is a necessary requirement
for economic development, it is not a sufficient condition. It is dangerously easy to focus only on this
aspect of the strategy, to the detriment of sustainability, equity, diversification, competitiveness and
catalytic / multiplier effects. The other three areas (efficient governance, human capital development,
and communication and integration) provide the “enabling environment”, supporting the efficiency,
effectiveness of economic activities.”
The second intervention area is Knowledge, Skills and Human Capital. This is the strategy intervention
which focuses on knowledge, learning and growth. It has five result areas, namely:
o Collaboration to improve competitiveness. This result area addresses aspects such as networking
of similar companies to learn from each other and share experiences and research
o Targeted vocational training. This includes improvement of academic skills development to meet
the needs of the economy, lifelong education and training, to improve skills and education of
those already in the workforce and the unemployed to allow for improved employability, and
improvement programmes for management in both public and private sectors
o Targeted skills attraction and retention. This includes affordable middle-income housing,
affordable quality education and health services, affordable public transport systems, good
personal safety and security, and leisure and entertainment facilities and choices.
o Targeted capacity development to undertake economic development in the public sector
o Business development support, especially to new business (SMMEs)
o Development of a subsector research and innovation capacity.
Critical is the role of the all educational institutions to focus priorities to provide skills for the local
economy.
The third area of intervention is Efficient Governance. This strategy intervention has seven main result
areas, namely:
o Reduced red tape – ie: decision-making criteria are clear and processes are efficient and effective.
Legislation and bylaws are clear and are implemented equitably, effectively and efficiently
o Needs-specific operational planning and budgeting: Improved planning and budgeting at all levels
to meet the identified economic development needs. This area includes effective co-ordination
between public sector role players in planning, budgeting and implementation
o Effective land-use management: Land use planning and management balance economic
development with social and environmental needs, have clear criteria and are efficient. Also, land
claims are finalized to transfer
o Transparent and principled government. This would include availability of information on
government decisions, and cost-effective recourse against inappropriate, ad-hoc or damaging
decisions
o Effective public procurement and investment to stimulate economic development

82
o Organisational responsibility is aligned to interventions – the appropriate organizations undertake
interventions, and organizations are structured, resourced, have systems and activities
appropriate to their mandates
o Quality, current and accessible economic and investment data. This result area is placed under
the governance intervention because it is a public good and affects decision-making within the
public sector and the private sector. It does overlap somewhat with the “learning” intervention
and with the monitoring and evaluation function of the “collaboration” intervention.
The last strategy intervention is Stakeholder Communication and Interaction. This is the intervention
which provides a framework for support interactions between stakeholders, a communication service
and supports a planning and monitoring function. It has six result areas, namely:
o Facilitate and support a Local Growth Coalition. The Coalition will act as an advisory “Board” and
act as a structure for co-ordination and shared problem identification, planning and monitoring
between public and private sectors.
o Inter-governmental relations forums promote joint planning, budgeting and aligned
implementation
o Promotion of organization of private sector stakeholders across sectors and localities
o Support to policy and programme linkage: provision of analysis, advocacy and access to decision-
makers to influence policy to improve the business environment in the district, and draw down
support from existing programmes to support local initiatives
o Partnership programme to promote PPPs and business-business partnerships, including
partnerships to optimize use of public assets o Monitoring and evaluation of economic development.
CATALYSING SECTORAL DEVELOPMENT THROUGH KEY INTERVENTIONS: A CASE STUDY FOR
AGRICULTURAL, TOURISM AND SMME DEVELOPOMENT
C. AGRICULTURE
There is a growing need to solve the host of problems faced by the Agriculture sector in a more
integrated manner, within the framework of sustainable development. Agricultural sector strategies
have veered between maximizing agricultural growth through promoting commercial crops and
emphasizing food production / self –sufficiency and import substitution on the other. There are however
various strategies to improve this sector, e.g.
Agriculture Diversification
Agriculture Beneficiation (Agribusiness)
Tools & Instruments

83
Each of these components is synoptically discussed in the subsequent paragraphs in order to highlight
the salient features which must be incorporated into the strategic framework that is developed in the
subsequent section.
Agriculture Diversification
Farmers on a global scale have become increasingly diverse in their agricultural produce over the
last few decades. This means that traditional crops such as maize and wheat less important as a
source of livelihood while other farming practices such as permanent crops, hydroponics, organic
farming, bio-technology etc. have become more important and profitable. Some degree of
diversification has always existed in the Agriculture sector. After all, farming is grounded in the
seasonality and risky nature of planted crops. Diversification is thus seen as a method to cope
with risk and crop vulnerability.
In terms of Local Economic Development, Agriculture diversification is seen as a livelihood coping
strategy for the farmer; increasing profits through new products such as olives, organic fa rming
and essential oils; broadening the local export base; and the creation of additional employment
opportunities. Agriculture diversification also has indirect spin-off effects on the Secondary
sector. Opportunities are now created in the agro-industrial sector in terms of packaging and
value adding, which creates even more employment opportunities.
Viable agricultural crops, with clearly defined markets therefore need to be identified for
available agricultural land and planning programmes initiated within the municipal area. As part
of these strategies, new and innovative agricultural practices need to be taken into cognisance.
It has become evident that traditional agricultural production methods will not be able to meet
the demands of a growing South African population for much longer. Towards the end of the 20th
century, Research and Development subsequently focused on the development of alternative
food production techniques that would be able to address increasing demand in a safe and
sustainable way. In this context, the biotechnology industry gained momentum towards the end
of the 20th century. Biotechnology is defined as “the application of scientific and engineering
principles to the processing of materials by biological agents to provide goods and services”
(OECD, 1982: 18).
The application of biotechnology in value-added agricultural production in Metsimaholo is
therefore an important strategy to improve the output of the sector and to contribute towards
the diversification of the economy.
Agriculture Beneficiation (Agribusiness)
Agribusiness may be defined as all market and private business–oriented entities involved in the
production, storage, processing and distribution of agro–based products, in the supply of
production inputs, and in the provision of services. Agribusiness is an integral component of rural

84
development, and forms part of the strategy to improve regional and local economic
development and ensure food security.
Since earnings from the simple sale of raw produce may be lower and more volatile, the addition
of such “downstream” activities can improve a community’s local economy, create new
employment opportunities and contribute to environmental sustainability. Agricultural value -
added enterprises represent excellent business development opportunities for the local
community. This is mainly because the community is located near raw agricultural inputs, which
can be turned into a competitive advantage.
Agribusiness enterprises are primarily labour intensive small and medium enterprises located
near agricultural production sites in rural areas or in rural centres. Economic success of these
agricultural enterprises is increasingly determined by the performance and capacity of upstream
and down stream sectors. Agribusiness entities need to respond by improving their efficiency and
market orientation. What is required in agribusiness is access to expertise, the availability of
market information, and sufficient management skills.
Agribusiness support in it-self must be an integral part of the economic development concept,
and must be targeted towards the creation of jobs and income in rural areas. In line with a
common business concept, the guiding principle is always the market orientation of all support
services. Employment promotion and poverty alleviation in rural areas are additional goals of
promoting agribusiness. Agribusiness does not only focus on the primary production of products
but also requires additional workers. New employment opportunities are created in the
processing industry and, especially, in the service sector.
Experience shows that there are some areas that offer particularly high potential for the
successful promotion of the agribusiness sector. These interventions include:
Product quality trade
Management of agribusiness –related support services
Development and management of market infrastructure
Management of food chains
Voluntary organisations and co-operation in production and marketing
With declining employment in the South African Agricultural sector, workers leaving farms are
more likely to be able transfer their skills to value-added enterprises than to non-agriculture
manufacturing and service industries. Creating value-added jobs can improve the diversity of the
local economy, increase local incomes, capture higher profits locally, and use the local natural
resource base more efficiently and sustainably.
Tools and Instruments
Tools and instruments are defined as something that gives the ability, capacity, responsibility and
accountability to achieve the desired goals and objectives. Efficient tools and instruments in key

85
interventions are needed in the Agricultural sector, to facilitate the cost -effective delivery of
agricultural services to the community. Some of the most important instruments that can be
utilised for the capacitation of communities relates to the transfer of knowledge in terms of:
HIV/AIDS and its influence on productivity. This instrument is best implemented and utilised if the
coordination of the relevant (health) authorities with the rural development initiatives is viewed as a
priority. The influence of HIV/Aids should be anticipated / viewed as a long term.
Knowledge management is a relatively new instrument to agriculture LED. This instrument entrails
the improvement and optimal utilisation of tacit knowledge within the communities. However this
also includes the transfer of explicit knowledge to the communities within the local area. Usually this
instrument is placed under the ambit of the “human resources development programme” and is also
included under this heading in the strategic plan.
The use of appropriate agricultural technologies and techniques is a major element that requires
attention. The rational behind the utilisation of appropriate technologies and techniques will
increase the agricultural yields in addition to the protection of the environmental resources. This
increased productivity can be viewed as the relationship between the input and output ratios. The
following prerequisites need to be in place afore such activities can be successfully implemented:
o Better and more effective co-ordination between government agencies.
o More effective communication of agriculture policies and application procedures to
front line staff.
o Practical training, education and awareness building.
o Technology demonstrations.
The improved communication between all the local role-players and stakeholders are required as
the primary element that influences the implementability of the agriculture expansion initiatives.
This should also be strengthened through the formalisation of collaboration between the agriculture
and other sectoral activities.
These above mentioned approaches to the agriculture services are by no means exhausted, but provide
a clear indication of the specifics required in order to utilise LED as a vehicle to improve the “wealth
situation” of especially the rural and poor communities.
Ongoing policy developments should anticipate/consider the long-term impact of development activities
and therefore strive to continuously “update” the information database of the economic situation
within Metsimaholo. This should be done through ongoing research which should inform the
implementation strategy of the initiatives.
It is vital that poverty reduction objectives are translated into straightforward operational guidance for
programme preparation, implementation and monitoring. Therefore it must be set out how poverty
reduction approaches, at all stages of sectoral programming, might be introduced into Agriculture sector
approaches.

86
The following guidelines should be incorporated to facilitate the utilisation of agriculture development
in order to reduce poverty:
Coherent Pro–Poor Agricultural Sector Policy Framework.
o Increase agricultural productivity; lower transport costs; increase rural, employment
and food security; and integrate remote and lower potential areas into the growth
strategy.
o Use appropriate institutional structures to encourage the private sector and civil society
(e.g. decentralized services).
o Encourage the private sector and enhance market reforms (increase competition
between traders).
Public and Private sector institutions.
o Define the roles and responsibilities of the public and private sectors, taking account of
local situations.
o Build institutional capacity to manage the programme, and to provide rural services,
especially at the local level (note that once again strong linkages with the human
resource development component).
o Introduce new management practices to tackle biases against poor farmers and women.
Improve the target resources.
o Increase funding of agricultural activities.
o Target a greater proportion of funds, directly at groups of poor farmers and women.
o Increase investment in lower potential areas, and develop services for the poor and
women, to integrate them into the growth process.
Ensure the participation of the poor and women in programme preparation and services.
o Organisations representing poor farmers and women must be consulted in programme
preparation reviews.
o Donors and governments may need to encourage the development of institutions that
represent the poor and women.
o Invest in information systems to allow effective programme design and evaluation.
o Establish systems for evaluating the impact of measures on poverty.
Agriculture plays an important role in determining the livelihoods and standard of living of the poor in
the region, particularly when the poor are asked to pay for their use of basic social services. Increasing
agricultural productivity is therefore, a key area in the fight against poverty. For the poorest, whose only
asset is their labour, returns are vital.
There is an urgent need to ensure that poverty objectives are better integrated into a strategy for
growth promotion, and reflected in the programme design and operational guidelines.
Economic Infrastructure Support

87
Basic infrastructure has an impact on the socio-economic conditions of a community. The lack of
infrastructure and basic services induces a risk adverse environment. The efficiency of a
municipality in terms of infrastructure provision influences business location and investment as
well as the feasibility of tourism initiatives. Infrastructure includes access to land, buildings, road
networks, and services such as electricity, water, waste collection and sewerage services.
Infrastructure development is regarded as one of the most prominent methods of employment
creation, due to the high level of labour intensity that can be related thereto.
It is imperative that the Municipality provides sufficient basic infrastructure and services to the
residents, in order to improve the living conditions as well as to create an attractive business and
investment environment. Infrastructure development should be done in a labour intensive way,
creating employment opportunities for the local community, including women, children and the
disabled. This form of employment generation has been recommended as a successful method of
government intervention for local economic development in South Africa.
Labour intensive public works start to show results relatively quickly. Urban-clean-up programmes
for example, can be implemented within a year. Unlike income grants – which require immense
state capacity to target their intended beneficiaries while avoiding fraud – low-wage, labour
intensive public works are self-targeting. Unlike grant systems, labour intensive public works are
easily stopped when they are no longer necessary. However, the most important difference
between a universal income grant and a labour-intensive public works strategy is that the latter is
affordable (Business Report, 10 April 2003).
The main reason these public-works programmes have stayed small in South Africa is that they
lack the involvement of the private sector (and corporative state enterprises such as Telkom and
Eskom). Experience has shown that government departments cannot provide large-scale delivery
on their own.
If the Metsimaholo Local Municipality should implement a new expanded labour -intensive public
works programme, it would have a significant impact on public morale and investor confidence. It
must however take the form of a public-private partnership (PPP). Because the business
conditions in Metsimaholo are still of elementary nature, organised institutions and business
collaborations should first be established in the area.
The Metsimaholo Local Business Chamber should include a network of all formal organised
business stakeholders (farmers, industrialists, and other businessman) in the area that could
consequently start working together with the Municipality in order to implement large scale
ventures such as the public-works programme. A large-scale labour-intensive public works
strategy would bring together the municipality and business to build infrastructure, provide
training and create jobs for the unemployed.
The unemployed would gain income, marketable skills, confidence and dignity.

88
Business would gain directly from contracts won in return for use of labour -intensive techniques
and indirectly from improved infrastructure and a better investment climate (Business Report, 10
April 2003). In this way, the business community and residents will feel that government is doing
something tangible about unemployment.
D. TOURISM DEVELOPMENT
According to Gunn (1994) tourism is defined as “the temporary movement of people to
destinations outside their normal places of work and residence, the activities undertaken during
their stay in those destinations and the facilities created to cater to their needs.” The
development of the Tourism industry has been identified as one of the sectors with the most
significant opportunity for development, growth and job creation in the country.
Tourism is regarded as a cross-sectoral industry because it represents linkages with the retail,
manufacturing, transport, electricity and financial sectors. During the LED Indaba conducted in
Carletonville, tourism was identified as a sector, which must be embraced as a viable economic
development option that can contribute to the municipality’s economic characteristic .
Therefore, tourism must be recognised as a (potential) generator of wealth and jobs, if
Metsimaholo is to reach its full potential at both local and national level. Tourism has the
potential to contribute to the development of local infrastructure, creating and supporting
amenities and facilities that benefit local residents and business. Tourism potential to enhance
both the natural and built environment must be recognised.
CRITICAL SUCCESS FACTORS
In order to successfully implement tourism activities that will act as a driver of LED in the Study
Area, a number of preliminary requirements must first be considered. These requirements
determine the success and implementability of tourism and are dependant on the enhancement
of the following factors:
D. Working Partnerships
This aim of these working partnerships must be to maximise the benefit that tourism generates
and is based on forging stronger links between tourism and the other economic sectors such as
retail and transport. The working partnerships should be forged between the following entities:
Business with business (B2B)
Business with support agencies
Support agencies with each other
Communities with business and support agencies
This is vitally important as these two sectors in particular have a major influence on the tourism”
experience”, and which also benefit from tourism. It is important that the needs of both residents
and visitors are balanced throughout the development of appropriate policies and planning. The

89
decision makers should be convinced in the other sectors that their interests are interdependent
with tourism. It is also essential that the agencies, who are involved in protecting and restoring
the built environment, and managing the natural environment, implement policies that will
support the development of sustainable tourism.
E. Increased Profile Of Tourism
It must be well demonstrated that tourism is vital to the economy. It has important economic
value, and benefits both rural and urban communities. It also enhances the value of culture,
heritage and the natural environment. The entire community has a vitally important role to play if
tourism is to become more successful, for example by welcoming and helping visitors, ensuring
the maintenance of a litter-free environment, and involving visitors in local events and festivals.
Worldwide tourism is growing. There are thousands of travel options to the consumer. Therefore,
any municipality or city must market itself aggressively and consistency to ensure that it remains
at the forefront of the potential visitors mind as it jostles for attention with an increasing number
of alternatives.
The challenge should be to develop a distinctive market position that competes with many other
destinations, some of which will be offering similar experiences and packages. An understanding
of how people perceive Metsimaholo as a destination, including its natural and built environment,
culture, its quality of service and value for money.
Suitable markets must be identified and targeted using strong branding and a clear message
about what is offered. The key should be to identify the most likely customer leads, and convert
more of them into firm bookings. These markets must be developed in a manner that is suitable
for the position that the area envisages itself, in relation to the strategic market position. For a
region to position itself as a tourist leader in the key market requires:
High brand awareness-amongst target market groups.
Increased conversion from awareness to sales in target market.
Increased direct access opportunities from the target markets.
These requirements should be supported by the following guidelines that will ensure that the
place marketing of the region keeps constant alignment with the trends within the target market
as well as the industry as a whole.
Keep marketing under consistent review, adapting it as customers change and new cost -effective techniques evolve.
Identify key products; assess their scale of opportunity and the resource requirements needed to exploit the potential, in order to develop the product portfolio.
Provide support to tourism business with reference to the development of marketing skills, marketing opportunities and effective use of the internet for marketing.
Identify target markets and consumer segments that will offer best return on investment and use appropriate media to maximise return on investment.

90
Lobby as a group to increase the number of direct access routes. Undertake joint marketing with appropriate direct access transport operations. Inform
customers of their direct access options.
Additionally the success of the entire municipality is based on the following key support factors:
Successful business leadership. Enhanced product and service. Invest in people and skills. Promote sustainability and activities in an environmentally friendly manner. Promote community based approaches and capacity building. Maximise geographic comparative advantage in tourism development. The promotion of cost sharing.
F. SMME DEVELOPMENT
Small, Medium and Micro Enterprises (SMME) are recognised worldwide for their
potential to generate job opportunities, particularly when the economy is in a downward
trend. In the first part of this study, which included the assessment of the local economy,
it was found that the formal economy is simply not able to absorb all the newcomers to
the labour market in wake of the declining gold mining sector. It is furthermore highly
unlikely that this trend in the local economy will be reversed, at least not in the short to
medium term. This situation suggests strongly that SMMEs provide one of the only
possible ways to reduce the current high level of unemployment and poverty in
Metsimaholo.
In the wake of structural adjustment (due to the withdrawal of government incentives)
and comprehensive external trade liberalisation, the comprehensiveness of small and
medium enterprises has deteriorated somewhat. Obvious indicators for this lack of
competitiveness are for instance products of insufficient quality, low productivity,
outdated plants and the productivity of the entrepreneur and his staff. Therefore, SMMEs
need business development services such as information about new markets,
technologies or quality standards as well as advice and training in various fields.
Efforts that entrepreneurs may undertake themselves to remedy these deficiencies on the
enterprise level will be successful only within limits. In many countries there is no
supportive institutional environment that will assist them in their modernisation
endeavours in an efficient and competitive way. Existing services offered by private or
public providers frequently do not correspond to their needs or they are too expensive. As
SMMEs are underrepresented in established business associations and their own SMME
associations are weakly politicised, they are lacking an efficient lobbying group.

91
Therefore, the creation of an enabling institutional environment for SMMEs, including
service providers specialised on SMMEs as well as component lobbying organisations, is
an important task in SMME promotion.
This sub-section presents SMME development as a possible strategy to exploit the
potential as listed in the aforementioned sub-paragraphs. A critical prerequisite for
successful SMME development is entrepreneurship. Entrepreneurship in this regard does
not only refer to knowledge and experience in business administration, but most
importantly, to a high level of motivation, drive and work ethics.
SMME promotion interventions
Interventions need to be geared towards strengthening the performance and
competitiveness of enterprises. Target groups are medium sized business and small
business that have a sustainable potential for growth and typical interventions include:
Promotion of the sector–political dialogue between SMME representatives (e.g.
chambers, associates) and the government administration (e.g. ministries) through
capacity building on both sides and intensifying the dialogue;
Improvement of framework conditions and creation of an enabling environment
through advise to provincial departments for industry and economic affairs and other
relevant public institutions on the design of economic, legal and institutional frame
conditions for private sector;
Organisational development of SMME organisations, thus enabling them to contribute
to improved SMME competitiveness through enhanced lobbying capacity and
professional competence;
Facilitating access to business development services (BDS) through the development of
markets for services. Private and public providers need to offer specifically those
services that SMME ask for and willing to pay for. Support for such a market includes
networking, role clarification and advice to different protagonists (private service
providers, SMME promotion agencies, ministries, donors etc.).
Support of horizontal and vertical cooperation between enterprises, in particular by
using cluster and value chain approaches including advice for building up linkages
between several SMMEs and between SMMEs and large or international enterprises.
Export promotion for the SMME sector through brokering of contacts to African and
European importers and information about quality standards, market trends and
participation in fairs.
Management and business consulting on enterprise level through capacity building of
local consultants and consulting of firms including advise in order to increase efficiency

92
in all enterprise domains such as procurement, production, sales and financing as well
as special issues such as joint ventures and privatisation.
Experiences in SMMEs promotion over the last few years have shown that an
improvement in SMME competitiveness cannot be achieved solely on the level of the
individual enterprise. What is needed is an approach where interventions target different
levels simultaneously: the macro level (stability oriented and enabling economic policy),
the meso level (capacity building of private sector organisations, development of support
strategies and policies for enterprises) and the micro level (enhancing enterprise
performance and their horizontal and vertical integration into a network of linkages and
subcontracting relationships). As a consequence, today’s SMME promotion ties together
many different partners simultaneously.
Localised SMME support
The promotion, establishment and expansion of SMMEs are weighed against the establishment of larger
businesses. Larger businesses are mostly multi-locational operations. They are less dependent on their
geographic location than SMMEs and do not perceive the local level as a high-priority level of action.
They are rarely part of local economic development initiatives and usually deal directly with national
government when contributions to development are made. If a given location does not offer satisfactory
conditions, it is not rare that a large firm/factory will close down its operation and move elsewhere
rather than getting involved in the cumbersome effort of getting involved in a local dialog to negotiate
for new incentives and/or services.
The focus of this LED strategy is on SMME development because the mobility of these businesses is
much more limited. For SMMEs, the trade-off between the cost of changing location and the cost of
participating in local dialog and development efforts tends to be solved in favour of the latter. SMMEs
sometimes get actively involved in LED efforts, and they certainly are an important target group for LED
initiatives.
SMME promotion and support includes a series of core activities to which several other activities should
be added gradually. The core activities and the respective activities are as follow:
To make the service of economic promotion more transparent and more accessible to the
enterprises through enterprise visits, round tables, newsletters and intensification of public
relations.
To enforce the exchange of experiences among enterprises and to create a basis for enterprise co-
operation through the organisation of focus groups working on cross-cutting or sector specific
topics, initiation of workshops and regular meetings for new entrepreneurs or technical and
management staff of existing enterprises, creation of an internet data base to inform on services
offered and requested, on free production capacities.
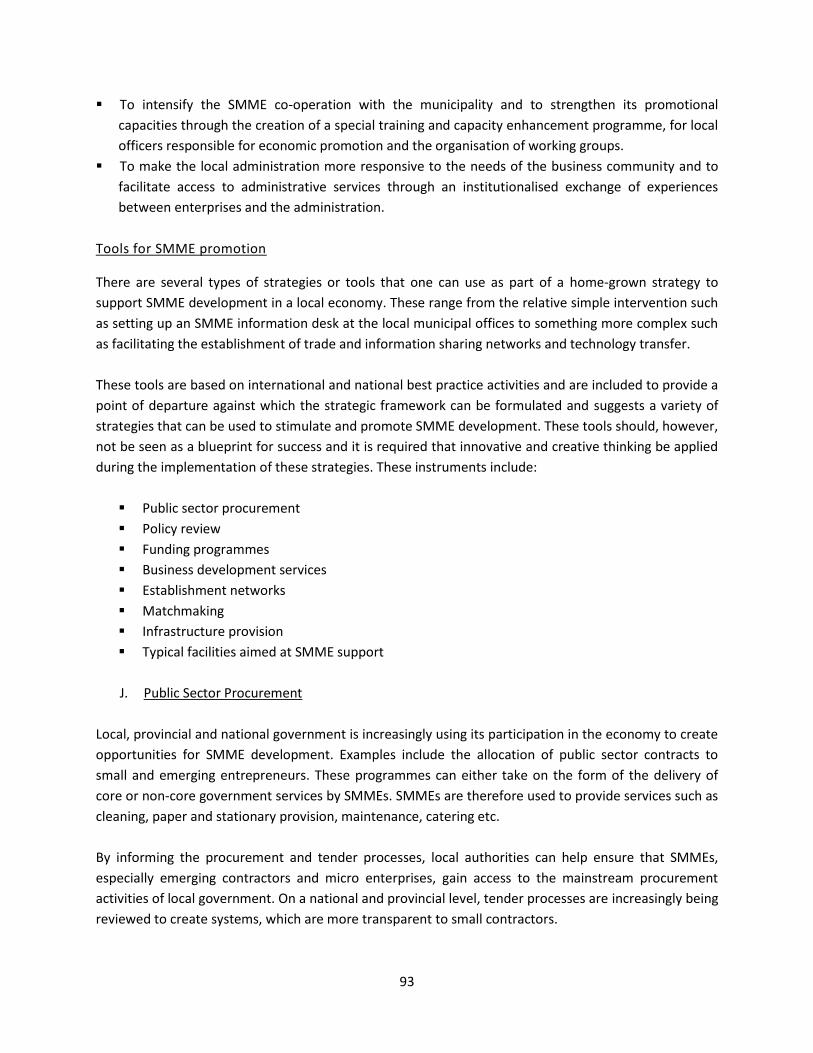
93
To intensify the SMME co-operation with the municipality and to strengthen its promotional
capacities through the creation of a special training and capacity enhancement programme, for local
officers responsible for economic promotion and the organisation of working groups.
To make the local administration more responsive to the needs of the business community and to
facilitate access to administrative services through an institutionalised exchange of experiences
between enterprises and the administration.
Tools for SMME promotion
There are several types of strategies or tools that one can use as part of a home-grown strategy to
support SMME development in a local economy. These range from the relative simple intervention such
as setting up an SMME information desk at the local municipal offices to something more complex such
as facilitating the establishment of trade and information sharing networks and technology transfer.
These tools are based on international and national best practice activities and are included to provide a
point of departure against which the strategic framework can be formulated and suggests a variety of
strategies that can be used to stimulate and promote SMME development. These tools should, however,
not be seen as a blueprint for success and it is required that innovative and creative thinking be applied
during the implementation of these strategies. These instruments include:
Public sector procurement
Policy review
Funding programmes
Business development services
Establishment networks
Matchmaking
Infrastructure provision
Typical facilities aimed at SMME support
J. Public Sector Procurement
Local, provincial and national government is increasingly using its participation in the economy to create
opportunities for SMME development. Examples include the allocation of public sector contracts to
small and emerging entrepreneurs. These programmes can either take on the form of the delivery of
core or non-core government services by SMMEs. SMMEs are therefore used to provide services such as
cleaning, paper and stationary provision, maintenance, catering etc.
By informing the procurement and tender processes, local authorities can help ensure that SMMEs,
especially emerging contractors and micro enterprises, gain access to the mainstream procurement
activities of local government. On a national and provincial level, tender processes are increasingly being
reviewed to create systems, which are more transparent to small contractors.

94
Additionally, most of these programmes are implemented alongside some sort of a support structure,
designed to ensure that SMMEs comply with quality standards, understand how to apply for the
opportunities created and can assemble the network required to deliver the qualities of products
desired. These programmes can be extremely useful in developing new markets for SMMEs and
expertise in the sector.
K. Funding
Sufficient funding is one of the instruments used to increase the ability of SMMEs to perform more
effectively in the local economy. Based on demand, access to finance is often seen as the most critical
issue in developing a successful SMME community, as insufficient funding is often one of the root causes
of the high mortality rates amongst these businesses.
It is important to remember that it is not within the local authority’s power to directly finance SMMEs.
The municipality should rather take on the role as facilitator in bringing SMMEs and funding
organisations together. Municipalities can also liaise with financial institutions and banks on behalf or
together with SMMEs that are involved in special initiatives by the municipality, such as special loan
assistance or start-up financing for SMMEs to be localised in a Local Industrial Park set up by the local
authority.
A number of financial programmes and incentives are currently available to which SMMEs can be
referred to. These programmes range from government incentives (such as through the DTI) to funding
assistance by NGOs, private sector programmes and government agencies. The banking sector also plays
an important role in the provision of finance and is increasingly looking at new ways to support the
SMME sector. The critical issue is to ensure that the variety of financial models available is successfully
used to support the SMMEs that need it.
L. Policy Review
Government often do not realise the impact that the regulations, policies and by–laws of local
authorities have on the operation of the small business sector. On a national /provincial scale, SMMEs
are often negatively influenced by a combination of:
Trade policy, such as export duties, taxes or subsidies and foreign exchange control.
Fiscal policy, i.e. government expenditure, infrastructure, the provision of government services.
Labour policies such as minimum wage levels, fringe benefits and labour codes.
Output prices, including consumer and producer prices.
Direct regulatory control such as land control, enterprise licensing, monopoly privileges.
General bureaucratic system that add to the cost of doing business.
Regulations and by-laws are also tools that local government can use to govern activities within their
areas of jurisdiction. They may be created through national and provincial legislation or through the

95
formulation of regulations based on the competencies of local authorities. These regulations involve
seemingly simple arrangement such as the placement of informal trading stalls near busy intersections
or more complex regulations such as zoning, the establishment of City Improvement Districts, building
and safety regulations or levy structures. The procedure of passing a by-law includes local authority
approval on reasonable notice and proposal of the envisaged changes for public comment. Additionally,
any new by-law that causes conflict with national or provincial legislation is invalid. Careful
consideration should therefore be given to the motivation of the proposed changes.
M. Business Development Services
Apart from the start–up and venture finance, SMMEs need assistance with their day–to-day operations.
Municipalities can play a crucial part in assisting local SMMEs in this regard by providing business
development services, in partnership with key role players that will address the specific needs of the
small business sector in terms of training, technology transfer, information and marketing. For this
reason, a Local Business Service Centre (LBSC) should be established to assist SMMEs in attaining
business skills, networking and funding through the right channels.
However, recent studies have shown that although Local Business Service Centres have been
implemented throughout the country, they have not delivered many results because of fraudulent
issues that have handicapped these ventures. These inhibiting factors could be ascribed to the
fact that funding for these centres was left in the hands of individuals, instead of a collective,
transparent body such as, for example, Local Government.
Therefore it is recommended, that, should such a venture be initiated for Metsimaholo, the LBSC
should form part of the Metsimaholo Local Municipality, so that it can be transparent and its
progress be evaluated at all times.
N. Technology Transfer
Tools that are generally used worldwide to enhance technology transfer to SMMEs include partnerships
with the universities and technology institutions, SMME Consortia and the establishment of incubators
and science parks.
Technology and tertiary institutions, can best provide applied research and development in technology
fields, perform contract research for SMMEs, conduct generic research that can be aligned with SMMEs
and provide additional consulting services such as demonstration and pilot projects, workshops on new
technologies and technical training.
SMME Consortia are usually formed in situations where SMMEs cannot afford to pay many of the
upgrading requirements needed to modernise production. This is especially true when finding technical
solutions for common problems within different sectors that increase costs for small business
operations. On the international front, many SMMEs pool their resources to form a Consortium (that

96
consist of trade unions, chambers of commerce and industry organisations) to provide the financial basis
to appoint a university or technology institution.
Incubators and science parks provide assistance to technology–intensive SMMEs through shared
services and facilities, such as administrative services, reduced rent facilities, shared laboratories and
research assistance. Technology is developed through these incubators for specific SMME sectors.
Science parks have been established with success in countries such as Japan and the United Kingdom.
O. Information
Information is one of the cornerstones of any business, whether it is information on market dynamics
and penetration, product design, technological development or client demand.
Additionally, any government department will also need up-to-date information to make informed
strategic decisions with regards to what it intends to reach with SMME development in the area. It has
been founded that relative few municipalities in the country have sufficient information available on the
SMMEs in their areas of jurisdiction. This often results in LED/SMME strategies being based on perceived
needs in the small business environment, as opposed to what local SMMEs really requires.
Linked to this is the fact that other activities need to be exposed and linked to the SMMEs. Such
availability of information supports the brokerage processes of linking opportunities and SMMEs.
P. Market And Trade Assistance
Many SMMEs experience problems in penetrating markets and consequently in developing products
that will be able to answer to consumer demands. This may be due to several factors, such as
geographical isolation, inadequate technology and lack of sufficient resources. Limited marketing
channels and know-how also contributes to great entrepreneurial ideas not reaching the right
audiences, resulting in many entrepreneurs facing failure.
A local or district municipality can act as facilitator bringing together marketing service providers and
SMMEs that need marketing assistance. The marketing intermediaries can come from the private or
NGO sectors. Access to up-to-date information is required in order to assess the feasibility of SMME
products because much effort and money is invested in developing these ideas.
A number of opportunities are furthermore created for SMMEs that want to exploit international
markets through the establishment of trade agreements between South Africa and foreign countries.
Examples of these include the African Growth and Opportunity Act (AGOA), the SA/European Union and
the SADC agreement. SMMEs need assistance in taping these benefits, as there are lists of pre-
qualifications for companies wishing to participate.
Q. Networks

97
Networks are fast becoming a key business tool for small and medium sized companies to work together
to boost their bottom line. The nature and size of networks varies considerably and depends on the local
economic and business environment, the nature of the SMMEs participating and the aims of the
network. A distinction can be drawn between two types:
Flexible manufacturing networks, where co-operative efforts by SMMEs are involved to produce a
final product or a series of products. Each small firm specialises in one part of a complex, multistage
production process and coordinates its activities through market –based exchanges with other firms.
Commercial networks, which offer SMMEs access to more rapidly growing, more profitable market
opportunities and to technology and know-how that is required in meeting the demands of such
markets. Typical programmes include low-cost –of entry franchising, programmes by larger
companies to outsource procurement of goods and services and market development initiatives that
work closely to buyers and agents to help SMMEs.
R. Infrastructure
A municipality can play a vital role in assisting local SMMEs through a dedicated and strategic business
infrastructure role–out programme that is formulated and prioritised on the basis of the needs of the
local SMMEs. Vehicles that can be most efficiently used to enable the municipality to increase
infrastructure delivery include,
The Consolidated Municipal Infrastructure Investment (CMIP) Programme
The Integrated Development Planning (IDP) Process
Municipal Service Partnership (MSP)
Other public–private sector or public sector community partnerships
The LED Fund for employment creation
Labour–intensive delivery of the infrastructure or Poverty alleviation

98