
lecture7n.pptx
39
27 September, 2011 STAT 101 -- Part VI 1 Highlight the last lecture
-
Upload
hoang-nguyen -
Category
Documents
-
view
32 -
download
5
Transcript of lecture7n.pptx
27 September, 2011 STAT 101 -- Part VI 1
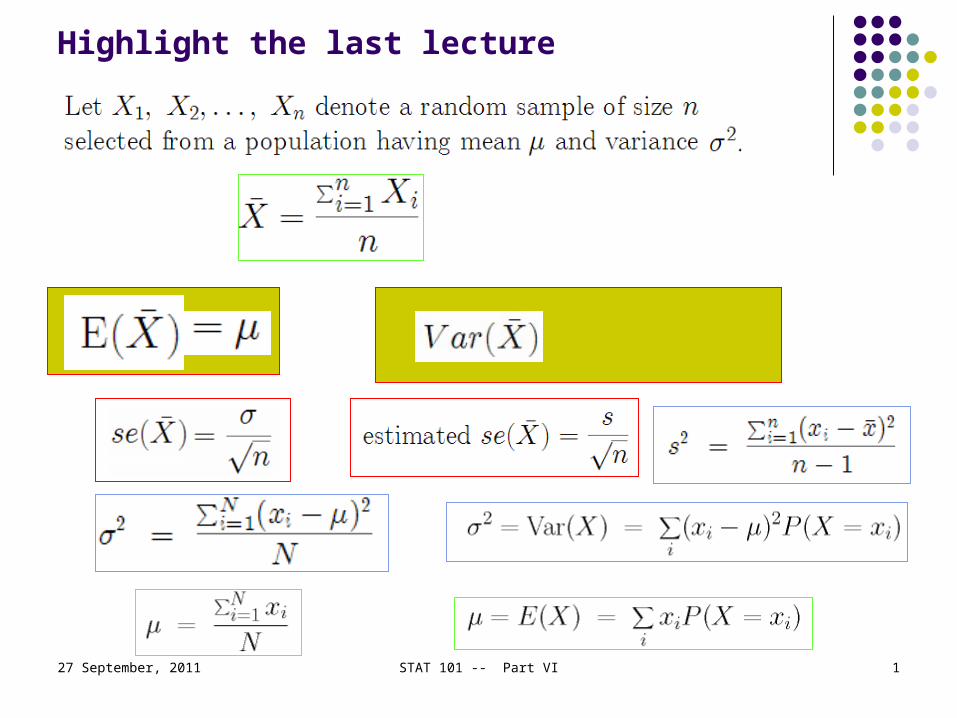
Highlight the last lecture
27 September, 2011 STAT 101 -- Part VI 2
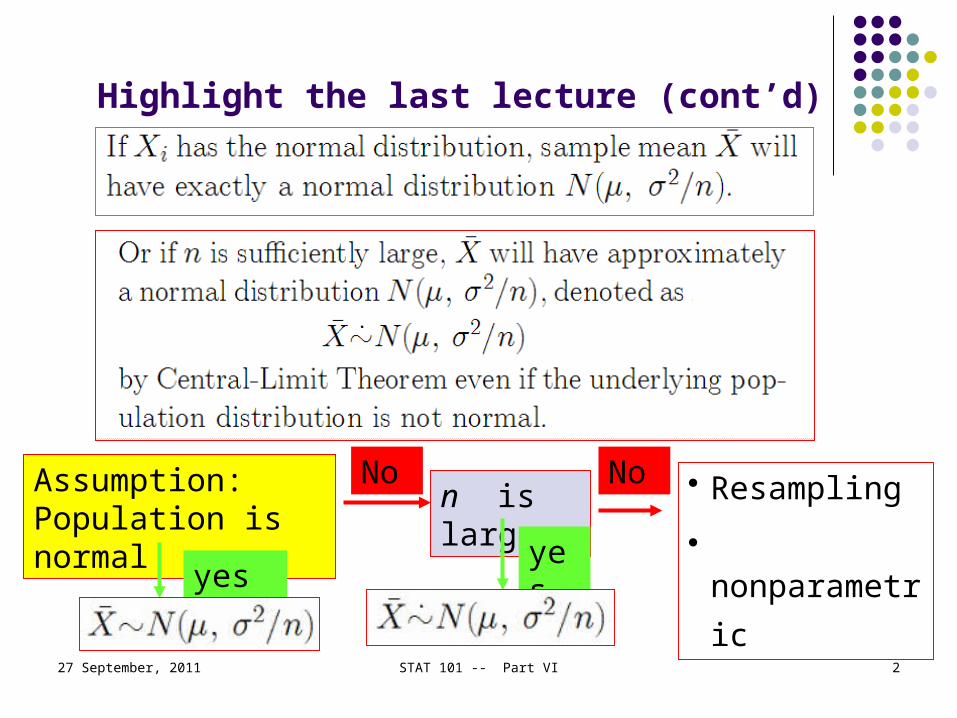
Highlight the last lecture (cont’d)
Assumption: Population is normal
n is large • Resampling
• nonparametric
yesyes
No No

27 September, 2011 STAT 101 -- Part VI 3

27 September, 2011 STAT 101 -- Part VI 4

27 September, 2011 STAT 101 -- Part VI 5

27 September, 2011 STAT 101 -- Part VII 6
VII. Confidence Intervals
Point and interval estimations ofMeans of normal distribution and non-normal distributionProportion parameter of binomial distribution
Determining sample sizeFor the meanFor the proportion

27 September, 2011 STAT 101 -- Part VII 7
Confidence interval estimation

27 September, 2011 STAT 101 -- Part VII 8
Confidence Intervals for the population mean
Assumptions: Population is normally distributed Standard deviation of population is given

27 September, 2011 STAT 101 -- Part VII 9

27 September, 2011 STAT 101 -- Part VII 10

27 September, 2011 STAT 101 -- Part VII 11
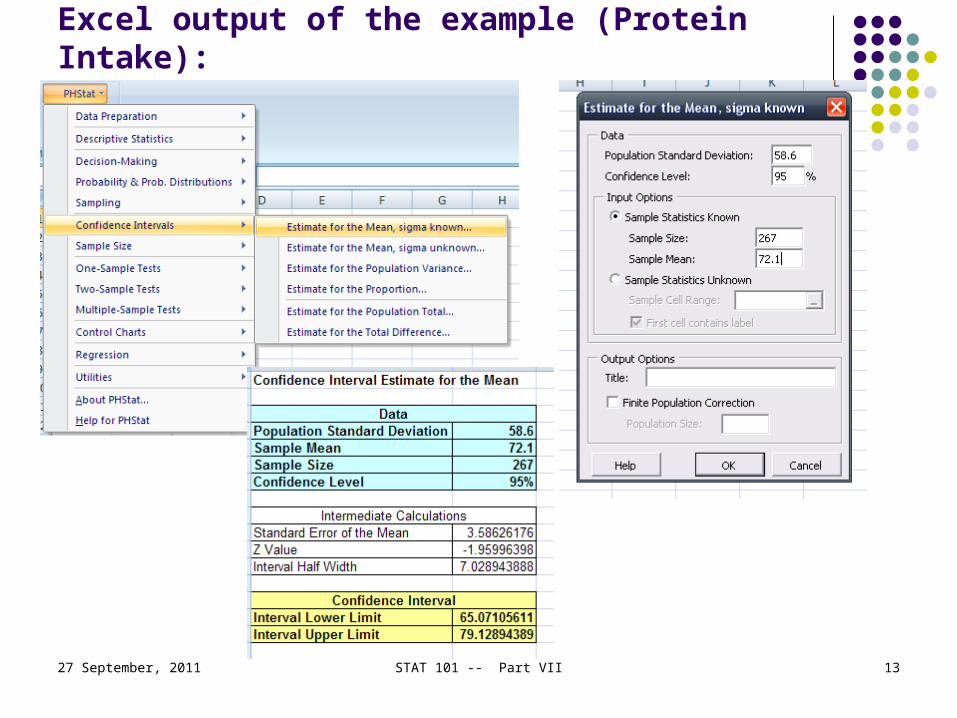
Example: protein intake Find the 95% confidence interval for the average daily
protein intake of men aged 20-25. Population standard deviation is 58.6 grams. The random sample with size 267 men aged 20-25 is
observed. The margin of error is Before collected the data from 267 men, we can say that
there are 95% chance of the random interval will include
It is noted that sample mean is still a random variable before collecting any data and we are still talking about probability.
After collecting the daily protein intake of these 267 men and calculating the sample mean of 72.1 grams.

27 September, 2011 STAT 101 -- Part VII 12
After obtained the numerical result from sampling, we can not say that the population mean falls between 65.071g and 79.129g with 95% chance.
The correct way to present the result is: The 95% confidence interval for the average
daily protein intake for men aged 20-25 is (65.071g, 79.129g)
Having determined a numerical result from one specific sample, it is no longer sensible to speak about the probability of its covering the fixed quantity
If many repeated samples with same sample size were taken from the same population and the confidence intervals were constructed, the proportion of intervals containing would be approximately 0.95.
27 September, 2011 STAT 101 -- Part VII 13
Excel output of the example (Protein Intake):

27 September, 2011 STAT 101 -- Part VII 14
Interpretation of confidence intervals
Values below true mean Values above true mean
True population mean
http://www.socr.ucla.edu/Applets.dir/ConfidenceInterval.html

27 September, 2011 STAT 101 -- Part VII 15
Confidence intervals for the mean with unknown population variance
The only assumption is the population distribution is normal. The population standard deviation is unknown. It is reasonable to estimate the population standard deviation from
the sample standard deviation.
27 September, 2011 STAT 101 -- Part VII 16
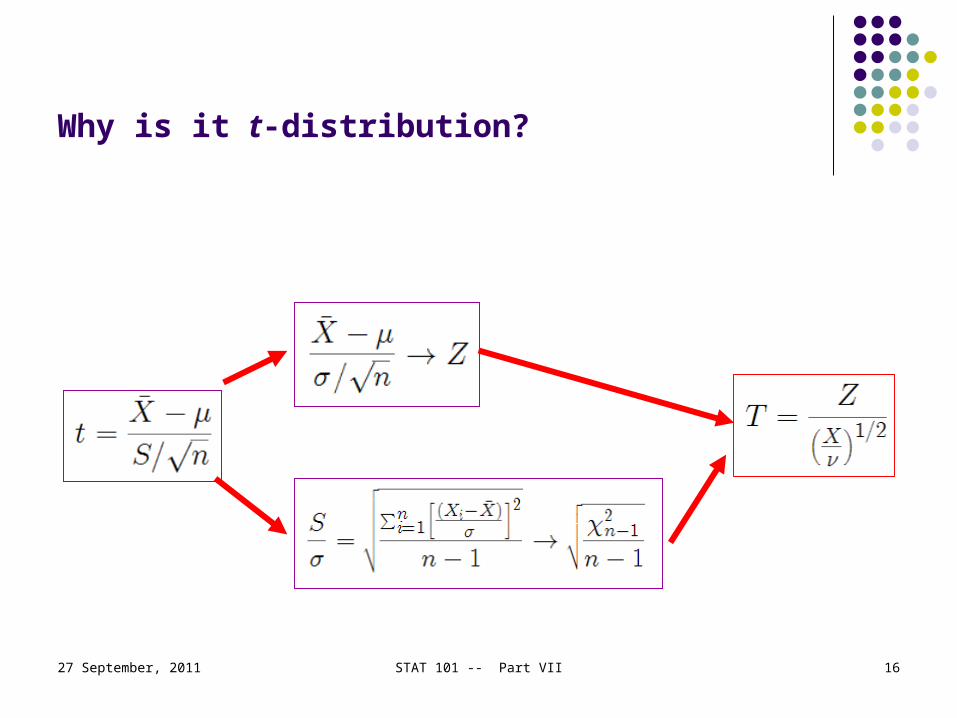
Why is it t-distribution?

27 September, 2011 STAT 101 -- Part VII 17

27 September, 2011 STAT 101 -- Part VII 18
Insurance example (cont’d)
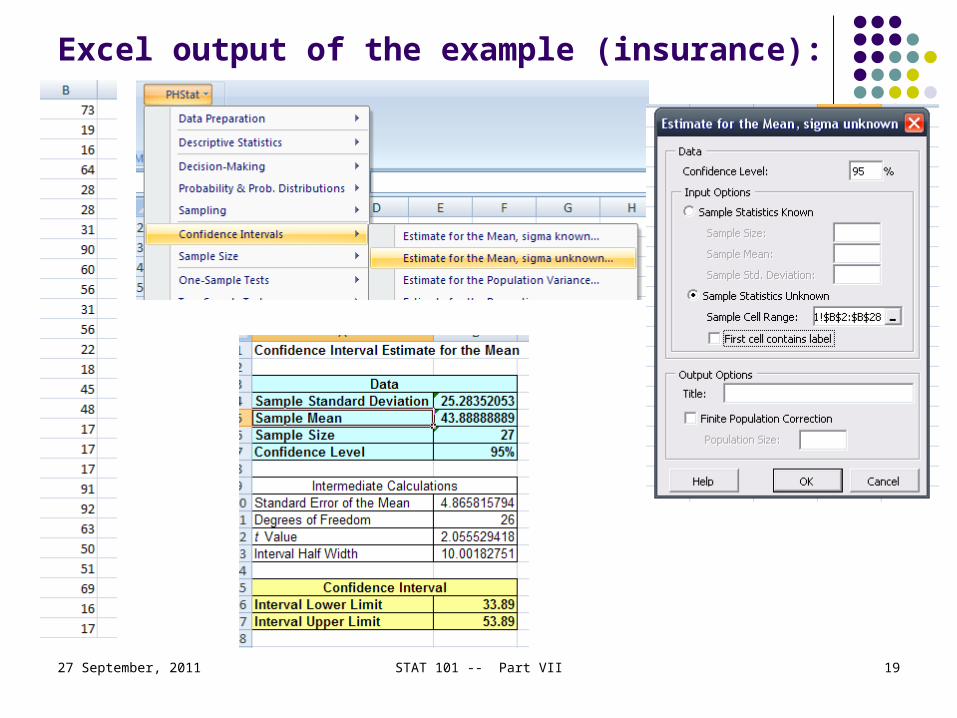
27 September, 2011 STAT 101 -- Part VII 19
Excel output of the example (insurance):

27 September, 2011 STAT 101 -- Part VII 20
Large sample size cases No assumptions of normal population distribution or the
population variance. If the sample size is sufficiently large, the Central-Limit
Theorem may be applied to guarantee that
27 September, 2011 STAT 101 -- Part VII 21
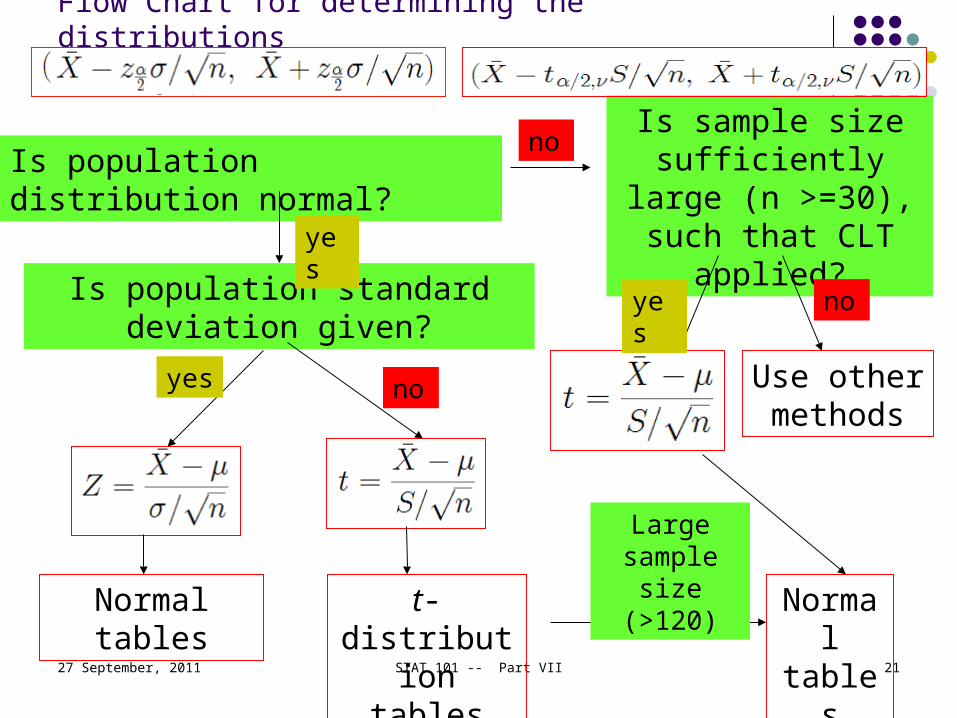
Flow Chart for determining the distributions
Is population distribution normal?
Is population standard deviation given?
Normal tables t-distribution tables
Normal tables
Large sample
size (>120)
yes
yes
no
no
Is sample size sufficiently large (n
>=30), such that CLT applied?
Use other methods
yes no
27 September, 2011 STAT 101 -- Part VII 22
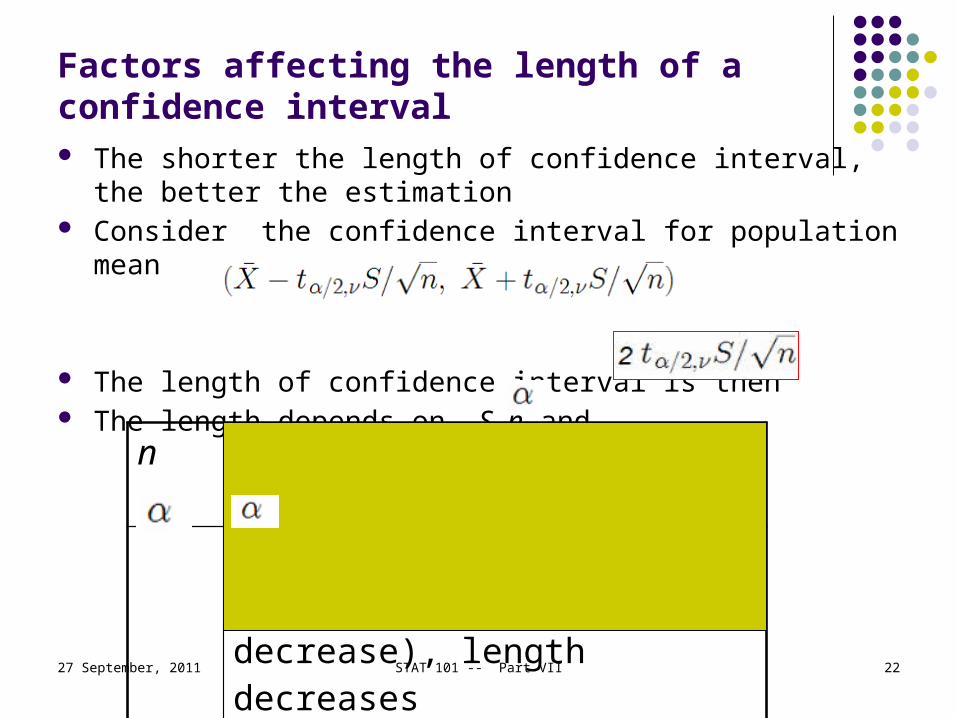
Factors affecting the length of a confidence interval The shorter the length of confidence interval, the better the
estimation Consider the confidence interval for population mean
The length of confidence interval is then The length depends on S, n and
n n increases, length decreases
increases (confidence level decrease), length decreases
S S increases, length increases

27 September, 2011 STAT 101 -- Part VII 23
Determining sample size for the mean
The required sample size can be found to reach a desired margin of error with a specified level of confidence.
The margin of error is also called sampling error
The margin of error can be interpreted as
the amount of imprecision in the estimate of the population parameter
the amount added and subtracted to the point estimate to form the confidence interval

27 September, 2011 STAT 101 -- Part VII 24
Requirements of determining sample size

27 September, 2011 STAT 101 -- Part VII 25
Numerical example A consumer group wants to estimate the mean electric bill for
the amount of July for single-family homes in a large city. Based on studies conducted in other cities, the standard
deviation is assumed to be $25. The group wants to estimate the mean bill for July to within ±
$5 with 99% confidence. What sample size is needed?

27 September, 2011 STAT 101 -- Part VII 26

27 September, 2011 STAT 101 -- Part VII 27
Estimation for the binomial distribution
Recall the common structure of the binomial distribution: A sample of n independent trials Each trial can have only two possible
outcomes which are denoted as `success’ and `failure’
The probability of a success at each trial is assumed to be constant p
The parameters of the binomial distribution are n and p
Now, assume that p is unknown and we want to use the sample proportion to estimate p

27 September, 2011 STAT 101 -- Part VII 28
Point estimation: sample proportion
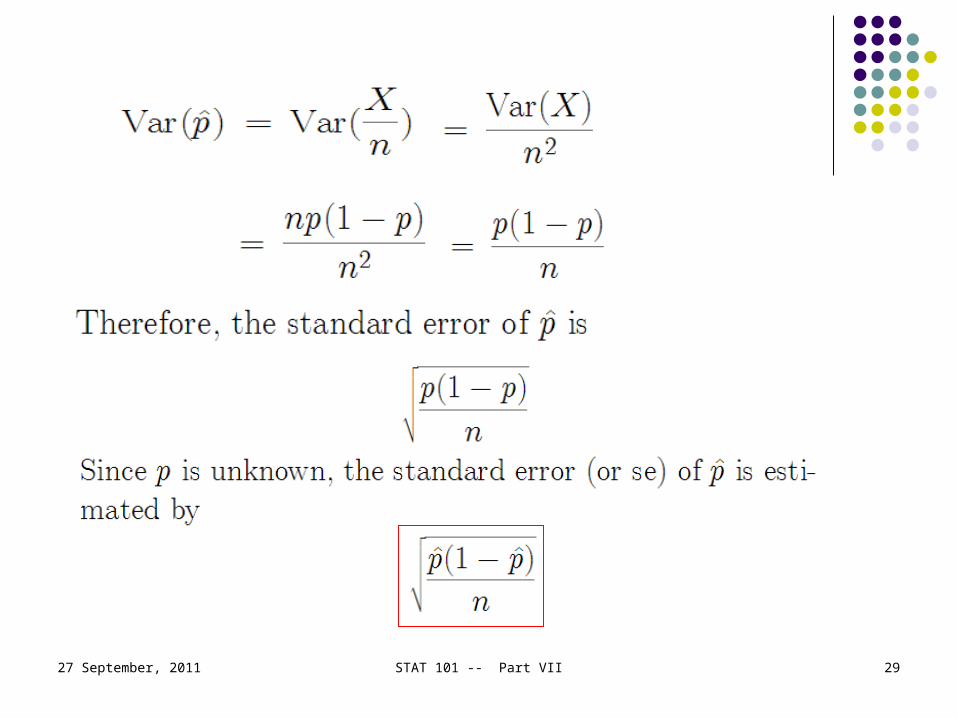
27 September, 2011 STAT 101 -- Part VII 29

27 September, 2011 STAT 101 -- Part VII 30
Sampling distribution of
Sampling distribution of sample proportion
Population
1st sample of n
3rd sample of n
kth sample of n
2nd sample of n
27 September, 2011 STAT 101 -- Part VII 31
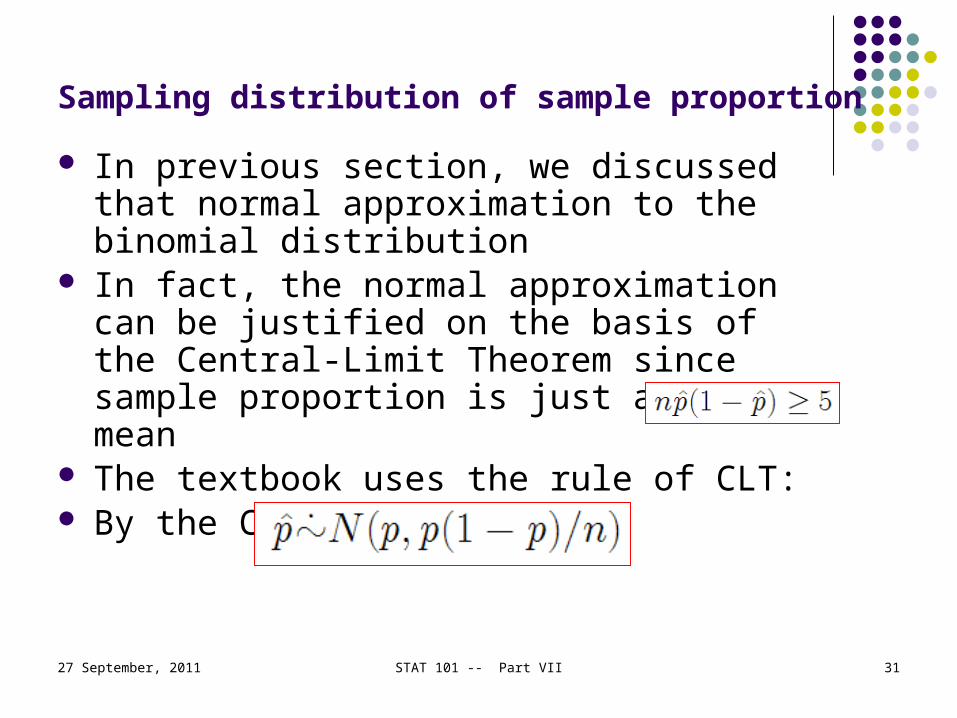
Sampling distribution of sample proportion
In previous section, we discussed that normal approximation to the binomial distribution
In fact, the normal approximation can be justified on the basis of the Central-Limit Theorem since sample proportion is just a sample mean
The textbook uses the rule of CLT: By the CLT, we get

27 September, 2011 STAT 101 -- Part VII 32

27 September, 2011 STAT 101 -- Part VII 33
Example During June and July of 2001, the European Union Executive
Commission conducted a study of 6,543 European adults. Of those surveyed, 56% said that the euro single currency would promote economic growth and 73% knew the correct date of the changeover (January 1, 2002).
Construct a 95% confidence interval estimate for the proportion of European adults who believe that the euro would promote economic growth.
Interpret the interval constructed.

27 September, 2011 STAT 101 -- Part VII 34
Excel output of the example (Euro)

27 September, 2011 STAT 101 -- Part VII 35
Requirements of determining sample size for the proportion

27 September, 2011 STAT 101 -- Part VII 36
Numerical example: A study of 658 CEOs conducted by the Conference Board reported
that 250 stated that their company’s greatest concern was sustained and steady top-line growth (“CEOs’ Greatest Concerns,” USA Today Snapshots, May 8, 2006, P1D).
To conduct a follow-up study to estimate the population proportion of CEOs whose greatest concern was sustained and steady top-line growth to within ±0.01 with 95% confidence, how many CEOs would you survey?

27 September, 2011 STAT 101 -- Part VII 37
Useful and interesting websites
27 September, 2011 STAT 101 -- Part VII 38
http://www.socr.ucla.edu/Applets.dir/ConfidenceInterval.html Confidence Intervals
simulations
http://en.wikipedia.org/wiki/Confidence_intervalConfidence Intervals information

27 September, 2011 STAT 101 -- Part VII 39
10 15 20 25 30 35 40
G2
G1
Assignment 2: Box-and-Whisker Plot
Stem-and-Leaf Display
Stem unit: 1
Statistics 12 0Sample Size 94 13Mean 37.08511 14Median 40 15Std. Deviation 4.760183 16Minimum 12 17Maximum 40 18
1920212223 0242526 0 027 028 0 02930 031 0 0 032 0 033 0 034 0 0 0 035 0 0 0 0 036 0 0 0 037 0 0 0 0 0 0 038 0 0 0 039 0 0 0
40 0 0 0 0 0 0 0 0 0 0 0 0 0 0 0 0 0 0 0 0 0 0 0 0 0 0 0 0 0 0 0 0 0 0 0 0 0 0 0 0 0 0 0 0 0 0 0 0 0 0 0 0


