Lecture Three: "MALDI-TOF MS, Up Close, and Personal Review of principles Delayed Extraction...
66
Lecture Three: "MALDI-TOF MS, Up Close, and Personal • Review of principles • Delayed Extraction • Reflector / reflectron • Post-source Decay (PSD)
-
Upload
barrie-mason -
Category
Documents
-
view
218 -
download
2
Transcript of Lecture Three: "MALDI-TOF MS, Up Close, and Personal Review of principles Delayed Extraction...
Lecture Three: "MALDI-TOF MS, Up Close, and Personal
• Review of principles
• Delayed Extraction
• Reflector / reflectron
• Post-source Decay (PSD)

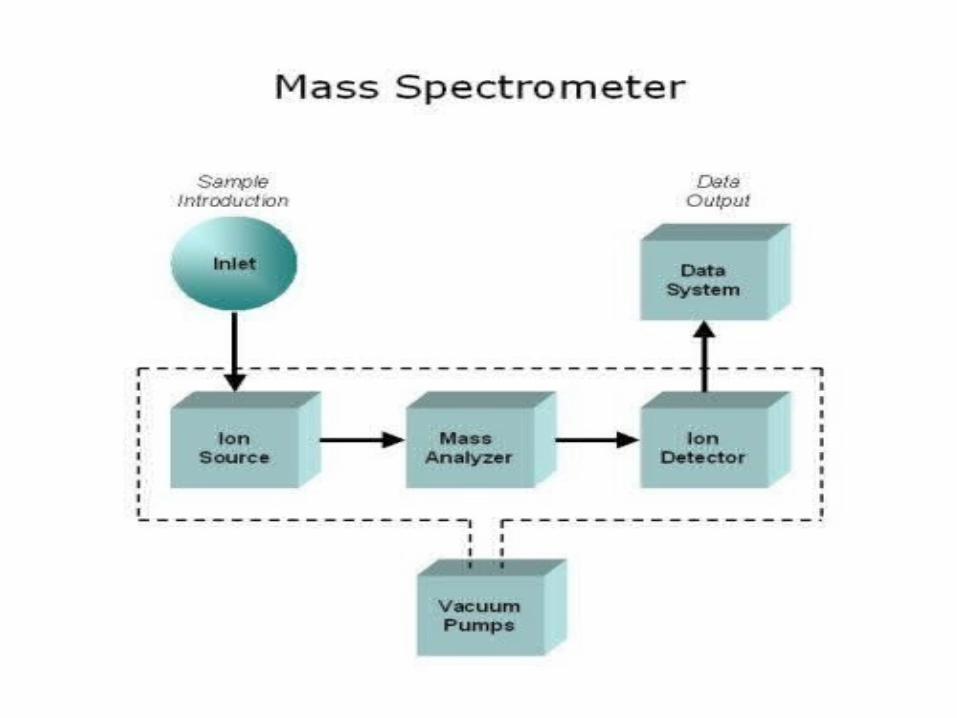
Mass Spec vocabulary• Generic mass spectrometer
• Ions & isotopes
• Mass: – m/z– monoisotopic mass– average mass– peak centroid
• Resolution

Ions
• Only ions are detected in MS
• For ionization techniques that are typically used for biological molecules, ions are generated via the ejection or capture of a proton.
• The mass of a proton is ~1 AMU; the charge of a proton is +1
• Ionic mass [MH]+1 versus molecular mass(subtract ~1 from raw data)

Peaks • A peak represents a packet of peptide ions hitting the detector.
• The distribution of ions’ flight times creates a rapid rise, and then fall, of current from the detector (y-axis).
• This current is captured digitally.
• Base Peak (BP): the Base Peak (BP): the strongest peak in the strongest peak in the spectrumspectrum
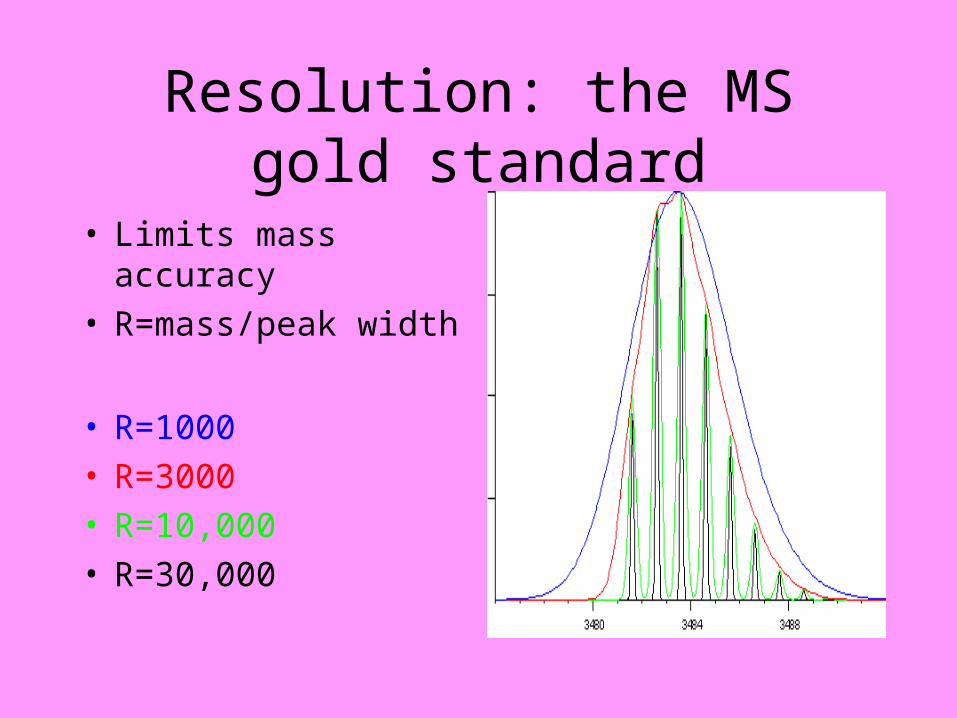
Resolution: the MS gold standard
• Limits mass accuracy• R=mass/peak width
• R=1000• R=3000• R=10,000• R=30,000

Measuring Resolution• Analyte mass divided by Full peak Width,
as measured at one-Half peak's Maximum height (FWHM)
• Industry standard, despite being somewhat arbitrary
• Alternatively, the DE-PRO can resolve analytes with a difference of 1 part per thousand (linear mode)…
…or a difference of 1 part per 6 thousand (reflector mode).

monoisotopic mass, average mass,peak centroid
high-resolution spectrum with isotopes resolved
low-resolution spectrum with unresolved “isotopic envelope”

Mass versus m / z
• Mass divided by charge
• +1 ions, +2 ions, +3 ions,… +20…+30.
• "twice the charge" behaves like "half the size"

Isotopes• For peptide-sized
molecules, most mass spec’s can resolve (n) versus (n +1 AMU).
• The result is that a single peptide actually yields a series peaks differing by one AMU.


Calibration and mass error
• MALDI-TOF’s must be rigorously calibrated, due to TOF variance across the face of the probe plate.
• Other MS’s need less frequent calibration.
• You will always have error– error as a pitfall– error as a tool

Drift time allows mass determination because:
drift time~velocity~ acceleration~mass.
The measurement is calibrated by co-analysis of standards whose masses are known.

TOF ~ m / z
549.3439617.4088
822.4886845.5043869.4992916.5234947.52221036.5981053.6291072.6031101.6211117.6281355.7561426.8661438.8671440.831
365.0 760.6 1156.2 1551.8 1947.4 2343.0
Mass (m/z)
0
4.5E+4
0
10
20
30
40
50
60
70
80
90
100
% Intensity
Spec #1 MC[BP = 1053.6, 44590]1053.6285
656.1051
869.4992
1117.6282
1550.87361072.6033 1355.7562549.3439 822.4886
1426.8657 1690.9995617.4088
1566.8917
916.5234 1036.59751890.0891
591.3327 741.4249 1569.9111893.4636585.3485 1075.62562008.27261443.80271278.6373679.4092537.3699 1088.6108919.5099 1674.6634800.4719 1436.7851 1893.11101252.6669 2033.17691003.8684 1625.0525 2185.28701432.1174 1856.6127527.2609

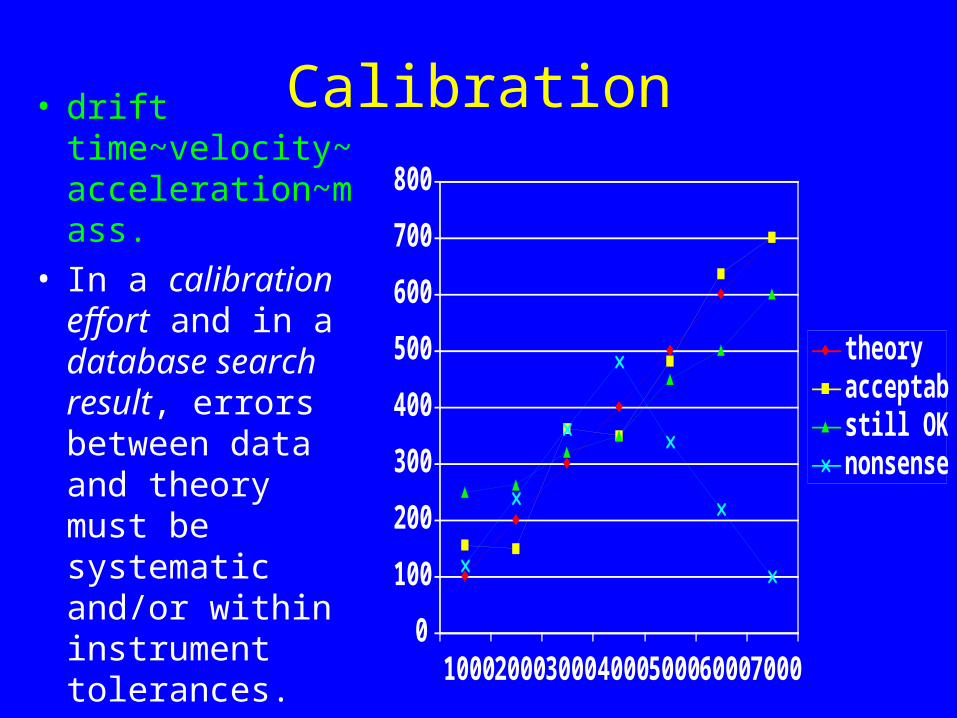
Calibration• drift
time~velocity~ acceleration~mass.
• The relationship between TOF and mass can be calibrated using standards with known masses.
• …or "default" estimates. 0
1000
2000
3000
4000
5000
6000
7000
100 200 300 400 500 600

Calibrations must follow the laws of physics
• drift time~velocity~ acceleration~mass.
• This relationship is linear, and major departures are not physically possible.
• NONSENSE
0
500
1000
1500
2000
2500
3000
3500
4000
4500
100 200 300 400 500 600 700

Calibration• drift time~velocity~ acceleration~mass.
• In a calibration effort and in a database search result, errors between data and theory must be systematic and/or within instrument tolerances.
0
100
200
300
400
500
600
700
800
1000 2000 3000 4000 5000 6000 7000
theoryacceptablestill OKnonsense

Calibration and Mass Error• In PMF d-base search results, differences between
theoretical mass and experimental mass arise from two causes:– Calibration error
– An invalid, coincidental match between your data and the theoretical protein
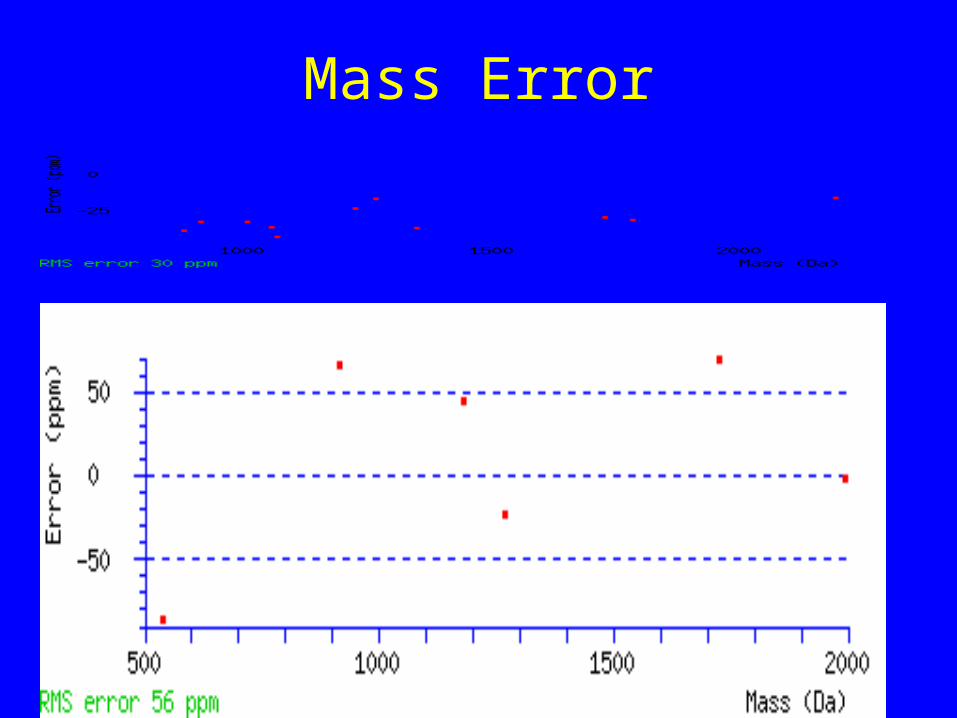
Mass Error
Calibration• drift time~velocity~ acceleration~mass.
• In a calibration effort and in a database search result, errors between data and theory must be systematic and/or within instrument tolerances.
0
100
200
300
400
500
600
700
800
1000 2000 3000 4000 5000 6000 7000
theoryacceptablestill OKnonsense

Fractional Mass as a tool• Although 12C is 12.0000 AMU, other atoms have a
decimal component which is not zero-a fractional mass.
• This fractional mass contributes to peptide mass in a consistent manner: ~ 0.5 Da per kDa.
• This consistent trend can be used to assess calibrations: if the FM is wrong, the calibration is suspect.
• This trend is a powerful way to ID artifacts in peak lists (matrix, de-isotoping errors, noise). powefu


Lecture Three: "MALDI-TOF MS, Up Close, and Personal
• Review of principles
• Delayed Extraction
• Reflector / reflectron
• Post-source Decay (PSD)


Practical MALDI considerations
• You need crystals of peptide:matrix.
• You’ll have matrix noise, especially:– When signal is low;– In the low-mass range
• Ionization is a competitive process:– minimal matrix, salt, trypsin


The problem:
• The desorption process imparts intitial velocities to analyte molecules (independent of, and prior to, the accelerating voltage).
• These initial velocities are not uniform; they have a significantly wide range.
• These non-uniform initial velocities are significant and affect TOF.
• The result is broad TOF peaks of analytes with identical masses (poor resolution).

The solution:
• Exploit the initial velocities by delaying the “extraction” (the application of the accelerating voltage).
• Delay allows the initial velocities to be translated into distance from the plate.
• When the plate is charged, this distance will impact the time spent in the accelerating field.
• Time spent in the accelerating field will impact the magnitude of acceleration (and thus, velocity/TOF).

The skate park analogy:
Identical twins on skate boardsHave the same mass...

…but the green skater cheats; he hits the board running, and thushas a greater initial velocity...
“Go!”

…which will allow him to pull ahead of his twin, despite gravity’s equal acceleration of both skaters...
“And they’re off…”

…thus, despite their equal masses, the skaters will not hit the finish line (the “detector”) at the same time.

The solution...
(Again, our identical twins have the same mass but different initial velocities…)
“Go!”

Use a slight delay to translate the initial velocity into distance before applying the
acceleration...
And they’re off!
(No “slope” = no electrostatic field applied to accelerate the ions.)

…then apply the accelerating field. The purple skater will experience more acceleration than the green skater.

This greater acceleration of the formerly slow ion results in a greater velocity during the time of flight...

…allowing the purple skater to catch up...

…and the two skaters of equal mass reach the finish line (the detector) simultaneously, despite having different initial velocities.
We have focused the arrival of our twinanalytes at the detector.

One last twist: grid voltage

We break the accelerating voltage into two slopes using the grid. This gives us more control in our manipulation of time lag focusing.
Delay time and Grid voltage are interdependent parameters.

Lecture Three: "MALDI-TOF MS, Up Close, and Personal
• Review of principles
• Delayed Extraction
• Reflector / reflectron
• Post-source Decay (PSD)

The reflector is an “ion mirror” that redirects the vector of ion
flight.


Reflectors dramatically increase resolution...
• …and by creating a slightly longer flight path (greater separation between peaks)…
• …by focusing the arrival of ions having the same mass, but slightly different velocities (sharper, narrower peaks.


MALDI-TOF Theory-overview
• Our instrument
• General theory of MALDI-TOF
• Delayed Extraction
• Reflector
• Post-source decay (PSD)

Post Source Decay• PSD is a non-specific cleavage tool that can
be used to generate fingerprints of individual peptides.
• Referred to as an “MS/MS” technique because ions are re-accelerated via the reflector.)
• CID and CAF can be used to facilitate decay.

Peptides decay (break) during flight.


Breakage generates characteristic products (and nomenclature).

The masses of daughter ions can be determined.
• TOF ~acceleration~mass
• First acceleration: from the source
• Second acceleration: reflection in the mirror.

Only ions with a specific TOF (the parent ion and its daughters) are allowed to enter the ion mirror.
• Too many analytes!
• A specific peak mass range is chosen by the operator.
• “Timed ion selector” (Bradbury-Neilson gate)

Problem: daughters don’t arrive on time
• No single reflector voltage (“mirror ratio” relative to accelerating voltage gradient) will properly focus all daughter ions.
• Although all fragments from a single parent have the same velocity...
light daughter ions have less energy, and will be reflected too easily.
heavy daughter ions have more energy, and may pass through the ion mirror.

The solution:
• Use a slightly lower “mirror ratio” (reflector voltage) for each daughter size range.
• “Mirror ratio” is the reflector’s voltage relative to the accelerating field.

At mirror ratio 1.00...
Parent MH+ (1000 Da ) is properly focused.Daughter AH+ (700 Da) is poorly focused.Daughter BH+ (300 Da) is poorly focused.

At mirror ratio 0.7 (a shallower voltage gradient)...
Parent MH+ (1000 Da) is not reflected.Daughter AH+ (700 Da) is properly focused.Daughter BH+ (300 Da) is poorly focused.
At mirror ratio 0.3 (an even shallower voltage gradient)...
Parent MH+ (1000 Da) is not reflected.Daughter AH+ (700 Da) is not reflected.Daughter BH+ (300 Da) is properly focused.

The result is several “mini-spectra” which are “stitched” together to
yield a composite spectrum.

In the composite spectrum...
• The heaviest peak represents the parent (this intense peak may need to be cropped off for display purposes).
• Other peaks represent decay products.

Uses of PSD
• Confirmation tool
• Can be used for searching.
• Analysis of labile post-translational modifications.
• CAF
• Fragmentation of organic.

Limitations
• Efficiency of breakage
• Mass accuracy
• Our manufacturer: – no automation=tedious
– Their corporate investments focused on MS/MS

End of Lecture Three:
• Questions?
• Next up: "Bigger, Better, Faster, Stronger: the Cutting Edge"