
Lecture Outline Digital Elevation Model (DEM) Processing 3...
17
Advanced RS; Honda Kiyoshi; 2. DEM 2 Digital Elevation Model (DEM) Processing Dr. HONDA Kiyoshi [email protected] Space Technology Applications and Research, School of Advanced Technologies Asian Institute of Technology (AIT), Bangkok, Thailand Advanced RS; Honda Kiyoshi; 2. DEM 3 Introduction Digital Elevation Models or DEMs are increasingly becoming the focus of attention within the larger realm of digital topographic data due to the fundamental nature of the data, and knowledge to the data they represent. The precision of DEM in simulating the true terrestrial parameters of elevation, slope and aspect improved significantly the quality and caliber of knowledge in numerous applications in earth, environmental and engineering sciences. Researches/applications where quality topographic data are needed benefited so much on the data that DEMs have provided in the past, and still, in the future as DEM accuracy and acquisition techniques are further improved, and become cheaply available for the scientific and engineering community. Advanced RS; Honda Kiyoshi; 2. DEM 4 Lecture Outline 1. Overview of DEM Why DEM is important DEM Applications Structure of DEM How to produce DEM ASTER DEM 2. DEM Processing Removing sinks Calculation of slope Slope direction (Aspect) Advanced RS; Honda Kiyoshi; 2. DEM 5 Lecture Outline Grid/Flow Accumulation Stream Order 3. Application to flood Runoff models, Lumped, Distributed Unit hydrograph and its applications Rationale Approach for peak runoff rate Curve Number (CN) Method for runoff volume 4. Discussions Advanced RS; Honda Kiyoshi; 2. DEM 6 1. Overview of DEM Advanced RS; Honda Kiyoshi; 2. DEM 7 What is a DEM? A DEM provides a digital representation of a portion of the earth’s surface terrain over a two dimensional surface (UNEP/GRID) A DEM is an ordered array of numbers that represents the spatial distribution of elevations above some arbitrary datums in the landscape (Meijerink et al., 1994) A DEM is a digital file consisting of terrain elevations for ground positions at regularly spaced horizontal intervals (USGS definition) Keyword: only elevation data
Transcript of Lecture Outline Digital Elevation Model (DEM) Processing 3...

1
Advanced RS; Honda Kiyoshi; 2. DEM
2
Digital Elevation Model (DEM)Processing
Dr. HONDA [email protected]
Space Technology Applications and Research, School of Advanced TechnologiesAsian Institute of Technology (AIT), Bangkok, Thailand
Advanced RS; Honda Kiyoshi; 2. DEM
3
Introduction
Digital Elevation Models or DEMs are increasingly becoming the focus of attention within the larger realm of digital topographic data due to the fundamental nature of the data, and knowledge to the data they represent. The precision of DEM in simulating the true terrestrial parameters of elevation, slope and aspect improved significantly the quality and caliber of knowledge in numerous applications in earth, environmental and engineering sciences.
Researches/applications where quality topographic data are needed benefited so much on the data that DEMs have provided in the past, and still, in the future as DEM accuracy and acquisition techniques are further improved, and become cheaply available for the scientific and engineering community.
Advanced RS; Honda Kiyoshi; 2. DEM
4
Lecture Outline
1. Overview of DEMWhy DEM is importantDEM ApplicationsStructure of DEMHow to produce DEMASTER DEM
2. DEM ProcessingRemoving sinksCalculation of slopeSlope direction (Aspect)
Advanced RS; Honda Kiyoshi; 2. DEM
5
Lecture Outline
Grid/Flow AccumulationStream Order
3. Application to floodRunoff models, Lumped, DistributedUnit hydrograph and its applicationsRationale Approach for peak runoff rateCurve Number (CN) Method for runoff volume
4. Discussions
Advanced RS; Honda Kiyoshi; 2. DEM
6
1. Overview of DEM
Advanced RS; Honda Kiyoshi; 2. DEM
7
What is a DEM?
A DEM provides a digital representation of a portion of the earth’s surface terrain over a two dimensional surface (UNEP/GRID)
A DEM is an ordered array of numbers that represents the spatial distribution of elevations above some arbitrary datums in the landscape (Meijerink et al., 1994)
A DEM is a digital file consisting of terrain elevations for ground positions at regularly spaced horizontal intervals (USGS definition)
Keyword: only elevation data
2
Advanced RS; Honda Kiyoshi; 2. DEM
8
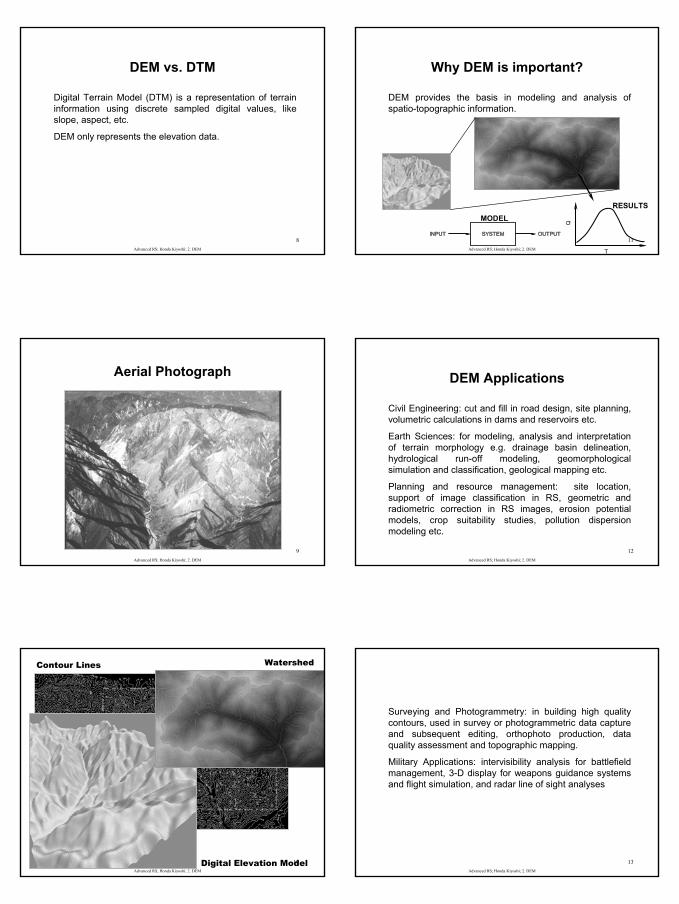
DEM vs. DTM
Digital Terrain Model (DTM) is a representation of terrain information using discrete sampled digital values, like slope, aspect, etc.
DEM only represents the elevation data.
Advanced RS; Honda Kiyoshi; 2. DEM
9
Aerial Photograph
Advanced RS; Honda Kiyoshi; 2. DEM
10
Sample of DEM
Contour Lines
Digital Elevation Model
Watershed
Advanced RS; Honda Kiyoshi; 2. DEM
11
Why DEM is important?
DEM provides the basis in modeling and analysis of spatio-topographic information.
INPUTINPUT OUTPUTOUTPUTSYSTEMSYSTEMINPUTINPUT OUTPUTOUTPUTSYSTEMSYSTEM
Q
T
MODELRESULTS
Advanced RS; Honda Kiyoshi; 2. DEM
12
DEM Applications
Civil Engineering: cut and fill in road design, site planning, volumetric calculations in dams and reservoirs etc.
Earth Sciences: for modeling, analysis and interpretation of terrain morphology e.g. drainage basin delineation, hydrological run-off modeling, geomorphologicalsimulation and classification, geological mapping etc.
Planning and resource management: site location, support of image classification in RS, geometric and radiometric correction in RS images, erosion potential models, crop suitability studies, pollution dispersion modeling etc.
Advanced RS; Honda Kiyoshi; 2. DEM
13
Surveying and Photogrammetry: in building high quality contours, used in survey or photogrammetric data capture and subsequent editing, orthophoto production, data quality assessment and topographic mapping.
Military Applications: intervisibility analysis for battlefield management, 3-D display for weapons guidance systems and flight simulation, and radar line of sight analyses
3
Advanced RS; Honda Kiyoshi; 2. DEM
14
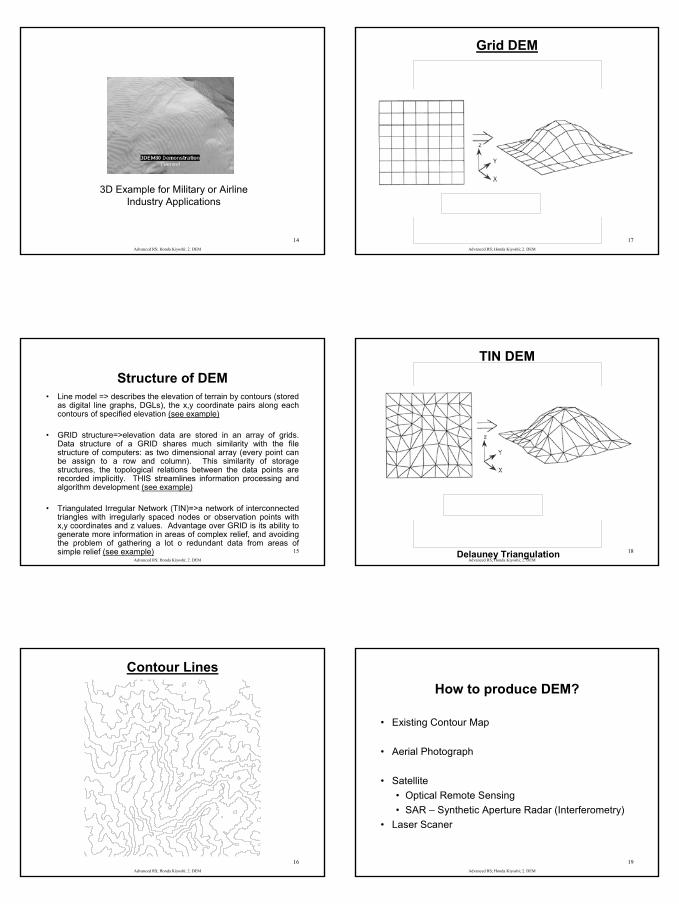
3D Example for Military or Airline Industry Applications
Advanced RS; Honda Kiyoshi; 2. DEM
15
• Line model => describes the elevation of terrain by contours (stored as digital line graphs, DGLs), the x,y coordinate pairs along each contours of specified elevation (see example)
• GRID structure=>elevation data are stored in an array of grids. Data structure of a GRID shares much similarity with the file structure of computers: as two dimensional array (every point can be assign to a row and column). This similarity of storage structures, the topological relations between the data points are recorded implicitly. THIS streamlines information processing and algorithm development (see example)
• Triangulated Irregular Network (TIN)=>a network of interconnected triangles with irregularly spaced nodes or observation points with x,y coordinates and z values. Advantage over GRID is its ability to generate more information in areas of complex relief, and avoiding the problem of gathering a lot o redundant data from areas of simple relief (see example)
Structure of DEM
Advanced RS; Honda Kiyoshi; 2. DEM
16
Contour Lines
Advanced RS; Honda Kiyoshi; 2. DEM
17
Grid DEM
Advanced RS; Honda Kiyoshi; 2. DEM
18
TIN DEM
Delauney Triangulation
Advanced RS; Honda Kiyoshi; 2. DEM
19
How to produce DEM?
• Existing Contour Map
• Aerial Photograph
• Satellite• Optical Remote Sensing• SAR – Synthetic Aperture Radar (Interferometry)
• Laser Scaner
4
Advanced RS; Honda Kiyoshi; 2. DEM
20
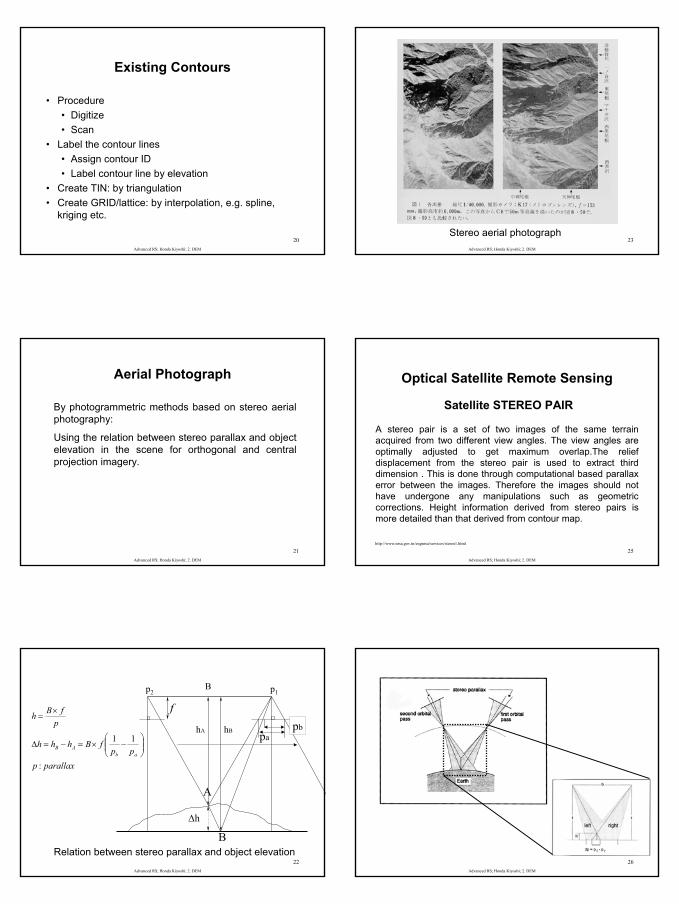
Existing Contours
• Procedure• Digitize• Scan
• Label the contour lines• Assign contour ID• Label contour line by elevation
• Create TIN: by triangulation• Create GRID/lattice: by interpolation, e.g. spline,
kriging etc.
Advanced RS; Honda Kiyoshi; 2. DEM
21
Aerial Photograph
By photogrammetric methods based on stereo aerial photography:
Using the relation between stereo parallax and object elevation in the scene for orthogonal and central projection imagery.
Advanced RS; Honda Kiyoshi; 2. DEM
22Relation between stereo parallax and object elevation
B
hB
h∆
p1p2
A
B
papbhA
f
parallaxppp
fBhhh
pfBh
abAB
:
11
−×=−=∆
×=
Advanced RS; Honda Kiyoshi; 2. DEM
23Stereo aerial photograph
Advanced RS; Honda Kiyoshi; 2. DEM
25
Optical Satellite Remote Sensing
Satellite STEREO PAIR
A stereo pair is a set of two images of the same terrain acquired from two different view angles. The view angles are optimally adjusted to get maximum overlap.The relief displacement from the stereo pair is used to extract third dimension . This is done through computational based parallax error between the images. Therefore the images should not have undergone any manipulations such as geometric corrections. Height information derived from stereo pairs is more detailed than that derived from contour map.
http://www.nrsa.gov.in/engnrsa/services/stereo1.html
Advanced RS; Honda Kiyoshi; 2. DEM
26
5
Advanced RS; Honda Kiyoshi; 2. DEM
27http://www.nrsa.gov.in/engnrsa/services/stereo1.html
Advanced RS; Honda Kiyoshi; 2. DEM
28
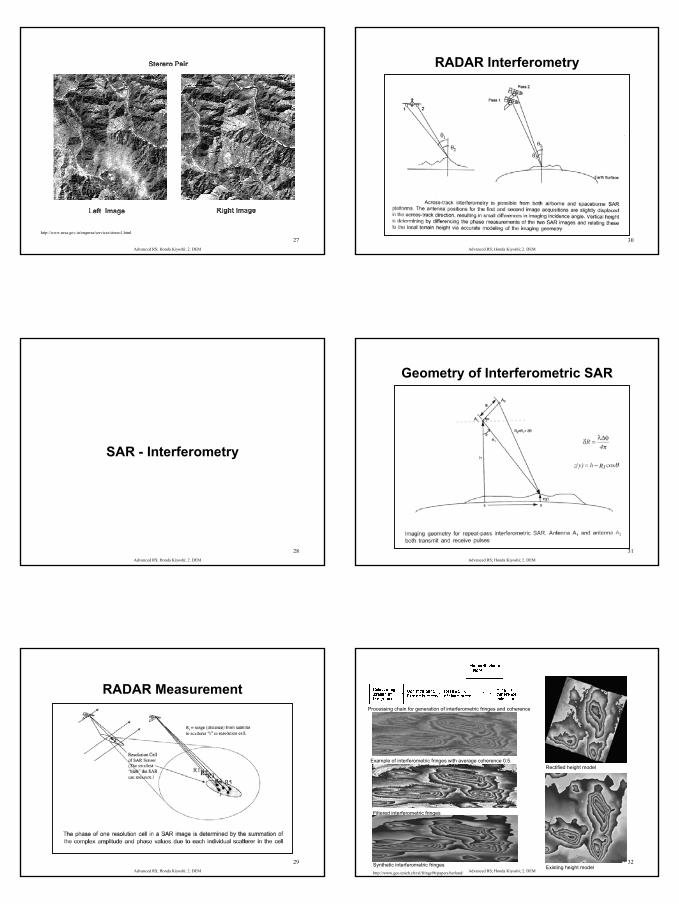
SAR - Interferometry
Advanced RS; Honda Kiyoshi; 2. DEM
29
RADAR Measurement
Advanced RS; Honda Kiyoshi; 2. DEM
30
RADAR Interferometry
Advanced RS; Honda Kiyoshi; 2. DEM
31
Geometry of Interferometric SAR
Advanced RS; Honda Kiyoshi; 2. DEM
32
Processing chain for generation of interferometric fringes and coherence
Example of interferometric fringes with average coherence 0.5.
Filtered interferometric fringes
Synthetic interferometric fringes
Rectified height model
Existing height model http://www.geo.unizh.ch/rsl/fringe96/papers/herland/
6
Advanced RS; Honda Kiyoshi; 2. DEM
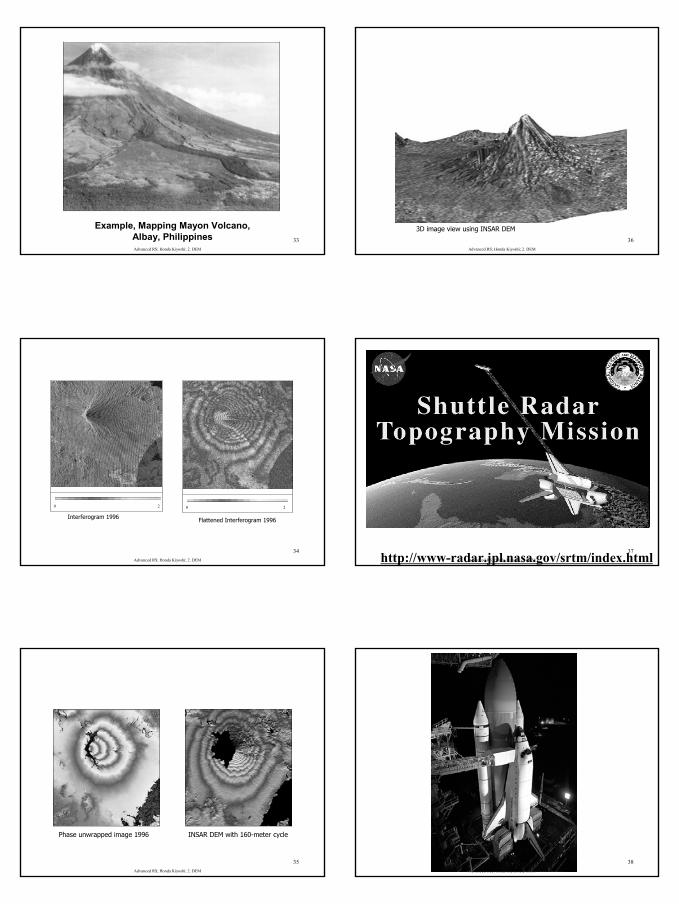
33
Example, Mapping Mayon Volcano, Albay, Philippines
Advanced RS; Honda Kiyoshi; 2. DEM
34
Interferogram 1996
0 2
Flattened Interferogram 1996
0 2
Advanced RS; Honda Kiyoshi; 2. DEM
35
Phase unwrapped image 1996 INSAR DEM with 160-meter cycle
Advanced RS; Honda Kiyoshi; 2. DEM
36
3D image view using INSAR DEM
Advanced RS; Honda Kiyoshi; 2. DEM
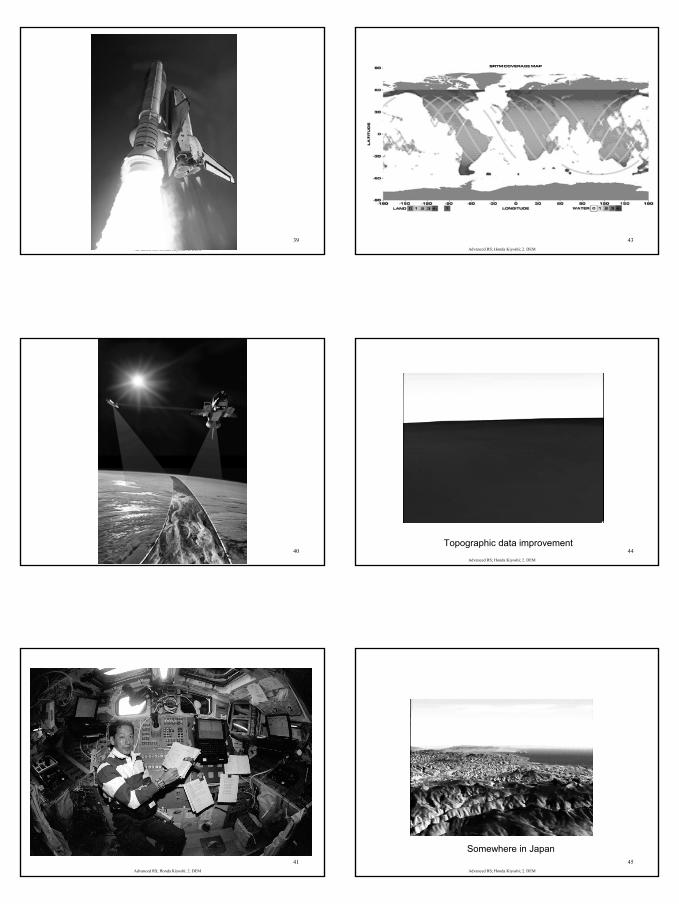
37http://www-radar.jpl.nasa.gov/srtm/index.html
Advanced RS; Honda Kiyoshi; 2. DEM
38
7
Advanced RS; Honda Kiyoshi; 2. DEM
39
Advanced RS; Honda Kiyoshi; 2. DEM
40
Advanced RS; Honda Kiyoshi; 2. DEM
41
Advanced RS; Honda Kiyoshi; 2. DEM
43
Advanced RS; Honda Kiyoshi; 2. DEM
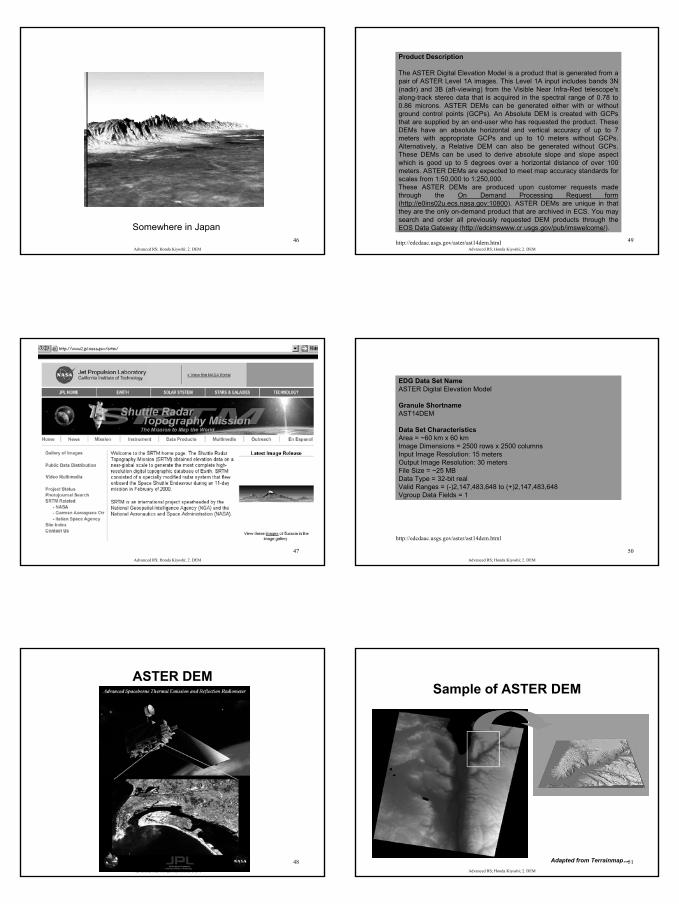
44Topographic data improvement
Advanced RS; Honda Kiyoshi; 2. DEM
45
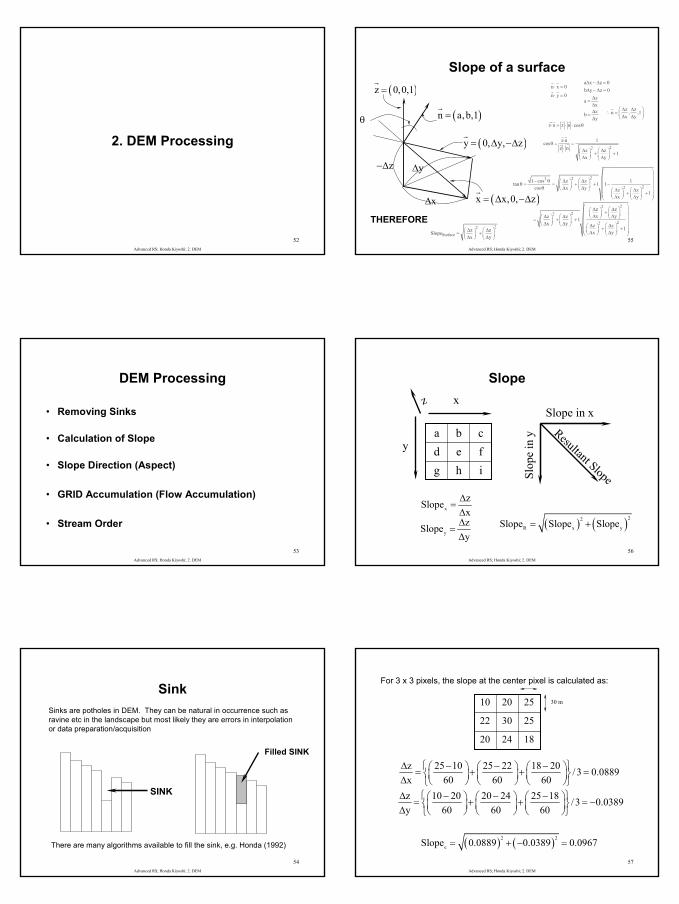
Somewhere in Japan
8
Advanced RS; Honda Kiyoshi; 2. DEM
46
Somewhere in Japan
Advanced RS; Honda Kiyoshi; 2. DEM
47
Advanced RS; Honda Kiyoshi; 2. DEM
48
ASTER DEM
Advanced RS; Honda Kiyoshi; 2. DEM
49
Product Description
The ASTER Digital Elevation Model is a product that is generated from a pair of ASTER Level 1A images. This Level 1A input includes bands 3N (nadir) and 3B (aft-viewing) from the Visible Near Infra-Red telescope's along-track stereo data that is acquired in the spectral range of 0.78 to 0.86 microns. ASTER DEMs can be generated either with or withoutground control points (GCPs). An Absolute DEM is created with GCPs that are supplied by an end-user who has requested the product. These DEMs have an absolute horizontal and vertical accuracy of up to 7 meters with appropriate GCPs and up to 10 meters without GCPs. Alternatively, a Relative DEM can also be generated without GCPs. These DEMs can be used to derive absolute slope and slope aspectwhich is good up to 5 degrees over a horizontal distance of over 100 meters. ASTER DEMs are expected to meet map accuracy standards for scales from 1:50,000 to 1:250,000.These ASTER DEMs are produced upon customer requests made through the On Demand Processing Request form(http://e0ins02u.ecs.nasa.gov:10800). ASTER DEMs are unique in that they are the only on-demand product that are archived in ECS. You may search and order all previously requested DEM products through the EOS Data Gateway (http://edcimswww.cr.usgs.gov/pub/imswelcome/).
http://edcdaac.usgs.gov/aster/ast14dem.html
Advanced RS; Honda Kiyoshi; 2. DEM
50
EDG Data Set NameASTER Digital Elevation Model
Granule ShortnameAST14DEM
Data Set CharacteristicsArea = ~60 km x 60 kmImage Dimensions = 2500 rows x 2500 columnsInput Image Resolution: 15 metersOutput Image Resolution: 30 metersFile Size = ~25 MBData Type = 32-bit realValid Ranges = (-)2,147,483,648 to (+)2,147,483,648Vgroup Data Fields = 1
http://edcdaac.usgs.gov/aster/ast14dem.html
Advanced RS; Honda Kiyoshi; 2. DEM
51
Sample of ASTER DEM
Adapted from Terrainmap.com
9
Advanced RS; Honda Kiyoshi; 2. DEM
52
2. DEM Processing
Advanced RS; Honda Kiyoshi; 2. DEM
53
DEM Processing
• Removing Sinks
• Calculation of Slope
• Slope Direction (Aspect)
• GRID Accumulation (Flow Accumulation)
• Stream Order
Advanced RS; Honda Kiyoshi; 2. DEM
54
SinkSinks are potholes in DEM. They can be natural in occurrence such as ravine etc in the landscape but most likely they are errors in interpolation or data preparation/acquisition
SINK
Filled SINK
There are many algorithms available to fill the sink, e.g. Honda (1992)
Advanced RS; Honda Kiyoshi; 2. DEM
55
Slope of a surface
x∆
y∆z−∆
θ
( )y 0, y, z= ∆ −∆r
( )x x,0, z= ∆ −∆r
( )n a,b,1=r
( )z 0,0,1=r
n x 0
n y 0
⋅ =
⋅ =
r r
r r
a x z 0b y z 0
zaxzby
∆ −∆ =∆ −∆ =
∆=∆∆
=∆
z zn , ,1x y
∆ ∆∴ = ∆ ∆
r
z n z n cos⋅ = ⋅ ⋅ θuurr r r
222
221 cos z z 1tan 1 1
cos x y z z 1x y
− θ ∆ ∆ θ = = + + − θ ∆ ∆ ∆ ∆ + + ∆ ∆
22
z n 1cosz n z z 1
x y
⋅θ = =
⋅ ∆ ∆ + + ∆ ∆
rur
uurr
2222
22
z zx yz z 1
x y z z 1x y
∆ ∆ + ∆ ∆ ∆ ∆ = + + ∆ ∆ ∆ ∆ + + ∆ ∆
THEREFORE22
Surfacez zSlopex y
∆ ∆ = + ∆ ∆
Advanced RS; Honda Kiyoshi; 2. DEM
56
Slope
ihgfedcba
x
y
zSlope in x
Slop
e in
y Resultant Slope
x
zSlopex
∆=∆
y
zSlopey
∆=∆
( ) ( )22
R x ySlope Slope Slope= +
Advanced RS; Honda Kiyoshi; 2. DEM
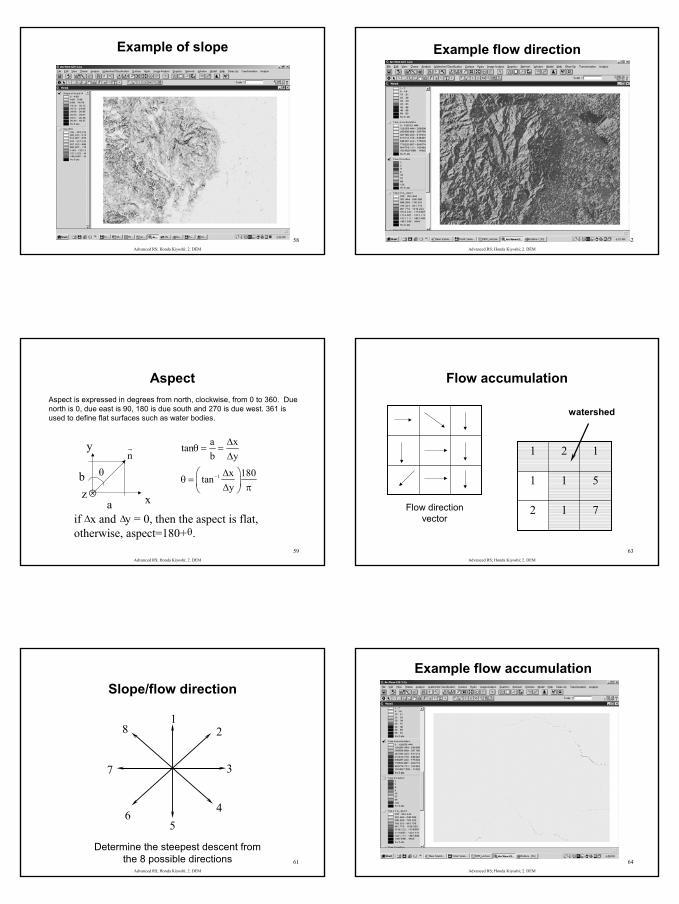
57
182420
253022
252010
For 3 x 3 pixels, the slope at the center pixel is calculated as:
z 25 10 25 22 18 20 /3 0.0889x 60 60 60
∆ − − − = + + = ∆
30 m
z 10 20 20 24 25 18 /3 0.0389y 60 60 60
∆ − − − = + + = − ∆
( ) ( )2 2
eSlope 0.0889 0.0389 0.0967= + − =
10
Advanced RS; Honda Kiyoshi; 2. DEM
58
Example of slope
Advanced RS; Honda Kiyoshi; 2. DEM
59
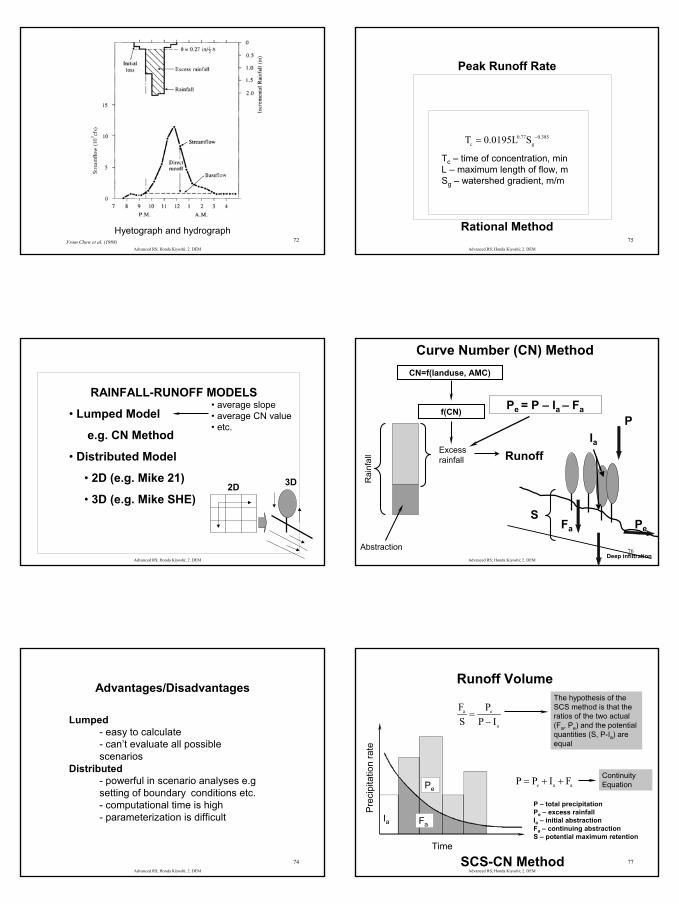
AspectAspect is expressed in degrees from north, clockwise, from 0 to 360. Due north is 0, due east is 90, 180 is due south and 270 is due west. 361 is used to define flat surfaces such as water bodies.
⊗ x
ynr
θ
a
b 1
a xtanb y
x 180tany
−
∆θ = =
∆
∆θ = ∆ π
if x and y = 0, then the aspect is flat, otherwise, aspect=180+ .∆ ∆
θ
z
Advanced RS; Honda Kiyoshi; 2. DEM
61
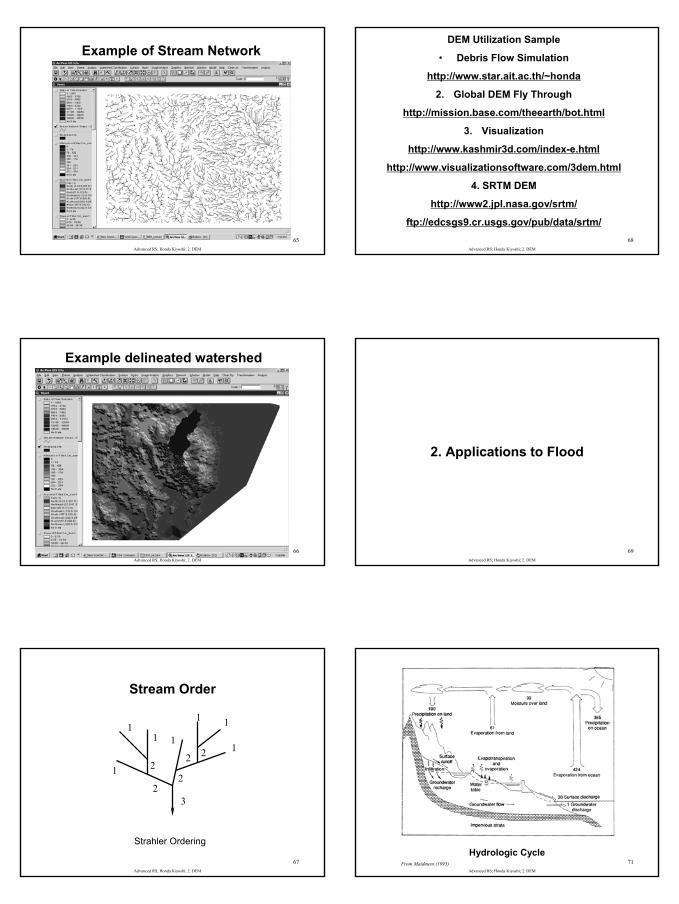
Slope/flow direction
12
3
45
6
7
8
Determine the steepest descent from the 8 possible directions
Advanced RS; Honda Kiyoshi; 2. DEM
62
Example flow direction
Advanced RS; Honda Kiyoshi; 2. DEM
63
Flow accumulation
712
511
121
watershed
Flow direction vector
Advanced RS; Honda Kiyoshi; 2. DEM
64
Example flow accumulation
11
Advanced RS; Honda Kiyoshi; 2. DEM
65
Example of Stream Network
Advanced RS; Honda Kiyoshi; 2. DEM
66
Example delineated watershed
Advanced RS; Honda Kiyoshi; 2. DEM
67
Stream Order
Strahler Ordering
1
11
21
2
2
11
21
23
Advanced RS; Honda Kiyoshi; 2. DEM
68
DEM Utilization Sample
• Debris Flow Simulation
http://www.star.ait.ac.th/~honda
2. Global DEM Fly Through
http://mission.base.com/theearth/bot.html
3. Visualization
http://www.kashmir3d.com/index-e.html
http://www.visualizationsoftware.com/3dem.html
4. SRTM DEM
http://www2.jpl.nasa.gov/srtm/
ftp://edcsgs9.cr.usgs.gov/pub/data/srtm/
Advanced RS; Honda Kiyoshi; 2. DEM
69
2. Applications to Flood
Advanced RS; Honda Kiyoshi; 2. DEM
71Hydrologic Cycle
From Maidment (1993)
12
Advanced RS; Honda Kiyoshi; 2. DEM
72Hyetograph and hydrograph
From Chow et al. (1988)
Advanced RS; Honda Kiyoshi; 2. DEM
73
INPUTINPUT OUTPUTOUTPUTSYSTEMSYSTEMINPUTINPUT OUTPUTOUTPUTSYSTEMSYSTEM
Q
T
MODELRESULTS
MODEL of a SYSTEM
RAINFALL-RUNOFF MODELS
• Lumped Model
e.g. CN Method
• Distributed Model
• 2D (e.g. Mike 21)
• 3D (e.g. Mike SHE)
• average slope• average CN value• etc.
2D 3D
Advanced RS; Honda Kiyoshi; 2. DEM
74
Advantages/Disadvantages
Lumped- easy to calculate- can’t evaluate all possible scenarios
Distributed- powerful in scenario analyses e.g setting of boundary conditions etc.- computational time is high- parameterization is difficult
Advanced RS; Honda Kiyoshi; 2. DEM
75
Peak Runoff Rate
Rational Method
Rat
e of
rain
fall
and
runo
ff
Time
Rainfall rate, i
D
I
Q
Tc
C=q/i
Peak
runo
ff ra
te
q 0.0028CiA=
q - the peak runoff rate, m3/sC – runoff coefficienti – rainfall intensity, mm/hA – watershed area, ha
0.77 0.385c gT 0.0195L S −=
Tc – time of concentration, minL – maximum length of flow, mSg – watershed gradient, m/m
Advanced RS; Honda Kiyoshi; 2. DEM
76
Curve Number (CN) MethodR
ainf
all
Abstraction
Excess rainfall Runoff
f(CN)
CN=f(landuse, AMC)
PIa
FaS
Pe
Deep infiltration
Pe = P – Ia – Fa
Advanced RS; Honda Kiyoshi; 2. DEM
77
Runoff Volume
Pre
cipi
tatio
n ra
te
Time
Ia Fa
Pe
a e
a
F PS P I=
−
e a aP P I F= + +
The hypothesis of the SCS method is that the ratios of the two actual (Fa, Pe) and the potential quantities (S, P-Ia) are equal
Continuity Equation
P – total precipitationPe – excess rainfallIa – initial abstractionFa – continuing abstractionS – potential maximum retention
SCS-CN Method
13
Advanced RS; Honda Kiyoshi; 2. DEM
78
( )2
ae
a
P IP
P I S−
=− +
aI 0.2S=
( )2
ae
P IP
P 0.8S−
=+
Depth of Runoff
Therefore:
Advanced RS; Honda Kiyoshi; 2. DEM
79
Graphical Solution of the SCS runoff Equation
CN=100 –impervious and water surfaces
Good Forest
Urban100%
Cumulative Rainfall (in)
Cum
ulat
ive
dire
ct R
unof
f (in
)
Advanced RS; Honda Kiyoshi; 2. DEM
80
Group A: Deep sand, deep loess, aggregated silts
Group B: Shallow loess, sandy loam
Group C: Clay loams, shallow sandy loam, soils low in organic content and soils usually high in clay
Group D: Soils that swell significantly when wet, heavy plastic clays and certain saline soils.
CN(II)
Advanced RS; Honda Kiyoshi; 2. DEM
81
1000S 10CN(II)
= − (inches)
4.2CN(II)CN(I)10 0.058CN(II)
=−
23CN(II)CN(III)10 0.13CN(II)
=+
Total 5-day antecedent rainfall (in) AMC Group Dormant Season Growing Season I Less than 0.5 Less than 1.4 II 0.5-1.1 1.4-2.1 III Over 1.1 Over 2.1
Classification of antecedent moisture classes for the SCS-CN method
Advanced RS; Honda Kiyoshi; 2. DEM
82
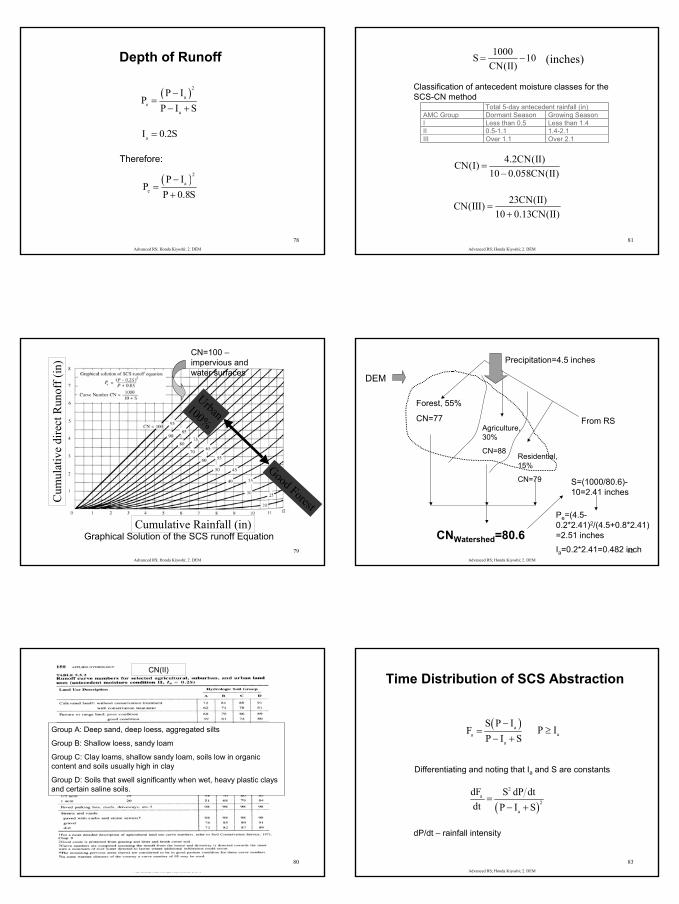
DEM
Forest, 55%
CN=77Agriculture,30%
CN=88Residential,15%
CN=79
From RS
CNWatershed=80.6
S=(1000/80.6)-10=2.41 inches
Precipitation=4.5 inches
Pe=(4.5-0.2*2.41)2/(4.5+0.8*2.41)=2.51 inches
Ia=0.2*2.41=0.482 inch
Advanced RS; Honda Kiyoshi; 2. DEM
83
Time Distribution of SCS Abstraction
( )aa
a
S P IF
P I S−
=− + aP I≥
( )
2a
2
a
dF S dP dtdt P I S
=− +
Differentiating and noting that Ia and S are constants
dP/dt – rainfall intensity
14
Advanced RS; Honda Kiyoshi; 2. DEM
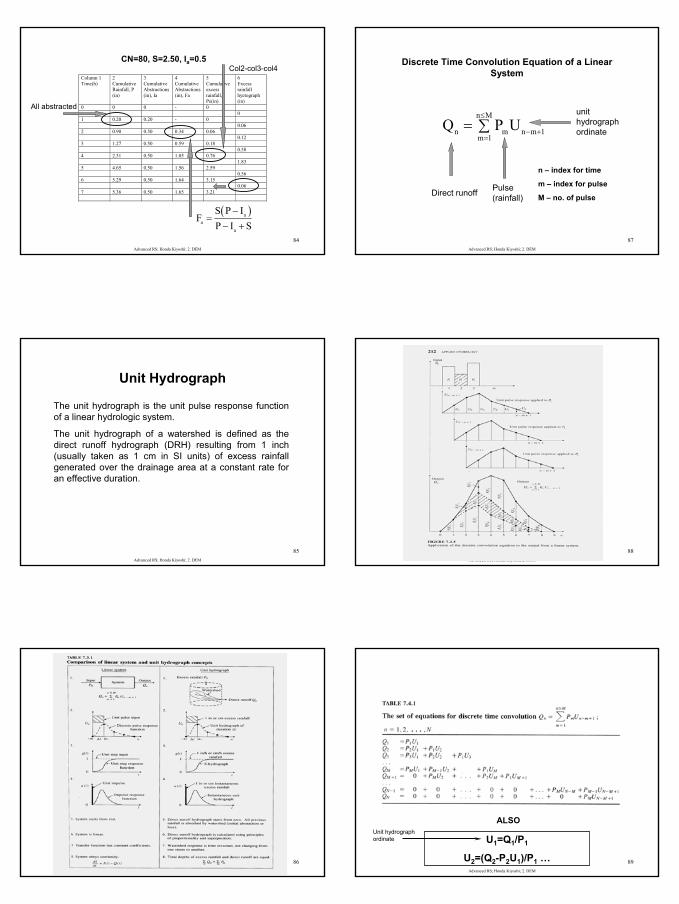
84
Column 1 Time(h)
2 Cumulative Rainfall, P (in)
3 Cumulative Abstractions (in), Ia
4 Cumulative Abstractions (in), Fa
5 Cumulative excess rainfall, Pe(in)
6 Excess rainfall hyetograph (in)
0 0 0 - 0 0 1 0.20 0.20 - 0 0.06 2 0.90 0.50 0.34 0.06 0.12 3 1.27 0.50 0.59 0.18 0.58 4 2.31 0.50 1.05 0.76 1.83 5 4.65 0.50 1.56 2.59 0.56 6 5.29 0.50 1.64 3.15 0.06 7 5.36 0.50 1.65 3.21
CN=80, S=2.50, Ia=0.5
All abstracted
( )aa
a
S P IF
P I S−
=− +
Col2-col3-col4
Advanced RS; Honda Kiyoshi; 2. DEM
85
Unit Hydrograph
The unit hydrograph is the unit pulse response function of a linear hydrologic system.
The unit hydrograph of a watershed is defined as the direct runoff hydrograph (DRH) resulting from 1 inch (usually taken as 1 cm in SI units) of excess rainfall generated over the drainage area at a constant rate for an effective duration.
Advanced RS; Honda Kiyoshi; 2. DEM
86
Advanced RS; Honda Kiyoshi; 2. DEM
87
Discrete Time Convolution Equation of a Linear System
n M
n m n m 1m 1
Q P U≤
− +=
= ∑
Direct runoff Pulse (rainfall)
unit hydrograph ordinate
n – index for time
m – index for pulse
M – no. of pulse
Advanced RS; Honda Kiyoshi; 2. DEM
88
Advanced RS; Honda Kiyoshi; 2. DEM
89
U1=Q1/P1
U2=(Q2-P2U1)/P1 …
ALSOUnit hydrograph ordinate
15
Advanced RS; Honda Kiyoshi; 2. DEM
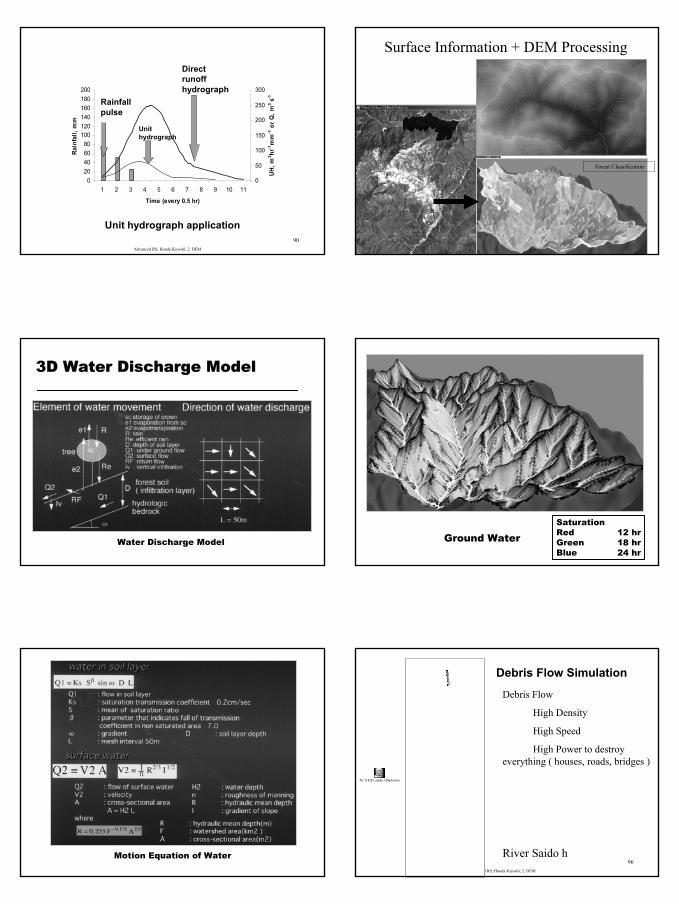
90
020406080
100120140160180200
1 2 3 4 5 6 7 8 9 10 11
Time (every 0.5 hr)
Rain
fall,
mm
0
50
100
150
200
250
300
UH, m
3 hr-1
mm
-1 o
r Q, m
3 s-1
Unit hydrograph
Direct runoff hydrograph
Rainfall pulse
Unit hydrograph application
3D Water Discharge Model
Water Discharge Model
Motion Equation of Water
Surface Information + DEM Processing
Forest Classification
Ground WaterSaturationRed 12 hrGreen 18 hrBlue 24 hr
Advanced RS; Honda Kiyoshi; 2. DEM
96
Debris Flow Simulation
flx_118_91_saido_15sph.mov
River Saido h
Debris Flow
High Density
High Speed
High Power to destroy everything ( houses, roads, bridges )
16
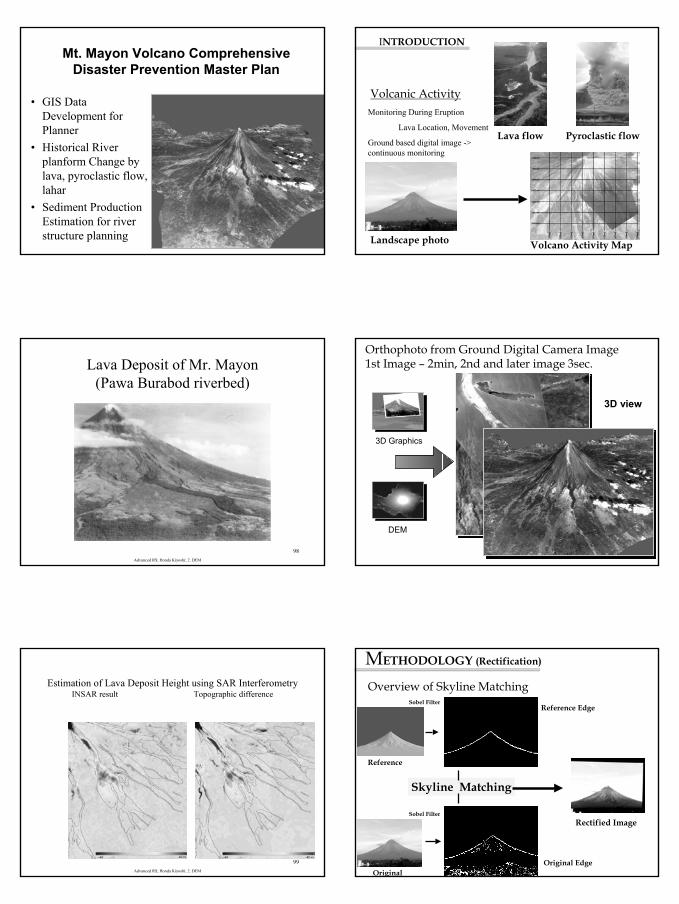
Mt. Mayon Volcano Comprehensive Disaster Prevention Master Plan
• GIS Data Development for Planner
• Historical River planform Change by lava, pyroclastic flow, lahar
• Sediment Production Estimation for river structure planning
Advanced RS; Honda Kiyoshi; 2. DEM
98
Lava Deposit of Mr. Mayon(Pawa Burabod riverbed)
Advanced RS; Honda Kiyoshi; 2. DEM
99
Estimation of Lava Deposit Height using SAR InterferometryINSAR result Topographic difference
Volcanic Activity
INTRODUCTION
Lava flow Pyroclastic flow
Volcano Activity MapLandscape photo
Monitoring During Eruption
Lava Location, Movement
Ground based digital image -> continuous monitoring
3D View
3D Graphics
DEM
Ortho-view
3D view
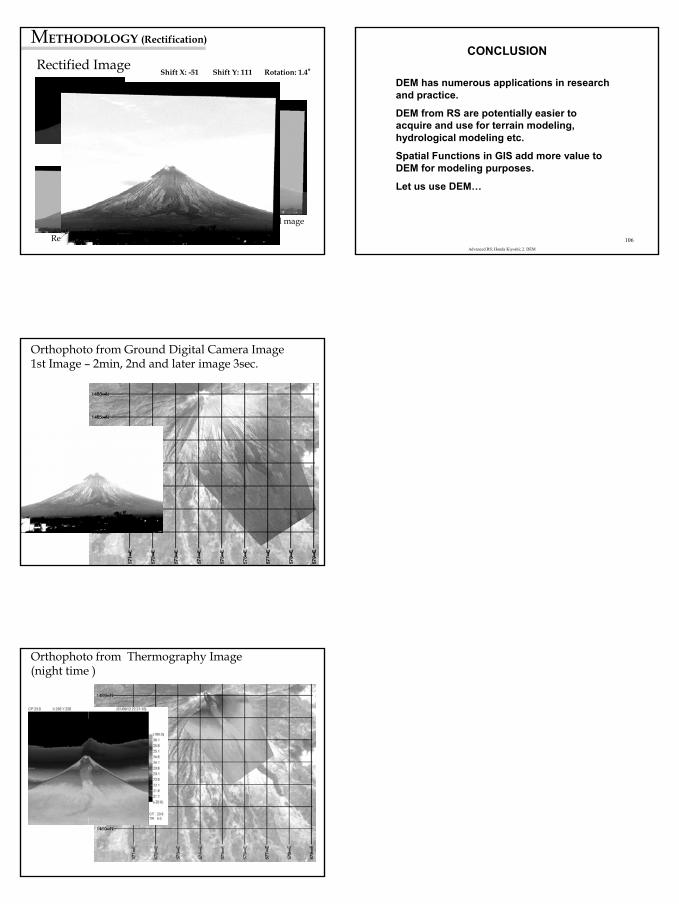
Orthophoto from Ground Digital Camera Image1st Image – 2min, 2nd and later image 3sec.
METHODOLOGY (Rectification)
Skyline Matching
Rectified Image
Reference Edge
Overview of Skyline Matching
Reference
OriginalOriginal Edge
Sobel Filter
Sobel Filter
17
METHODOLOGY (Rectification)
Reference
Rectified Image
Overlaid Reference and Rectified mage
Rectified ImageShift X: -51 Shift Y: 111 Rotation: 1.4°
Orthophoto from Ground Digital Camera Image1st Image – 2min, 2nd and later image 3sec.
Orthophoto from Thermography Image (night time )
Advanced RS; Honda Kiyoshi; 2. DEM
106
CONCLUSION
DEM has numerous applications in research and practice.
DEM from RS are potentially easier to acquire and use for terrain modeling, hydrological modeling etc.
Spatial Functions in GIS add more value to DEM for modeling purposes.
Let us use DEM…