Lecture 9: Introduction to Genetic Drift February 14, 2014.
25
Lecture 9: Introduction to Genetic Drift February 14, 2014
-
Upload
junior-horn -
Category
Documents
-
view
215 -
download
1
Transcript of Lecture 9: Introduction to Genetic Drift February 14, 2014.

Lecture 9: Introduction to Genetic Drift
February 14, 2014

Announcements
Exam to be returned Monday
Mid-term course evaluation
Class participation
Office hours

Last Time Overdominance and
Underdominance
Overview of advanced topics in selection
Introduction to Genetic Drift

TodayFirst in-class simulation of
population genetics processes: drift
Fisher-Wright model of genetic drift

What Controls Genetic Diversity Within Populations?
4 major evolutionary forces
Diversity
Mutation+
Drift-
Selection
+/-
Migration
+
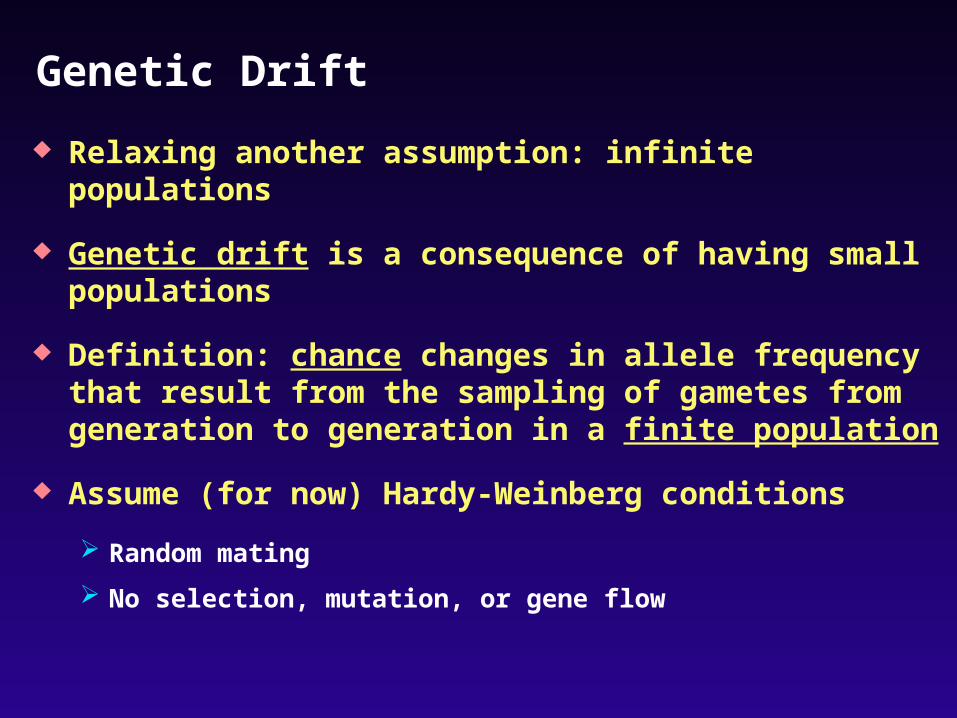
Genetic Drift
Relaxing another assumption: infinite populations
Genetic drift is a consequence of having small populations
Definition: chance changes in allele frequency that result from the sampling of gametes from generation to generation in a finite population
Assume (for now) Hardy-Weinberg conditions
Random mating
No selection, mutation, or gene flow

Drift Simulation Pick 1 red and 3 other m&m’s so that all 4 have different colors
Form two diploid ‘genotypes’ as you wish
Flip a coin to make 2 offspring Draw allele from Parent 1: if
‘heads’ get another m&m with the same color as the left ‘allele’, if ‘tails’ get one with the color of the right ‘allele’
Draw allele from Parent 2 in the same way
‘Mate’ offspring and repeat for 3 more generations
Report frequency of red ‘allele’ in last generation
m m
Parent 1
m m
Parent 2
m
m m m m
m m m m
m m m m
m m
heads tails
m

Genetic DriftA sampling problem: some alleles lost by random chance due to sampling "error" during reproduction

Simple Model of Genetic Drift
Many independent subpopulations
Subpopulations are of constant size
Random mating within subpopulations
N=16 N=16N=16
N=16N=16
N=16 N=16
N=16N=16N=16
N=16N=16
N=16
N=16
N=16
N=16
N=16
N=16
N=16
N=16
N=16
N=16
N=16
N=16
N=16N=16N=16 N=16N=16 N=16
N=16
N=16
N=16
N=16
N=16
N=16
N=16
N=16
N=16 N=16
N=16
N=16
N=16
N=16
N=16
N=16
N=16
N=16
N=16
N=16

Key Points about Genetic Drift Effects within subpopulations vs effects in
overall population (combining subpopulations)
Average outcome of drift within subpopulations depends on initial allele frequencies
Drift affects the efficiency of selection
Drift is one of the primary driving forces in evolution
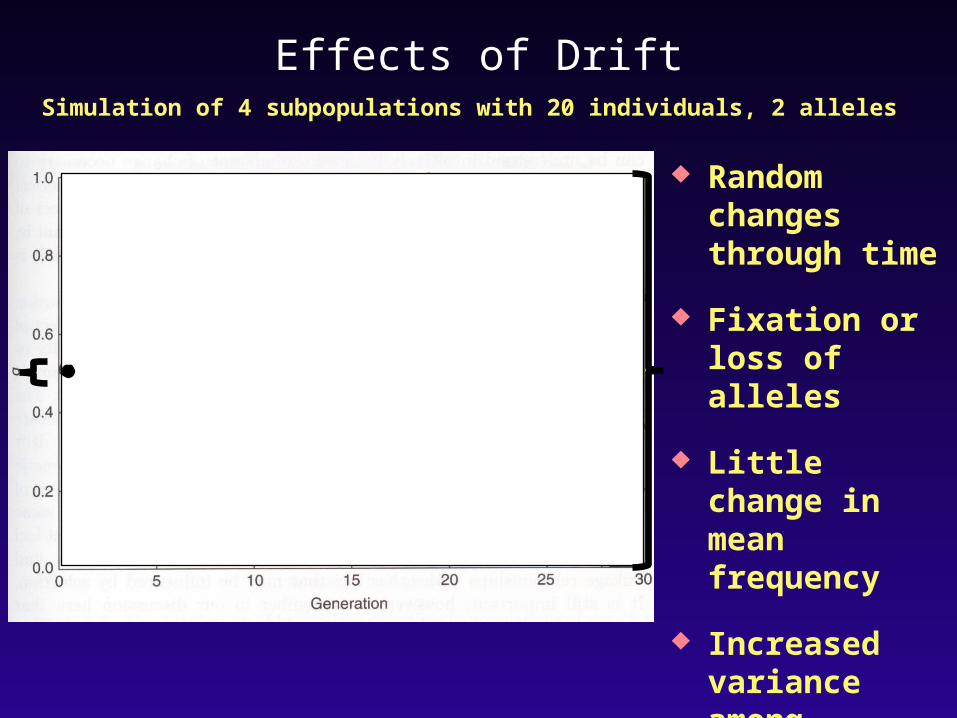
Effects of DriftSimulation of 4 subpopulations with 20 individuals, 2 alleles
Random changes through time
Fixation or loss of alleles
Little change in mean frequency
Increased variance among subpopulations

How Does Drift Affect the Variance of Allele Frequencies Within Subpopulations?
N
ppVar p 2
)1(

Drift Strongest in Small Populations

Effects of Drift
Buri (1956) followed change in eye color allele (bw75)
Codominant, neutral
107 populations
16 flies per subpopulation
Followed for 19 generations
http://www.cas.vanderbilt.edu/bsci111b/drosophila/flies-eyes-phenotypes.jpg

Modeling Drift as a Markov Chain Like the m & m
simulation, but analytical rather than empirical
Simulate large number of populations with two diploid individuals, p=0.5
Simulate transition to next generation based on binomial sampling probability (see text and lab manual)
,)( yny fsy
nyYP

Modeled versus Observed Drift in
Buri’s Flies

Effects of Drift Across Subpopulations
Frequency of eye color allele did not change much
Variance among subpopulations increased markedly

Fixation or Loss of Alleles Once an allele is
lost or fixed, the population does not change (what are the assumptions?)
This is called an “absorbing state”
Long-term consequences for genetic diversity
44
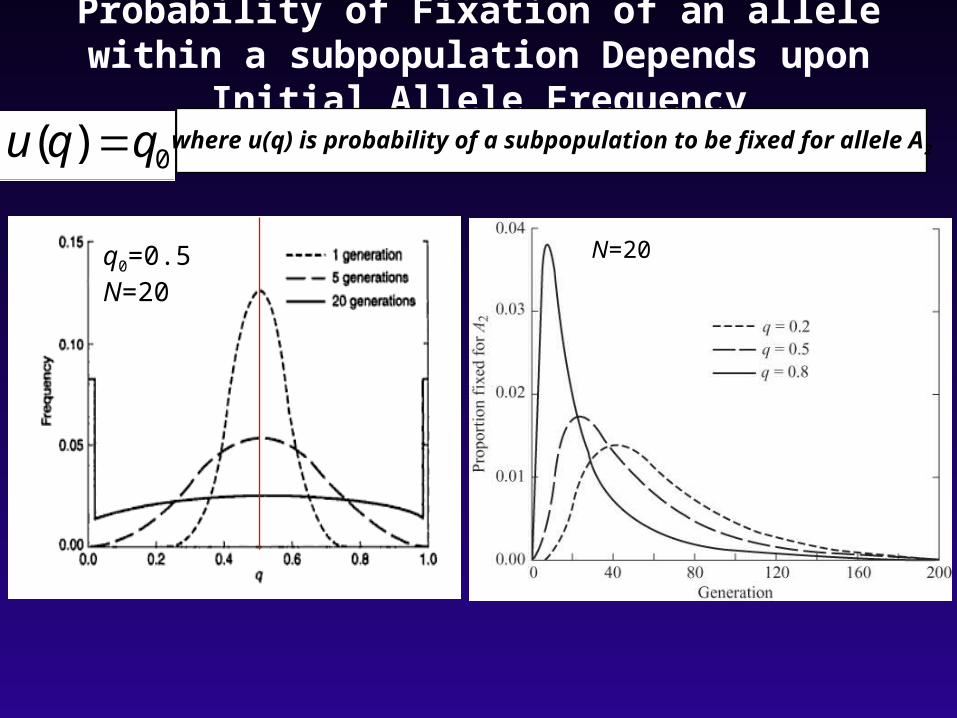
Probability of Fixation of an allele within a subpopulation Depends upon Initial Allele
Frequency
0)( qqu where u(q) is probability of a subpopulation to be fixed for allele A2
N=20q0=0.5N=20

Effects of Drift on Heterozygosity Can think of genetic drift as random selection of alleles from a
group of FINITE populations
Example: One locus and two alleles in a forest of 20 trees determines color of fruit
Probability of homozygotes in next generation?
NNNPIBD 2
1
2
12
2
tt f
NNf
2
11
2
11
Prior Inbreeding

Drift and Heterozygosity
Heterozygosity declines over time in subpopulations
Change is inversely proportional to population size
02
11 H
NH
t
t
Expressing previous equation in terms of heterozygosity:
tt fN
f
1
2
111 1
Remembering:
pq
Hf
21
tt fNN
f
2
11
2
11
p and q are stable through time across subpopulations, so 2pq is the same on both sides of equation: cancels

Diffusion Approximation

Time for an Allele to Become Fixed
Using the Diffusion Approximation to model drift
Assume ‘random walk’ of allele frequencies behaves like directional diffusion: heat through a metal rod
Yields simple and intuitive equation for predicting time to fixation:
p
ppNpT
)1ln()1(4)(
Time to fixation is linear function of population size and inversely associated with allele frequency

Time for a New Mutant to Become Fixed
Assume new mutant occurs at frequency of 1/2N
ln(1-p) ≈ -p for small p
1-p ≈ 1 for small p
p
ppNpT
)1ln()1(4)(
Expected time to fixation for a new mutant is 4 times the population size!
NpT 4)(

Effects of Drift
Within subpopulations
Changes allele frequencies
Degrades diversity
Reduces variance of allele frequencies (makes frequencies more unequal)
Does not cause deviations from HWE
Among subpopulations (if there are many)
Does NOT change allele frequencies
Does NOT degrade diversity
Increases variance in allele frequencies
Causes a deficiency of heterozygotes compared to Hardy-Weinberg expectations (if the existence of subpopulations is ignored = Wahlund Effect)


![Genetic Drift - Nicholls State University Drift.pdf · Genetic drift is a random process that can be important in the ... Microsoft PowerPoint - Genetic Drift.ppt [Compatibility Mode]](https://static.fdocuments.us/doc/165x107/5c89a32e09d3f21d318d305d/genetic-drift-nicholls-state-university-driftpdf-genetic-drift-is-a-random.jpg)