
Lecture 8
24
BA Management Studies Research Methods Lecture 8: Quantitative data analysis Alexandra Dias University of Leicester School of Management
-
Upload
namra-khalid -
Category
Documents
-
view
20 -
download
1
Transcript of Lecture 8

BA Management Studies
Research Methods
Lecture 8:
Quantitative data analysis
Alexandra Dias
University of Leicester School of Management

Overview of the Lecture
Making sense of Quantitative Data
• Bivariate analysis
• Multivariate analysis
Quantitative data analysis
• Statistical significance: Testing procedure
• Types of error
• Tests of statistical significance
University of Leicester School of Management 1
Bivariate analysis(analysis of two variables at a time)
University of Leicester School of Management 2

Bivariate analysis
• Explores relationships between variables
• Searches for co-variance and correlations
• Cannot establish causality
• Can sometimes infer the direction of a causal relationship
• Contingency tables
– connects the frequencies of two variables
– helps you identify any patterns of association
University of Leicester School of Management 3
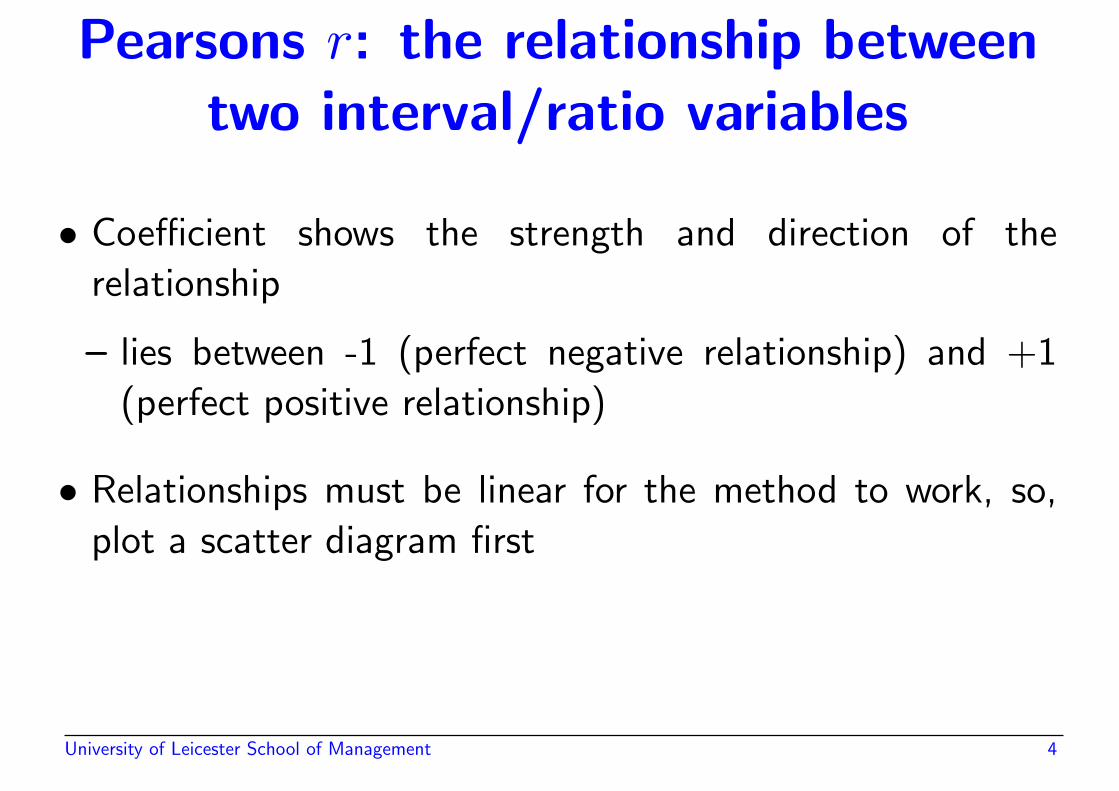
Pearsons r: the relationship betweentwo interval/ratio variables
• Coefficient shows the strength and direction of the
relationship
– lies between -1 (perfect negative relationship) and +1
(perfect positive relationship)
• Relationships must be linear for the method to work, so,
plot a scatter diagram first
University of Leicester School of Management 4

Pearsons r: example
Relation between credit rating class and probability of default
(PD). Is it linear? Can we use r?
If: 1=AAA,2=AA,...,9=C then r(class, Ln(PD)) = 0.995
University of Leicester School of Management 5

Pearsons r: the relationship betweentwo interval/ratio variables
• Coefficient of determination
– found by squaring the value of r
– shows how much of the variation in one variable is due
to the other variable
– here we are assuming causality!
In the following example causality is justified by financial
theory and not by statistical analysis
University of Leicester School of Management 6

Coefficient of determination: example
Financial Theory says that stock returns can be explained by
the financial market returns
Assume that the market returns are given by the S&P 500
index and inspect if these explain the returns on the IBM
stock.
• Dependent variable: IBM
returns
• Independent or explanatory
variable: S&P 500
University of Leicester School of Management 7
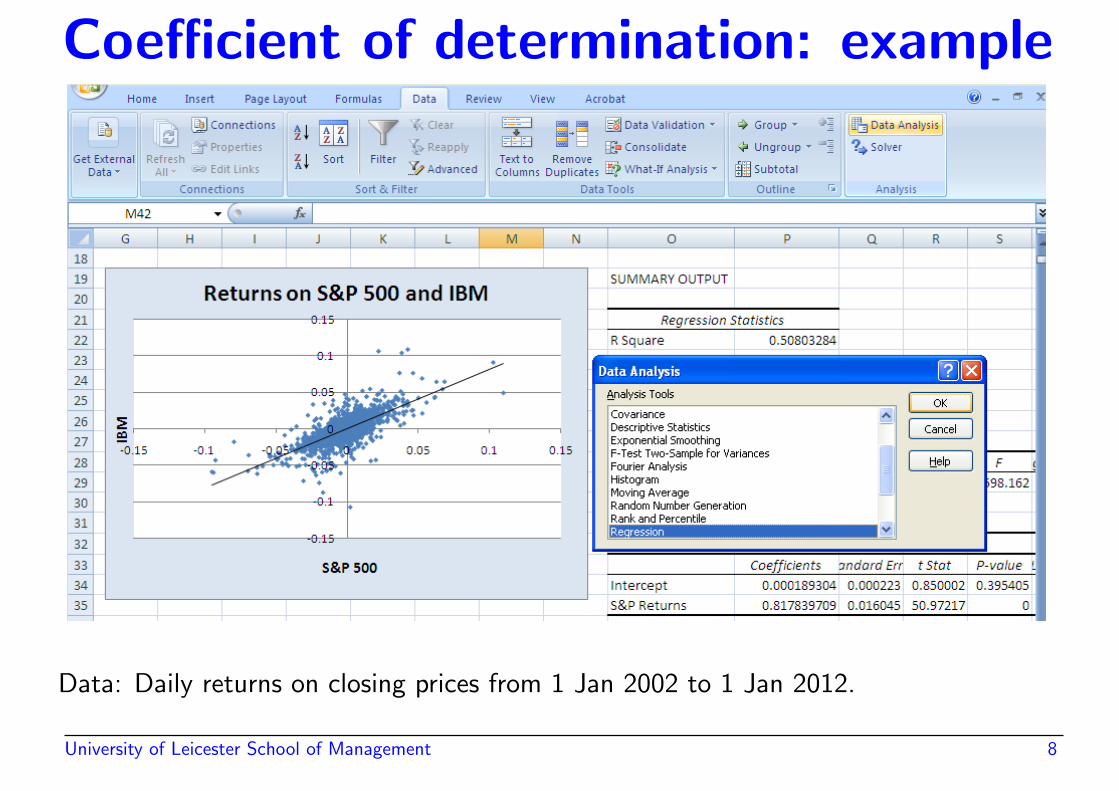
Coefficient of determination: example
Data: Daily returns on closing prices from 1 Jan 2002 to 1 Jan 2012.
University of Leicester School of Management 8

Analysing the relationships betweenother, or mixed types of variables
• Spearmans rho: for the relationship between two ordinal
variables, or one ordinal and one interval/ratio variable
(values of -1 to +1)
• Phi coefficient: for the relationship between two
dichotomous variables (values of -1 to +1)
• Cramers V: for the relationship between two nominal
variables, or one nominal and one ordinal variable (values
between 0 and 1)
University of Leicester School of Management 9

Analysing the relationships betweenother, or mixed types of variables
• Comparing means: when a nominal variable is identified
as the independent variable, the means of the interval/ratio
variable are compared for each sub-group of the nominal
variable
• eta: for the level of association between different types of
variables (nominal and interval/ratio), even when there is
no linear relationship between them
University of Leicester School of Management 10

Multivariate analysis(three or more variables)
• The relationship between two variables might be spurious
each variable could be related to a separate, third variable
• There might be an intervening variable
• A third variable might be moderating the relationship
Ex: correlation between stocks on UBS CH (bank) and
stocks on a Pensions Fund managing firm in UK could be
moderated by global financial market performance
University of Leicester School of Management 11

Quantitative Data Analysis
University of Leicester School of Management 12

Statistical significance
• How confident can we be that the findings from a sample
can be generalized to the population as a whole?
• How risky is it to make this inference?
• Only applies to probability samples
University of Leicester School of Management 13

Statistical significance of the mean:Gym visitors example
We can be 95% confident that the population mean (the
unknown real mean) is between
33.55+1.96×1.04 = 31.5 and 33.55−1.96×1.04 = 35.6
University of Leicester School of Management 14

Testing procedure for statisticalsignificance
1. Set up a null hypothesis: suggesting no relationship
between examined variables in the population from which
the sample was drawn;
2. Decide on an acceptable level of statistical significance;
Usually 5% or 1%
3. Use a statistical test;
4. If acceptable level attained, reject null hypothesis;
If not attained, do not reject it.
University of Leicester School of Management 15

IBM and S&P 500 example
Return(IBM) = 0.00018 + 0.82 × Return(S&P500) but 0.00018 is not significant(p > 0.05) hence Return(IBM) = 0.82 × Return(S&P500)
University of Leicester School of Management 16

We might be wrong to accept orreject the null hypothesis
University of Leicester School of Management 17

Tests of statistical significance
• The chi-square test
– establishes how confident we can be that there is a
relationship between the two variables in the population
• Correlation and statistical significance
– provides information about the likelihood that the
coefficient will be found in the population from which
the sample was taken
• Comparing means and statistical significance
– the F statistic expresses the amount of explained variance
in relation to the amount of error variance
University of Leicester School of Management 18

The chi-square test
• The chi-square (χ2) test is applied to contingency tables.
• It establishes how confident we can be that there is a
relationship between the two variables in the population.
• The test calculates for each cell in the table an expected
frequency or value (one that would occur on the basis of
chance alone).
• The chi-square value is determined by calculating the
differences between the actual and expected values for
each cell and then summing those differences.
University of Leicester School of Management 19

The chi-square test (cont.)
• Whether a chi-square value achieves statistical significance
depends not just on
– its magnitude but also on
– the number of categories of the two variables being
analysed.
This latter issue is governed by what is known as the
degrees of freedom associated with the table.
University of Leicester School of Management 20

Correlation and significance
• How confident can we be about a relationship between two
variables?
• Whether a correlation coefficient is statistically significant
depends on:
– the size of the coefficient (the higher the better)
– the size of the sample (the larger the better)
Ex: if coefficient is 0.62 and p < 0.05, we can reject the
null hypothesis of no correlation
University of Leicester School of Management 21

Comparing means
• Statistical significance of relationship between two variables
means
• Total variation in dependent variable:
– error variance (variation within subgroups)
– explained variance (variation between subgroups)
• F statistic
– expresses amount of explained variance in relation to
amount of error variance
University of Leicester School of Management 22

References
• Brymann and Bell, 2011, Business Research Methods, 3rd
Ed, Oxford University Press
2 Chapter 14.
• Easterby-Smith, Thorpe and Jackson, 2008, Management
Research, 3rd Ed, Sage
2 Chapter 11.
University of Leicester School of Management 23
![Lecture [8]](https://static.fdocuments.us/doc/165x107/577cc75c1a28aba711a0b3c6/lecture-8-578fec4e55e51.jpg)


