Lecture 7 Heat conduction and production - Helsinki
39
Geodynamics www.helsinki.fi/yliopisto Geodynamics Lecture 7 Heat conduction and production Lecturer: David Whipp david.whipp@helsinki.fi 23.9.2014 1
Transcript of Lecture 7 Heat conduction and production - Helsinki

Geodynamics www.helsinki.fi/yliopisto
Geodynamics Lecture 7
Heat conduction and productionLecturer: David Whipp [email protected]
!23.9.2014
1
Goals of this lecture
• Gain a conceptual and mathematical understanding of heat conduction
!
• Learn the concepts of radiogenic heat production in the Earth
!
• View the effects of heat conduction and production on the thermal field in the crust
2

Why talk about heat transfer?
3
The dynamics of the Earth are dominantly controlled by gravitational and thermal processes. In fact, you could argue that thermal processes have the
largest impact. Why?
Grand Prismatic Spring, Yellowstone National Park, U.S. Image: http://en.wikipedia.org

Why now?
4
Many rock properties are largely a function of temperature.
Faulting and brittle deformation may occur near the surface, but folding and ductile flow are dominant at depth.
www.usgs.gov
FaultingFolding

The effects of partial melting on rock strength
• Partial melting dramatically decreases rock strength
!
• Only about 7% melt is required for to decrease rock strength by 80-90%
5
362
Figure 13.3 Schematic plot of aggregate viscous strength versus melt volume % for sili-cate rocks between the liquidus and solidus (modified from Figure 4 in Rosenberg andHandy 2005). Note the two strength drops at the melt connectivity transition (MCT) andliquid-to-solid transition (LST); RCMP is rheological critical melt percentage. The verticalscale of the lower part of the ordinate is exaggerated to make the LST visible. The micro-structural sketches illustrate deformation at different melt vol.-%. At 3 vol.-%, deforma-tion localizes along a melt-bearing fault. At 7 vol.-%, deformation becomes more distrib-uted, but is localized along the interconnected melt network on the grain scale. At40–60 vol.-%, the solid crystal framework breaks down, but the grains still interact throughthe melt. Above 60 vol.-%, the solid particles suspended in the melt do not interact.
Claudio L. Rosenberg, Sergei Medvedev, and Mark R. Handy
RDW95.pmd 04.10.2006, 14:03362
Rosenberg et al., 2007
Heat transfer in the lithosphere
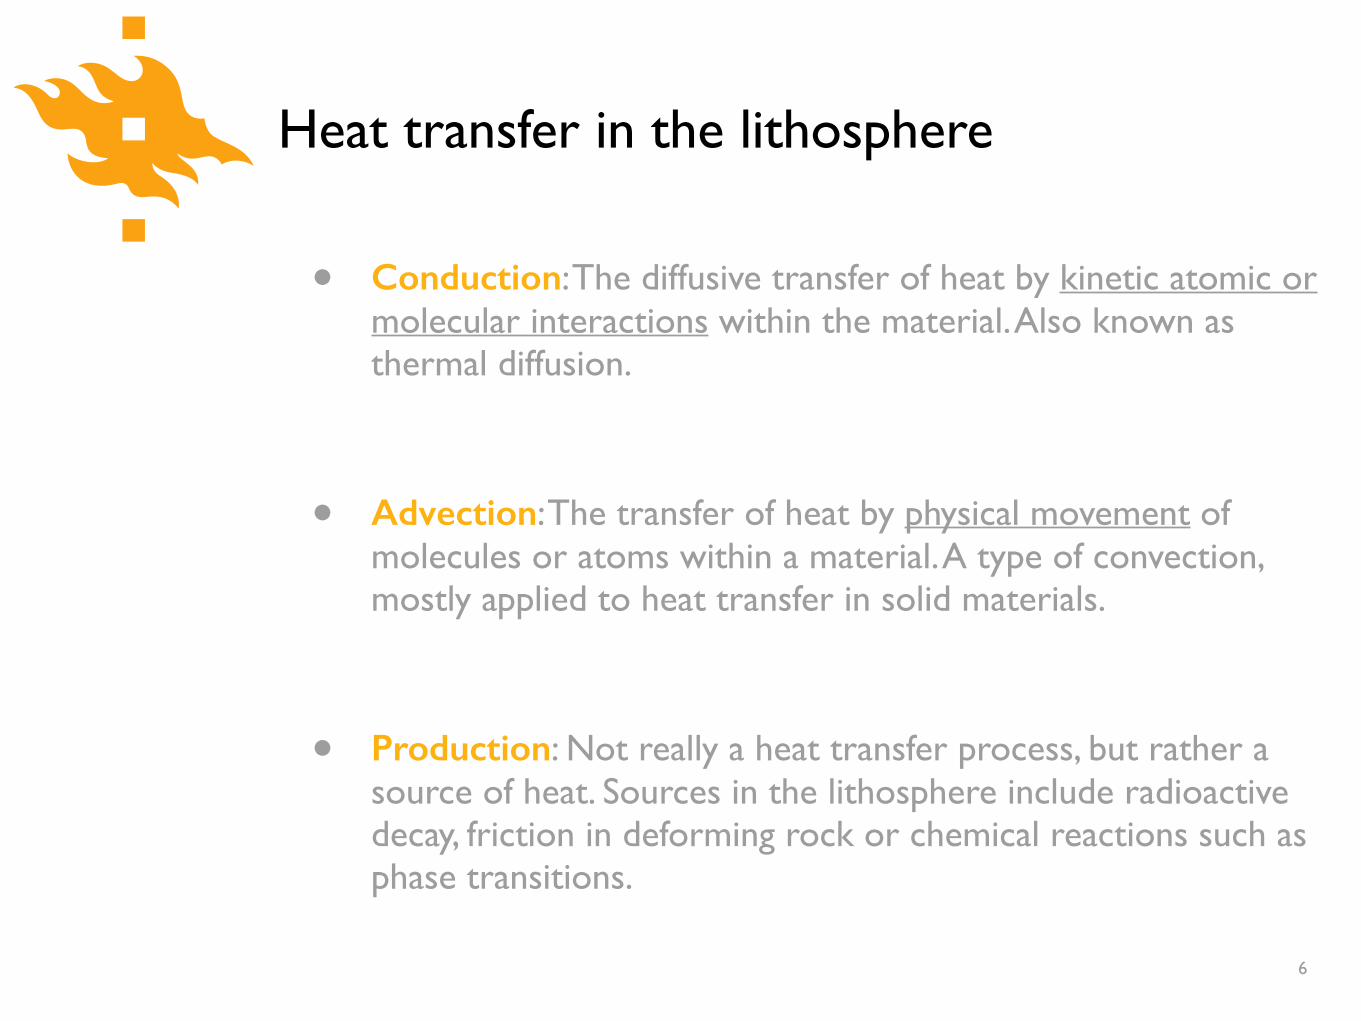
• Conduction: The diffusive transfer of heat by kinetic atomic or molecular interactions within the material. Also known as thermal diffusion.
!
• Advection: The transfer of heat by physical movement of molecules or atoms within a material. A type of convection, mostly applied to heat transfer in solid materials.
!
• Production: Not really a heat transfer process, but rather a source of heat. Sources in the lithosphere include radioactive decay, friction in deforming rock or chemical reactions such as phase transitions.
6

Heat transfer in the lithosphere
• Conduction: The diffusive transfer of heat by kinetic atomic or molecular interactions within the material. Also known as thermal diffusion.
!
• Advection: The transfer of heat by physical movement of molecules or atoms within a material. A type of convection, mostly applied to heat transfer in solid materials.
!
• Production: Not really a heat transfer process, but rather a source of heat. Sources in the lithosphere include radioactive decay, friction in deforming rock or chemical reactions such as phase transitions.
7
Focus in this lecture

Basic ideas of heat conduction
• The conduction of heat in solids is adiffusion process, and well described by Fourier’s laws, the basic mathematical relationships describing diffusion
!
• Fourier’s first law states that the flux of heat in a material 𝑞 is directly proportional to the temperature gradient
!
• What would this relationship look as an equation?
8

Basic ideas of heat conduction
• The conduction of heat in solids is adiffusion process, and well described by Fourier’s laws, the basic mathematical relationships describing diffusion
!
• Fourier’s first law states that the flux of heat in a material 𝑞 is directly proportional to the temperature gradient
!
• What would this relationship look as an equation?
9

Fourier’s first law
• In 1D, the mathematical translation of “Heat flux 𝑞 is directly proportional to the thermal gradient in a material” is
!
• Here, 𝑇 represents temperature and 𝑦 represents spatial position, depth in the Earth in this case
• Thus, 𝑑𝑇/𝑑𝑦 is the change in temperature with distance, the thermal gradient
• The proportionality constant 𝑘 is known as the thermal conductivity
10
q = �kdT
dy

Fourier’s first law
• In 1D, the mathematical translation of “Heat flux 𝑞 is directly proportional to the thermal gradient in a material” is
!
• Why is there a negative sign?
11
q = �kdT
dy
What is thermal conductivity?
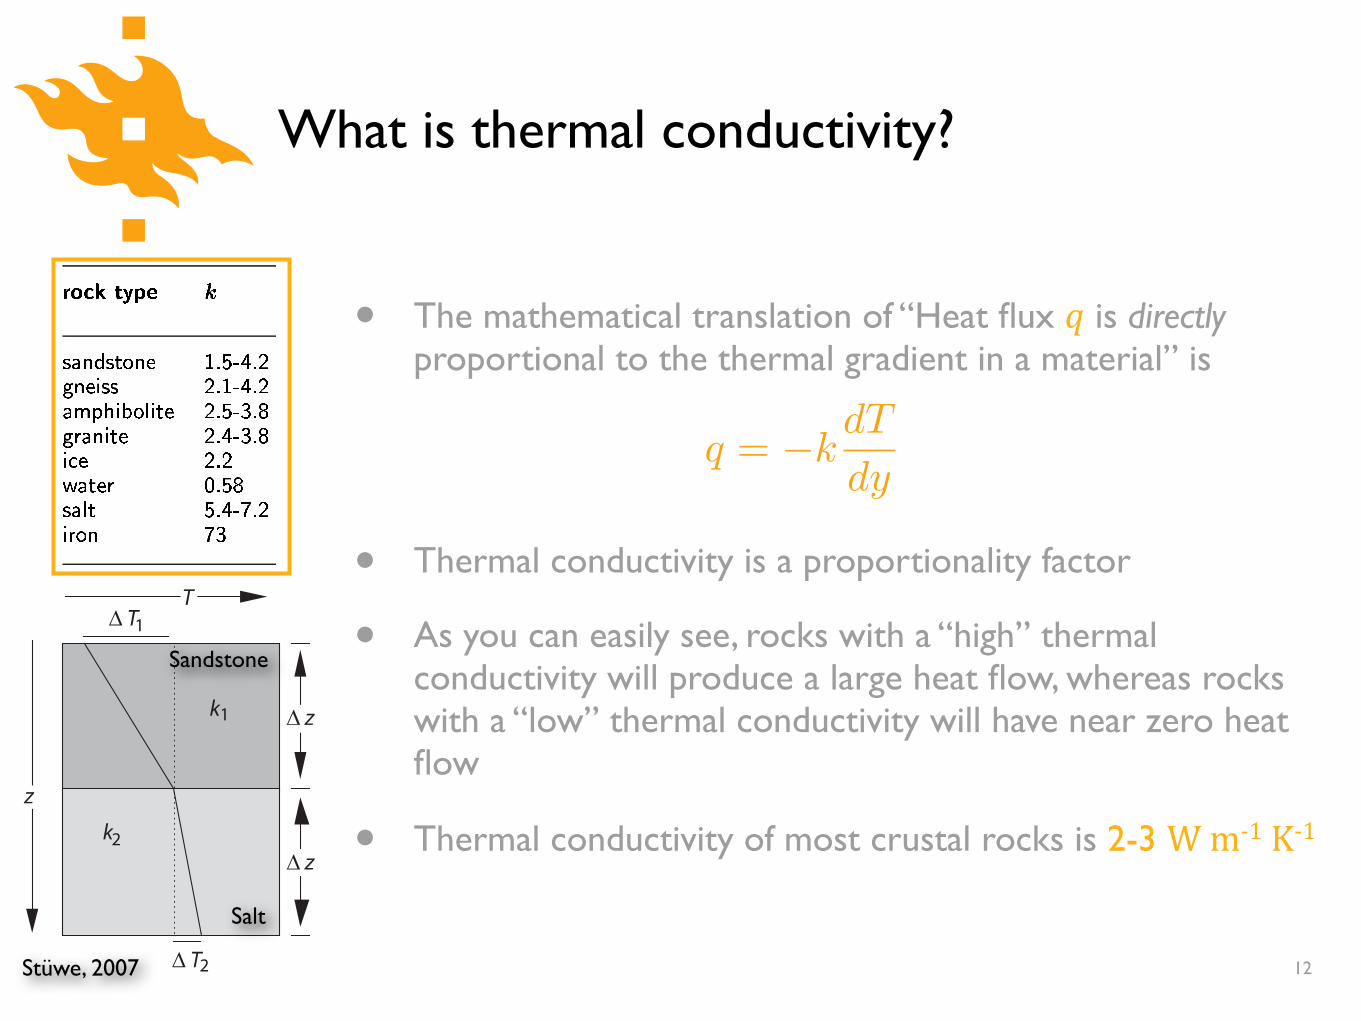
• The mathematical translation of “Heat flux 𝑞 is directly proportional to the thermal gradient in a material” is
• Thermal conductivity is a proportionality factor
• As you can easily see, rocks with a “high” thermal conductivity will produce a large heat flow, whereas rocks with a “low” thermal conductivity will have near zero heat flow
• Thermal conductivity of most crustal rocks is 2-3 W m-‐1 K-‐1
12Stüwe, 2007
Sandstone
Salt
q = �kdT
dy

Global heat flow map
14
http://www.cbe.cornell.edu
Here we can clearly see the connection between geodynamic setting and heat flow
Global average: 87 mW m-2 Continents: 65 ± 1.6 mW m-2 Oceans: 101 ± 2.2 mW m-2

• Radiogenic heat production, 𝐴 or 𝐻, results from the decay of radioactive elements in the Earth, mainly 238U, 235U, 232Th and 40K. 𝐴 is generally used for volumetric heat production and 𝐻 for heat production by mass.
• These elements occur in the mantle, but are concentrated in the crust, where radiogenic heating can be significant
• The surface heat flow in continental regions is ~65 mW m-2 and ~37 mW m-2 is from radiogenic heat production (57%)
Radiogenic heat production
15
248 Heat Transfer
Table 4.3 Typical Concentrations of the Heat-Producing Elements inSeveral Rock Types and the Average Concentrations in Chondritic
Meteorites
ConcentrationRock Type U (ppm) Th (ppm) K (%)
Reference undepleted (fertile) mantle 0.031 0.124 0.031“Depleted” peridotites 0.001 0.004 0.003Tholeiitic basalt 0.07 0.19 0.088Granite 4.7 20 4.2Shale 3.7 12 2.7Average continental crust 1.42 5.6 1.43Chondritic meteorites 0.008 0.029 0.056
incompatible elements. The concentrations of the heat-producing elementsin a typical continental rock such as a granite are quite variable, but ingeneral they are an order of magnitude greater than in tholeiitic basalts.Representative values of concentrations in granite are given in Table 4–3.
It is generally accepted that the chondritic class of meteorites is rep-resentative of primitive mantle material. The average concentrations of theheatproducing elements in chondritic meteorites are listed in Table 4–3. Theconcentrations of uranium and thorium are about a factor of 4 less than ourmean mantle values, and the concentration of potassium is about a factor of2 larger. The factor of 8 difference in the ratio CK
0 /CU0 is believed to repre-
sent a fundamental difference in elemental abundances between the Earth’smantle and chondritic meteorites.
Problem 4.3 Determine the present mean mantle concentrations of theheat-producing elements if the present value for the mean mantle heat pro-duction is 7.38 × 10⁻¹² W kg−1 and CK
0 /CU0 = 6 × 10⁴ and CTh
0 /CU0 = 4.
Problem 4.4 Determine the rates of heat production for the rocks listedin Table 4–3.
Problem 4.5 The measured concentrations of the heat-producing ele-ments in a rock are CU = 3.2 ppb, CTh = 11.7 ppb, and CK = 2.6%.Determine the rate of heat generation per unit mass in the rock.
Turcotte and Schubert, 2014

Radiogenic heat production
• Radiogenic heat production, 𝐴 or 𝐻, results from the decay of radioactive elements in the Earth, mainly 238U, 235U, 232Th and 40K. 𝐴 is generally used for volumetric heat production and 𝐻 for heat production by mass.
• These elements occur in the mantle, but are concentrated in the crust, where radiogenic heating can be significant
• The surface heat flow in continental regions is ~65 mW m-2 and ~37 mW m-2 is from radiogenic heat production (57%)
16
248 Heat Transfer
Table 4.3 Typical Concentrations of the Heat-Producing Elements inSeveral Rock Types and the Average Concentrations in Chondritic
Meteorites
ConcentrationRock Type U (ppm) Th (ppm) K (%)
Reference undepleted (fertile) mantle 0.031 0.124 0.031“Depleted” peridotites 0.001 0.004 0.003Tholeiitic basalt 0.07 0.19 0.088Granite 4.7 20 4.2Shale 3.7 12 2.7Average continental crust 1.42 5.6 1.43Chondritic meteorites 0.008 0.029 0.056
incompatible elements. The concentrations of the heat-producing elementsin a typical continental rock such as a granite are quite variable, but ingeneral they are an order of magnitude greater than in tholeiitic basalts.Representative values of concentrations in granite are given in Table 4–3.
It is generally accepted that the chondritic class of meteorites is rep-resentative of primitive mantle material. The average concentrations of theheatproducing elements in chondritic meteorites are listed in Table 4–3. Theconcentrations of uranium and thorium are about a factor of 4 less than ourmean mantle values, and the concentration of potassium is about a factor of2 larger. The factor of 8 difference in the ratio CK
0 /CU0 is believed to repre-
sent a fundamental difference in elemental abundances between the Earth’smantle and chondritic meteorites.
Problem 4.3 Determine the present mean mantle concentrations of theheat-producing elements if the present value for the mean mantle heat pro-duction is 7.38 × 10⁻¹² W kg−1 and CK
0 /CU0 = 6 × 10⁴ and CTh
0 /CU0 = 4.
Problem 4.4 Determine the rates of heat production for the rocks listedin Table 4–3.
Problem 4.5 The measured concentrations of the heat-producing ele-ments in a rock are CU = 3.2 ppb, CTh = 11.7 ppb, and CK = 2.6%.Determine the rate of heat generation per unit mass in the rock.
Turcotte and Schubert, 2014

Radiogenic heat production
17
Heat production
Rock type By mass, 𝐻 [W kg
By volume, 𝐴 [W m
By volume, 𝐴 [µW m
Reference undepleated (fer/le) mantle 7.39E-12 2.44E-08 0.024
"Depleated" perido/tes 3.08E-13 1.02E-09 0.001
Tholeii/c basalt 1.49E-11 4.41E-08 0.044
Granite 1.14E-09 3.01E-06 3.008
Shale 7.74E-10 1.86E-06 1.857
Average con/nental crust 3.37E-10 9.26E-07 0.927
Chondri/c meteorites 3.50E-12 1.15E-08 0.012
Calculated from Turcotte and Schubert, 2014

Radiogenic heat production
18
Heat production
Rock type By mass, 𝐻 [W kg
By volume, 𝐴 [W m
By volume, 𝐴 [µW m
Reference undepleated (fer/le) mantle 7.39E-12 2.44E-08 0.024
"Depleated" perido/tes 3.08E-13 1.02E-09 0.001
Tholeii/c basalt 1.49E-11 4.41E-08 0.044
Granite 1.14E-09 3.01E-06 3.008
Shale 7.74E-10 1.86E-06 1.857
Average con/nental crust 3.37E-10 9.26E-07 0.927
Chondri/c meteorites 3.50E-12 1.15E-08 0.012
Calculated from Turcotte and Schubert, 2014
• Typical heat production values for upper crustal rocks are2-3 µW m-3, but the crustal average is <1 µW m-3
• What does this suggest, and why might this occur?

Radiogenic heat production
• Because radiogenic heat production is the result of radioactive decay, the parent isotope concentrations have continually decreased throughout Earth’s history
• Today, the total amount of radiogenic heat is about half of what was produced in the Archean at ~3 Ga
19
S
Crustal heat production over time
Stüwe, 2007
𝐻

Radiogenic heat production
• Because radiogenic heat production is the result of radioactive decay, the parent isotope concentrations have continually decreased throughout Earth’s history
• Today, the total amount of radiogenic heat is about half of what was produced in the Archean at ~3 Ga
20
S
Crustal heat production over time
𝐻
Stüwe, 2007
Depletion
Continent
400 km
a
b
c
d
e
A
B a
b
Dep
th (k
m)
100 300Deviatoric stress (MPa)
500
Strain rate10–15 s–1
Strain rate10–15 s–1
0
40
80
120
160
100 300 500
Dep
th (k
m)
0
40
80
120
160
Crust
Reference density (g cm–3)
Stronglydepleted
lithosphericmantle
Basaltic crust2.8 3.0 0
40
80
120
225
3.2 3.4
Asthenosphere
Asthenosphere
Basaltic crust2.8 3.0 0
40
80
120
160
3.2 3.4
Lithosphericmantle
293 K 1,820 K
1,0000 2,000
600
400
200
Temperature (K)
0
Dep
th (k
m)
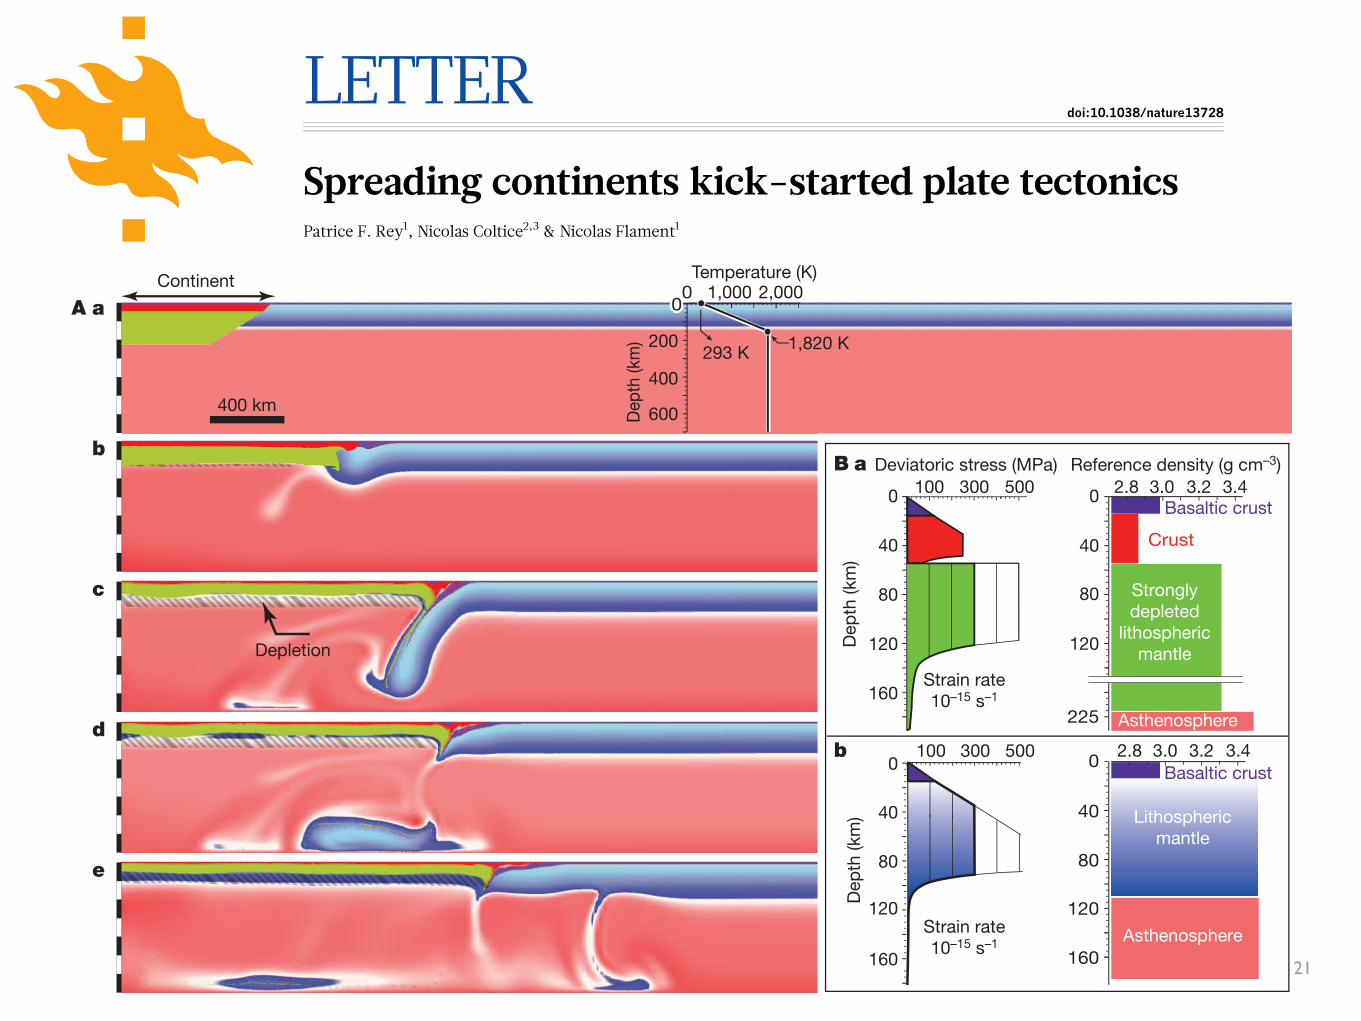
Figure 1 | Numerical solution of an example of continent collapse leading tosubduction. A, a, Modelling setup (0 Myr). b–e, Computed snapshots for a box700 km deep and 6,300 km long including a continent 225 km thick with ahalf-width of 800 km. b, 46.7 Myr; c, 55.3 Myr; d, 57.2 Myr; e, 123.8 Myr.All mantle rocks have a limiting yield stress of 300 MPa. Mantle cooler than1,620 K is in blue (darker blue is hotter); mantle hotter than 1,620 K is in pink(darker pink is hotter). Regions of depletion due to partial melting of ambientfertile mantle are hatched. B, Compositional structure, reference densitiesand reference rheological profile for the continent (a) and for the adjacent
lithospheric lid (b). This numerical solution documents the long phase ofslow continental spreading leading to the initiation of a slab (A, b and c).Once the slab has reached a depth of ,200 km, slab pull contributes to drivesubduction, rollback and continental boudinage (A, c) (in some experimentsboudinage leads to rifting) and slab detachment (A, d). In this experiment thedetachment of the slab is followed by a long period of thermal relaxation andstabilization during which the thickness of the continent increases throughcooling and incorporation of the moderately depleted mantle (A, e).
20 2530
50
100
150
200
250
300
Dep
th (k
m)
1,400 1,600 1,800 2,000 2,200Temperature (K)
Solidus
Liquidus
Adiabatic path
Fertileambient mantle
Refractory harzburgite and dunite
A3
A1
A2
A0
A0′
A2′
Melt adiabat At t0 + 55 Myr
At t0
Exhumation
a
MgO (%)
1015
A1′
Geotherm (t0 )
55 Myr
A3′2
0
4
6
8
Pressure (G
Pa)
Potential temperature
b
200
250
150
100
50
040302010 50 60 70 80 100
Time (Myr)
Depletion (%)
Dep
th (k
m)
Maximum duration of volcanism
Depletion
Refractory harzburgite and dunite
Ambient fertile mantle
Greenstone
Continental crust (TTG)
1
126
Partial melting
Flood basalt
Stronglydepleted/strained
Fertile
Stratified S
CLM
Moderatelydepleted/strained
Figure 2 | Development of layering of the continental lithosphere throughthinning and progressive accretion of moderately depleted mantle. a, Pointslocated at depths A0 to A3 before spreading are exhumed during spreadingto locations A09 to A39, following the blue pressure–temperature–time path.The geotherm intersects the solidus, and the temperature in the partially moltencolumn remains close to the solidus because latent heat is continuouslyextracted with the melt once melt fraction has reached 1%. Melt is extractedfrom various depths following the melt adiabat (yellow paths). The regionbetween the solidus and liquidus of the hydrous fertile mantle is mapped forMgO content (see Methods). The deeper part of the column produceskomatiitic basalts (dark blue shading), whereas partial melting at pressures
,3 GPa produces tholeiitic basalts (pale blue shading). b, Temporal evolutionof the laterally averaged depletion (blue), partial melting (yellow) and densityinterfaces (thick dashed lines). As spreading and thinning proceed, pureshear fabrics (shown as finite strain ellipses) develop in the refractory mantleand in the moderately depleted mantle, which records a shorter strain history.The base of the partially molten column remains close to ,150 km, whereasits top progressively rises from ,150 km at the beginning of partial melting(at ,44 Myr) to an average of ,75 km below the surface (at ,55 Myr). From55 Myr, spreading slows down and progressive cooling reduces the amount ofmelt, until partial melting stops at ,82 Myr. This results in the progressivechemical and structural stratification of the lithospheric mantle.
RESEARCH LETTER
4 0 6 | N A T U R E | V O L 5 1 3 | 1 8 S E P T E M B E R 2 0 1 4
Macmillan Publishers Limited. All rights reserved©2014
21
LETTERdoi:10.1038/nature13728
Spreading continents kick-started plate tectonicsPatrice F. Rey1, Nicolas Coltice2,3 & Nicolas Flament1
Stresses acting on cold, thick and negatively buoyant oceanic litho-sphere are thought to be crucial to the initiation of subduction andthe operation of plate tectonics1,2, which characterizes the present-day geodynamics of the Earth. Because the Earth’s interior was hotterin the Archaean eon, the oceanic crust may have been thicker, therebymaking the oceanic lithosphere more buoyant than at present3, andwhether subduction and plate tectonics occurred during this time isambiguous, both in the geological record and in geodynamic models4.Here we show that because the oceanic crust was thick and buoyant5,early continents may have produced intra-lithospheric gravitationalstresses large enough to drive their gravitational spreading, to initi-ate subduction at their margins and to trigger episodes of subduc-tion. Our model predicts the co-occurrence of deep to progressivelyshallower mafic volcanics and arc magmatism within continents ina self-consistent geodynamic framework, explaining the enigmaticmultimodal volcanism and tectonic record of Archaean cratons6. More-over, our model predicts a petrological stratification and tectonic struc-ture of the sub-continental lithospheric mantle, two predictions thatare consistent with xenolith5 and seismic studies, respectively, and con-sistent with the existence of a mid-lithospheric seismic discontinuity7.The slow gravitational collapse of early continents could have kick-started transient episodes of plate tectonics until, as the Earth’s inte-rior cooled and oceanic lithosphere became heavier, plate tectonicsbecame self-sustaining.
Present-day plate tectonics is primarily driven by the negative buoy-ancy of cold subducting plates. Petrological and geochemical proxies ofsubduction preserved in early continents point to subduction-like pro-cesses already operating before 3 billion years (Gyr) ago8,9 and perhapsas early as 4.1 Gyr ago10. However, they are not unequivocal, and geo-dynamic modelling suggests that the thicker basaltic crust produced bypartial melting of a hotter Archaean or Hadean mantle would have hadincreased lithospheric buoyancy and inhibited subduction3,4. Mantle con-vection under a stagnant lid with extensive volcanism could thereforehave preceded the onset of subduction11. In this scenario, it is classicallyassumed that the transition from stagnant-lid regime to mobile-lid regimeand the onset of plate tectonics require that convective stresses overcamethe strength of the stagnant lid12 at some stage in the Archaean.
On the modern Earth, gravitational stresses due to continental buoyancycan contribute to the initiation of subduction2,13. The role of continentalgravitational stresses as a driver of Archaean lithospheric deformationhas been emphasized14,15; however, their potential to initiate subductionhas been overlooked. Studies of xenoliths from Archaean cratons showthat the early continental crust was underlain by a thick (,200 km) lith-ospheric mantle, moderately to strongly depleted and therefore buoyant5.A common model for the formation of early continental lithosphereinvokes partial melting in mantle plumes, leading to magnesium-richmantle residues (for example, refractory harzburgites and dunites) underthick basaltic plateaux5,16,17. Partial melting of these thick basaltic crusts, atdepths .40 km, further differentiates the crust into tonalite–trondjemite–granodiorite (TTG) and restitic material16,18.
First-order calculations show that the horizontal gravitational forceacting between a continent 200 km thick and adjacent oceanic lithosphereis of the order of 1013 N m21 (see Extended Data Fig. 1), comparable to
that of present-day tectonic forces driving orogenesis1. To explore thetectonic impact of a thick and buoyant continent surrounded by a stag-nant lithospheric lid, we produced a series of two-dimensional thermo-mechanical numerical models of the top 700 km of the Earth, usingtemperature-dependent densities and visco-plastic rheologies that dependon temperature, melt fraction and depletion, stress and strain rate (seeMethods). The initial temperature field is the horizontally averaged tem-perature profile of a stagnant-lid convection calculation for a mantle,200 K hotter than at present (Fig. 1A, a and Extended Data Fig. 2). Theabsence of lateral temperature gradients ensures that no convective stressesact on the lid, allowing us to isolate the dynamic effects of the continent.A buoyant and stiff continent 225 km thick (strongly depleted mantleroot 170 km thick overlain by felsic crust 40 km thick; see Fig. 1B, a) isinserted within the lid, on the left side of the domain to exploit the sym-metry of the problem (Fig. 1A, a). A mafic crust 15 km thick covers thewhole system (Fig. 1A, a), consistent with the common occurrence ofthick greenstone covers on continents, as well as thick basaltic crust onthe oceanic lid3.
Our numerical solutions show that the presence of a buoyant con-tinent imparts a horizontal force large enough to induce a long period(,50–150 Myr) of slow collapse of the whole continental lithosphere(Fig. 1 and Extended Data Fig. 3), in agreement with the dynamics ofspreading for gravity currents19. Hence, a continent of larger volume leadsto larger gravitational power and faster collapse. Because of lateral spread-ing of the continent, the adjacent lithospheric lid is slowly pushed underits margin (Fig. 1A, b and Extended Data Fig. 3A, a). For gravitationalstress lower than the yield stress of the oceanic lid, thickening of the marginof the lid is slow, and viscous drips (that is, Rayleigh–Taylor instabilities)detach from its base (Extended Data Fig. 3A, a and b). These instabilities,typical of stagnant-lid convection20, mitigate the thermal thickening ofthe lid.
When gravitational stresses overcome the yield stress of the lithosphericlid, subduction is initiated (Fig. 1A, b and c). Depending on the half-widthof the continent and its density contrast with the adjacent oceanic lid (thatis, its gravitational power) three situations can arise: first, subductioninitiates and stalls (Extended Data Fig. 3b); second, the slab detaches andthe lid stabilizes (Fig. 1A, d and e and Extended Data Fig. 3c); or third,recurrent detachment of the slab continues until recycling of the oceaniclid is completed, followed by stabilization (Extended Data Fig. 3d). Whenthe slab reaches a depth of ,200 km, slab pull contributes to drive sub-duction and rapid rollback of the subducting lid, which in turn promoteslithospheric boudinage and continental rifting (Fig. 1A, c and ExtendedData Fig. 3C, b–d). Through spreading and thinning of the continent,its base rises from 225 km to ,75 km deep on average, and shallowerbetween lithospheric boudins (Figs 1A, d and 2b and Extended DataFig. 3C, c and d and D, b–f). This triggers an episode of deep (,150 km)to shallow (,100 km) decompression melting and progressive deple-tion of the ambient fertile mantle (Figs 2 and 3b). Harzburgites of thecontinental mantle are too refractory to melt on decompression. Poly-baric melting of fertile mantle produces a basalt cover 6 km thick and amantle residue ,75 km thick with an average depletion of 7.5% (Figs 2and 3c). The bulk of depletion occurs during a volcanic episode lasting upto ,13 Myr, although partial melting persists for up to 45 Myr (Fig. 2b).
1Earthbyte Research Group, School of Geosciences, The University of Sydney, Sydney NSW 2006, Australia. 2Laboratoire de Geologie de Lyon, UMR 5276 CNRS, Universite Lyon 1, Ecole NormaleSuperieure de Lyon, 69622 Villeurbanne Cedex, France. 3Institut Universitaire de France, 75005 Paris, France.
1 8 S E P T E M B E R 2 0 1 4 | V O L 5 1 3 | N A T U R E | 4 0 5
Macmillan Publishers Limited. All rights reserved©2014

Depletion
Continent
400 km
a
b
c
d
e
A
B a
b
Dep
th (k
m)
100 300Deviatoric stress (MPa)
500
Strain rate10–15 s–1
Strain rate10–15 s–1
0
40
80
120
160
100 300 500
Dep
th (k
m)
0
40
80
120
160
Crust
Reference density (g cm–3)
Stronglydepleted
lithosphericmantle
Basaltic crust2.8 3.0 0
40
80
120
225
3.2 3.4
Asthenosphere
Asthenosphere
Basaltic crust2.8 3.0 0
40
80
120
160
3.2 3.4
Lithosphericmantle
293 K 1,820 K
1,0000 2,000
600
400
200
Temperature (K)
0
Dep
th (k
m)
22
LETTERdoi:10.1038/nature13728
Spreading continents kick-started plate tectonicsPatrice F. Rey1, Nicolas Coltice2,3 & Nicolas Flament1
Stresses acting on cold, thick and negatively buoyant oceanic litho-sphere are thought to be crucial to the initiation of subduction andthe operation of plate tectonics1,2, which characterizes the present-day geodynamics of the Earth. Because the Earth’s interior was hotterin the Archaean eon, the oceanic crust may have been thicker, therebymaking the oceanic lithosphere more buoyant than at present3, andwhether subduction and plate tectonics occurred during this time isambiguous, both in the geological record and in geodynamic models4.Here we show that because the oceanic crust was thick and buoyant5,early continents may have produced intra-lithospheric gravitationalstresses large enough to drive their gravitational spreading, to initi-ate subduction at their margins and to trigger episodes of subduc-tion. Our model predicts the co-occurrence of deep to progressivelyshallower mafic volcanics and arc magmatism within continents ina self-consistent geodynamic framework, explaining the enigmaticmultimodal volcanism and tectonic record of Archaean cratons6. More-over, our model predicts a petrological stratification and tectonic struc-ture of the sub-continental lithospheric mantle, two predictions thatare consistent with xenolith5 and seismic studies, respectively, and con-sistent with the existence of a mid-lithospheric seismic discontinuity7.The slow gravitational collapse of early continents could have kick-started transient episodes of plate tectonics until, as the Earth’s inte-rior cooled and oceanic lithosphere became heavier, plate tectonicsbecame self-sustaining.
Present-day plate tectonics is primarily driven by the negative buoy-ancy of cold subducting plates. Petrological and geochemical proxies ofsubduction preserved in early continents point to subduction-like pro-cesses already operating before 3 billion years (Gyr) ago8,9 and perhapsas early as 4.1 Gyr ago10. However, they are not unequivocal, and geo-dynamic modelling suggests that the thicker basaltic crust produced bypartial melting of a hotter Archaean or Hadean mantle would have hadincreased lithospheric buoyancy and inhibited subduction3,4. Mantle con-vection under a stagnant lid with extensive volcanism could thereforehave preceded the onset of subduction11. In this scenario, it is classicallyassumed that the transition from stagnant-lid regime to mobile-lid regimeand the onset of plate tectonics require that convective stresses overcamethe strength of the stagnant lid12 at some stage in the Archaean.
On the modern Earth, gravitational stresses due to continental buoyancycan contribute to the initiation of subduction2,13. The role of continentalgravitational stresses as a driver of Archaean lithospheric deformationhas been emphasized14,15; however, their potential to initiate subductionhas been overlooked. Studies of xenoliths from Archaean cratons showthat the early continental crust was underlain by a thick (,200 km) lith-ospheric mantle, moderately to strongly depleted and therefore buoyant5.A common model for the formation of early continental lithosphereinvokes partial melting in mantle plumes, leading to magnesium-richmantle residues (for example, refractory harzburgites and dunites) underthick basaltic plateaux5,16,17. Partial melting of these thick basaltic crusts, atdepths .40 km, further differentiates the crust into tonalite–trondjemite–granodiorite (TTG) and restitic material16,18.
First-order calculations show that the horizontal gravitational forceacting between a continent 200 km thick and adjacent oceanic lithosphereis of the order of 1013 N m21 (see Extended Data Fig. 1), comparable to
that of present-day tectonic forces driving orogenesis1. To explore thetectonic impact of a thick and buoyant continent surrounded by a stag-nant lithospheric lid, we produced a series of two-dimensional thermo-mechanical numerical models of the top 700 km of the Earth, usingtemperature-dependent densities and visco-plastic rheologies that dependon temperature, melt fraction and depletion, stress and strain rate (seeMethods). The initial temperature field is the horizontally averaged tem-perature profile of a stagnant-lid convection calculation for a mantle,200 K hotter than at present (Fig. 1A, a and Extended Data Fig. 2). Theabsence of lateral temperature gradients ensures that no convective stressesact on the lid, allowing us to isolate the dynamic effects of the continent.A buoyant and stiff continent 225 km thick (strongly depleted mantleroot 170 km thick overlain by felsic crust 40 km thick; see Fig. 1B, a) isinserted within the lid, on the left side of the domain to exploit the sym-metry of the problem (Fig. 1A, a). A mafic crust 15 km thick covers thewhole system (Fig. 1A, a), consistent with the common occurrence ofthick greenstone covers on continents, as well as thick basaltic crust onthe oceanic lid3.
Our numerical solutions show that the presence of a buoyant con-tinent imparts a horizontal force large enough to induce a long period(,50–150 Myr) of slow collapse of the whole continental lithosphere(Fig. 1 and Extended Data Fig. 3), in agreement with the dynamics ofspreading for gravity currents19. Hence, a continent of larger volume leadsto larger gravitational power and faster collapse. Because of lateral spread-ing of the continent, the adjacent lithospheric lid is slowly pushed underits margin (Fig. 1A, b and Extended Data Fig. 3A, a). For gravitationalstress lower than the yield stress of the oceanic lid, thickening of the marginof the lid is slow, and viscous drips (that is, Rayleigh–Taylor instabilities)detach from its base (Extended Data Fig. 3A, a and b). These instabilities,typical of stagnant-lid convection20, mitigate the thermal thickening ofthe lid.
When gravitational stresses overcome the yield stress of the lithosphericlid, subduction is initiated (Fig. 1A, b and c). Depending on the half-widthof the continent and its density contrast with the adjacent oceanic lid (thatis, its gravitational power) three situations can arise: first, subductioninitiates and stalls (Extended Data Fig. 3b); second, the slab detaches andthe lid stabilizes (Fig. 1A, d and e and Extended Data Fig. 3c); or third,recurrent detachment of the slab continues until recycling of the oceaniclid is completed, followed by stabilization (Extended Data Fig. 3d). Whenthe slab reaches a depth of ,200 km, slab pull contributes to drive sub-duction and rapid rollback of the subducting lid, which in turn promoteslithospheric boudinage and continental rifting (Fig. 1A, c and ExtendedData Fig. 3C, b–d). Through spreading and thinning of the continent,its base rises from 225 km to ,75 km deep on average, and shallowerbetween lithospheric boudins (Figs 1A, d and 2b and Extended DataFig. 3C, c and d and D, b–f). This triggers an episode of deep (,150 km)to shallow (,100 km) decompression melting and progressive deple-tion of the ambient fertile mantle (Figs 2 and 3b). Harzburgites of thecontinental mantle are too refractory to melt on decompression. Poly-baric melting of fertile mantle produces a basalt cover 6 km thick and amantle residue ,75 km thick with an average depletion of 7.5% (Figs 2and 3c). The bulk of depletion occurs during a volcanic episode lasting upto ,13 Myr, although partial melting persists for up to 45 Myr (Fig. 2b).
1Earthbyte Research Group, School of Geosciences, The University of Sydney, Sydney NSW 2006, Australia. 2Laboratoire de Geologie de Lyon, UMR 5276 CNRS, Universite Lyon 1, Ecole NormaleSuperieure de Lyon, 69622 Villeurbanne Cedex, France. 3Institut Universitaire de France, 75005 Paris, France.
1 8 S E P T E M B E R 2 0 1 4 | V O L 5 1 3 | N A T U R E | 4 0 5
Macmillan Publishers Limited. All rights reserved©2014
Continent weakens, spreads laterally
Larger horizontal stresses force subduction of buoyant oceanic lithosphere
Slab detaches, margin stabilizes

1D steady-state heat conduction + production
• Consider the heat flux across a slab of thickness 𝛿𝑦
• The net heat flux is simply the heat flux out minus the heat flux in, or
• Using Taylor series expansion and Fourier’s first law, it can be shown that for constant thermal conductivity 𝑘
23
Fig. 4.5, Turcotte and Schubert, 2014
q(y + �y)� q(y)
q(y + �y)� q(y) = �ydq
dy= �y
d
dy
�k
✓dT
dy
◆�
= �y
�k
✓d2T
dy2
◆�

1D steady-state heat conduction + production
• If we assume the only source of changing the heat flux in the slab is radiogenic heat, we can sayorwhere 𝜌 is rock density
• Assuming 𝑇 = 𝑇0 and 𝑞 = 𝑞0 at 𝑦 = 0, the solution is
24
Fig. 4.5, Turcotte and Schubert, 2014
kd2T
dy2+ ⇢H = 0
⇢H�y = �y
�k
✓d2T
dy2
◆�
T = T0 +q0ky � ⇢H
2ky2
With this equation, we can plot a geotherm, or change in temperature with depth

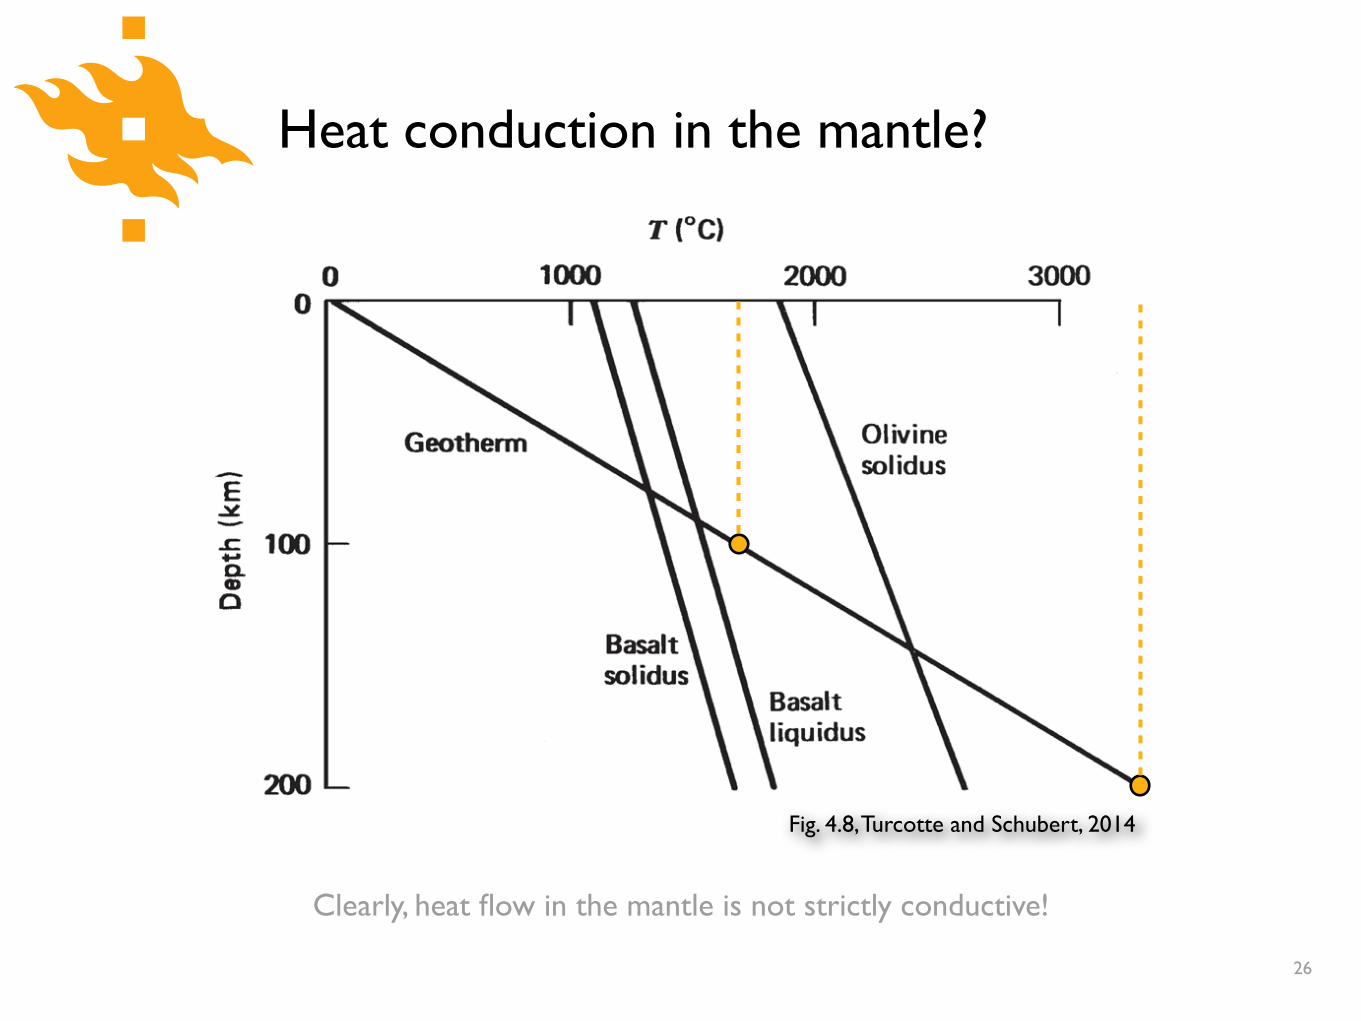
Heat conduction in the mantle?
!
!
• 70 mW m-2 is a reasonable average heat flow value observed at the surface
• If we assume a surface temperature 𝑇0 = 0°C, rock density 𝜌 = 3300 kg m-3, 𝐻 = 7.38 ⨉ 10-12 W kg-1 and 𝑘 = 4 W m-1 K-1, what is the predicted temperature at 100 km depth?
• Does this seem reasonable?
• What about at 200 km depth?
25
T = T0 +q0ky � ⇢H
2ky2
Heat conduction in the mantle?
26
Clearly, heat flow in the mantle is not strictly conductive!
Fig. 4.8, Turcotte and Schubert, 2014

Geotherms in the continental crust
27
With a 40-km-thick crust, you can see that heat production can increase the Moho temperature considerably !!Note, that this model has a constant heat flow basal boundary condition
𝑘 = 2.75 W m-‐1 K-‐1 𝑞m = 20 mW m-‐2
ymax = 40 km
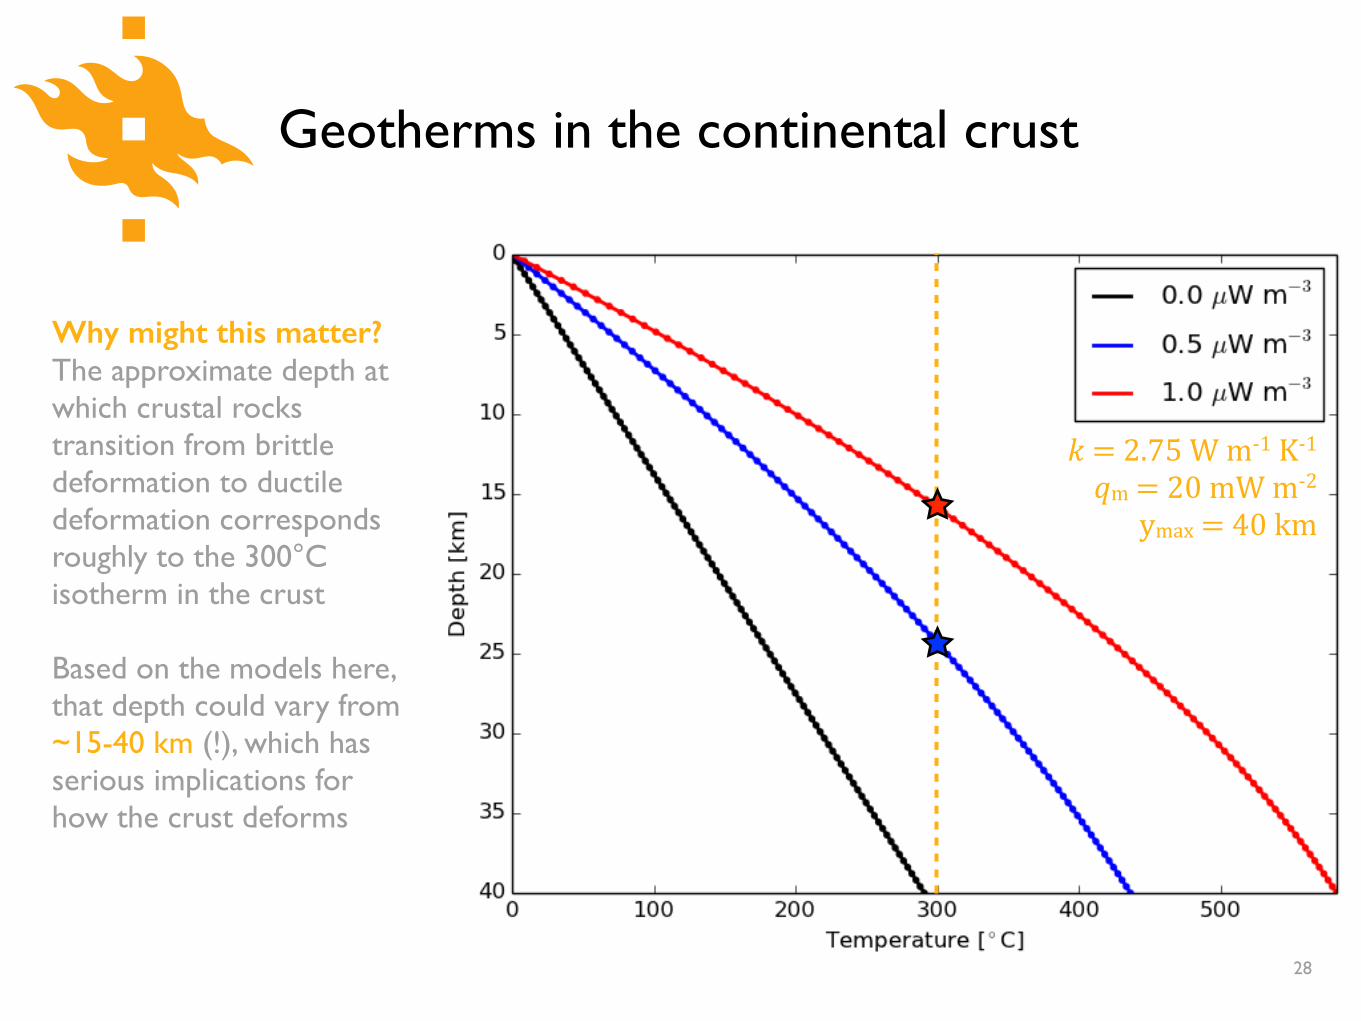
Geotherms in the continental crust
28
Why might this matter? The approximate depth at which crustal rocks transition from brittle deformation to ductile deformation corresponds roughly to the 300°C isotherm in the crust !Based on the models here, that depth could vary from ~15-40 km (!), which has serious implications for how the crust deforms
𝑘 = 2.75 W m-‐1 K-‐1 𝑞m = 20 mW m-‐2
ymax = 40 km

Distribution of heat producing elements
• As we’ve seen, however, the concentration of heat-producing elements is not constant in the crust, but decreases with depth
29
Heat production
Rock type By mass, 𝐻 [W kg
By volume, 𝐴 [W m
By volume, 𝐴 [µW m
Reference undepleated (fer/le) mantle 7.39E-12 2.44E-08 0.024
"Depleated" perido/tes 3.08E-13 1.02E-09 0.001
Tholeii/c basalt 1.49E-11 4.41E-08 0.044
Granite 1.14E-09 3.01E-06 3.008
Shale 7.74E-10 1.86E-06 1.857
Average con/nental crust 3.37E-10 9.26E-07 0.927
Chondri/c meteorites 3.50E-12 1.15E-08 0.012

Geotherms in the continental crust
30
As before, changing the concentration of heat-producing elements shows us something important about how we might expect the crust to deform !Here, we might predict partial (to complete) melting of the crust and very weak rocks if we don’t consider decreasing heat production
𝐴 = 2.5 𝜇W m-‐3 𝑘 = 2.75 W m-‐1 K-‐1 𝑞m = 20 mW m-‐2
ymax = 40 km
Ons
et o
f par
tial
!m
eltin
g of
cru
st

Geotherms in thick continental crust
31
The crust beneath the Tibetan Plateau is thought to be 70-80 km thick resulting from extensive shortening during orogenesis, and it is likely that this over-thickened crust is partially molten at depth as a result of radiogenic heat !How might this affect the plateau topography?
𝐴 = 2.5 𝜇W m-‐3 𝑘 = 2.75 W m-‐1 K-‐1 𝑞m = 20 mW m-‐2
ymax = 80 km
Ons
et o
f par
tial
!m
eltin
g of
cru
st

Geodynamic implications
• We’ve now see that radiogenic heat production can significantly influence the subsurface thermal field, particularly in the crust
• This may influence geodynamic behavior of the deforming crust by affecting the depth of the transition from brittle to ductile deformation, or the potential for partial melting of the crust
• Another important influence on the crustal thermal field is topography at the Earth’s surface
• Why might topography matter?
32

Thermal field beneath periodic topography
• In our calculations of temperatures in the Earth thus far, we’ve assumed a known surface temperature 𝑇0 at 𝑦 = 0
• Atmospheric temperatures decrease with elevation following an atmospheric lapse rate 𝛽 (typical value: 𝛽 = 6.5°C km-1)
• Combined, this suggests surface temperatures should vary with elevation in mountainous regions, an effect we can simulate
• Importantly, this is clearly a 2D problem33

Thermal field beneath periodic topography
• To do this, we compensate for the temperature variations with elevation by scaling the temperature by 𝛥𝑇 at 𝑦 = 0, yieldingwith where 𝑇0 is the surface temperature a sea level in nature, 𝑞m is the mantle heat flux, 𝑘 is thermal conductivity, 𝜌 is density, 𝐻0 is the surface heat production value, ℎr is the e-folding depth for heat production, 𝜆 is the wavelength of the topography and ℎ0 is the amplitude
34
�T =
✓� � qm
k� ⇢H0hr
k
◆h0
T (x, y) = T0 +qmy
k+
⇢H0h2r
k
⇣1� e�y/hr
⌘+�T cos
2⇡x
�e�2⇡y/�

Thermal field beneath periodic topography
35
𝐴 = 2.5 𝜇W m-‐3 ℎr = 10 km 𝑘 = 2.75 W m-‐1 K-‐1 𝑞m = 20 mW m-‐2 ℎ0 = 4 km 𝜆 = ??? km 𝛽 = 6.5°C km-‐1

Thermal field beneath periodic topography
36
𝐴 = 2.5 𝜇W m-‐3 ℎr = 10 km 𝑘 = 2.75 W m-‐1 K-‐1 𝑞m = 20 mW m-‐2 ℎ0 = 4 km 𝜆 = ??? km 𝛽 = 6.5°C km-‐1

Thermal field beneath topography
• Topography can influence the geometry of the thermal field beneath it, particularly as the relief and wavelength grow
• The depth of the perturbation is related to the wavelength, with longer wavelengths affecting deeper crustal levels
!
• This has important implications for data that depend on the thermal structure of mountainous regions, such as low-temperature thermochronology data
37
Recap
• Heat conduction, or diffusion, is the process by which molecular or elemental interactions transfer energy to neighboring particles
!
• Heat conduction is dominantly controlled by rock material properties, such as the thermal conductivity or radiogenic heat production
!
• The thermal field in the crust plays an important role in determining how the crust deforms
38

References
Rey, P. F., Coltice, N., & Flament, N. (2015). Spreading continents kick-started plate tectonics. Nature, 513(7518), 405–408. doi:10.1038/nature13728
!Rosenberg, C. L., Medvedev, S. & Handy, M. (2007) Effects of melting on faulting and continental deformation.
In: The Dynamics of Fault Zones, edited by M. R. Handy, G. Hirth, N. Hovius. Dahlem Workshop Report 95, The MIT Press, Cambridge, Mass., USA, 357-401.
39