1.6 Probability 9.7 Probability of Multiple Events 12.2 Conditional Probability.
Lecture 5: Basic Probability Theory
Donglei Du([email protected])
Faculty of Business Administration, University of New Brunswick, NB Canada FrederictonE3B 9Y2
Donglei Du (UNB) ADM 2623: Business Statistics 1 / 55
Table of contents
1 Probability TheoryWhat is probability?Random Experiment (RE)Set/events operationsHow to Interpret Probabilities?Rules of Counting
Donglei Du (UNB) ADM 2623: Business Statistics 2 / 55
Layout
1 Probability TheoryWhat is probability?Random Experiment (RE)Set/events operationsHow to Interpret Probabilities?Rules of Counting
Donglei Du (UNB) ADM 2623: Business Statistics 3 / 55
What is probability?
Probability is a measure of the likelihood that an event in the futurewill happen.
It can only assume a value between 0 and 1;A value near zero means the event is not likely to happen;A value near one means it is likely to happen.
Donglei Du (UNB) ADM 2623: Business Statistics 4 / 55
Random Experiment (RE)
RE is a process that satisfies the following propositions:
the process can be repeated as many trials as you wantthe outcome of any trial is uncertainwell-defined set of possible outcomeseach outcome has a probability associated with it
Donglei Du (UNB) ADM 2623: Business Statistics 5 / 55
An example
Toss a coin once:
This process can be repeated as many times as you want (repetitivenature)Nobody knows whether Head or Tail will appear in any particulartossing (uncertain outcome)However, we know either Head or Tail must appear (Well-definedsample space)Now what is the chance you will get a Head if you toss a coin now?
Donglei Du (UNB) ADM 2623: Business Statistics 6 / 55
Some Terminologies
Outcome: is a particular result of a random experiment
Sample Space: is the collection or set of all the possible outcomes ofa random experiment
Event: is the collection of one or more outcomes of an experiment
Donglei Du (UNB) ADM 2623: Business Statistics 7 / 55
Example
Toss one coin in very trial
The sample space is S = {H, T}.An event is the occurrence of head: E = {h}.
Flip two coins in very trial
The sample space has two outcomesS = {(H,H), (H,T), (T,H), (T,T)}.An event is the occurrence of a head in the first coin:E = {(H,H), (H,T )}
Roll one die in very trial
The sample space contains 6 outcomes S = {1, . . . , 6}.An event is the occurrence of an even number: E = {2, 4, 6}.
Roll two dice in very trial
The sample space contains the 36 outcomes S = {(1, 1), . . . , (6, 6)}.An event is the occurrence of two dice with sum equal to 4:E = {(1, 3), (2, 2), (3, 1)}
Donglei Du (UNB) ADM 2623: Business Statistics 8 / 55

Venn Diagram
A Venn diagram or set diagram is a diagram that shows all possiblelogical relations between a finite collection of sets.
The Venn diagram for the above die example.
1 3 5
2 4 6
Donglei Du (UNB) ADM 2623: Business Statistics 9 / 55
An example
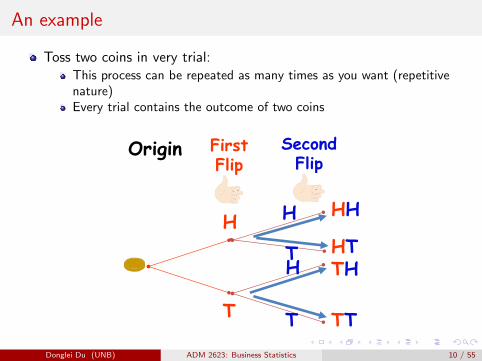
Toss two coins in very trial:This process can be repeated as many times as you want (repetitivenature)Every trial contains the outcome of two coins
Origin First Flip
SecondFlipp
H HH
p
H H
T
HH
HTTH
HTTH
T T TT
2013/9/16 Donglei Du: Lecture 1 1
Donglei Du (UNB) ADM 2623: Business Statistics 10 / 55

Set operations
Union
Intersection:
Complement:
Donglei Du (UNB) ADM 2623: Business Statistics 11 / 55
Union
BASpace Sample
A BA B
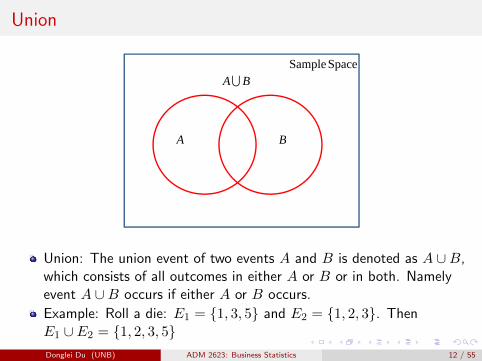
Union: The union event of two events A and B is denoted as A ∪B,which consists of all outcomes in either A or B or in both. Namelyevent A ∪B occurs if either A or B occurs.
Example: Roll a die: E1 = {1, 3, 5} and E2 = {1, 2, 3}. ThenE1 ∪ E2 = {1, 2, 3, 5}Donglei Du (UNB) ADM 2623: Business Statistics 12 / 55
Intersection
Space Sample
A BBAA BBA
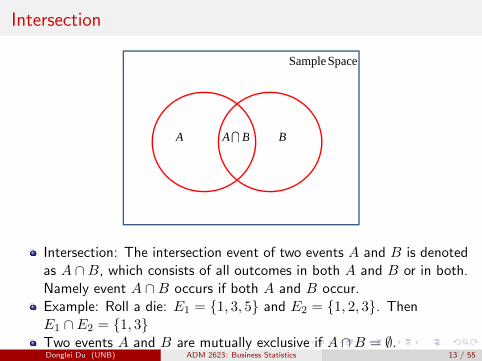
Intersection: The intersection event of two events A and B is denotedas A ∩B, which consists of all outcomes in both A and B or in both.Namely event A ∩B occurs if both A and B occur.Example: Roll a die: E1 = {1, 3, 5} and E2 = {1, 2, 3}. ThenE1 ∩ E2 = {1, 3}Two events A and B are mutually exclusive if A ∩B = ∅.Donglei Du (UNB) ADM 2623: Business Statistics 13 / 55
Complement
Space Sample
A AA A
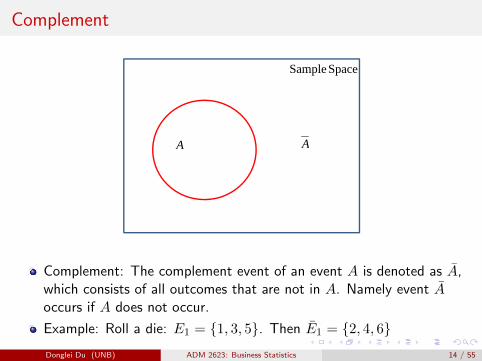
Complement: The complement event of an event A is denoted as A,which consists of all outcomes that are not in A. Namely event Aoccurs if A does not occur.
Example: Roll a die: E1 = {1, 3, 5}. Then E1 = {2, 4, 6}Donglei Du (UNB) ADM 2623: Business Statistics 14 / 55
Probabilities defined on events
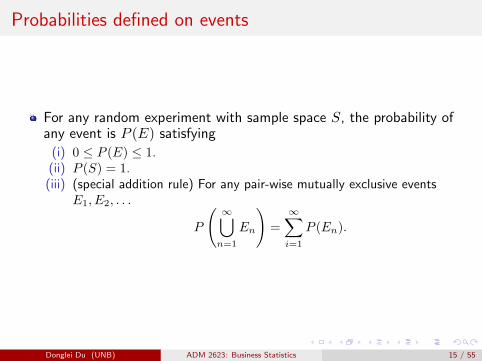
For any random experiment with sample space S, the probability ofany event is P (E) satisfying
(i) 0 ≤ P (E) ≤ 1.(ii) P (S) = 1.(iii) (special addition rule) For any pair-wise mutually exclusive events
E1, E2, . . .
P
( ∞⋃n=1
En
)=
∞∑i=1
P (En).
Donglei Du (UNB) ADM 2623: Business Statistics 15 / 55
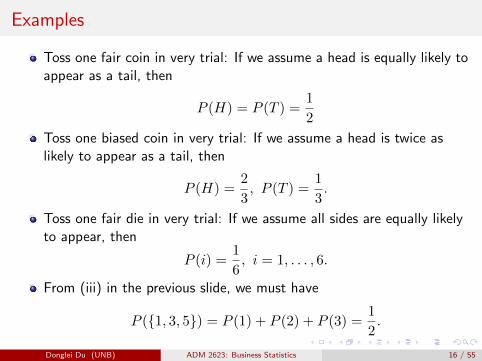
Examples
Toss one fair coin in very trial: If we assume a head is equally likely toappear as a tail, then
P (H) = P (T ) =1
2
Toss one biased coin in very trial: If we assume a head is twice aslikely to appear as a tail, then
P (H) =2
3, P (T ) =
1
3.
Toss one fair die in very trial: If we assume all sides are equally likelyto appear, then
P (i) =1
6, i = 1, . . . , 6.
From (iii) in the previous slide, we must have
P ({1, 3, 5}) = P (1) + P (2) + P (3) =1
2.
Donglei Du (UNB) ADM 2623: Business Statistics 16 / 55
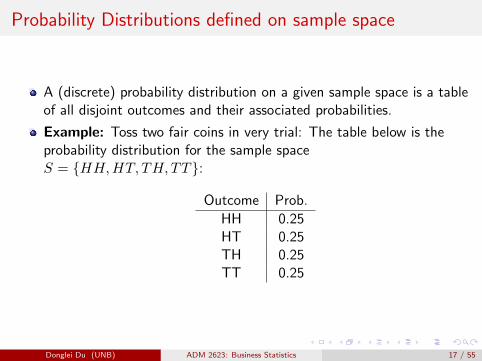
Probability Distributions defined on sample space
A (discrete) probability distribution on a given sample space is a tableof all disjoint outcomes and their associated probabilities.
Example: Toss two fair coins in very trial: The table below is theprobability distribution for the sample spaceS = {HH,HT, TH, TT}:
Outcome Prob.
HH 0.25HT 0.25TH 0.25TT 0.25
Donglei Du (UNB) ADM 2623: Business Statistics 17 / 55
Rule of Probability
Complement Rule
Addition Rule
Multiplication Rule
Donglei Du (UNB) ADM 2623: Business Statistics 18 / 55
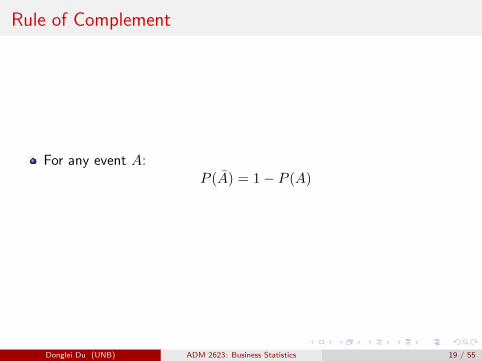
Rule of Complement
For any event A:P (A) = 1− P (A)
Donglei Du (UNB) ADM 2623: Business Statistics 19 / 55
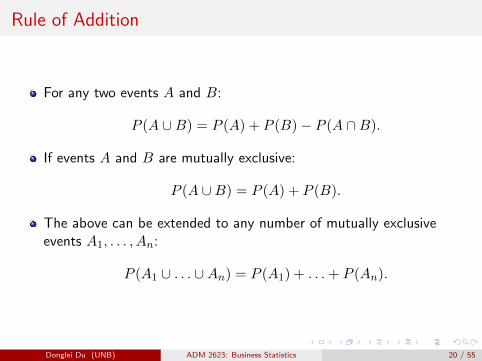
Rule of Addition
For any two events A and B:
P (A ∪B) = P (A) + P (B)− P (A ∩B).
If events A and B are mutually exclusive:
P (A ∪B) = P (A) + P (B).
The above can be extended to any number of mutually exclusiveevents A1, . . . , An:
P (A1 ∪ . . . ∪An) = P (A1) + . . . + P (An).
Donglei Du (UNB) ADM 2623: Business Statistics 20 / 55
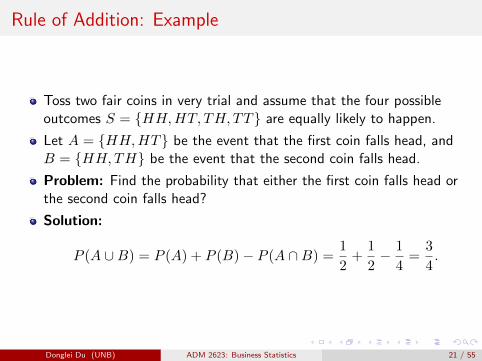
Rule of Addition: Example
Toss two fair coins in very trial and assume that the four possibleoutcomes S = {HH,HT, TH, TT} are equally likely to happen.
Let A = {HH,HT} be the event that the first coin falls head, andB = {HH,TH} be the event that the second coin falls head.
Problem: Find the probability that either the first coin falls head orthe second coin falls head?
Solution:
P (A ∪B) = P (A) + P (B)− P (A ∩B) =1
2+
1
2− 1
4=
3
4.
Donglei Du (UNB) ADM 2623: Business Statistics 21 / 55
Rule of Multiplication
Joint probability
Conditional probability
Donglei Du (UNB) ADM 2623: Business Statistics 22 / 55
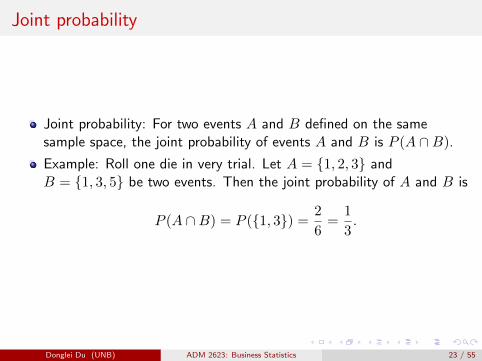
Joint probability
Joint probability: For two events A and B defined on the samesample space, the joint probability of events A and B is P (A ∩B).
Example: Roll one die in very trial. Let A = {1, 2, 3} andB = {1, 3, 5} be two events. Then the joint probability of A and B is
P (A ∩B) = P ({1, 3}) =2
6=
1
3.
Donglei Du (UNB) ADM 2623: Business Statistics 23 / 55
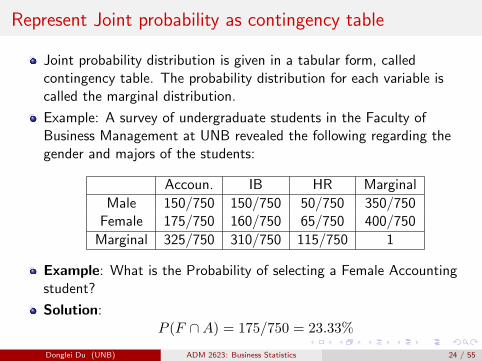
Represent Joint probability as contingency table
Joint probability distribution is given in a tabular form, calledcontingency table. The probability distribution for each variable iscalled the marginal distribution.
Example: A survey of undergraduate students in the Faculty ofBusiness Management at UNB revealed the following regarding thegender and majors of the students:
Accoun. IB HR Marginal
Male 150/750 150/750 50/750 350/750Female 175/750 160/750 65/750 400/750
Marginal 325/750 310/750 115/750 1
Example: What is the Probability of selecting a Female Accountingstudent?
Solution:P (F ∩A) = 175/750 = 23.33%
Donglei Du (UNB) ADM 2623: Business Statistics 24 / 55
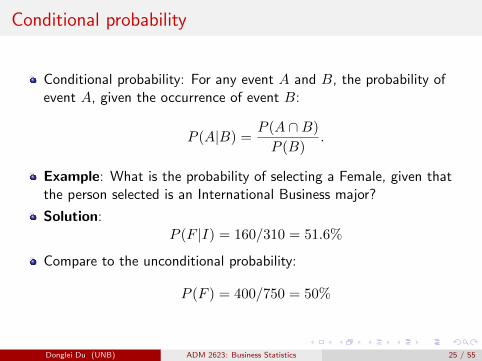
Conditional probability
Conditional probability: For any event A and B, the probability ofevent A, given the occurrence of event B:
P (A|B) =P (A ∩B)
P (B).
Example: What is the probability of selecting a Female, given thatthe person selected is an International Business major?
Solution:P (F |I) = 160/310 = 51.6%
Compare to the unconditional probability:
P (F ) = 400/750 = 50%
Donglei Du (UNB) ADM 2623: Business Statistics 25 / 55
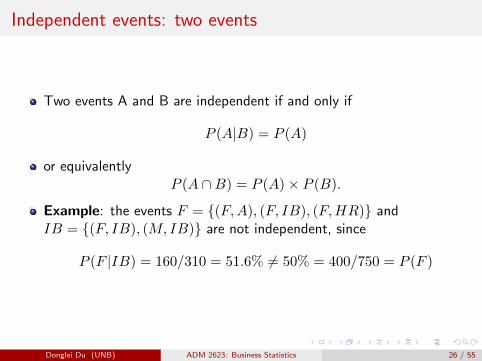
Independent events: two events
Two events A and B are independent if and only if
P (A|B) = P (A)
or equivalentlyP (A ∩B) = P (A)× P (B).
Example: the events F = {(F,A), (F, IB), (F,HR)} andIB = {(F, IB), (M, IB)} are not independent, since
P (F |IB) = 160/310 = 51.6% 6= 50% = 400/750 = P (F )
Donglei Du (UNB) ADM 2623: Business Statistics 26 / 55
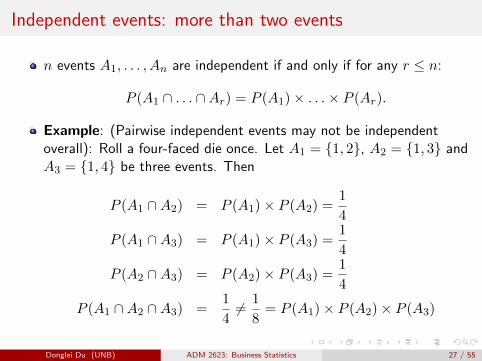
Independent events: more than two events
n events A1, . . . , An are independent if and only if for any r ≤ n:
P (A1 ∩ . . . ∩Ar) = P (A1)× . . .× P (Ar).
Example: (Pairwise independent events may not be independentoverall): Roll a four-faced die once. Let A1 = {1, 2}, A2 = {1, 3} andA3 = {1, 4} be three events. Then
P (A1 ∩A2) = P (A1)× P (A2) =1
4
P (A1 ∩A3) = P (A1)× P (A3) =1
4
P (A2 ∩A3) = P (A2)× P (A3) =1
4
P (A1 ∩A2 ∩A3) =1
46= 1
8= P (A1)× P (A2)× P (A3)
Donglei Du (UNB) ADM 2623: Business Statistics 27 / 55

Rule of Multiplication
For any two events A and B:
P (A ∩B) = P (A|B)P (B).
The above can be extended to any number of events A1, . . . , An:
P (A1 ∩ . . . ∩An) = P (A1)P (A2|A1) . . . P (An|A1 ∩ . . . ∩An−1).
If events A and B are independent:
P (A ∩B) = P (A)P (B).
The above can be extended to any number of independent eventsA1, . . . , An:
P (A1 ∩ . . . ∩An) = P (A1) . . . P (An).
Donglei Du (UNB) ADM 2623: Business Statistics 28 / 55
Rule of Multiplication: Example
Example: Draw three cards with replacement i.e., draw one card,look at it, put it back, and repeat twice more.
Problem: Find the probability of drawing 3 Queens in a row:
Solution: Let Qi (i = 1, 2, 3) be the event that ith draw gives you aQueen. Then the three events are independent of each other.
P (Q1 ∩Q2 ∩Q3) = P (Q1)P (Q2)P (Q3) =4
52× 4
52× 4
52≈ 0.00046.
Donglei Du (UNB) ADM 2623: Business Statistics 29 / 55
Rule of Multiplication: Example
Example: Draw three cards without replacement i.e., draw one card,look at it, keep it, and repeat twice more.
Problem: Find the probability of drawing 3 Queens in a row:
Solution: Let Qi (i = 1, 2, 3) be the event that ith draw gives you aQueen. Then the three events are dependent of each other.
P (Q1 ∩Q2 ∩Q3) = P (Q1)P (Q2|Q1)P (Q3|Q1 ∩Q2)
=4
52× 3
51× 2
50≈ 0.00018.
Donglei Du (UNB) ADM 2623: Business Statistics 30 / 55
More examples on rules of probability
Example: Draw one card from a deck of 52 cards
Problem: What is the probability of getting a red card or a Queen?
Solution:
P (R ∪Q) = P (R) + P (Q)− P (R ∩Q) =26 + 4− 2
52=
7
13≈ 0.538
Donglei Du (UNB) ADM 2623: Business Statistics 31 / 55
More examples on rules of probability
Example: Two men throw their identical hats into the center of theroom at a party. Then the hats are mixed up and each man randomlyselects a hat.
Problem: What is the probability that none of them selects his ownhat.
Solution: Let Ai (i = 1, 2) be the event that the ith man selects hisown hat. Then the desired probability can be calculated via thecomplement rule. The complement event is that at least one manselects his own hat:
P (A1 ∪A2) = P (A1) + P (A2)− P (A1 ∩A2)
= 0.5 + 0.5− P (A1)P (A2|A1) = 1− 0.5(1) = 0.5
Therefore none of them selects his own hat is
P(A1 ∪A2
)= 1− P (A1 ∪A2) = 1− 0.5 = 0.5
Donglei Du (UNB) ADM 2623: Business Statistics 32 / 55
Another method for solving the above problem
Solution: Let Ai (i = 1, 2) be the event that the ith man selects hisown hat. Therefore none of them selects his own hat is
P(A1 ∩ A2
)= P (A1)P (A2|A1) = 0.5(1) = 0.5.
Donglei Du (UNB) ADM 2623: Business Statistics 33 / 55
Bayes’ Theorem
Sample SpaceSample Space
BA 1 BA 2 BAn 1 2 n
1A 2A nA……1A 2A n
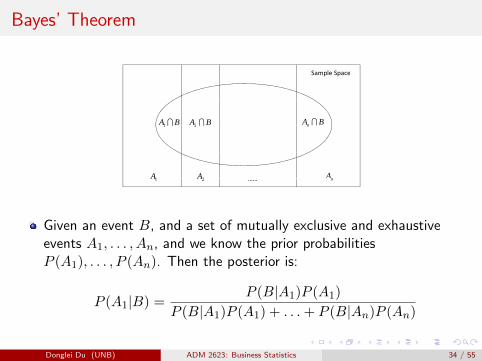
Given an event B, and a set of mutually exclusive and exhaustiveevents A1, . . . , An, and we know the prior probabilitiesP (A1), . . . , P (An). Then the posterior is:
P (A1|B) =P (B|A1)P (A1)
P (B|A1)P (A1) + . . . + P (B|An)P (An)
Donglei Du (UNB) ADM 2623: Business Statistics 34 / 55
Bayes’ Theorem: Example
Example: 25 percent of residents in an area leaves their garage doorsopen when they left their home. The chances of being raided are 5percent and 1 percent for those who leave their doors open, and whodo not leave their doors open, respectively.
Problem: Suppose one resident was robbed, what is the probabilitythat he or she originally left his or her door open?
Solution: Let B = robbed residents, A1 = open doors residents, A2
= close door residents. We know that P (A1) = 0.25, P (A2) = 0.75,P (B|A1) = 0.05, P (B|A2) = 0.01.
Donglei Du (UNB) ADM 2623: Business Statistics 35 / 55
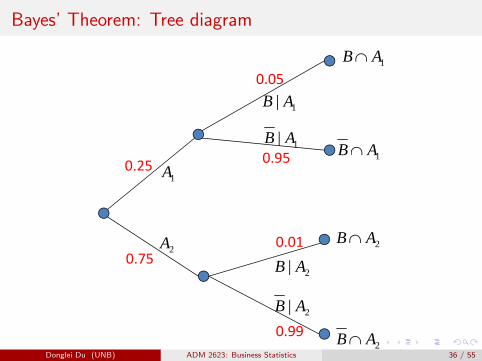
Bayes’ Theorem: Tree diagram
1AB0.05
1| AB
1| AB
1|1AB
0.25 0.951A
| AB2AB
0 750.012A
2| AB
2| AB0.75
2AB0.99Donglei Du (UNB) ADM 2623: Business Statistics 36 / 55
Bayes’ Theorem: Example
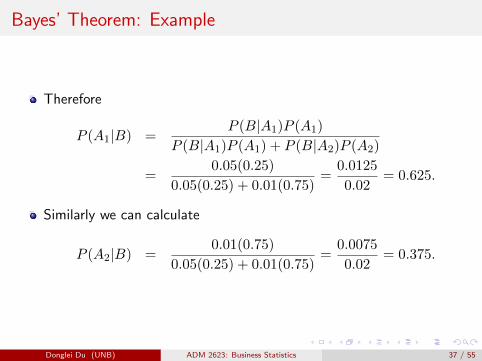
Therefore
P (A1|B) =P (B|A1)P (A1)
P (B|A1)P (A1) + P (B|A2)P (A2)
=0.05(0.25)
0.05(0.25) + 0.01(0.75)=
0.0125
0.02= 0.625.
Similarly we can calculate
P (A2|B) =0.01(0.75)
0.05(0.25) + 0.01(0.75)=
0.0075
0.02= 0.375.
Donglei Du (UNB) ADM 2623: Business Statistics 37 / 55
Bayes’ Theorem: Example
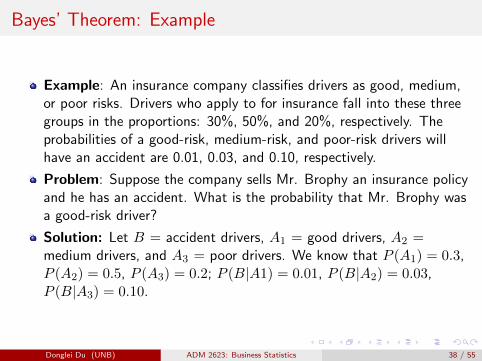
Example: An insurance company classifies drivers as good, medium,or poor risks. Drivers who apply to for insurance fall into these threegroups in the proportions: 30%, 50%, and 20%, respectively. Theprobabilities of a good-risk, medium-risk, and poor-risk drivers willhave an accident are 0.01, 0.03, and 0.10, respectively.
Problem: Suppose the company sells Mr. Brophy an insurance policyand he has an accident. What is the probability that Mr. Brophy wasa good-risk driver?
Solution: Let B = accident drivers, A1 = good drivers, A2 =medium drivers, and A3 = poor drivers. We know that P (A1) = 0.3,P (A2) = 0.5, P (A3) = 0.2; P (B|A1) = 0.01, P (B|A2) = 0.03,P (B|A3) = 0.10.
Donglei Du (UNB) ADM 2623: Business Statistics 38 / 55

Bayes’ Theorem: Tree diagram
1AB0.01
1| AB
1| AB
AB
A1
1AB
0.30.99
2AB0 03
0.5| A
2| AB2AB0.03
A2
2| AB
2AB0.97
0 2A3
3| AB3AB
0.100.2
3| AB
3AB0.90
2013/9/17 Donglei Du: Lecture 1 1
3AB
Donglei Du (UNB) ADM 2623: Business Statistics 39 / 55
Bayes’ Theorem: Example
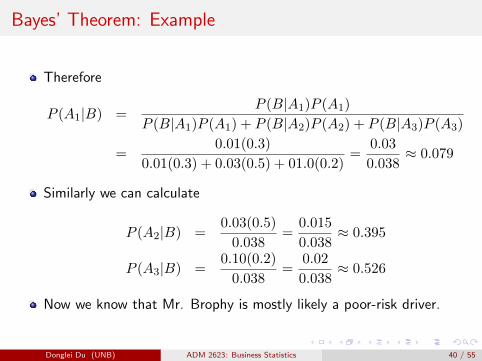
Therefore
P (A1|B) =P (B|A1)P (A1)
P (B|A1)P (A1) + P (B|A2)P (A2) + P (B|A3)P (A3)
=0.01(0.3)
0.01(0.3) + 0.03(0.5) + 01.0(0.2)=
0.03
0.038≈ 0.079
Similarly we can calculate
P (A2|B) =0.03(0.5)
0.038=
0.015
0.038≈ 0.395
P (A3|B) =0.10(0.2)
0.038=
0.02
0.038≈ 0.526
Now we know that Mr. Brophy is mostly likely a poor-risk driver.
Donglei Du (UNB) ADM 2623: Business Statistics 40 / 55
How to Interpret Probabilities
There are two ways to Interpret probability:
ObjectivistsSubjectivists
Donglei Du (UNB) ADM 2623: Business Statistics 41 / 55
How to Interpret Probabilities: Objectivists
Objectivists: assign numbers to describe some objective or physicalstate of affairs.
The most popular version of objective probability is frequentistprobability, which claims that the probability of a random eventdenotes the relative frequency of occurrence of an experiment’soutcome, when repeating the experiment. This interpretationconsiders probability to be the relative frequency ”in the long run” ofoutcomes.
Donglei Du (UNB) ADM 2623: Business Statistics 42 / 55
How to Interpret Probabilities: Subjectivists
Subjectivists: assign numbers per subjective probability, i.e., as adegree of belief.
The most popular version of subjective probability is Bayesianprobability, which includes expert knowledge as well as experimentaldata to produce probabilities. The expert knowledge is represented bysome (subjective) prior probability distribution. The data isincorporated in a likelihood function. The product of the prior andthe likelihood, normalized, results in a posterior probabilitydistribution that incorporates all the information known to date.
Donglei Du (UNB) ADM 2623: Business Statistics 43 / 55
Rules of Counting
Multiplication Rule
Permutation Rule
Combination Rule
Donglei Du (UNB) ADM 2623: Business Statistics 44 / 55
Multiplication Rule
If one thing can be done in M ways, and if after this is done,something else can be done in N ways, then both things can be donein a total of M*N different ways in that stated order!
Donglei Du (UNB) ADM 2623: Business Statistics 45 / 55
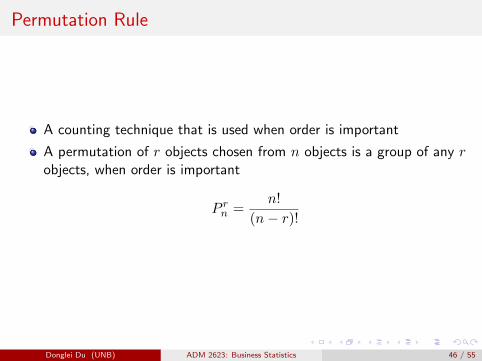
Permutation Rule
A counting technique that is used when order is important
A permutation of r objects chosen from n objects is a group of any robjects, when order is important
P rn =
n!
(n− r)!
Donglei Du (UNB) ADM 2623: Business Statistics 46 / 55
Example
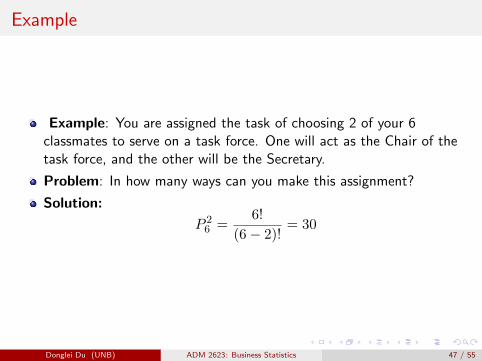
Example: You are assigned the task of choosing 2 of your 6classmates to serve on a task force. One will act as the Chair of thetask force, and the other will be the Secretary.
Problem: In how many ways can you make this assignment?
Solution:
P 26 =
6!
(6− 2)!= 30
Donglei Du (UNB) ADM 2623: Business Statistics 47 / 55

Combination Rule
A counting technique that is used when order is NOT important
A combination of r objects chosen from n objects is a group of any robjects, when order is not important
Crn =
n!
r!(n− r)!
Donglei Du (UNB) ADM 2623: Business Statistics 48 / 55
Example
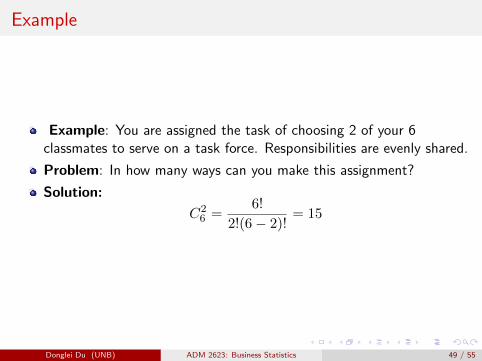
Example: You are assigned the task of choosing 2 of your 6classmates to serve on a task force. Responsibilities are evenly shared.
Problem: In how many ways can you make this assignment?
Solution:
C26 =
6!
2!(6− 2)!= 15
Donglei Du (UNB) ADM 2623: Business Statistics 49 / 55
The Twin Paradox (Probabilistic Pigeonhole Principle)
Example: The Statistics Professor wants to play a little game withhis students. “I bet that there are two of you who have the samebirthday! What do you think”.
Several students reply immediately: “There are 366 possiblebirthdays, so you could only conclude this if there were at least 367 ofus in the class! But there are only 50 of us, and so you would lose thebet for sure!”
Problem: Let us calculate the probability of winning by the professor.
Donglei Du (UNB) ADM 2623: Business Statistics 50 / 55
The Twin Paradox (Probabilistic Pigeonhole Principle)
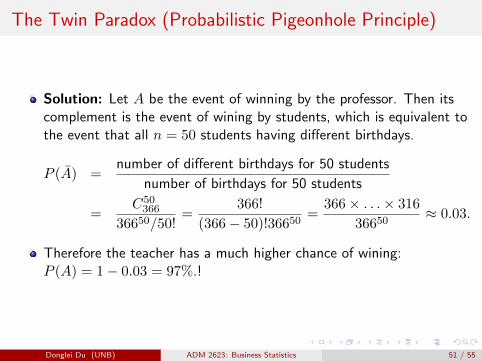
Solution: Let A be the event of winning by the professor. Then itscomplement is the event of wining by students, which is equivalent tothe event that all n = 50 students having different birthdays.
P (A) =number of different birthdays for 50 students
number of birthdays for 50 students
=C50366
36650/50!=
366!
(366− 50)!36650=
366× . . .× 316
36650≈ 0.03.
Therefore the teacher has a much higher chance of wining:P (A) = 1− 0.03 = 97%.!
Donglei Du (UNB) ADM 2623: Business Statistics 51 / 55
The Twin Paradox (Probabilistic Pigeonhole Principle)
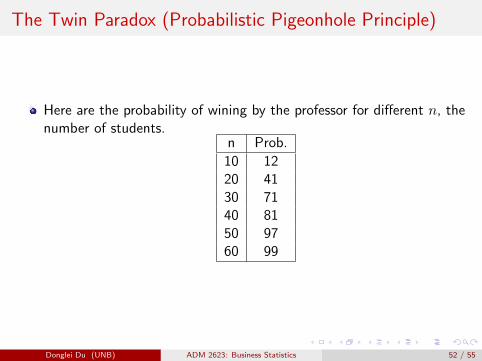
Here are the probability of wining by the professor for different n, thenumber of students.
n Prob.
10 1220 4130 7140 8150 9760 99
Donglei Du (UNB) ADM 2623: Business Statistics 52 / 55

Case: conditional probability and market directionprediction
G*#2)354"?+67"@#/3)"J;3*I6"
K"#$"!B"K"####$$$$"!!!!BBBB"
@1A"BCD"BE!F"
K"#$"%"
Probability of consecutive up or down price moves
Data: S&P 500 from
Jan 1950 to May 2015
Figure: Probability of consecutive up and down price movements
Donglei Du (UNB) ADM 2623: Business Statistics 53 / 55
Case: conditional probability and market directionprediction
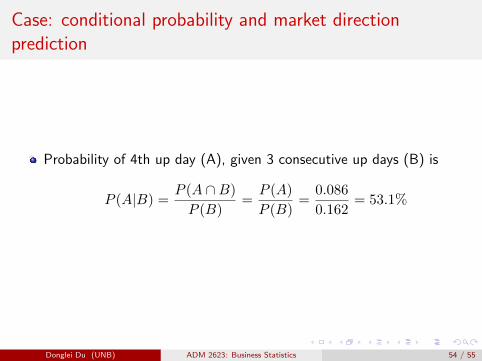
Probability of 4th up day (A), given 3 consecutive up days (B) is
P (A|B) =P (A ∩B)
P (B)=
P (A)
P (B)=
0.086
0.162= 53.1%
Donglei Du (UNB) ADM 2623: Business Statistics 54 / 55

Case: conditional probability and market directionprediction
G*#2)354"?+67"@#/3)"J;3*I6"
Q"#$"!B"Q"####$$$$"!!!!BBBB"
@1A"BCD"BE!F"
Q"#$"%"
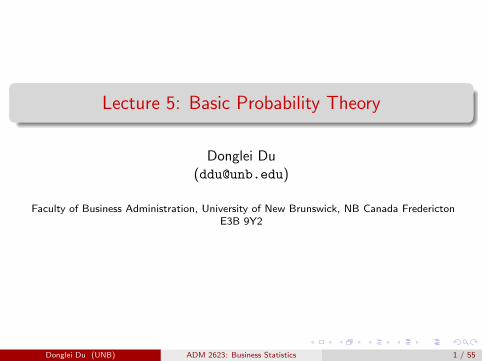
The probabilities
are all roughly
53% – which is
the same as the
probability of
having a
‘normal’ up day.
G*#212+)+034"#$"@1*:36"@#;34"
Figure: Probability of consecutive up and down price movements
Donglei Du (UNB) ADM 2623: Business Statistics 55 / 55