Lecture 3: Solutions: Activities and Phase...
37
Lecture 3: Solutions: Activities and Phase Diagrams 21-09-2010 • Lecture plan: – Gibbs phase rule – vapour composition – two-component phase diagrams – phase diagrams in material science: • microstructures in isomorphous binary systems • microstructures in eutectic alloys • liquid crystals – problems
Transcript of Lecture 3: Solutions: Activities and Phase...
Lecture 3: Solutions: Activities and Phase Diagrams
21-09-2010
• Lecture plan:– Gibbs phase rule– vapour composition– two-component phase diagrams– phase diagrams in material science:
• microstructures in isomorphous binary systems• microstructures in eutectic alloys• liquid crystals
– problems

Phase diagrams
iron-carbon diagram
what is the composition (number of phases and their amount and composition) at equilibrium at a given temperature;
what happens to the system when is cools down/heats up
we can predict the structure and the properties of the system at low temperature.
we can understand development and preservation of non-equilibrium structures
design materials of required properties
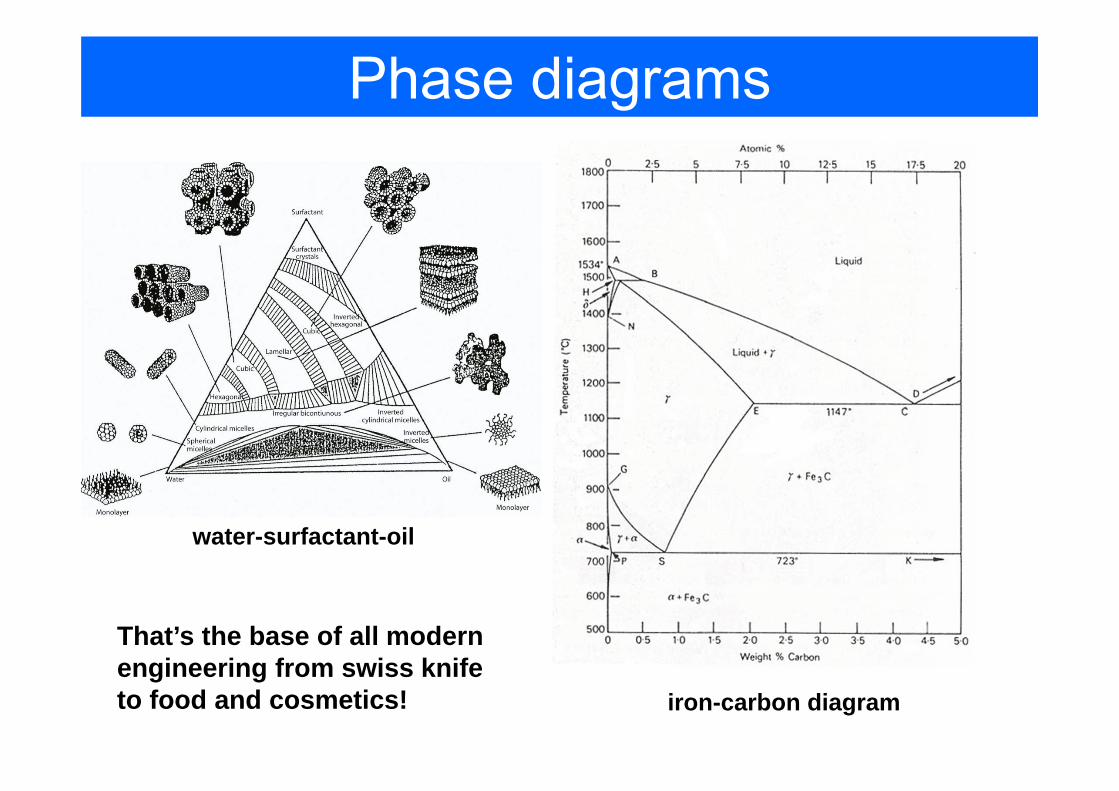
Phase diagrams
iron-carbon diagram
That’s the base of all modern engineering from swiss knife to food and cosmetics!
water-surfactant-oil

Phase diagrams• Constituent – a chemical species that is present• Component – a chemically independent constituent of the system (i.e.
not connected by a chemical reaction)
variance
number of components
number of phases
Indeed: number of variables would be: P*(C-1)+2number of equations: C*(P-1)
• Variance – the number of intensive variables that can be changed independently without disturbing the number of phases at equilibrium.
• Phase rule (J.W. Gibbs):F=C-P+2
3 2( ) ( ) ( )CaCO s CaO s CO g⎯⎯→ +←⎯⎯Phase1 Phase2 Phase3
2C =

One component diagramsC=1 therefore F=C-P+2=3-P

One component diagramsDetection of phase transitions and building a phase diagram is based on calorimetry measurements

Two-components diagramsC=2 therefore F=4-P. We have to reduce degree of freedom e.g. by fixing T=const
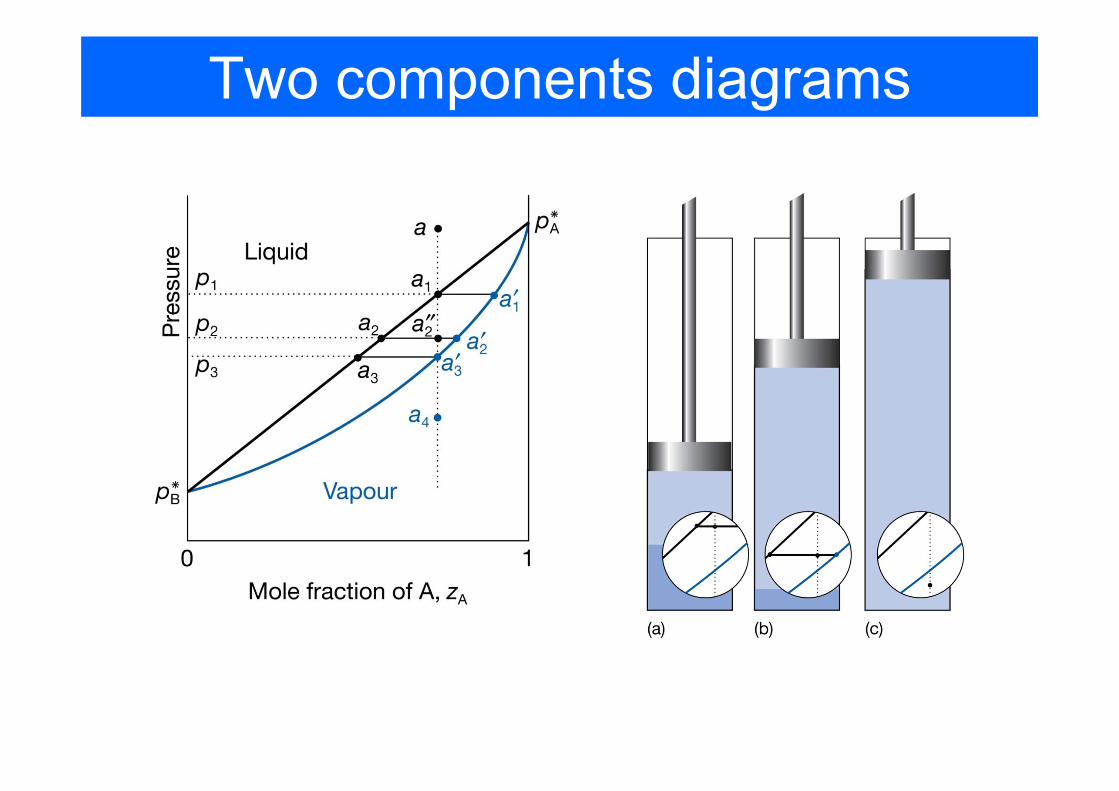
• Vapour pressure diagrams
* *A A A B B Bp x p p x p= =
Raoult’s Law
* * *( )A B B A A Bp p p p x p p= + = + −

Two-components diagrams
• The composition of vapour
From Dalton’s law: ;
*; *
A BA B
A A A B B B
p py yp p
p x p p x p
= =
= =From Raoult’s law:
* ; 1* ( * *)
AA B A
B A B A
py y yp p p x
= = −+ −
*
*A
B
pp

Two components diagrams
Two components diagrams

Two components diagrams
The lever rule
n l n lα α β β=
Relative amount and the composition of phases in equilibrium can be found on the phase diagram
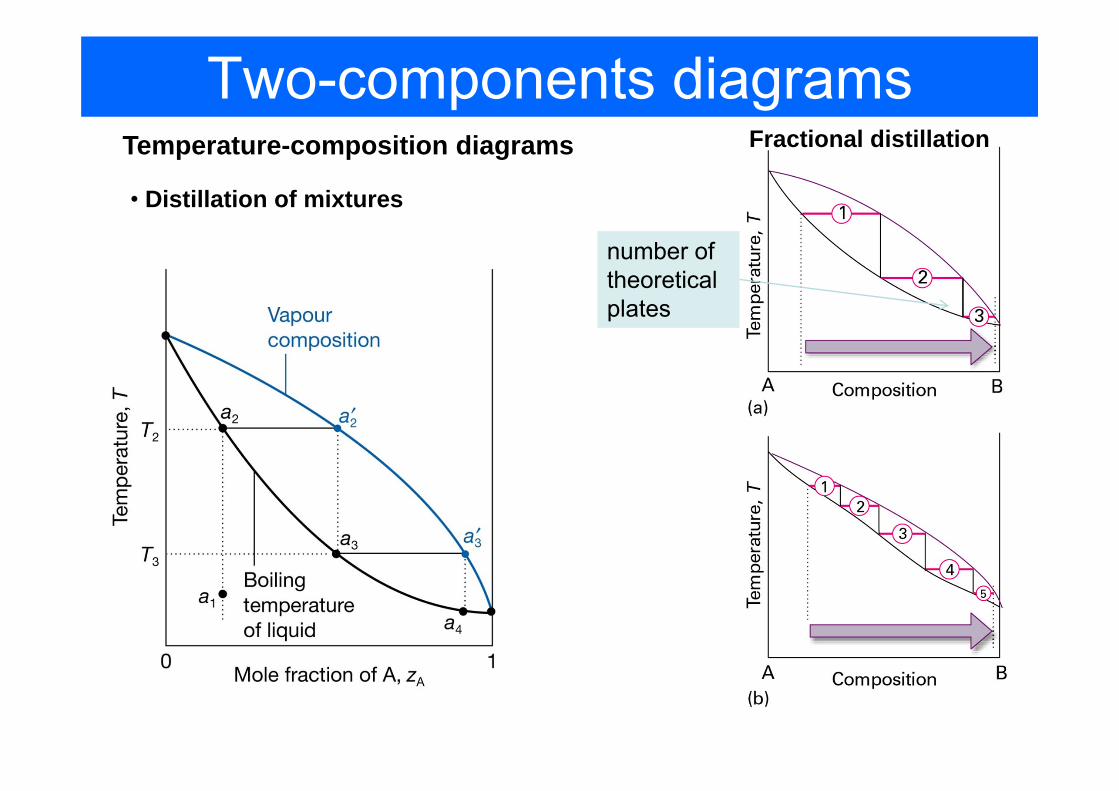
Two-components diagramsTemperature-composition diagrams
• Distillation of mixtures
number of theoretical plates
Fractional distillation

Two-components diagramsTemperature-composition diagrams
•Azeotropes
A-B interacation stabilize the mixture
Azeotrope, evaporation w/o change in composition
n lα α
A-B interacation destabilize the mixture

Two components diagrams
• Immiscible liquids
Will boil at lower temperature!
1A Bp p p atm= + =boiling condition
• can be used for steam distillation of heat sensitive components

Two components diagrams• Liquid-liquid phase diagrams: partially miscible
liquids
hexane nitrobenzene

Two components diagrams
Upper critical solution T
( ln ln )mix A A B B A BG nRT κ κ κ κ βκ κΔ = + +
0 ln (1 2 ) 01mixG
κ β κκ κ∂
Δ = + − =∂ −

Two components diagrams
Lower critical temperature is usually caused by breaking a weak complex of two components

Two components diagrams
Upper critical temperature is less than the boiling point
Boiling occur before liquids are fully miscible
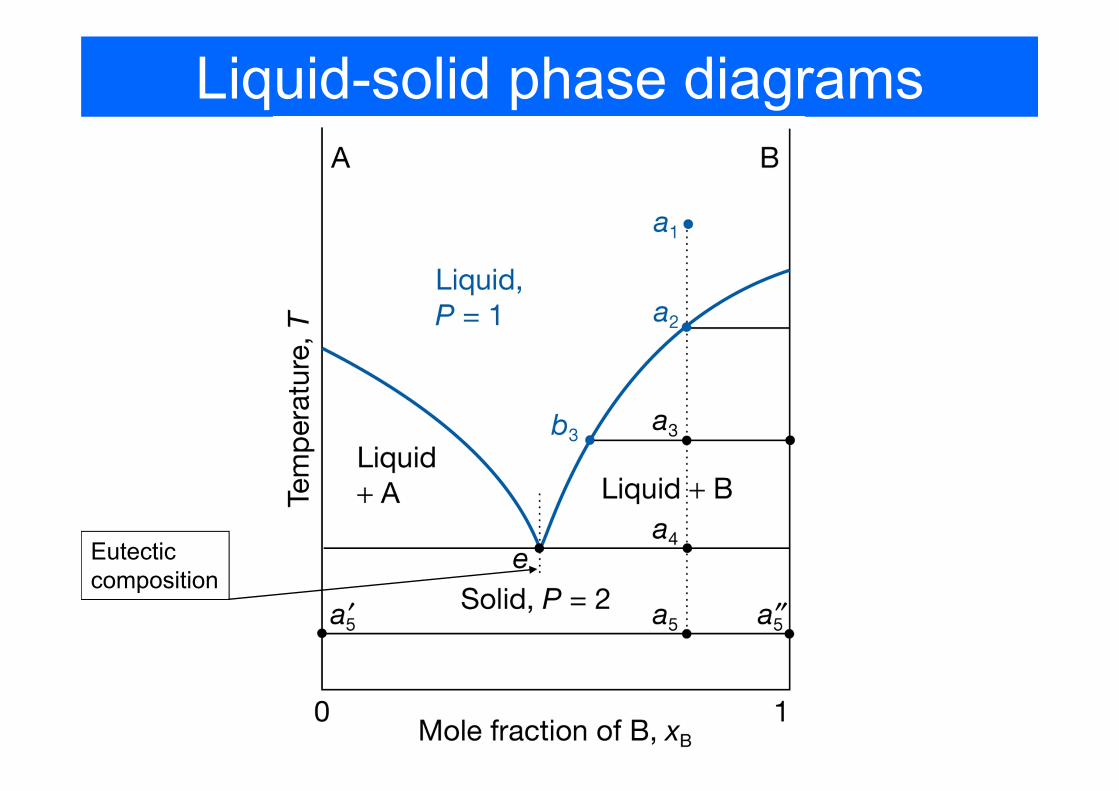
Liquid-solid phase diagrams
Eutectic composition

Liquid-solid phase diagrams
Eutectic halt
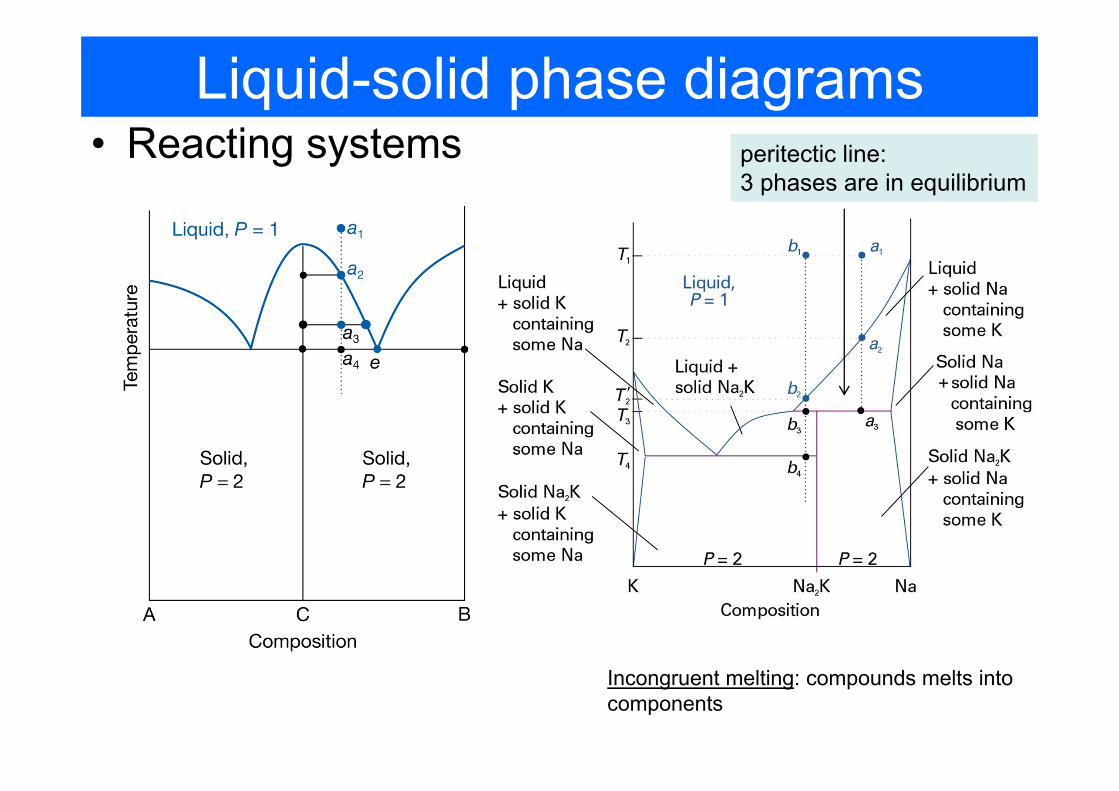
Liquid-solid phase diagrams• Reacting systems
Incongruent melting: compounds melts into components
peritectic line: 3 phases are in equilibrium

Phase diagrams and Microstructure
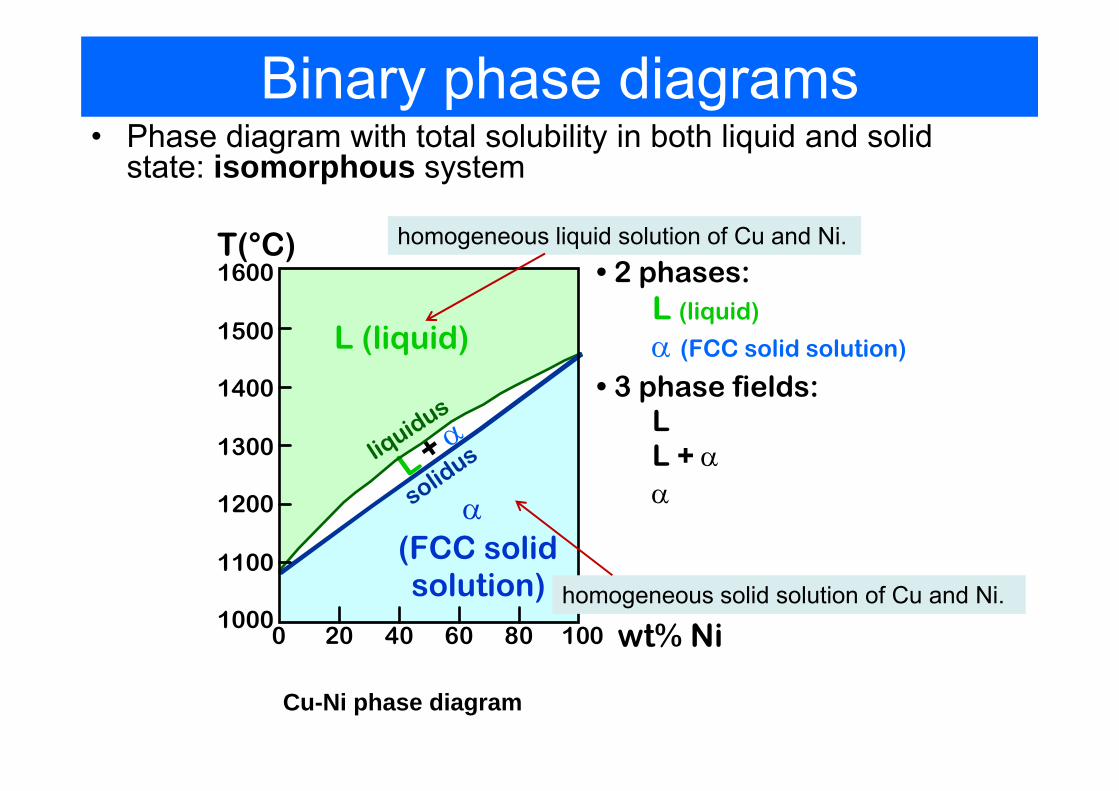
Binary phase diagrams• Phase diagram with total solubility in both liquid and solid
state: isomorphous system
• 2 phases: L (liquid) α (FCC solid solution)
• 3 phase fields: L L + α α
wt% Ni20 40 60 80 10001000
1100
1200
1300
1400
1500
1600T(°C)
L (liquid)
α (FCC solid solution)
L + αliquidus
solidus
Cu-Ni phase diagram
homogeneous liquid solution of Cu and Ni.
homogeneous solid solution of Cu and Ni.

Cu-Ni phase diagram
wt% Ni
20
1200
1300
T(°C)
L (liquid)
α (solid)
L + α
liquidus
solidus
30 40 50
TAA
DTD
TBB
tie line
L + α
433532CoCL Cα
R S
Information we can extract from the diagram:the phases present;composition of the phasespercentage of fraction of the phases
Composition at TB:• Liquid phase (L) of 32% Ni• Solid phase (α) of 43% Ni• Weight ratio:
(43 35); 73%(43 32)
LW S RWW R S Rα
α
−= = = =
+ −
C0=35 wt% Ni
at TA: Only liquid, composition of liquid is given by the overall composition (C0=35 wt% Ni)at TD: Only liquid, composition of liquid is given by the overall composition (C0=35 wt% Ni)at TB: Both L and α are present
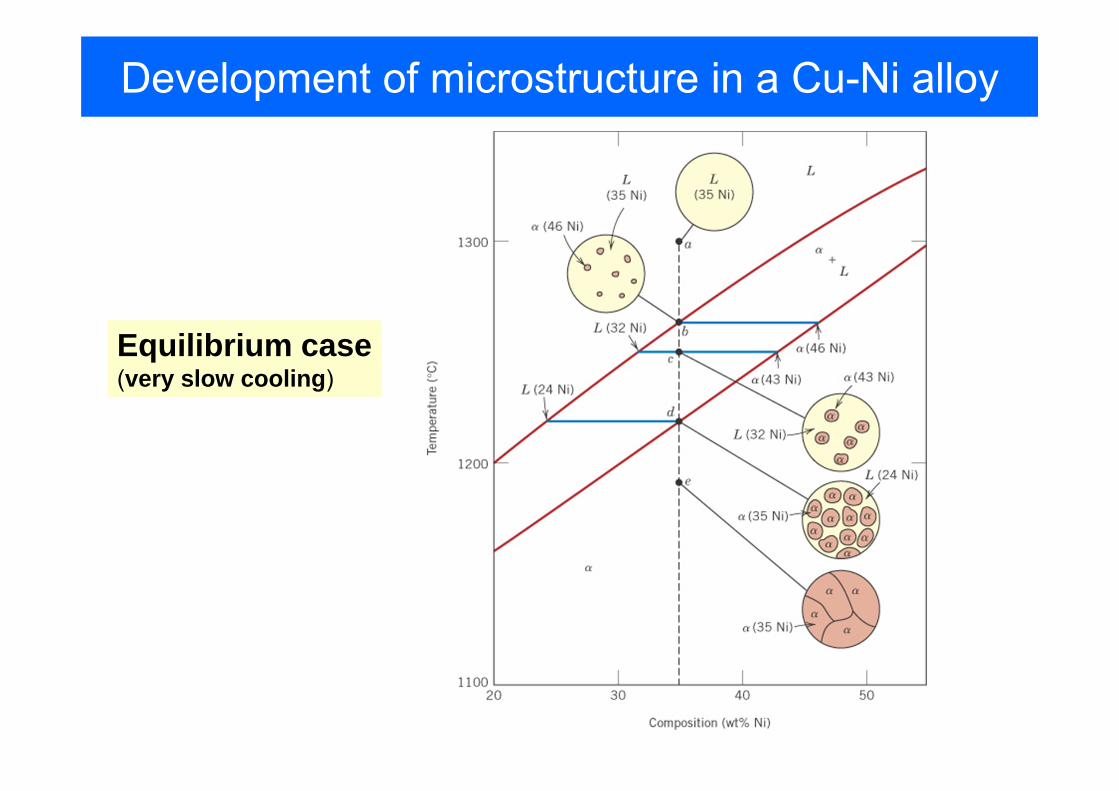
Development of microstructure in a Cu-Ni alloy
Equilibrium case(very slow cooling)
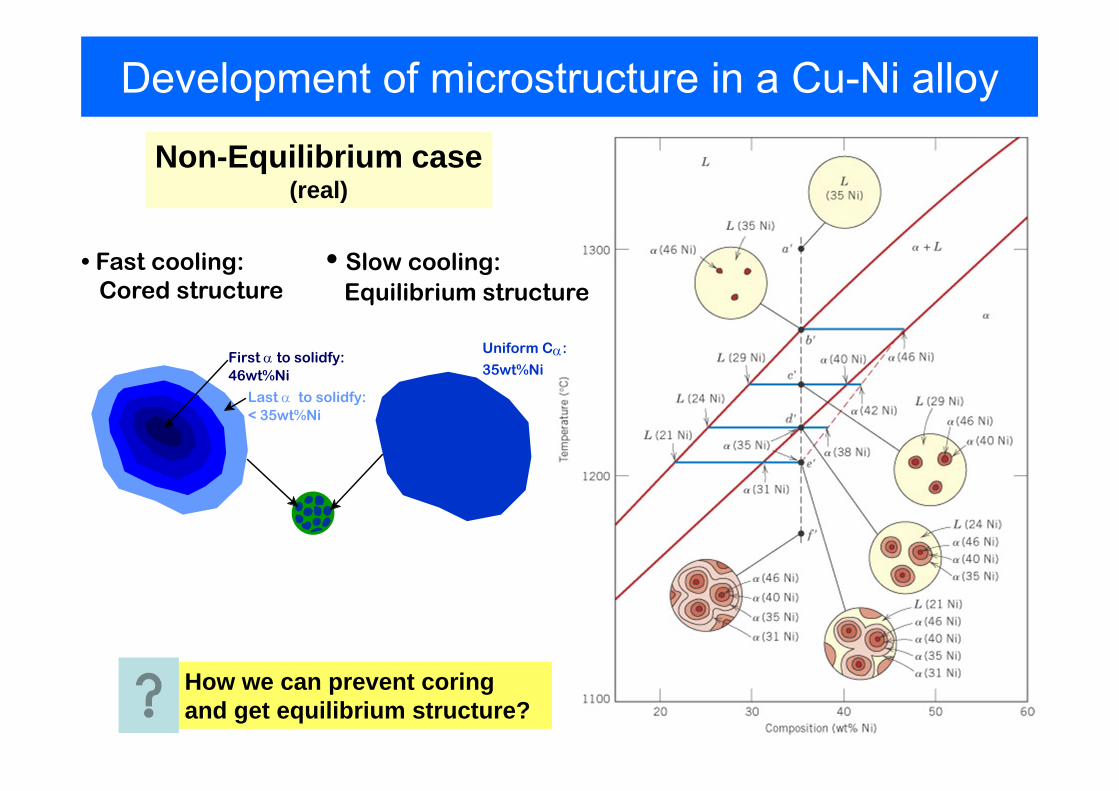
Development of microstructure in a Cu-Ni alloy
Non-Equilibrium case(real)
How we can prevent coring and get equilibrium structure?
First α to solidfy: 46wt%Ni
Uniform Cα:
35wt%Ni
Last α to solidfy: < 35wt%Ni
• Fast cooling:Cored structure
• Slow cooling:Equilibrium structure
Binary Eutectic Systems: Sn-Pb
L + α L+β
α + β
200
T(°C)
18.3
Co, wt% Sn 20 40 60 80 100 0
Co
300
100
L (liquid)
α 183°C 61.9 97.8
150
11 99
R S
β
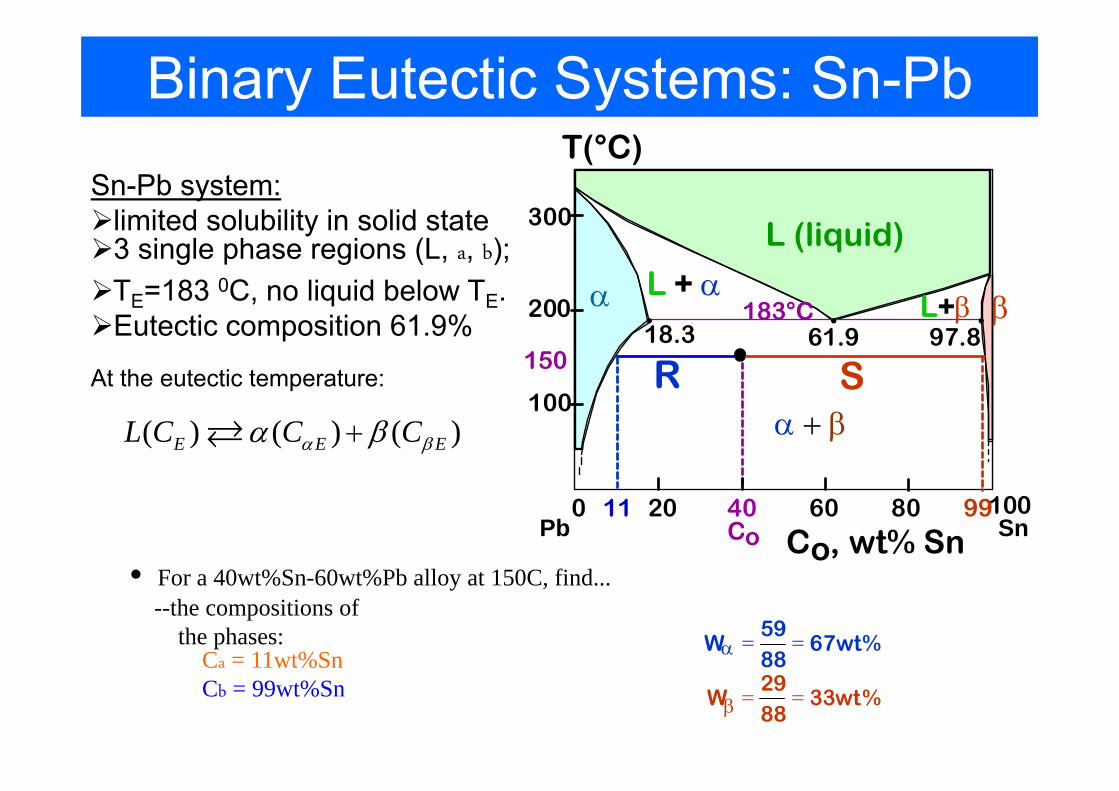
• For a 40wt%Sn-60wt%Pb alloy at 150C, find...--the compositions of
the phases:Ca = 11wt%SnCb = 99wt%Sn
W α = 59 88
= 67 wt %
W β = 29 88
= 33 wt %
Sn-Pb system:limited solubility in solid state3 single phase regions (L, a, b);TE=183 0C, no liquid below TE.Eutectic composition 61.9%
Pb Sn
At the eutectic temperature:
( ) ( ) ( )E E EL C C Cα βα β+

Microstructures in binary systems
L + α200
T(°C)
Co, wt% Sn10
2
200Co
300
100
L
α
30
L: Cowt%Sn
αL
α: Cowt%Sn
α + β
400
(room T solubility limit)
TE(Pb-Sn System)
• Co < 2wt%Sn• Result:
--polycrystal of α grains.
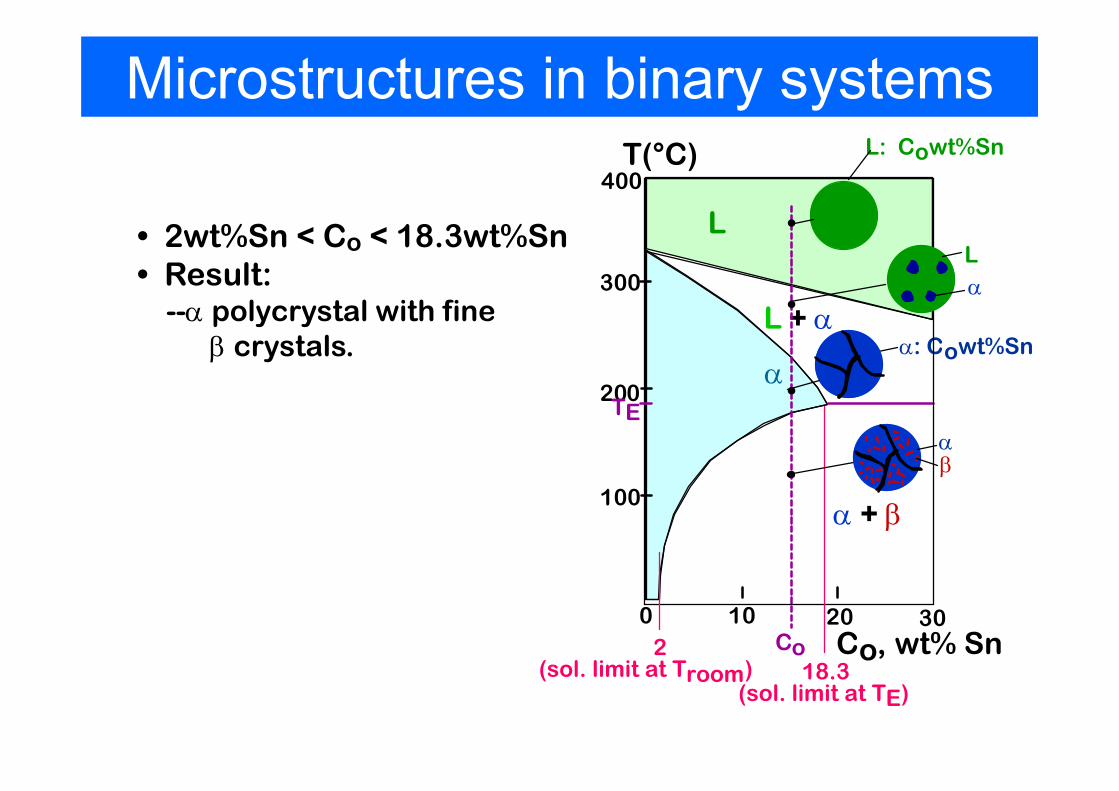
Microstructures in binary systems
• 2wt%Sn < Co < 18.3wt%Sn• Result:
--α polycrystal with fineβ crystals. α: Cowt%Sn
L + α
200
T(°C)
Co, wt% Sn10
18.3
200Co
300
100
L
α
30
L: Cowt%Sn
α + β
400
(sol. limit at TE)
TE
2(sol. limit at Troom)
Lα
αβ

Microstructures in binary systems• Eutectic composition
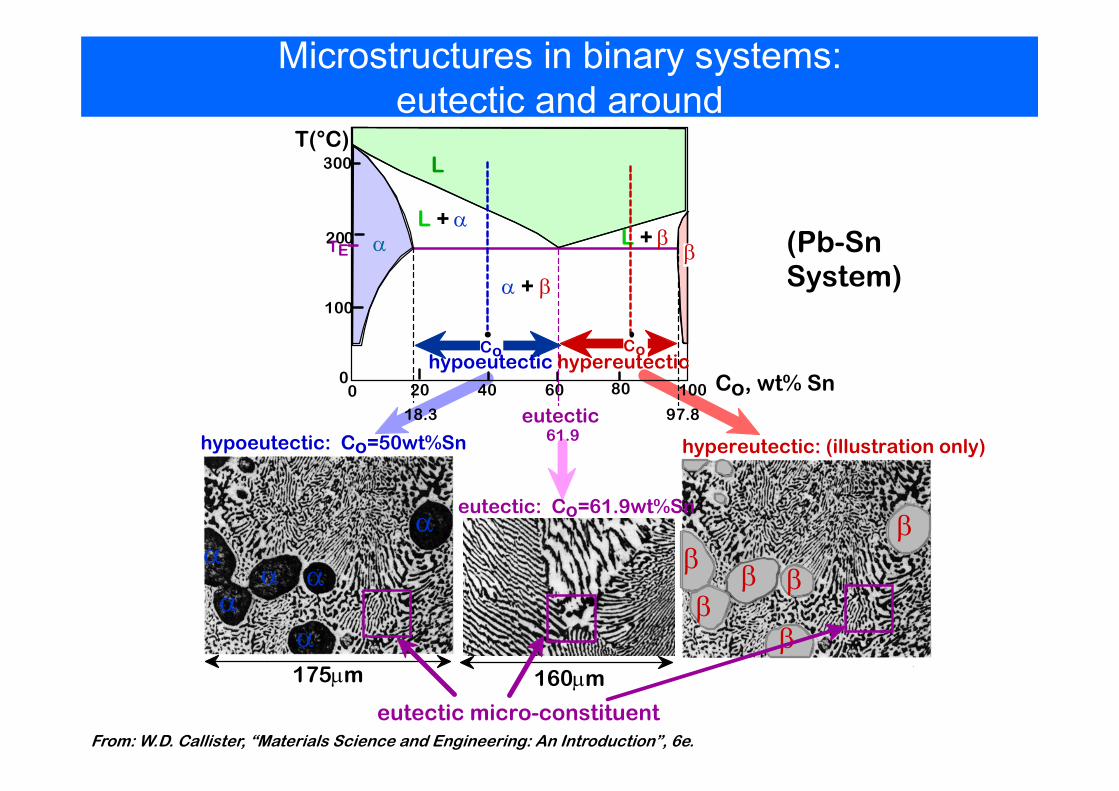
Microstructures in binary systems: eutectic and around
T(°C)
(Pb-Sn System)
L + α200
Co, wt% Sn20 400
300
100
L
α
60
α + β
TE β
080 100
L + β
18.361.9
97.8
Cohypoeutectic
Cohypereutectic
eutectic
hypereutectic: (illustration only)
160μm
eutectic: Co=61.9wt%Sn
175μm
β
ββ
ββ
β
α
α
α
αα
α
hypoeutectic: Co=50wt%Sn
eutectic micro-constituentFrom: W.D. Callister, “Materials Science and Engineering: An Introduction”, 6e.

21
Adapted from Fig. 9.21,Callister 6e. (Fig. 9.21 adapted from Binary Alloy Phase Diagrams, 2nd ed.,Vol. 1, T.B. Massalski (Ed.-in-Chief), ASM International, Materials Park, OH, 1990.)
(Adapted from Fig. 9.24, Callister 6e. (Fig. 9.24 from Metals Handbook, 9th ed., Vol. 9, Metallography and Microstructures, American Society for Metals, Materials Park, OH, 1985.)
Result: Pearlite = alternating layers of α and Fe3C phases.
120μm
• 2 important points
-Eutectic (A):
-Eutectoid (B): L ⇒ γ + Fe3C
γ ⇒ α +Fe3C
Fe
3C
(c
em
en
tite
)
1600
1400
1200
1000
800
600
4000 1 2 3 4 5 6 6.7
L
γ (austenite)
γ+L
γ+Fe3C
α+Fe3C
α+γ
L+Fe3C
δ
(Fe) Co, wt% C0.77 4.30
727°C = Teutectoid
1148°C
T(°C)
A
B
SR
R S
γ γγγ
Fe3C (cementite-hard)α (ferrite-soft)
α
Ce
ute
cto
id
IRON-CARBON (Fe-C) PHASE DIAGRAM

22
Adapted from Figs. 9.21 and 9.26,Callister 6e. (Fig. 9.21 adapted from Binary Alloy Phase Diagrams, 2nd ed., Vol. 1, T.B. Massalski (Ed.-in-Chief), ASM International, Materials Park, OH, 1990.)
Adapted fromFig. 9.27,Callister6e. (Fig. 9.27 courtesy Republic Steel Corporation.)
HYPOEUTECTOID STEEL
(Fe-C System)
Co
Fe
3C
(c
em
en
tite
)
1600
1400
1200
1000
800
600
4000 1 2 3 4 5 6 6.7
L
γ (austenite)
γ+L
γ+Fe3C
α+Fe3C
L+Fe3C
δ
Co, wt% C0.7
7
727°C
1148°C
T(°C)
R S
γ γγγ
α
γγγ γ
γγ γ
γ r s
wα =s/(r+s)wγ =(1-wα)
wα =S/(R+S)wFe3C =(1-wα)
wpearlite = wγ
α
αα
αα
α pearlite
100μm Hypoeutectoid steel

(Fe-C System)
Co
Fe
3C
(c
em
en
tite
)
1600
1400
1200
1000
800
600
4000 1 2 3 4 5 6 6.7
L
γ (austenite)
γ+L
γ+Fe3C
α+Fe3C
L+Fe3C
δ
Co, wt% C0.7
7
1148°C
T(°C)
R S
γ γγγ
αs
wFe3C =r/(r+s)wγ =(1-wFe3C)
wα =S/(R+S)wFe3C =(1-wα)
wpearlite = wγpearlite
60μm Hypereutectoid steel
rγγ
γ γ
γγγ γ
Fe3C
23
Adapted from Figs. 9.21 and 9.29,Callister 6e. (Fig. 9.21 adapted from Binary Alloy Phase Diagrams, 2nd ed., Vol. 1, T.B. Massalski (Ed.-in-Chief), ASM International, Materials Park, OH, 1990.)
Adapted fromFig. 9.30,Callister6e. (Fig. 9.30copyright 1971 by United States Steel Corporation.)
HYPEREUTECTOID STEEL

Liquid crystals• Mesophase – an intermedediate phase between
solid and liquid. Example: liquid crystal• Liquid crystal – substance having a liquid-like
imperfect order in at least one direction and long-range positional or orientational order in at least one another direction
NematicNematic
SmecticSmectic
CholestericCholesteric
calamitic(rod-like)
discotic

Nematic crystals in LCD

Problems (to solve in the class)• 6.1a: At 90ºC the vapour pressure of
methylbenzene is 53.3kPa and that of 1.2-dimethylbenzene is 20kPa. What is the composition of a liquid mixture that boils at 90ºC when the pressure is 0.5 atm. What is the composition of the vapour produced. down
• 6.9b: sketch the phase diagram of the system NH3/N2H4 given that the two substances do not form a compound and NH3 freezes at -78C, N2H4 freezes at +2C, eutectic formed with mole fraction of N2H40.07 and melts at -80C.
• 6.10b Describe the diagram and what is observed when a and b are cooled down