Lecture 28 - Iowa State Universityclass.ece.iastate.edu/ee435/lectures/EE 435 Lect 28 Spring...
32
EE 435 Lecture 28 Data Converters Linearity • INL/DNL • Spectral Performance
Transcript of Lecture 28 - Iowa State Universityclass.ece.iastate.edu/ee435/lectures/EE 435 Lect 28 Spring...

EE 435
Lecture 28
Data Converters
Linearity• INL/DNL
• Spectral Performance

Performance Characterization of Data Converters
• Static characteristics– Resolution
– Least Significant Bit (LSB)
– Offset and Gain Errors
– Absolute Accuracy
– Relative Accuracy
– Integral Nonlinearity (INL)
– Differential Nonlinearity (DNL)
– Monotonicity (DAC)
– Missing Codes (ADC)
– Low-f Spurious Free Dynamic Range (SFDR)
– Low-f Total Harmonic Distortion (THD)
– Effective Number of Bits (ENOB)
– Power Dissipation

Linearity
A data converter (ADC or DAC) can be viewed as an amplifier that interfaces
between the analog and digital domains
Linearity is of considerable concern in amplifiers irrespective of whether the
I/O is analog:analog, analog:digital, digital:analog, or digital:digital
The seemingly simple concept of linearity is challenging to accurately
characterize

Performance Characterization of Data Converters
• Static characteristics– Resolution
– Least Significant Bit (LSB)
– Offset and Gain Errors
– Absolute Accuracy
– Relative Accuracy
– Integral Nonlinearity (INL)
– Differential Nonlinearity (DNL)
– Monotonicity (DAC)
– Missing Codes (ADC)
– Low-f Spurious Free Dynamic Range (SFDR)
– Low-f Total Harmonic Distortion (THD)
– Effective Number of Bits (ENOB)
– Power Dissipation
Linearity
Metrics
Spectral
Characterization

Spectral Characterization

INL Often Not a Good Measure of Linearity
XIN
XOUT
XREF
XREF
XIN
XOUT
XREF
XREF
XIN
XOUT
XREF
XREF
XIN
XOUT
XREF
XREF
Four identical INL with dramatically different linearity

Linearity Issues
• INL is often not adequate for predicting the
linearity performance of a data converter
• Distortion (or lack thereof) is of major
concern in many applications
• Distortion is generally characterized in
terms of the harmonics that may appear in
a waveform

Spectral Analysis
T
T
2πω
1k
kk0 θtkωsinAAf(t)
alternately
1k
k
1k
k0 tkωcosbtkωsinaAf(t)
2
k
2
kk baA
If f(t) is periodic
Termed the Fourier Series Representation of f(t)

Spectral Analysis
Nonlinear
System (weakly)
XIN(t) XOUT(t)
Often the system of interest is ideally linear but practically it is weakly
nonlinear.
Often the input is nearly periodic and often sinusoidal and in latter case
desired output is also sinusoidal
Weak nonlinearity will cause harmonic distortion (often just termed
distortion) of signal as it is propagated through the system
Spectral analysis often used to characterize effects of the weak
nonlinearity

Spectral Analysis
Nonlinear
System (weakly)
XIN(t) XOUT(t)
Distortion Types:
Frequency Distortion
Nonlinear Distortion (alt. harmonic distortion)
Frequency Distortion: Amplitude and phase of system is altered but
output is linearly related to input
Nonlinear Distortion: System is not linear, frequency components
usually appear in the output that are not present in the input
Spectral Analysis is the characterization of a system with a periodic input with
the Fourier series relationships between the input and output waveforms

Spectral Analysis
Nonlinear
System
XIN(t) XOUT(t)
If θωtsinXtX mIN
All spectral performance metrics depend upon the sequences
Spectral performance metrics of interest: SNDR, SDR, THD, SFDR, IMOD
0k kA
1k k
0
1 1
sin cosOUT k k
k k
X t A a k t b k t
Alternately
2 2
k k kA a b 1tan kk
k
b
a

Distortion Analysis
0kkA
A1 is termed the fundamental
Ak is termed the kth harmonic
k
kA
1 2 3 4 5 6
• Often termed the DFT coefficients (will show later)
• Spectral lines, not a continuous function

Distortion Analysis
0kkA
k
kA
1 2 3 4 5 6
Often ideal response will have only fundamental present and all
remaining spectral terms will vanish

Distortion Analysis
0kkA
k
kA
1 2 3 4 5 6
For a low distortion signal, the 2nd and higher harmonics are generally
much smaller than the fundamental
The magnitude of the harmonics generally decrease rapidly with k for low
distortion signals

Distortion Analysis
k
kA
1 2 3 4 5 6
f(t) is band-limited to frequency 2π f kX if Ak=0 for all k>kx
Assume f(t) is periodic with period 1T
f
Where are the Fourier series coefficients of f(t)0k k
A

Distortion Analysis
Total Harmonic Distortion, THD
lfundamentaofvoltageRMS
harmonicsinvoltageRMSTHD
2
A
...2
A
2
A
2
A
THD1
2
4
2
3
2
2
1
2k
2
k
A
A
THD

Distortion Analysis
Spurious Free Dynamic Range, SFDR
The SFDR is the difference between the fundamental and the largest harmonic
SFDR is usually determined by either the second or third harmonic
k
kA
1 2 3 4 5 6
SFDR

Distortion AnalysisIn a fully differential symmetric circuit, all even harmonics are
absent in the differential output !
k
kA
1 2 3 4 5 6
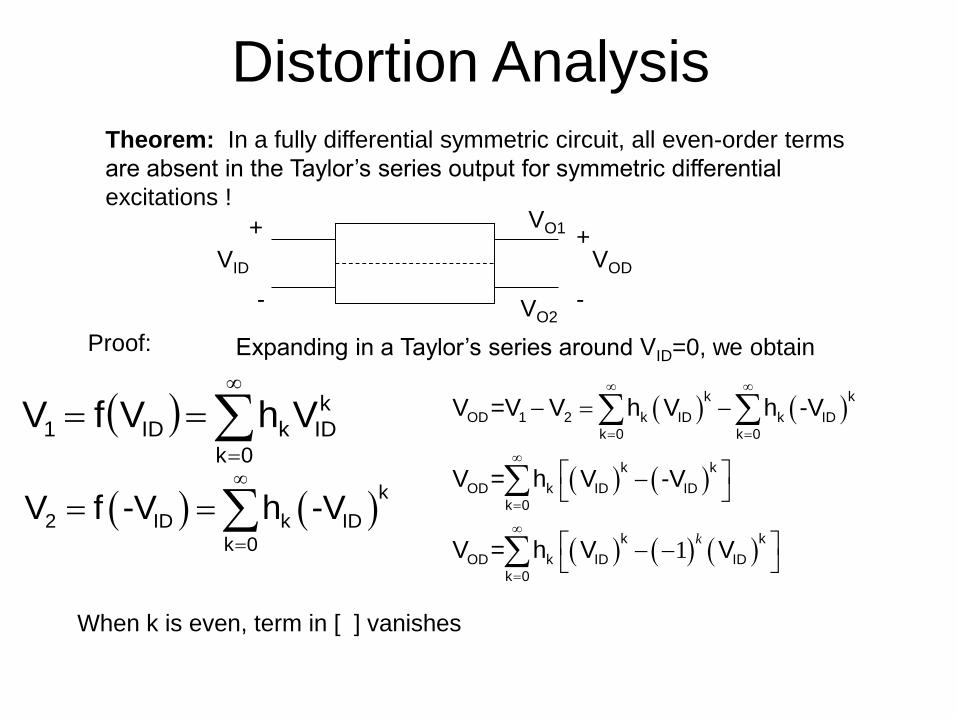
Distortion AnalysisTheorem: In a fully differential symmetric circuit, all even-order terms
are absent in the Taylor’s series output for symmetric differential
excitations !
Proof:
0k
k
IDkID1 VhVfV
Expanding in a Taylor’s series around VID=0, we obtain
VID VOD
+
-
+
-
VO1
VO2
k
2 ID k ID
k 0
V f -V h -V
1
k k
OD 1 2 k ID k ID
k 0 k 0
k k
OD k ID ID
k 0
k k
OD k ID ID
k 0
V =V V h V h -V
V = h V -V
V = h V Vk
When k is even, term in [ ] vanishes

Distortion AnalysisTheorem: In a fully differential symmetric circuit, all even harmonics are
absent in the differential output for symmetric differential excitations !
Proof:
VID VOD
+
-
+
-
VO1
VO2
Recall:
1
2
0
2
2
0
sin 2
sin
sin 2
n
k
k
n
n
k k
k
h n k x for nodd
x
g n k x for neven
where hk, gk, and θk are constants
That is, odd powers of sinn(x) have only odd harmonics present
and even powers have only even harmonics present

Distortion AnalysisTheorem: In a fully differential symmetric circuit, all even harmonics are
absent in the differential output for symmetric differential sinusoidal excitations !
Proof:
Expanding in a Taylor’s series around VID=0, we obtain
Assume VID=Ksin(ωt) W.L.O.G. assume K=1
VID VOD
+
-
+
-
VO1
VO2
0k
k
kO1 tωsinhV
0k
k
kO2 tωsin-hV
0k
kkk
k
0k
kk
kO2O1OD tωsin1tωsinhtωsin-tωsinhVVV
Observe the even-ordered powers and hence even harmonics are absent in this last sum
)k
O2 ID k ID
k 0
V f -V h (-V
k
O1 ID k ID
k 0
V f V h V
and

Distortion Analysis
How are spectral components determined?
Tt
t
tjkω
Tt
t
tjkω
k
1
1
1
1
dtetfdtetfωT
1A
By integral
By DFT
By FFT (special computational method for obtaining DFT)
(with some restrictions that will be discussed)
dtktωsintfTω
2a
Tt
t
k
1
1
dtktωcostfTω
2b
Tt
t
k
1
1
or
Integral is very time consuming, particularly if large number of components are required

Distortion Analysis
How are spectral components determined?
Consider sampling f(t) at uniformly spaced points in time TS seconds apart
T
TS
This gives a sequence of samples N
s k=1f kT

Distortion Analysis
T
1k
kk0 θtkωsinAAf(t)
Consider a function f(t) that is periodic with period T
Band-limited Periodic Functions
Definition: A periodic function of frequency f is band
limited to a frequency fmax if Ak=0 for all maxfk
f
2=2 f =
T

Distortion AnalysisT
TSNOTATION:
T: Period of Excitation
TS: Sampling Period
NP: Number of periods over which samples are taken
N: Total number of samples
T
NTN S
P Note: NP is not an integer unless a specific relationship
exists between N, TS and T
P
N 1h = Int -1
2 N
Note: The function Int(x) is the integer part of x

Distortion AnalysisT
TS
1-hm01mNΧN
2A Pm
0kΧ
THEOREM: If NP is an integer and x(t) is band limited to
fMAX, then
and for all k not defined above
where is the DFT of the sequence
f = 1/T, , and
1N
0kkΧ
1N
0kSkTx
MAXP
f Nf = •
2 N
P
N 1h = Int -1
2 N
Key Theorem central to Spectral Analysis that is widely used !!! and often “abused”

Distortion AnalysisT
TS
hm0mNΧN
2A Pm 1
0kΧ
THEOREM?: If NP is an integer and x(t) is band limited to
fMAX, then
and for all k not defined above
where is the DFT of the sequence
f = 1/T, , and
1N
0kkΧ
1N
0kSkTx
MAXP
f Nf = •
2 N
MAXfh = Int
f

Why is this a Key Theorem? T
TS
1-hm01mNΧN
2A Pm
0kΧ
THEOREM: If NP is an integer and x(t) is band limited to
fMAX, then
and for all k not defined above
where is the DFT of the sequence
f = 1/T, , and
1N
0kkΧ
1N
0kSkTx
MAXP
f Nf = •
2 N
P
N 1h = Int -1
2 N
• DFT requires dramatically less computation time than the integrals for
obtaining Fourier Series coefficients
• Can easily determine the sampling rate (often termed the Nyquist rate) to
satisfy the band limited part of the theorem

How is this theorem abused? T
TS
1-hm01mNΧN
2A Pm
0kΧ
THEOREM: If NP is an integer and x(t) is band limited to
fMAX, then
and for all k not defined above
where is the DFT of the sequence
f = 1/T, , and
1N
0kkΧ
1N
0kSkTx
MAXP
f Nf = •
2 N
P
N 1h = Int -1
2 N
• Much evidence of engineers attempting to use the theorem when NP is not
an integer
• Challenging to have NP an integer in practical applications
• Dramatic errors can result if there are not exactly an integer number of
periods in the sampling window

Distortion AnalysisT
TS
k
k
NP+1 2NP+1 3NP+1 4NP+1
A1
A2
A3 A4A0
If the hypothesis of the theorem are satisfied, we thus have

Distortion Analysis
k
k
NP+1 2NP+1 3NP+1 4NP+1
A1
A2
A3 A4A0
If the hypothesis of the theorem are satisfied, we thus have
FFT is a computationally efficient way of calculating
the DFT, particularly when N is a power of 2

End of Lecture 28