Lecture 26 The Hertzsprung- Russell Diagram · The Hertzsprung-Russell Diagram ... 11 Sizes of...
30
1 Lecture 26 The Hertzsprung- Russell Diagram January 13b, 2014
Transcript of Lecture 26 The Hertzsprung- Russell Diagram · The Hertzsprung-Russell Diagram ... 11 Sizes of...

1
Lecture 26
The Hertzsprung-
Russell Diagram
January 13b, 2014
2
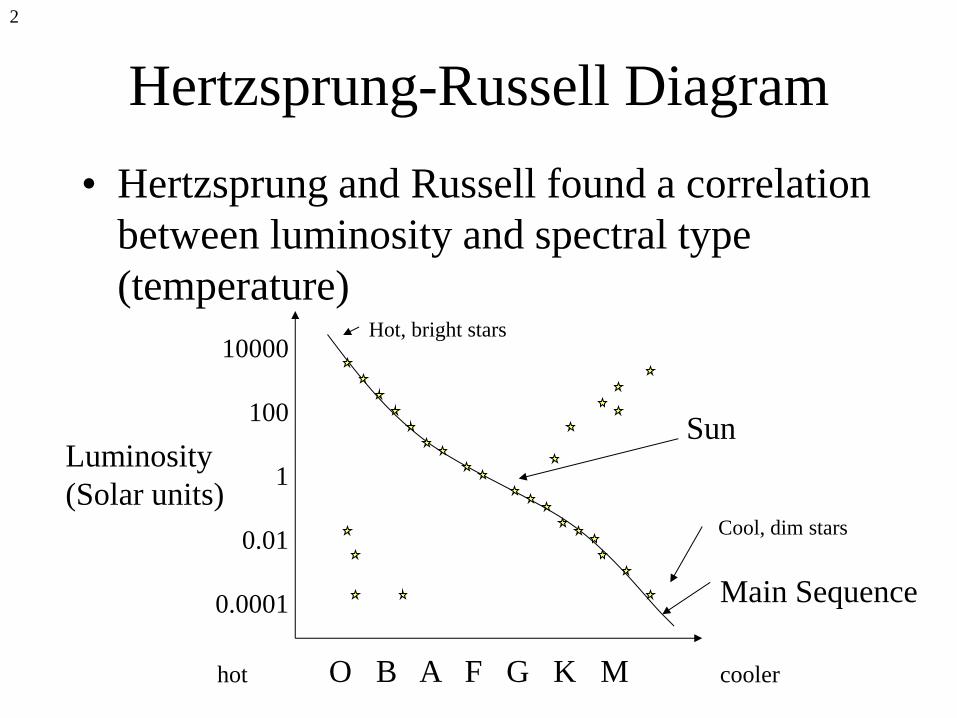
Hertzsprung-Russell Diagram
• Hertzsprung and Russell found a correlation
between luminosity and spectral type
(temperature)
Luminosity
(Solar units)
O B A F G K M hot cooler
Cool, dim stars
Hot, bright stars
Sun
Main Sequence
10000
100
1
0.01
0.0001

3
4
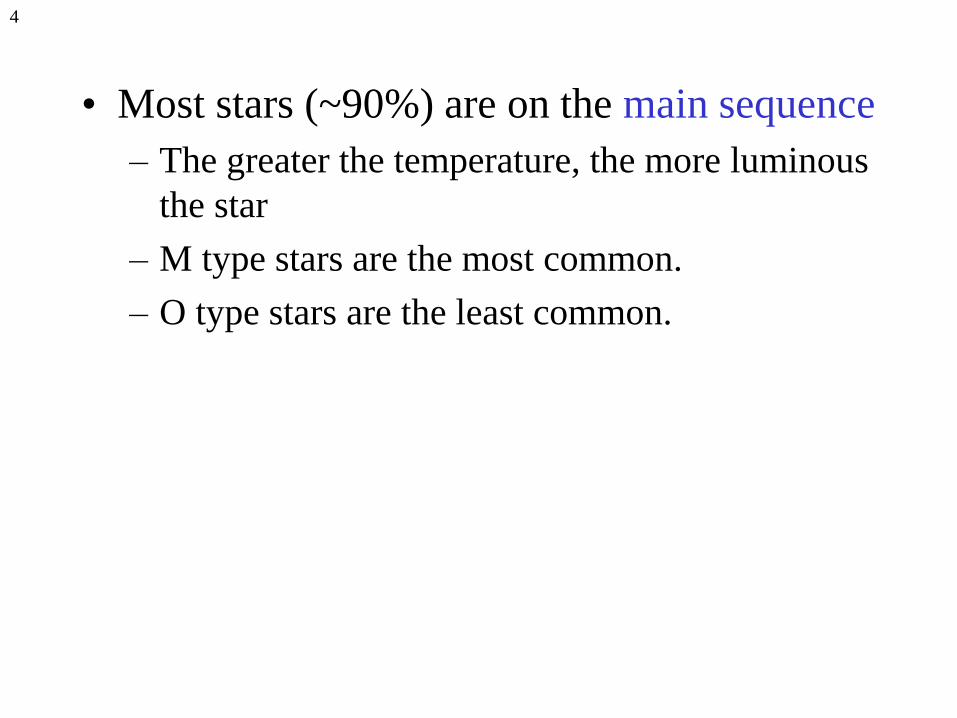
• Most stars (~90%) are on the main sequence
– The greater the temperature, the more luminous
the star
– M type stars are the most common.
– O type stars are the least common.
5
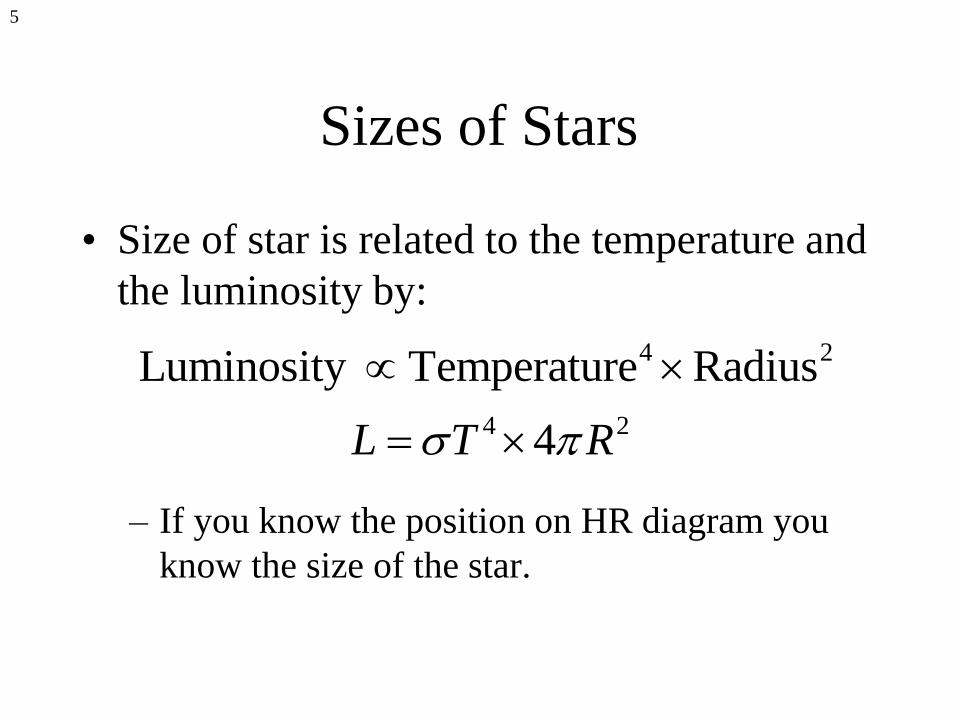
Sizes of Stars
• Size of star is related to the temperature and
the luminosity by:
– If you know the position on HR diagram you
know the size of the star.
4 2
4 2
Luminosity Temperature Radius
4L T R

6
A star is twice as luminous as the Sun and has
twice the surface temperature. What is its radius
relative to the Sun’s radius?
A. Rstar/RSun = 4.0
B. Rstar/RSun = 2.8
C. Rstar/RSun = 0.5
D. Rstar/RSun = 0.35

7
A star is twice as luminous as the Sun and has
twice the surface temperature. What is its radius
relative to the Sun’s radius?
4 2 4
44
star starstar Sun
4Sun starSun Sun
4
4 4
4
4
2 10.35
1 2
star
Sun
L T R R L T
L TR L T
R L TL T
8
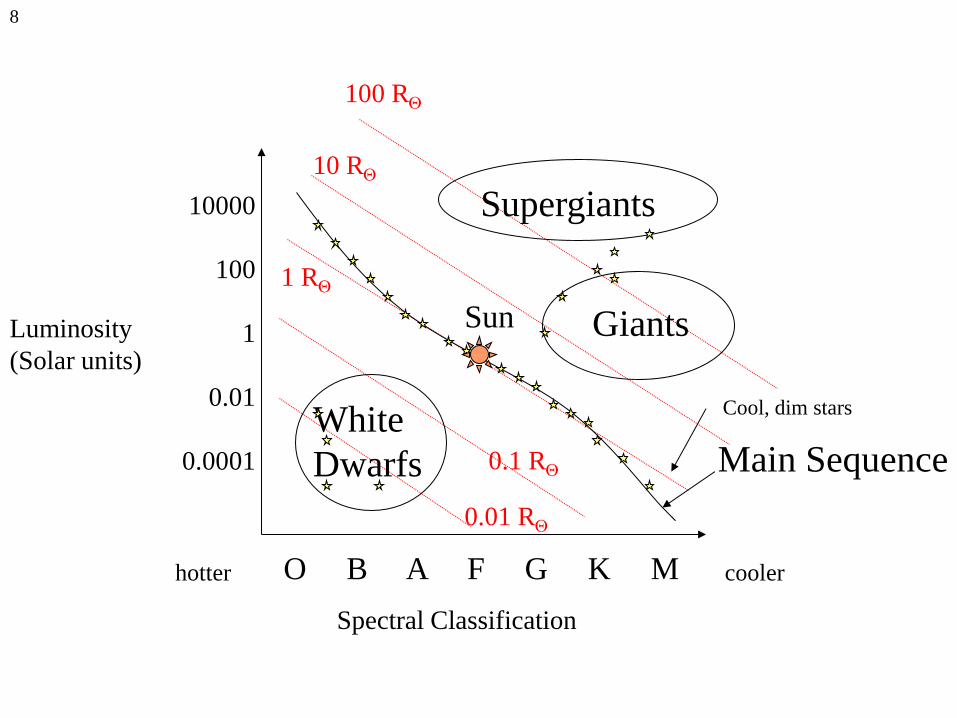
100 R
10 R
1 R
0.1 R
0.01 R
Supergiants
Giants
Main Sequence White
Dwarfs
Luminosity
(Solar units)
O B A F G K M hotter cooler
Cool, dim stars
Sun
10000
100
1
0.01
0.0001
Spectral Classification
9
• Supergiants -- cool, bright, red, large stars
• Giants -- cool, bright red, less large stars
• Main Sequence -- spans range from hot,
bright stars to cool, dim stars.
• White dwarfs -- hot, small, dim stars.
• These classifications will give clues to
stages in the evolution of stars.

10
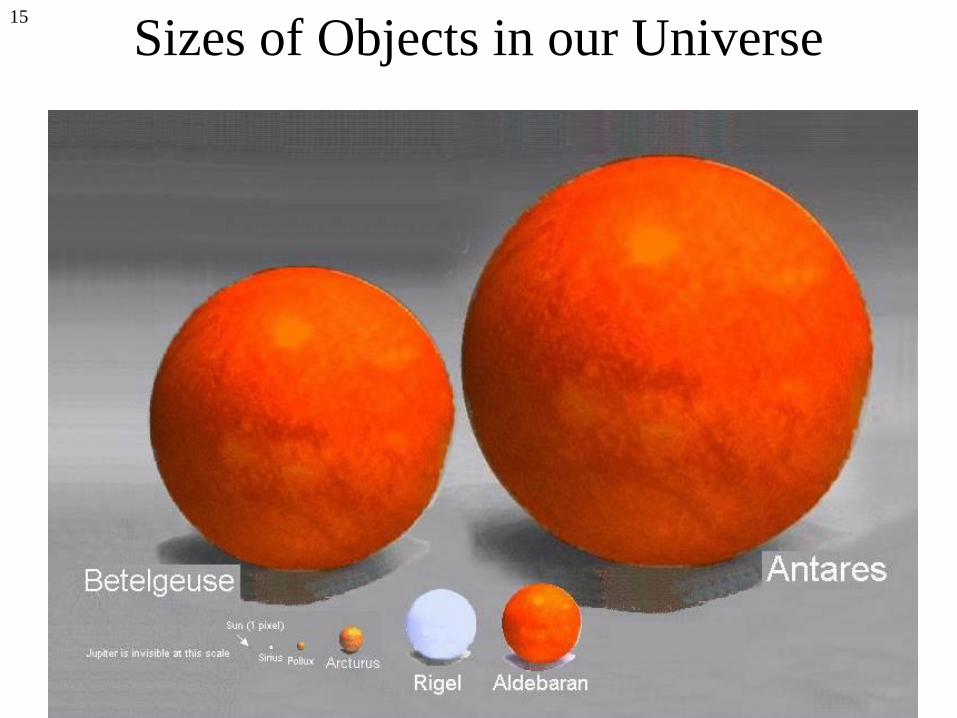
Stars come in
many sizes!

12
Sizes of Objects in our Universe
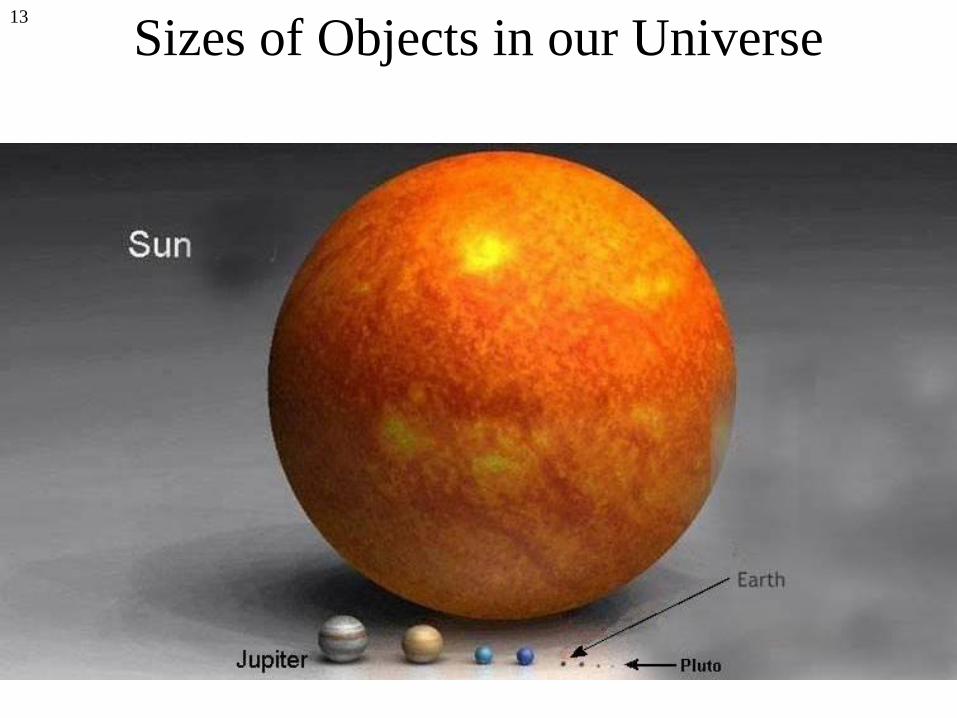
13
Sizes of Objects in our Universe

14
Sizes of Objects in our Universe
15
Sizes of Objects in our Universe
16
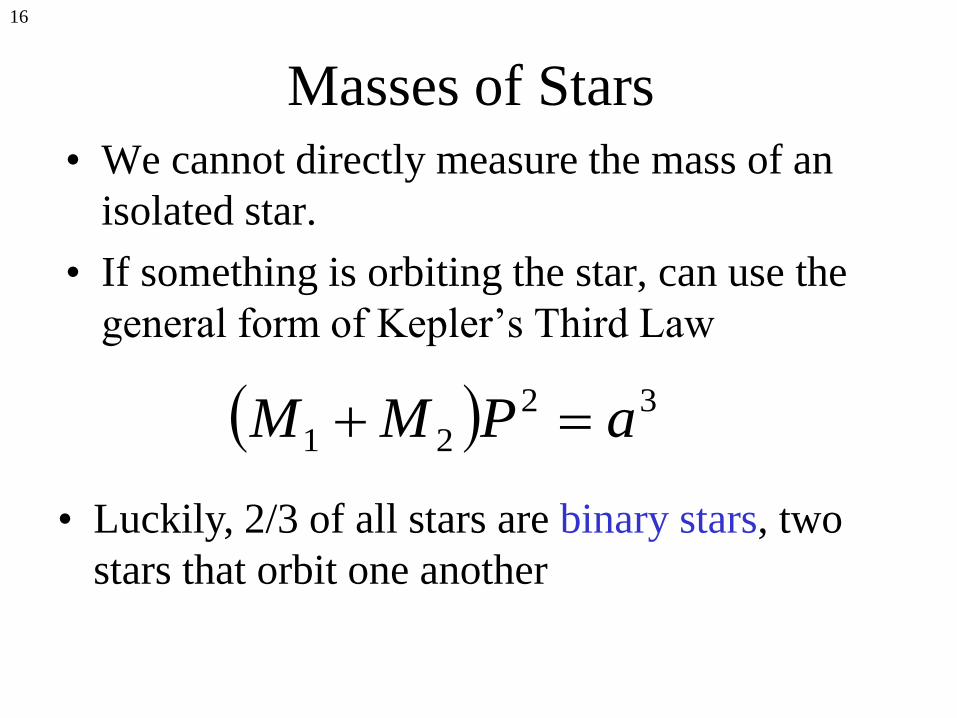
Masses of Stars
• We cannot directly measure the mass of an
isolated star.
• If something is orbiting the star, can use the
general form of Kepler’s Third Law
32
21 aPMM
• Luckily, 2/3 of all stars are binary stars, two
stars that orbit one another

17
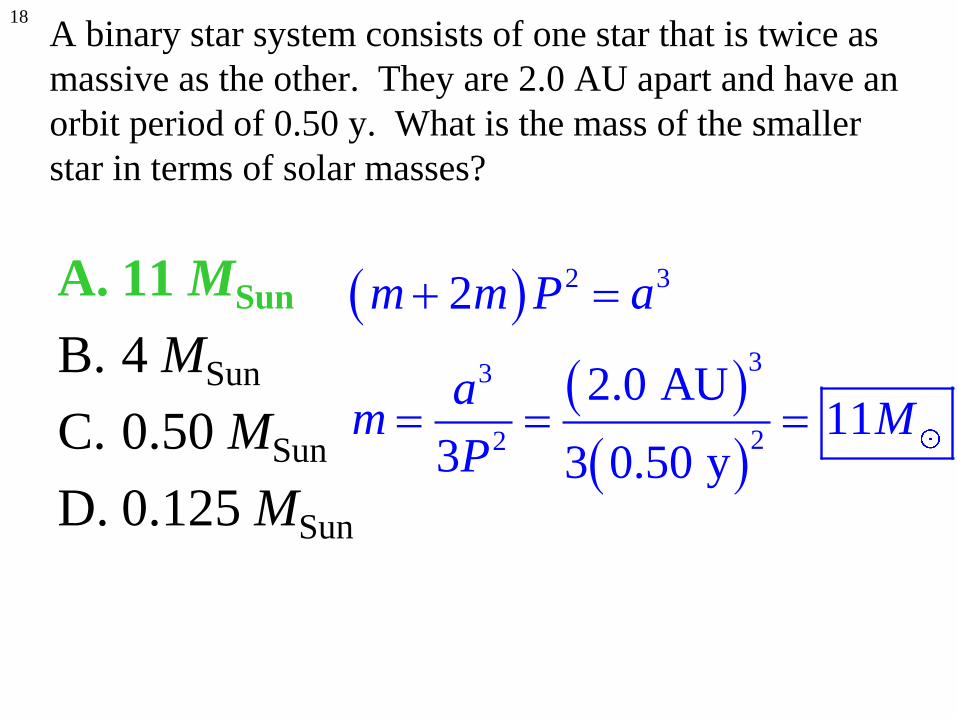
A binary star system consists of one star that is twice as
massive as the other. They are 2.0 AU apart and have an
orbit period of 0.50 y. What is the mass of the smaller
star in terms of solar masses?
A. 11 MSun
B. 4 MSun
C. 0.50 MSun
D. 0.125 MSun
18
A binary star system consists of one star that is twice as
massive as the other. They are 2.0 AU apart and have an
orbit period of 0.50 y. What is the mass of the smaller
star in terms of solar masses?
A. 11 MSun
B. 4 MSun
C. 0.50 MSun
D. 0.125 MSun
2 3
33
22
2
2.0 AU11
3 3 0.50 y
m m P a
am M
P

19
Mass-Luminosity Relation
• True ONLY for
Main Sequence stars
• As the mass
increases, the
luminosity increases
rapidly
3MassLuminosity
20
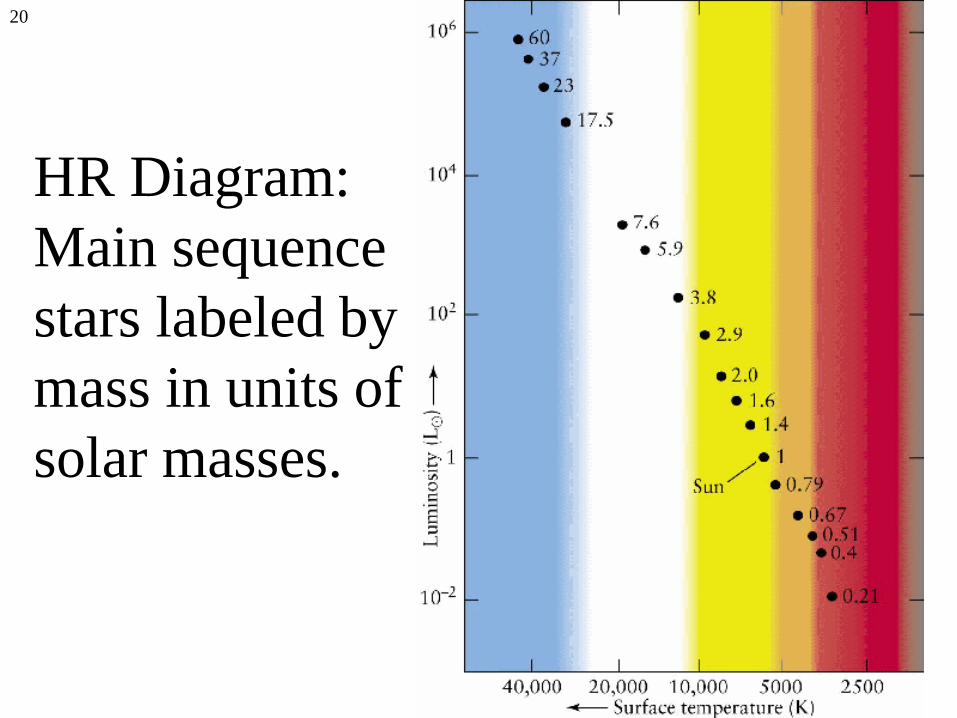
HR Diagram:
Main sequence
stars labeled by
mass in units of
solar masses.

21
Question
O G M
Temperature
Mass
Size
Color
Luminosity
How do the following properties differ with respect to the Sun for
the listed main sequence types? What properties would not change
for non-main sequence stars?

22
Question
O G M
Temperature* Higher Same Lower
Mass Higher Same Lower
Size Larger Same Smaller
Color* Blue White Red
Luminosity Higher Same Red
How do the following properties differ with respect to the Sun for
the listed main sequence types? What properties would not change
for non-main sequence stars?

23
Apparent Brightness
• The brightness an object appears to have.
• The further away the object, the dimmer it
looks
2
LuminosityApparent Brightness
4 d d = distance

24
Star A has a brightness of 1.0 μW/m2 and is known to be
4.0 ly away. Star B is 9.0 ly away and has a brightness of
3.0 μW/m2. How much more luminous is star B than star A?
A. 240×
B. 15×
C. 6.8×
D. 3.0×
25
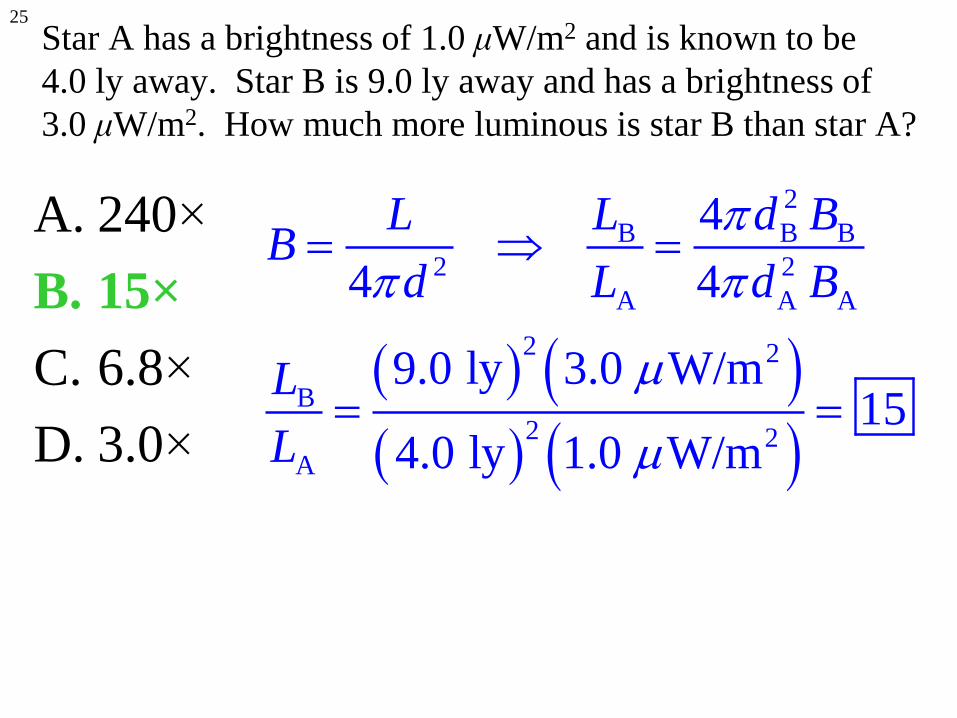
Star A has a brightness of 1.0 μW/m2 and is known to be
4.0 ly away. Star B is 9.0 ly away and has a brightness of
3.0 μW/m2. How much more luminous is star B than star A?
A. 240×
B. 15×
C. 6.8×
D. 3.0×
2
B B B
2 2
A A A
2 2
B
2 2A
4
4 4
9.0 ly 3.0 W/m15
4.0 ly 1.0 W/m
L L d BB
d L d B
L
L

26
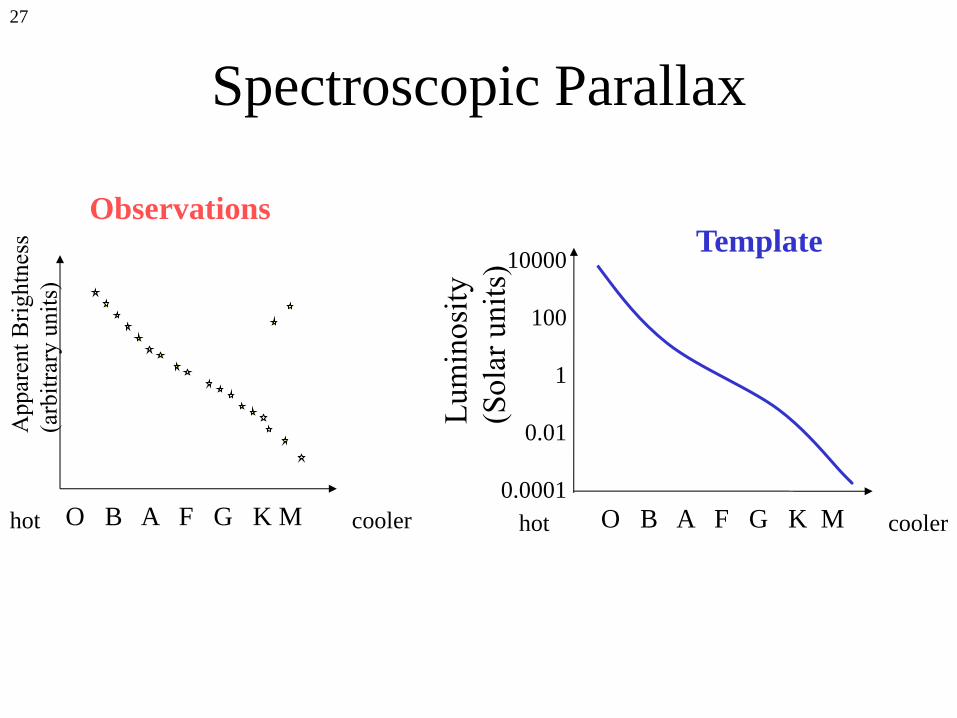
Spectroscopic Parallax
• If luminosity and apparent brightness are known, distance can be determined.
• It can be difficult to accurately measure luminosity for one star
– Use spectra to get spectral type and class
• But, you can use a cluster of stars
• Distance to the cluster can be determined by comparing the HR diagram of the cluster with a template HR diagram
5log 5m M d
27
Spectroscopic Parallax
O B A F G K M hot cooler
Observations
cooler O B A F G K M hot
10000
100
1
0.01
0.0001
Template

28
Spectroscopic Parallax
O B A F G K M hot cooler
10000
100
1
0.01
0.0001
O B A F G K M hot cooler
Now the vertical axis is on an absolute scale. We can read off the
luminosities of the stars, and from that, together with the apparent
brightness, we can determine the distance to the stars.
29
The Distance Ladder
• See Extending Our Reach on p. 484
• First rung: parallax
• Second rung: spectroscopic parallax
• Third rung: standard candles/inverse square
law

30
The Distance Ladder
We will be discussing the longer distance “rungs” of the ladder in subsequent lectures.
Figure 26.12, Freedman and Kaufmann,
7th ed. Universe, © 2005 W. H. Freeman & Company