
Lecture 20 Networks over time Slides are modified from Lada Adamic and Jure Leskovec.
56
Lecture 20 Networks over time Slides are modified from Lada Adamic and Jure Leskovec
-
Upload
anthony-lloyd -
Category
Documents
-
view
215 -
download
0
Transcript of Lecture 20 Networks over time Slides are modified from Lada Adamic and Jure Leskovec.

Lecture 20
Networks over time
Slides are modified from Lada Adamic and Jure Leskovec

Outline
dynamic appearance/disappearance of individual nodes and links new links (university email network over time) team assembly (coauthor & collaborator networks) evolution of affiliation network related to social network (online
groups, CS conferences)
evolution of aggregate metrics: densification & shrinking diameters (internet, citation, authorship,
patents) models:
community structure forest fire model

First some thought
What events can occur to change a network over time?
What properties do you expect to remain roughly constant?
What properties do you expect to change?
Where do you expect new edges to form?
Which edges do you expect to be dropped?

on the software side
GUESS (range attribute, states, morphs) SONIA http://www.stanford.edu/group/sonia/
visualizing networks over time
SIENA http://stat.gamma.rug.nl/siena.html includes statistical analysis of factors contributing to tie formation

Empirical analysis of an evolving social network
Gueorgi Kossinets & Duncan J. Watts Science, Jan. 6th, 2006
The data university email logs sender, recipient, timestamp
no content 43,553 undergraduate and graduate students, faculty, staff filtered out messages with more than 4 recipients
5% of messages 14,584,423 messages remaining sent over a period of 355 days
2003-2004 school year

How does one choose new acquaintances in a social network?
triadic closure: choose a friend of friend homophily: choose someone with similar interests proximity: choose someone who is close spatially and
with whom you spend a lot of time seek novel information and resources
connect outside of circle of acquaintances span structural holes between people who don’t know each
other
sometimes social ties also dissolve avoid conflicting relationships reason for tie is removed: common interest, activity
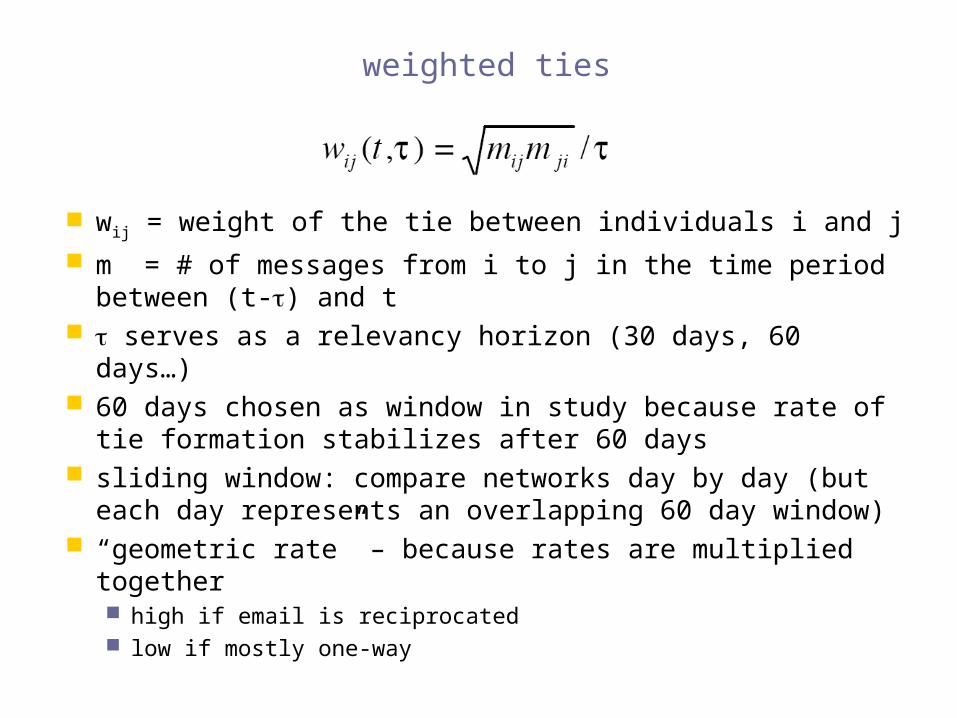
weighted ties
wij = weight of the tie between individuals i and j
m = # of messages from i to j in the time period between (t-) and t
serves as a relevancy horizon (30 days, 60 days…) 60 days chosen as window in study because rate of tie
formation stabilizes after 60 days sliding window: compare networks day by day (but each
day represents an overlapping 60 day window) “geometric rate” – because rates are multiplied together
high if email is reciprocated low if mostly one-way

cyclic closure & focal closure
shortest path distance between i and j
new ties that appearedon day t ties that were there
in the past 60 days
number of common foci, i.e. classes

cyclic closure & focal closure
distance between two people in the email graph
pairs that attend one or more classes together
do not attend classes together
Individuals who share at least one class are three times more likely to start emailing each other if they have an email contact in common
If there is no common contact, then the probability of a new tie forming is lower,
but ~ 140 times more likely if the individuals share a class than if they don’t

# triads vs. # foci
Having 1 tie or 1 class in common yield equal probability of a tie forming
probability increases significantly for additional acquaintances, but rises modestly for additional foci
>=1 tie in common
no ties in common
>=1 class in common
no classes in common
the strength of ties
the stronger the ties, the greater the likelihood of triadic closure
bridges are on average weaker than other ties
but bridges are more unstable: may get stronger, become part of triads, or disappear

Team Assembly Mechanisms: Determine Collaboration Network Structure and Team Performance
Why assemble a team? different ideas different skills different resources
What spurs innovation? applying proven innovations from one domain to another
Is diversity (working with new people) always good? spurs creativity + fresh thinking but
conflict miscommunication lack of sense of security of working with close collaborators
Roger Guimera, Brian Uzzi, Jarrett Spiro, Luıs A. Nunes Amaral; Science, 2005

Parameters in team assembly
1. m, # of team members
2. p, probability of selecting individuals who already belong to the network
3. q, propensity of incumbents to select past collaborators
Two phases giant component of interconnected collaborators isolated clusters

creation of a new team
Incumbents people who have already collaborated with someone
Newcomers people available to participate in new teams
pick incumbent with probability p if incumbent, pick past collaborator with probability q

Time evolution of a collaboration network
newcomer-newcomer collaborations
newcomer-incumbent collaborations
new incumbent-incumbent collaborations
repeat collaborations
after a time of inactivity, individuals are removed from the network

BMI data
Broadway musical industry 2258 productions from 1877 to 1990 musical shows performed at least once on
Broadway team: composers, writers,
choreographers, directors, producers but not actors
Team size increases from 1877-1929 the musical as an art form is still evolving
After 1929 team composition stabilizes to include 7 people:
choreographer, composer, director, librettist, lyricist, producer
ldcross, Flickr; http://creativecommons.org/licenses/by-sa/2.0/deed.en

Collaboration networks
4 fields (with the top journals in each field) social psychology (7) economics (9) ecology (10) astronomy (4)
impact factor of each journal ratio between citations and recent citable items published

size of teams grows over time

degree distributionsdata
data generated from a model with the same p and q and sequence of team sizes formed

Predictions for the size of the giant component
higher p means already published individuals are co-authoring linking the network together and increasing the giant component
S = fraction of network occupied by the giant component

Predictions for the size of the giant component
increasing q can slow the growth of the giant component co-authoring with previous collaborators does not create new
edges fR = fraction of repeat incumbent-incumbent links

network statistics
Field teams individuals
p q fR S (size of giant
component)
BMI 2258 4113 0.52 0.77 0.16 0.70
social psychology
16,526 23,029 0.56 0.78 0.22 0.67
economics 14,870 23,236 0.57 0.73 0.22 0.54
ecology 26,888 38,609 0.59 0.76 0.23 0.75
astronomy 30,552 30,192 0.76 0.82 0.39 0.98
what stands out?
what is similar across the networks?

main findings
all networks except astronomy close to the “tipping” point where giant component emerges sparse and stringy networks
giant component takes up more than 50% of nodes in each network
impact factor (how good the journal is where the work was published) p positively correlated
going with experienced members is good q negatively correlated
new combinations more fruitful S for individual journals positively correlated
more isolated clusters in lower-impact journals
ecology, economics,
social psychology
ecology
social psychology

team assembly lab
In NetLogo demo library: what happens as you increase the probability of choosing a
newcomer? what happens as you increase the probability of a repeat
collaboration between same two nodes?
http://ccl.northwestern.edu/netlogo/models/TeamAssembly

Group Formation in Large Social Networks:Membership, Growth, and Evolution
Backstrom, Huttenlocher, Kleinberg, Lan @ KDD 2006
data: LiveJournal DBLP

the more friends you have in a group, the more likely you are to join

if it’s a “group” of friends that have joined…

but community growth is slower if entirely cliquish…

group formation & social networks (summary)
if your friends join, so will you
if your friends who join know one another, you’re even more likely to join
cliquish communities grow more slowly

Outline
dynamic appearance/disappearance of individual nodes and links new links (university email network over time) team assembly (coauthor & collaborator networks) evolution of affiliation network related to social network (online
groups, CS conferences)
evolution of aggregate metrics: densification & shrinking diameters (internet, citation, authorship,
patents) models:
community structure forest fire model

evolution of aggregate network metrics
as individual nodes and edges come and go,how do aggregate features change?
degree distribution?
clustering coefficient?
average shortest path?

university email network:
properties such as degree distribution, average shortest path, and size of giant component have seasonal variation (summer break, start of semester, etc.) appropriate smoothing window () needed
clustering coefficient, shape of degree distribution constant but rank of individuals changes over time
Source: Empirical Analysis of an Evolving Social Network; Gueorgi Kossinets and Duncan J. Watts (6 January 2006) Science 311 (5757), 88.
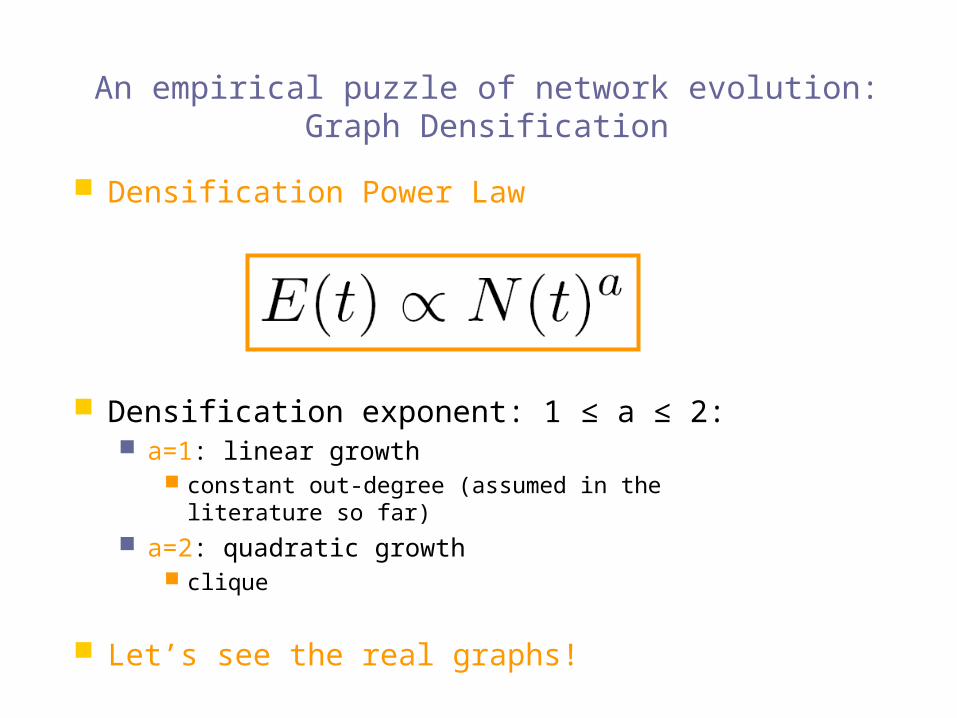
An empirical puzzle of network evolution:Graph Densification
Densification Power Law
Densification exponent: 1 ≤ a ≤ 2: a=1: linear growth
constant out-degree (assumed in the literature so far) a=2: quadratic growth
clique
Let’s see the real graphs!

Densification – Physics Citations
Citations among physics papers
1992: 1,293 papers,
2,717 citations 2003:
29,555 papers, 352,807 citations
For each month M, create a graph of all citations up to month M
N(t)
E(t)
1.69

Densification – Patent Citations
Citations among patents granted
1975 334,000 nodes 676,000 edges
1999 2.9 million nodes 16.5 million edges
Each year is a datapoint
N(t)
E(t)
1.66

Densification – Autonomous Systems
Graph of Internet 1997
3,000 nodes 10,000 edges
2000 6,000 nodes 26,000 edges
One graph per day
N(t)
E(t)
1.18

Densification – Affiliation Network
Authors linked to their publications
1992 318 nodes 272 edges
2002 60,000 nodes
20,000 authors 38,000 papers
133,000 edges
N(t)
E(t)
1.15

Graph Densification – Summary
The traditional constant out-degree assumption does not hold
Instead:
the number of edges grows faster than the number of nodes average degree is increasing

Diameter – ArXiv citation graph
Citations among physics papers
1992 –2003 One graph per year
time [years]
diameter

Diameter – “Autonomous Systems”
Graph of Internet One graph per day 1997 – 2000
number of nodes
diameter

Diameter – “Affiliation Network”
Graph of collaborations in physics authors linked to
papers
10 years of data
time [years]
diameter

Diameter – “Patents”
Patent citation network 25 years of data
time [years]
diameter

Densification – Possible Explanation
Existing graph generation models do not capture the Densification Power Law and Shrinking diameters
Can we find a simple model of local behavior, which naturally leads to observed phenomena?
Yes! Community Guided Attachment
obeys Densification
Forest Fire model
obeys Densification, Shrinking diameter (and Power Law degree distribution)

Community structure
Let’s assume the community structure
One expects many within-group friendships and fewer cross-group ones
How hard is it to cross communities?
Self-similar university community structure
CS Math Drama Music
Science Arts
University
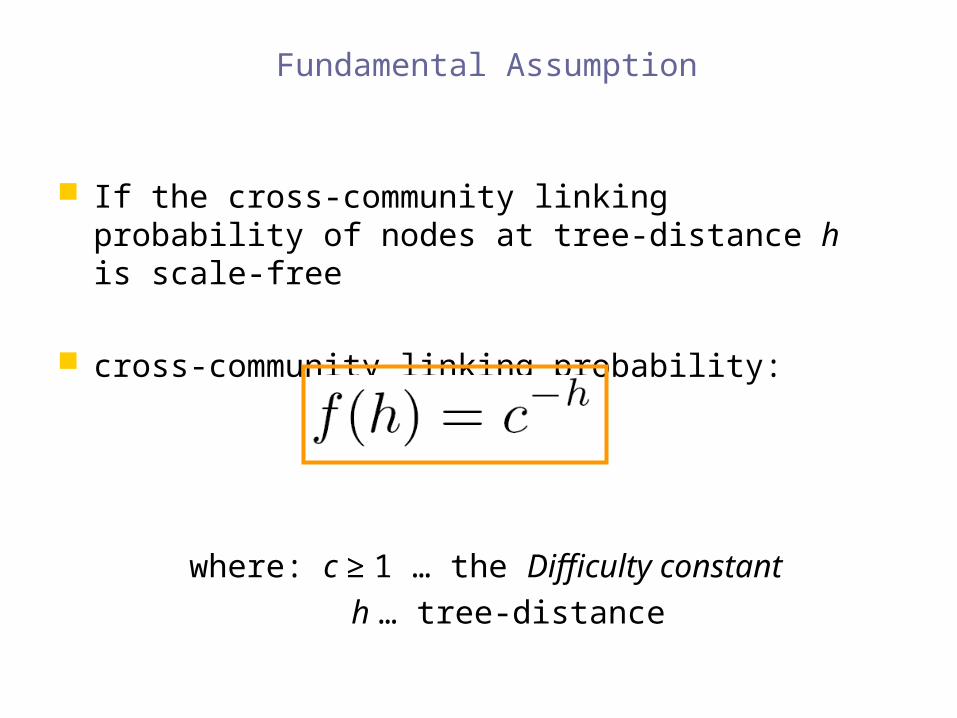
If the cross-community linking probability of nodes at tree-distance h is scale-free
cross-community linking probability:
where: c ≥ 1 … the Difficulty constant
h … tree-distance
Fundamental Assumption

Densification Power Law (1)
Theorem: The Community Guided Attachment leads to Densification Power Law with exponent
a … densification exponent b … community structure branching factor c … difficulty constant

Theorem:
Gives any non-integer Densification exponent
If c = 1: easy to cross communities Then: a=2, quadratic growth of edges
near clique
If c = b: hard to cross communities Then: a=1, linear growth of edges
constant out-degree
Difficulty Constant

Room for Improvement
Community Guided Attachment explains Densification Power Law
Issues: Requires explicit Community structure Does not obey Shrinking Diameters
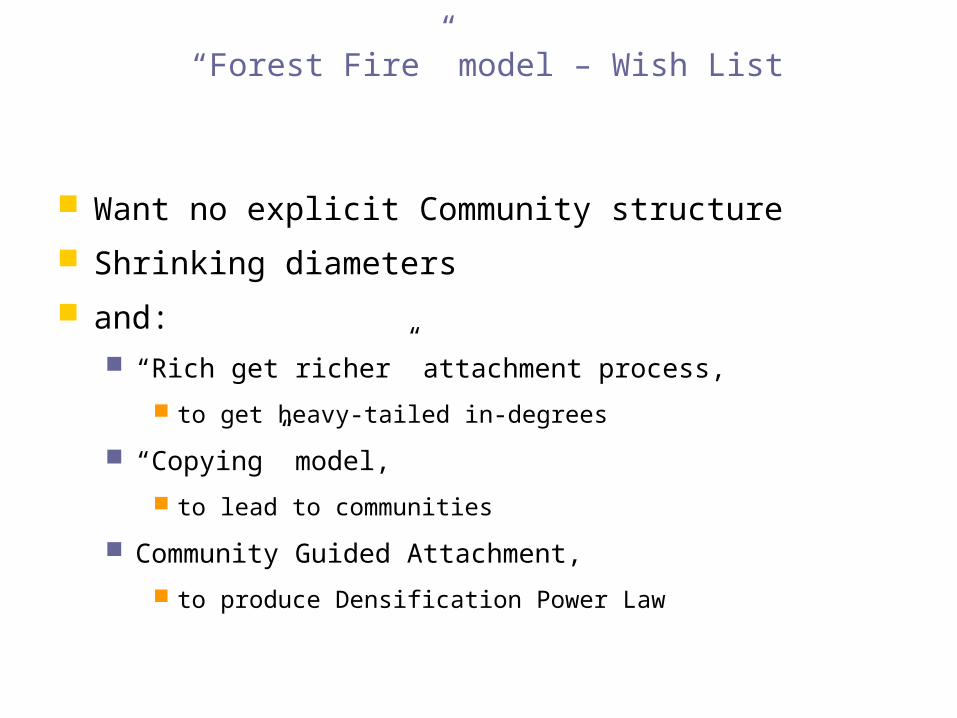
“Forest Fire” model – Wish List
Want no explicit Community structure
Shrinking diameters
and: “Rich get richer” attachment process,
to get heavy-tailed in-degrees
“Copying” model,
to lead to communities
Community Guided Attachment,
to produce Densification Power Law

“Forest Fire” model – Intuition (1)
How do authors identify references?
1. Find first paper and cite it
2. Follow a few citations, make citations
3. Continue recursively
4. From time to time use bibliographic tools (e.g. CiteSeer) and chase back-links

“Forest Fire” model – Intuition (2)
How do people make friends in a new environment?
1. Find first a person and make friends
2. Follow a of his friends
3. Continue recursively
4. From time to time get introduced to his friends
Forest Fire model imitates exactly this process
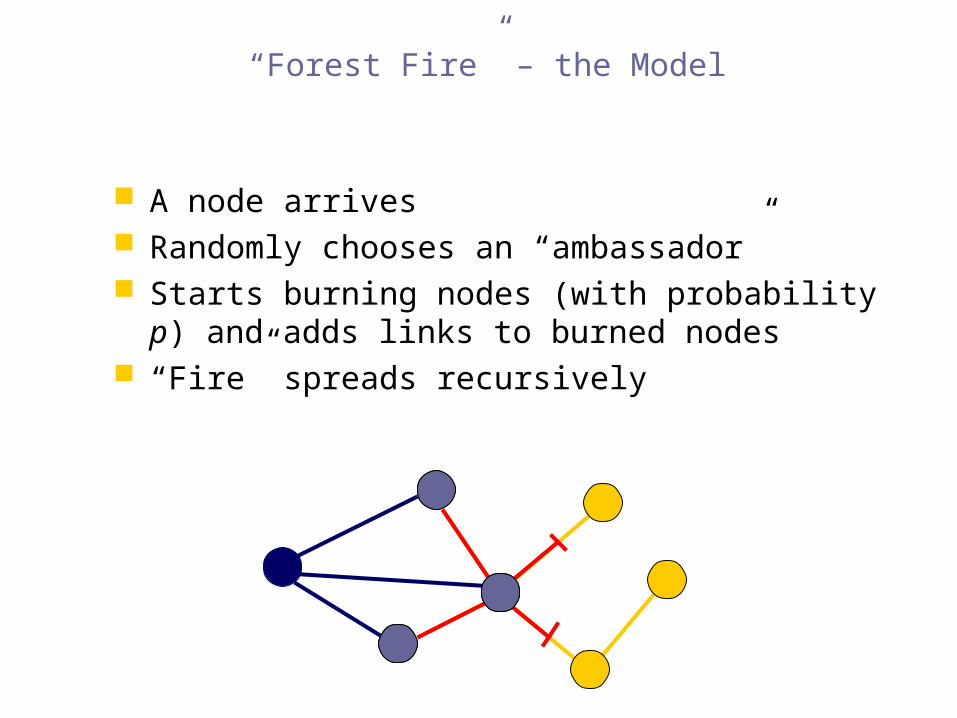
“Forest Fire” – the Model
A node arrives Randomly chooses an “ambassador” Starts burning nodes (with probability p) and adds
links to burned nodes “Fire” spreads recursively

54
Forest Fire in Action (1)
Forest Fire generates graphs that Densify and have Shrinking Diameter
densification diameter
1.21
N(t)
E(t)
N(t)
dia
me
ter

Forest Fire in Action (2)
Forest Fire also generates graphs with heavy-tailed degree distribution
in-degree out-degree
count vs. in-degree count vs. out-degree

Forest Fire model – Justification
Densification Power Law: Similar to Community Guided Attachment The probability of linking decays exponentially with the distance
Densification Power Law
Power law out-degrees: From time to time we get large fires
Power law in-degrees: The fire is more likely to burn hubs
Communities: Newcomer copies neighbors’ links
Shrinking diameter

wrap up
networks evolve
we can sometimes predict where new edges will form e.g. social networks tend to display triadic closure
friends introduce friends to other friends
network structure as a whole evolves densification: edges are added at a greater rate than nodes
e.g. papers today have longer lists of references


![Jure Leskovec (@jure)jure/talks/networks-icdm-dec12.pdf · Predict group evolution over time [Kairam, Wang, L. ‘ ] [Ducheneaut, Yee, Nickell, Moore ‘] Modeling circles of non-friends](https://static.fdocuments.us/doc/165x107/5f619b142e76e97795638311/jure-leskovec-jure-juretalksnetworks-icdm-dec12pdf-predict-group-evolution.jpg)