Lecture 2: Project Scheduling I - UWI St. Augustine€¦ · · 2008-06-11Lecture 2: Project...
23
Engineering Management 1 Lecture 2: Project Scheduling I Ruel Ellis Department of Mechanical and Manufacturing Engineering Network Scheduling Critical Path Method Program Evaluation & Review Technique Issues in Network Scheduling
Transcript of Lecture 2: Project Scheduling I - UWI St. Augustine€¦ · · 2008-06-11Lecture 2: Project...
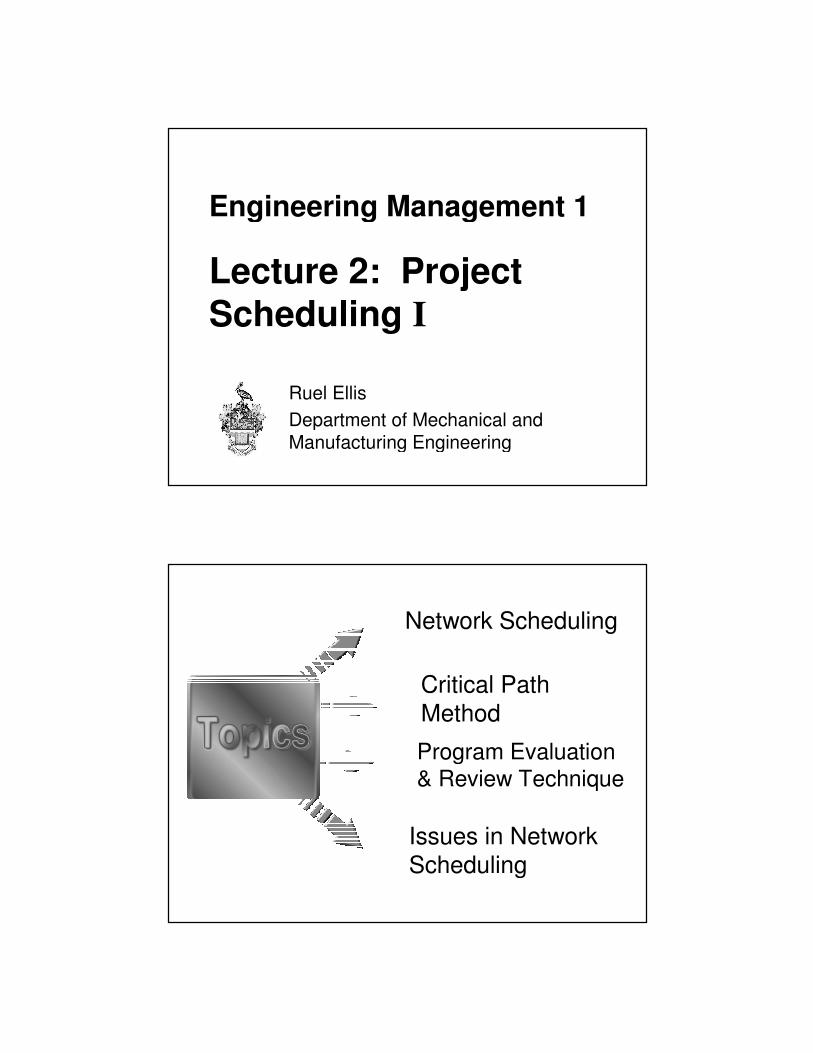
Engineering Management 1
Lecture 2: Project Scheduling I
Ruel EllisDepartment of Mechanical and Manufacturing Engineering
� Network Scheduling
� Critical Path Method
Program Evaluation & Review Technique�
� Issues in Network Scheduling

Net w or k S chedul ing
Net w or k S chedul ing P has es
Activity Definition Do what?
Activity Sequencing Activity relationship?
Duration Estimating Duration?
Project SchedulingI n what order?
Schedule ControlAdj us t schedule per formance?
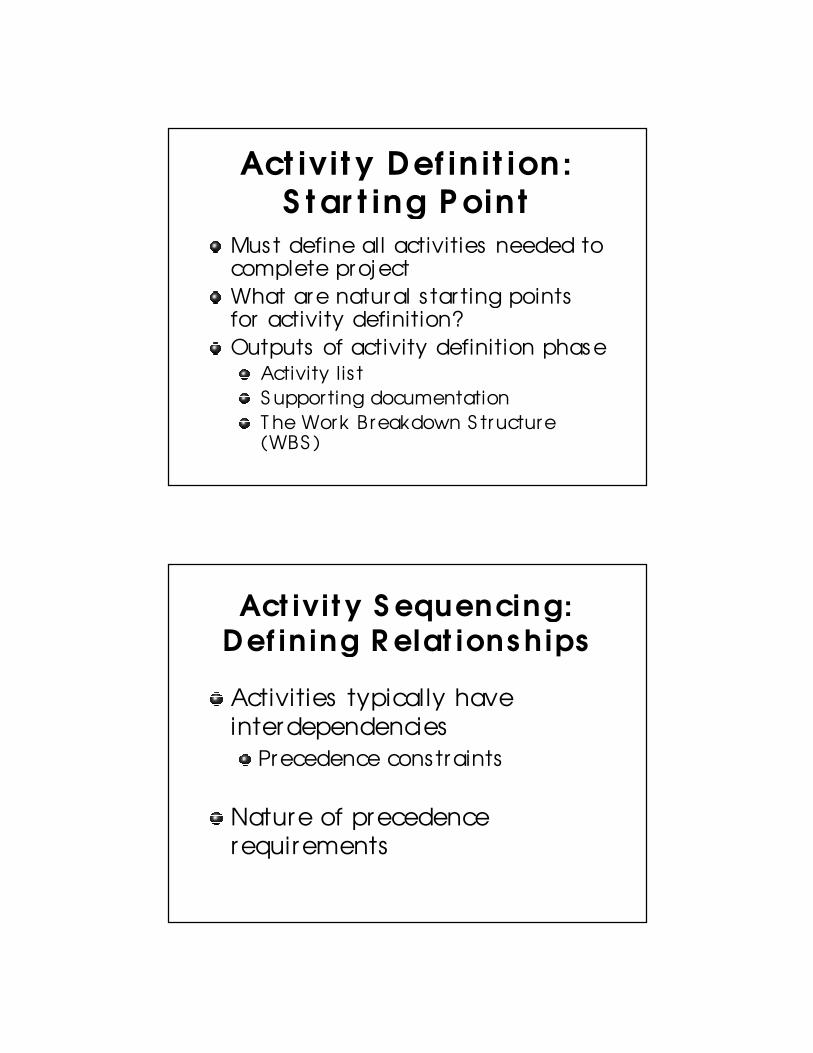
Act ivi t y Def in i t ion:S t ar t ing P oint
Mus t define all activities needed to complete proj ectWhat are natural s tar ting points for activity definition?Outputs of activity definition phase
Activity l is tS uppor ting documentationT he Work Breakdown S tructure (WBS )
Act ivi t y S equencing:Def in ing R elat ions hips
Activities typically have interdependencies
Precedence cons traints
Nature of precedence requirements
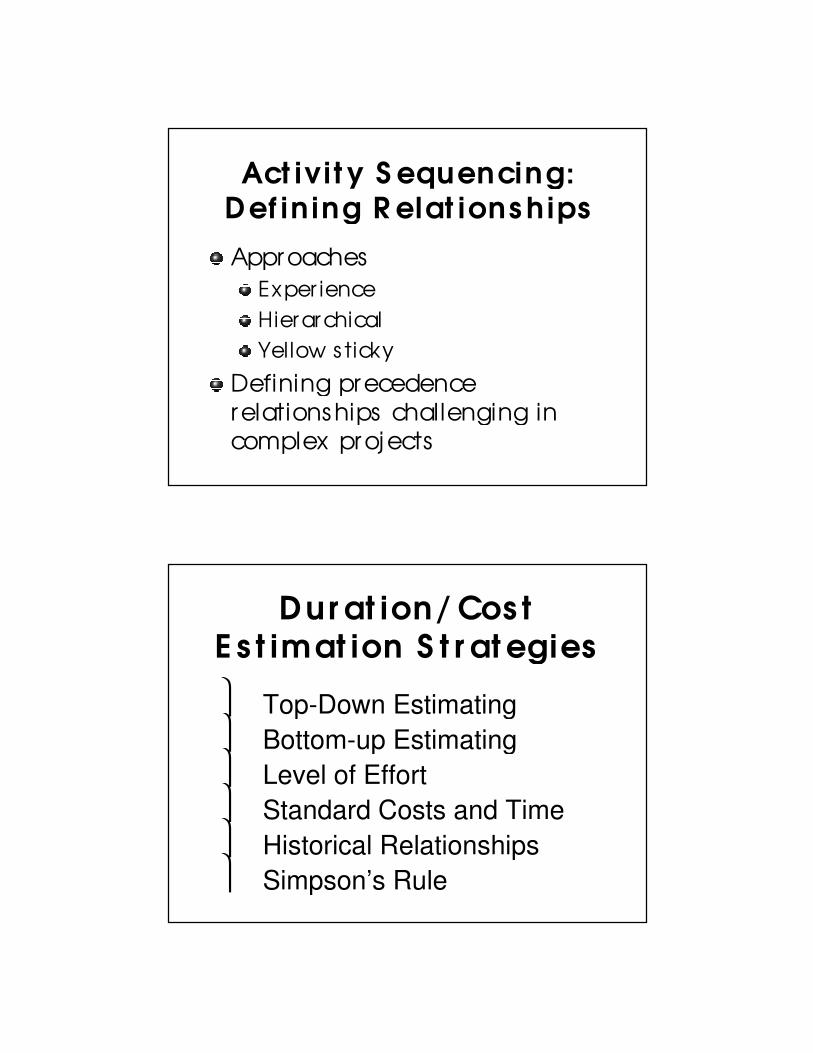
Act ivi t y S equencing:Def in ing R elat ions hips
ApproachesExper ienceHierarchicalYellow s ticky
Defining precedence relationships challenging in complex projects
Dur at ion/ Cos t E s t imat ion S t r at egies
Top-Down Estimating Bottom-up Estimating Level of Effort Standard Costs and Time Historical Relationships Simpson’s Rule

T op-Dow n E s t imat ing
I dentify large “blocks” of effor t from the WBS (task/subtask level)Es timate cos ts and time
S imilar work/exper t as ses sment/cos t es timating relations hips
S trength Quick
WeaknessMay be inaccurate and/or les s precise
L e ve l 2
L e ve l 1
L e ve l 3 L e ve l 3 L e ve l 3
L e ve l 2 L e ve l 2
L e ve l 1
P ro je ct
B ot t om-U p E s t imat ing
I dentify small “blocks” of effor t from the WBS (work package/activity level)
S um for higher level cos t es timates
S trength Greater confidence in “small increment” es timation
Weakness More time consumingMay s tack-up “contingency” planning by es timator s

L evel of E f f or t
ApproachPer form at high levelI dentify individuals needed
Number and j ob clas s ificationEs timate per iod each individual needed
How long wil l each individual be needed
L evel of E f f or t
S trength Quick
WeaknessFocus on people NOT tasks needed doneMay be inaccurate and/or les s precise

S t andar d Cos t s and T ime
Known/Repeatable activities and s tandard operationsLittle var iance in s imilar operations Not dependent on par ticular proj ect
S t andar d Cos t s and T ime
S trengthAccuracy increased, var iance decreased
Weakness Assumes s tandard activitiesAssumes his tor ical record available and cur rent

H is t or ical R elat ions hips
Stable ratios may exist -- for example: documentation, known activities, or prior efforts(C1/C2)=(Lines of code1/Lines of code2)n
Cost Estimating Relationships -- duration may vary as a function of some $ variable
cost = f(weight of spacecraft)cost=f(square feet of interior space)
Future = f(past) or f(parameter)
S imps on’s R ule f or E s t imat ion
T ime or cos t may vary from nominalCan les sen “anx iety” about es timatingUses nominal, minimum, and mos t likely values to es tablish es timate
Xexp Xmin + 4Xnom + Xmax
6=

P r oj ect S chedul ing
What is the purpose of proj ect scheduling?
T he WBS gives no sequencing of the different work packagesT he WBS gives no relationship between the work packagesMus t develop the logical relationships between work activities
By hand - - - computer s?
P r oj ect S chedul ing Appr oaches
Most common approachesMilestone ChartGanttCPM (Critical Path Method)PERT (Prog Eval and Rev Technique)PDM (Precedence Diagramming Method)
Other approaches - (sim, GERT,TOC)

Miles t one and Gant t Char t s :
Miles tone Char tsDepict pr incipal proj ect miles tones (events )Good Overview T oolGreat for ‘progres s repor ts ’
Miles t one and Gant t Char t s :
Gantt Char ts (aka Bar Char ts )S how activity s tar t and s top timesDo not show precedence relationships
May but becomes cumbersome
Great management presentation tools

P r oj ect Net w or ks
Net w or k Analys is
T wo approachesActivity on Ar row (AOA)Activity on Node (AON)
More typical definition CPM - determinis tic proj ect schedulePERT - probabilis tic proj ect schedule

Act ivi t y on Node:F undament al R elat ions hips
A B C
X
Y
Z
J
K
L
M
J
K
L
M
Act ivi t y on Ar r ow :F undament al R elat ions hips
2 7A
2 7
3
6
14
A
D
B F7
3
6
3
6
A
B
F
R

Net w or k S chedul ing –Cr i t ical P at h
Met hod ( CP M)
P r oj ect Net w or ks :B as ic R ules
Flow from left to r ightActivity cannot begin until connected activities have completedAr rows indicate precedence & flowEach activity has unique I DLooping (or cycling) not allowedConditional s tatements not allowedHave unique s tar ting point

E xample:T he E ngineer ing Cent er
D ura tio n(da ys )
A Application approval N one 5B C onstruction p lans A 15C Traffic study A 10D Service availability check A 5E Staff report B ,C 15F C ommission approval B ,C ,D 10G C enter C onstruction F 170H Occupancy E,G 35
A c tivity D e s c riptio n P re de c e s s o rs
I mplement ing CP M:Act ivi t y on Ar r ow
Will i l lus trate AOA CPM on the Engineer ing Center exampleT ake special note of:
Dummy act ivi t yForward and backward passEar lies t/lates t S tar t timesEar lies t/lates t F inish timesConcept of s lack (float)Concept of cr itical pathAssumption of unlimited resources

Act ivi t y on Ar r ow Not at ion
1 2A(ES ,EF)
Dur (LS ,LF)
AOA vs . AON:A Mat t er of P r ef er ence
Advant agesNo dummy activitiesEvents not usedEasy to drawActivity emphas is
Advant agesPath tracing easyEas ier to draw for complex proj ectsHighlights key events
AON** AOA

AOA vs . AON:A Mat t er of P r ef er ence
Dis advant agesPath tracing difficultNetwork drawing may be complex
Dis advant agesMay require dummy activitiesDetracts from activities
AON** AOA
P r ogr am E valuat ion
and R eview T echnique
( P E R T )
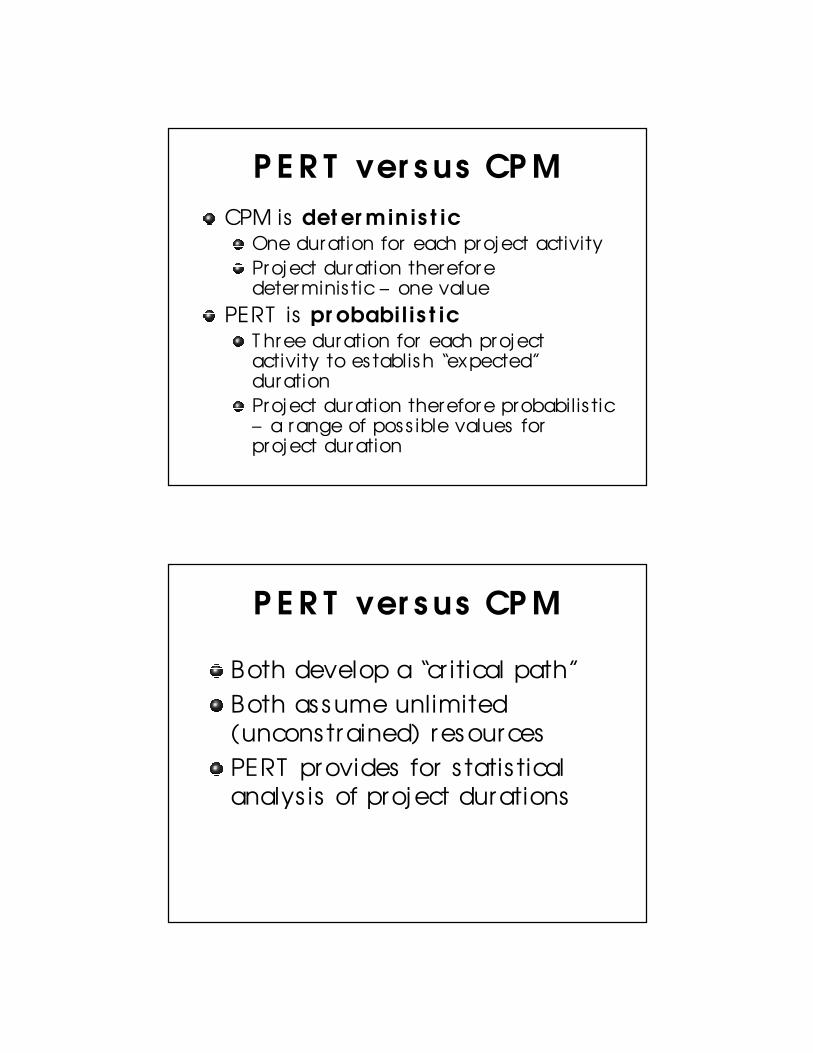
P E R T ver s us CP M CPM is det er min is t ic
One duration for each proj ect activityProj ect duration therefore determinis tic – one value
PERT is pr obabi l is t icT hree duration for each proj ect activity to es tablish “expected” durationProj ect duration therefore probabilis tic – a range of pos s ible values for proj ect duration
P E R T ver s us CP M
Both develop a “cr itical path”Both as sume unlimited (uncons trained) res ourcesPERT provides for s tatis tical analys is of proj ect durations

P E R T :Not hing is Cer t ain
S imilar ity to CPM methodApproach to activity duration es timationRole of the cr itical pathProj ect duration s tochas tic
Use of the CLT to as sume normalityDetermining mean and var iance
Calculating P(proj ect duration > X)Under lying as sumptions
Analys is of t he P E R T
Net w or k -E XAMP L E

P E R T Analys is E xample • Will demonstrate concepts using
example
1 2
3
4
5 6
Activity a m b E(duration) Std Dev (duration)
1-2 17 29 47 30 5 2-3 6 12 24 13 3 2-4 16 19 28 20 2 3-5 13 16 19 16 1 4-5 2 5 14 6 2 5-6 2 5 8 5 1
(a + 4m + b)/6
Activity a m b E(duration) Std Dev (duration)
1-2 17 29 47 30 5 2-3 6 12 24 13 3 2-4 16 19 28 20 2 3-5 13 16 19 16 1 4-5 2 5 14 6 2 5-6 2 5 8 5 1
(b-a)/6
Activity a m b E(duration) Std Dev (duration)
1-2 17 29 47 30 5 2-3 6 12 24 13 3 2-4 16 19 28 20 2 3-5 13 16 19 16 1 4-5 2 5 14 6 2 5-6 2 5 8 5 1
P E R T CP at h Var iance• I F YOU AS S UME I NDEPENDENCE
the var iance of any path = sum of activity var iances for all activities on that path
• NORMALLY DI S T RI BUT ED• Var iance of the PROJECT =
var iance of the CRI T I CAL PAT H• I f more than one cr itical path,
PROJECT VARI ANCE= larges t of CRI T I CAL PAT H VARI ANCES

P E R T Var iance
S ince NORMALLY DI S T RI BUT EDcan es timate probability of completing project on timecan es timate probability of completing project by any target date
if cr itical path expected = 64, S T D DEV= 6T arget= 70 Z = (70-64)/6 = 1probabil ity = 1 - .84 = .16
P E R T E s t imat esS o what do you mean by
optimis tic, pes s imis tic?value you expect to be exceeded at a
probability level and not exceeded at 1-αα probability
• PROBLEM: es timating the MOS T LI KELY duration of mos t things is hard
• Asking es timator s to come up with “What won’t be exceeded 95% of the time” is a guess at bes t.

I s s ues in Net w or k
S chedul ing
S hor t E xer cis e Net w or k S cheduling
I dentify three cr itical is sues , as sumptions , or l imitations in the use of network diagrams as a project management tool?

P r oj ect S chedul ing I s s ues
A typical project has les s than 10% of activities which are identified as cr iticalPoint vs . probabilis tic es timates
P r oj ect S chedul ing I s s ues
CPM or PERT : Research on PERT /CPM proj ects
T echnical per formance - - No s ignificant differenceProbability of cos t & schedule over runs - - S ignificant difference
Adequacy of es timates & WBSUncons trained resources