Steam Sterilization Principles Sterilization Principles Sterilization steam sterilization.
Upload
kristina-wilkinsonCategory
view
213download
0
LECTURE 16 -- CASE STUDY: RECENT MACROECONOMICS OF CHINA
1. Sterilization of reserve inflows in 2004-082. Exchange rate policy3. Overheating & response:
The macroeconomy in 2006-084. GFC & response: The macroeconomy in 2009-105. Monetary tightening in 2010-116. The end of undervaluation 2012-147. Current troubles, 2015
Appendices(i) Did China’s GDP pass the US in 2014?(ii) Chinese growth slowdown(iii) Macro-prudential policy

1. Sterilization of reserve inflows, 2004-08 (continued from end of Lecture 4)
• BoP surplus • Its sources• Reserves
• Initially successful sterilization• Declines in NDA• Increases in reserve requirements
• Limits to sterilization• Costs• Diminishing effectiveness

3
Source: HKMA, Half-Yearly Monetary and Financial Stability Report, June 2008
The Balance of Payments
rose rapidly in China from 2004 on, due to all 3 components: trade balance, Foreign Direct Investment & portfolio inflows
Reserves BoP
L4 appendix

BP ≡ dR/dt >> 0
API-120 - Prof. J.Frankel, Harvardhttp://viableopposition.blogspot.com/2012/03/chinas-holdings-of-us-treasuries-what.html
http://qz.com/171645/the-invisible-man-managing-chinas-3-8-trillion-in-reserves-just-stepped-down
FX reserves of the PBoC climbed higherthan any central bank in history.
L4 appendix

Sterilization of foreign reserves: The People’s Bank of China sold sterilization bills,
thereby taking cash RMB out of circulation: dNDA/dt < 0.
Data: CEIC Source: Zhang, 2011, Fig.4, p.45.
L4 appendix

API-120 - Prof. J.Frankel, Harvard
Sterilization of foreign reserves:The decreases in PBoC’s net domestic assets
counteracted increases in foreign assets
Source: Zhang, 2011, Fig.7, p.47.
Optional,

While increases in reserves (NFA) were large, changes in net domestic assets (NDA) were negative, limiting rises in the monetary base.
Appendix: More on China’s sterilization
ΔReserves↑
Optional,

In 2003-06, the PBoC had little troublesterilizing the rising reserve inflows.
Growth of monetary base & its components:
API-120 - Prof. J.Frankel, Harvard
Source: HKMA, Half-Yearly Monetary & Financial Stability Report, June 2008
\FX reserve contribution

In 2007-08 China had more trouble sterilizing the reserve inflow
• Money growth accelerated
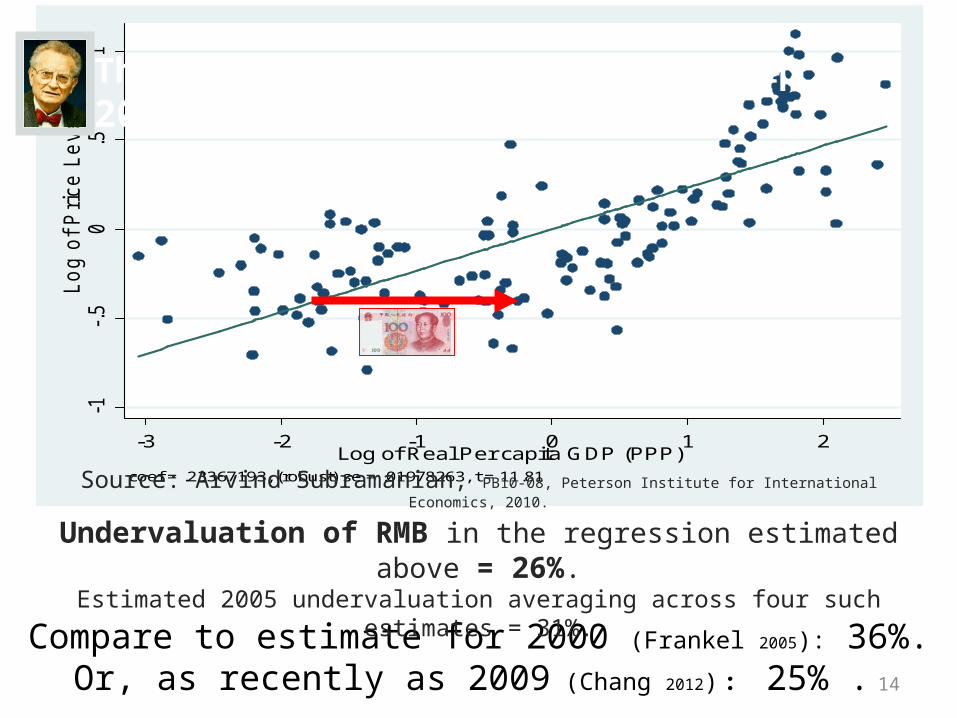
• Inflation became a serious problem in 2007-08.
• Also a “bubble” in the Shanghai stock market.
• PBoC began to have to payhigher domestic interest rates – and to receive lower interest rate on US T bills – => “quasi-fiscal deficit” or “negative carry.”

Sterilization faltered in 2007-08
Source: HKMA, Half-Yearly Monetary & Financial Stability Report, June 2008
Money growth accelerated sharply

The sterilization shows up as a steadily rising share of foreign reserves (vs. domestic assets) in the holdings of the People’s Bank of China
Chang, Liu & Spiegel, Fig. 1, p.26Chang, Liu & Spiegel, 2015, “Capital Controls and Optimal Chinese Monetary Policy” FRB SF WP 2012-13

“Cost of carry”: By 2008 the cost of domestic funds exceeded the interest rate the PBoC was earning
on its foreign reserves (US Treasury bills)
Chang, Liu & Spiegel, Fig. 2, p.27
Chang, Liu & Spiegel, 2015, “Capital Controls and Optimal Chinese Monetary Policy,” FRB SF WP 2012-13
} Cost of carry

2. Exchange Rate PolicyAs of 2005, there were several good reasons to allow RMB appreciation, leaving aside US pressure.i. External balance: Reserves were increasing rapidly
– to levels high enough for precautionary purposes.– Sterilization would become more difficult.
ii. Internal balance: The economy was overheating.
iii. Currency regime: A country as large as China should have a flexible exchange rate.
– Better to exit the peg in good times than in crisis.
iv. PPP: The RMB was “undervalued” by the price criterion– even taking into account China’s GDP/cap (Balassa-Samuelson).
Frankel, 2006 "On the Yuan: The Choice Between Adjustment Under a Fixed Exchange Rate and Adjustment under a Flexible Rate," Understanding the Chinese Economy, G. Illing, ed. (Oxford U. Press).
14
-1-.
50
.51
Lo
g o
f P
rice L
evel
-3 -2 -1 0 1 2Log of Real Per capita GDP (PPP)
coef = .23367193, (robust) se = .01978263, t = 11.81
Compare to estimate for 2000 (Frankel 2005): 36%.Or, as recently as 2009 (Chang 2012) : 25% .
The Balassa-Samuelson Relationship2005
Source: Arvind Subramanian, PB10-08, Peterson Institute for International Economics, 2010.
Undervaluation of RMB in the regression estimated above = 26%.Estimated 2005 undervaluation averaging across four such estimates = 31%.

15
The RMB was allowed to rise against the $ 2006-08, though it returned to a peg in mid-2008.

Appreciation versus the US $,nominal and real, 2005-11
0.9
1.0
1.1
1.2
1.3
1.4
1.5
2005 2006 2007 2008 2009 2010 2011
CNY/USD,2005M06=1
nominal
real

Appreciation vs. index of currencies,nominal and real, 2005-11
0.95
1.00
1.05
1.10
1.15
1.20
1.25
1.30
1.35
2005 2006 2007 2008 2009 2010 2011
CNY Index,2005M06=1
Real valueof CNY
Valueof CNY

3. Overheating & response: The macroeconomy in 2006-08
Growth > 10%
China’s CPI accelerated in 2007-08
API-120 - Prof. J.Frankel, HarvardSource: HKMA, Half-Yearly Monetary and Financial Stability Report, June 2008
Inflation 1999 to 2008
L4 appendix

Apparent 2007-08 bubble in Shanghai stock market, foreshadowing 2015
L4 appendix

21
China’s position in the Swan Diagram in 2008 showed a large TB surplus plus overheating. It called for appreciation.
Excgange rate E in RM
B/$
YY:Internal balance
Y =
ED & TD
ES & TD
ES & TB>0
China 2006-08
BB:External balance
CA=0
China2002
ED & TB>0
Spending A

API-120 - Prof. J.Frankel, Harvard
Another tool: The PBoC raised banks’ required reserve ratios,thus sterilizing in the broad sense of slowing M1, even if M Base grew rapidly.
Source: Zhang, 2011, Fig.6, p.46.

Source: HKMA, Half-Yearly Monetary & Financial Stability Report, June 2008
“financialrepression”{
and also raising lending rates The PBoC tightened money by raising reserve ratios .
while continuing to underpay depositors:
L4 appendix
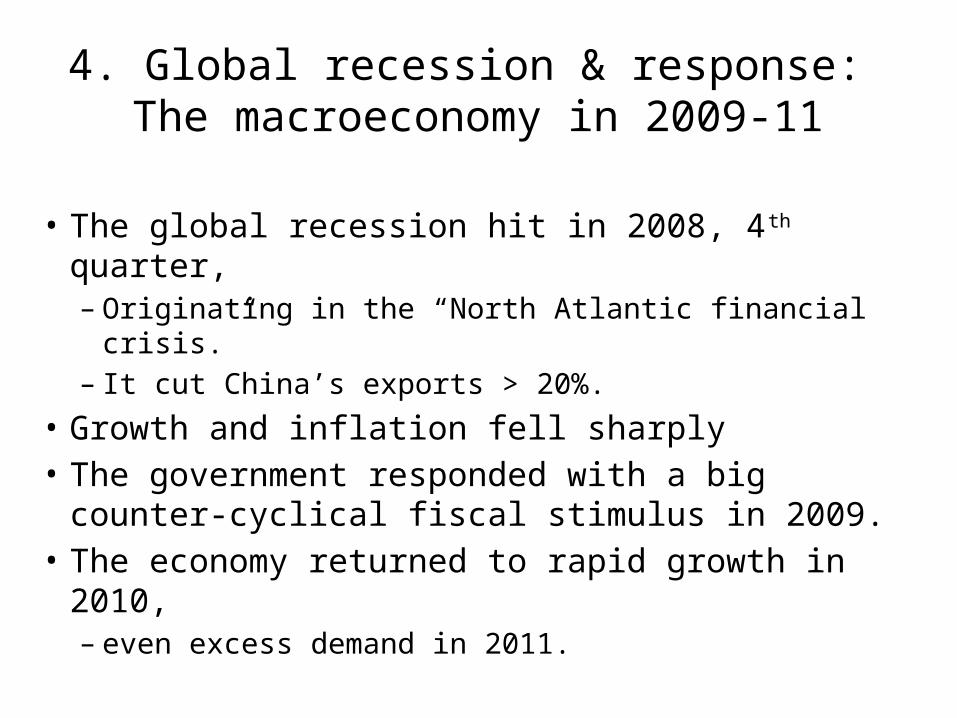
4. Global recession & response: The macroeconomy in 2009-11
• The global recession hit in 2008, 4th quarter,– Originating in the “North Atlantic financial crisis.”– It cut China’s exports > 20%.
• Growth and inflation fell sharply• The government responded with a big counter-
cyclical fiscal stimulus in 2009.• The economy returned to rapid growth in 2010,
– even excess demand in 2011.

China was hit by the 2009 global recession.
2005-July 2015

26
China’s position in the Swan Diagram in 2009: Hit by global recession. The government responded with effective demand expansion.
Exchange rate E in RM
B/$
YY:Internal balance
Y =
ED & TD
ES & TD
ES & TB>0
China 2008 BB:
External balanceCA=0
ED & TB>0
Spending A
China2009
China 2010-11

China government investment spending in 2009counteracted the recession.
Reserve Bank of Australia

API-120 - Prof. J.Frankel, Harvard
China’s inflation broke sharply in 2009,
Inflation 2001 to 2011
But took off again in 2010-11.

Overheating resumed in 2010.It showed up also as rapid rise of land prices.
API-120 - Prof. J.Frankel, Harvard
Real Beijing land prices
5. Monetary tightening, 2010-11

When house prices rise relative even to rents, it suggests a bubble or easy money
API-120 - Prof. J.Frankel, HarvardScott Reeve blog

China in 2010 resumed attempts to rein in M1 growth.
API-120 - Prof. J.Frankel, Harvard

China tightened monetary policy in 2007 and again in 2011,
June 1, 2015, Fiscal Times, http://www.thefiscaltimes.com/Columns/2015/06/01/Why-China-s-Stock-Bubble-Isn-t-Ready-Burst

API-120 - Prof. J.Frankel, HarvardFxtimes.com
China’s tightened money in 2010-11 to help head off rising inflation,
as it had in 2004& 2008.

API-120 - Prof. J.Frankel, Harvard
Chinese inflation, once again, began to ease off after 2011
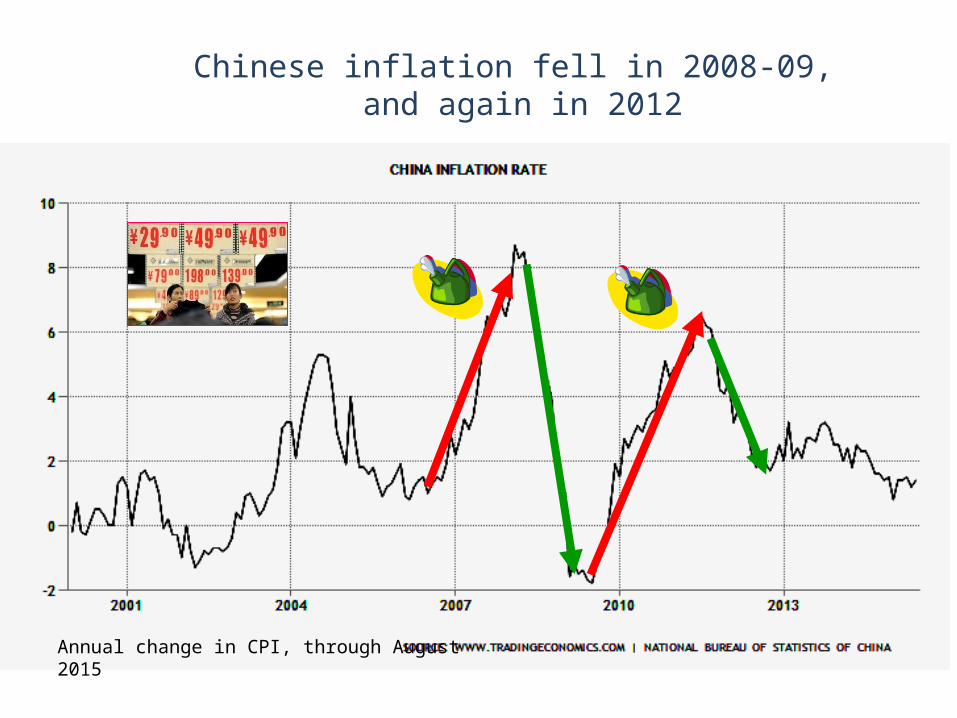
Chinese inflation fell in 2008-09, and again in 2012
Annual change in CPI, through August 2015

At least one indicator still suggested that credit was plenty easy as recently as 2013.

Besides tightening monetary policy in 2011, China also tightened macroprudential policies, particularly in housing finance:
Maximum Loan-to-Value and Debt-Service-to-Income rations
Fig.3, Kenneth Kuttner & Ilhyock Shim, “Can non-interest rate policies stabilize housing markets? Evidence from a panel of 57 economies,” NBER WP 19723, 2013.
Interest rate and credit policies in China

• Various key measures suggest that China achieved much of the needed trade adjustment between 2009 and 2013:
• Substantial real appreciation of the RMB has brought it closer to equilibrium. – Some nominal appreciation &– Some price inflation and, especially, wage increases.
• Its current account surplus peaked in 2008– > 10% of GDP – and then narrowed dramatically, to <2% in 2013.
6. The end of undervaluation? 2011-14

Adjustment of relative prices
• The famous “China price”:– Ever since China rejoined the world economy
3 decades ago, its trading partners have been snapping up exports of manufacturing goods,
– because low Chinese wages made them super-competitive on world markets.
• But relative prices adjusted– following the laws of market economics.

Adjustment of relative prices, continued
• The change in relative prices is reflected as real exchange rate appreciation. – This comprises, in part, nominal appreciation
– and, in part, Chinese inflation.
– Government officials would have been better advised to let more of the real appreciation take the form of nominal appreciation ($ per RMB).
– But since they didn’t, it showed up as inflation instead.

Against an average of currencies, rather than just the $, the RMB hit a record high in 2014.
41http://www.cesifo-group.de/ifoHome/policy/EEAG-Report/Archive/EEAG_Report_2015/eeag_2015_report.html

A trend of real appreciation since 2005
Dooley, Folkerts-Landau, Garber (2014)

China’s trade surplus peaked in 2007, and then fell.
Source: Reserve Bank of Australia (June 2013)
China runs a deficit in primary products, offset by a surplus in manufactures.

44
China’s trade balance
The bilateral surplus with the United Statesis as big as ever – which has no economic importance,
but is politically sensitive.

The natural adjustment process was delayed.
• 1st, because the authorities intervened to keep the exchange virtually fixed against the dollar, in the years 1995-2005 and 2008-2010.
• 2nd, wages had not fully adjusted to (rising) marginal product of labor in coastal factories– surplus labor in countryside (A.Lewis, 1954)– impediments to migration (hukou system).
• China continued to undersell the world.

But prices eventually adjusted.
• Labor shortages began to appear => China’s urban workers won rapid wage hikes.
• Meanwhile another cost of business, land prices, rose even more rapidly.
• The yuan was finally allowed to appreciate against the $ during 2005-08 & 2010-11, by 25% cumulatively
• =17% + 8%, • though less against other currencies.

Chinese wages rose
47Source: “China’s wage inflation,” marketrealist.com, Aug. 28, 2013

In response to rising wages, some labor-intensive manufacturing has moved out of China
48Source: Noel Maurer, April 2013
Mexican employment is rising

“Is the Renminbi Still Undervalued? Not According to New PPP Estimates”M.Kessler & A.Subramanian, PIIE, May 2014
API-120 - Prof. J. Frankel
Benchmark years GDP per capita (in PPP dollars) RMB undervaluation (percent)
2005 4,802 -34.5
2011 10,057 -9.7
In 2014, the ICP released new absolute price data.Balassa-Samuelson estimated for 2011

5 types of adjustment are gradually reallocating resources in response to the new high level of costs
in the factories of China’s coastal provinces:
• 1st, some manufacturing is migrating inland, – where wages & land prices are still relatively low.
• 2nd, export operations are shifting to Vietnam or Bangla Desh – where wages are lower still.
• 3rd, Chinese companies are beginning to automate, – substituting capital for labor.
• 4th, they are moving into more sophisticated products, – following the path blazed earlier by Japan, Korea, & other Asian tigers
• in the “flying geese” formation.
• 5th, multinational companies that had in the past moved some stages of their production process to China, out of the US or other high-wage countries, are now moving back.

• American politicians find it hard to let go of the syllogism that seemed so unassailable just a decade ago:– (1) The Chinese have joined the world economy; – (2) their wages are $0.50 an hour; – (3) there are a billion of them, and so – (4) their exports will rise without limit:
“Chinese wages will never be bid up in line with the usual textbook laws of economics because the supply labor is infinitely elastic.”
• But it turns out that the laws of economics do eventually apply after all -- even in China.

Expansion of the services sector.
This 6th dimension of adjustment still lags behind,
• despite the consensus in favor of it.
• China has had great success in manufacturing– especially via exports.
• Now it needs to help the other side of the economy catch up: services, via domestic demand– Retail, education, environmental quality,– health care, pensions, social safety net.
• Some of this could be done via government spending– with the economy in slowdown in 2014-15,– as China did in 2009; but that was heavy investment.

Aug. 25, 2015
…which fed a huge stock
market bubble.
In 2014-15, growth slowed substantially,
probably below the official 7 %.
The PBoC responded by cutting interest rates, Nov. 2014-Aug. 2015
7. Current troubles

Chinese foreign exchange reserveshave been falling since June 2014.
American politicians never got the memo, but:
Through August 2015 DATA SOURCE: PEOPLE’S BANK OF CHINA, via TRADINGECONOMICS.COM

You would never guess it from recent commentary, but:
China’s stock market regulator raised margin requirements during the 2015 bubble,
in January & April and on June 12.

See appendices
i. The Chinese growth miracle– Did China’s GDP surpass the US in 2014?
ii. Is China’s current slowdown a new trend?– If so, is it a middle-income growth trap?
iii. Countercyclical use of macro-prudential policies by China & some other Asian countries.

35 years of strong Chinese growth

China was the world’s largest economy two centuries ago, and appears headed for #1 again.
The global contribution by major economies from 1 AD to 2008 AD according to estimates by Angus Maddison(2007), Contours of the World Economy I-2030AD, (Oxford University Press).
PPP basis

Appendix (i): Has China’s GDP surpassed the US?
Headlines, December 2014:
China surpasses U.S. to become largest world economy FoxNews.com 12/6
…based on the latest 6-year update from the World Bank’s International Comparison Program.
59

The facts• On the one hand, China’s economic miracle is genuine:
– Growth ≈ 10% p.a. for 3 decades is historic.– It took the UK 58 years to double income, starting from 1780
• US: 47 years, from 1839• Japan: 35 years, from 1885• Korea: 11 years, from 1966
– But it took China only around 8 years, from 1987 !
• On the other hand, China is still poor as of 2014: – It ranks only midway among 190 countries (85th , just above Peru).
• The claim to rival US in size comes from multiplying a middle income-per-capita times 1.3 billion people.
60

Measuring GDP The dragon takes wingNew data suggest the Chinese economy is bigger than previously thought May 3rd 2014 |
61http://www.economist.com/news/finance-and-economics/21601568-new-data-suggest-chinese-economy-bigger-previously-thought-dragon
Korea

China’s GDP reportedly passed the US in 2014.
62
But that is a mis-application of the PPP numbersfrom the World Bank’s ICP project.

Use PPP rates to compare income
per capita
• e.g., to judge if:– governments have
successfully raised living standards;
– a country is rich enough to cut pollution;
– the currency is “undervalued,” given its income.
63
Use actual exchange rates to compare GDP
• e.g., to judge:– How big is the market,
from the view of multinational companies?
– How big should a country’s quota be in the IMF?
– How many ships can its navy buy?
– How big is the global role for its currency?

64
Measuring GDP Using actual exchange rates gives a different answer: The US is still 83% bigger than China.
Thanks to Qing Yu
2014 with IMF WEO forecast
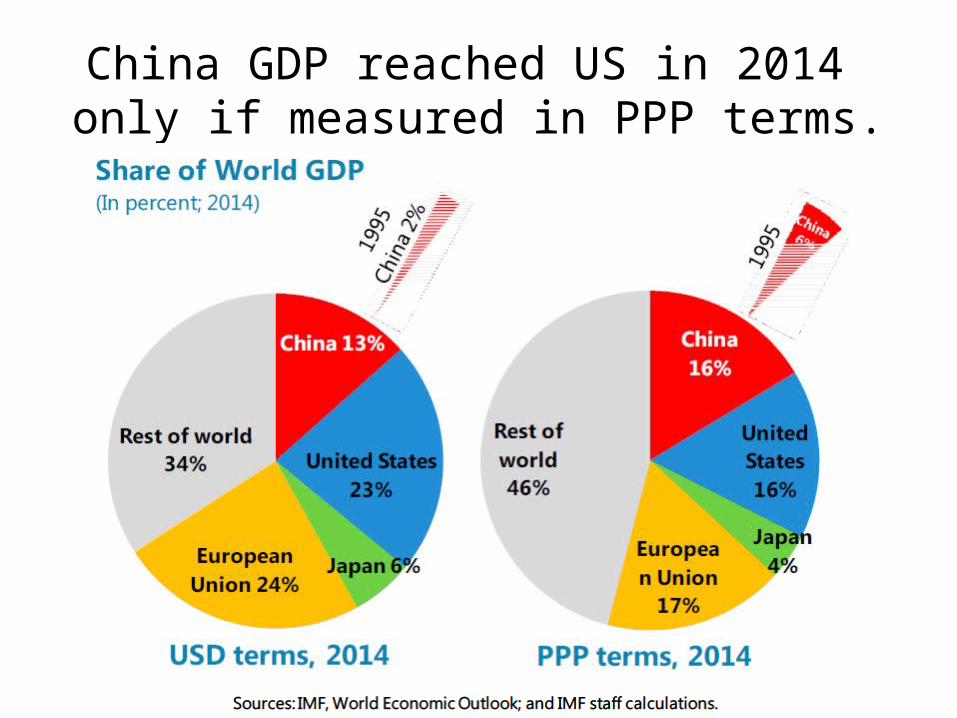
China GDP reached US in 2014 only if measured in PPP terms.

China has not yet overtaken the US.
The cross-over won’t come before the 2020s. In 2021, even under aggressive projections: real growth differential = 5%; real appreciation = 3%.
Author’s calculations.(Thanks to Qing Yu.)

Appendix (ii): Transition to slower growth path
• The slowdown in 2014-15 to about 7% (officially)– Convergence (K/L ratio, urban migration, technical catch-up, …)– Middle-income trap? e.g., Eichengreen, Park & Shin (2012)
– Regression to the mean: Pritchett & Summers (2014)
• Transition with hard-landing or soft-landing?– Debt
• Leverage becomes unsustainable when growth slows.• Bad loans in the shadow banking system.
– Some needed reforms & the Third Plenum of 2013• Rural land rights and hukou system• Market orientation• Environment
– The need to shift composition of GDP • From Investment and Net Exports, to Consumption• From Manufacturing to Services

“Is there a middle-income growth trap?”
Eichengreen, B, D Park and K Shin (2011), “When Fast Economies Slow Down: International Evidence and Implications for China”, NBER WP 16919
“Formal evidence on growth slowdowns and middle-income traps has suggested that at per capita incomes of about US$16,700 in 2005 constant international prices, the growth rate of per capita GDP typically slows from 5.6 to 2.1%.Using regression and standard growth accounting techniques, recent analysis (Eichengreen, Park, and Shin 2011) suggests that growth slowdowns are essentially productivity growth slowdowns
“Avoiding middle-income growth traps,” Pierre-Richard Agénor, Otaviano Canuto, Michael Jelenic ,VoxEU, 21 December 2012

Pritchett & Summers (2014): Regression to the mean fits the data better than middle-income trap
“Asiaphoria Meets Regression to the Mean,” NBER WP No. 20573, Lant Pritchett and Lawrence Summers

Specific examples of macro-prudential policies• Banks: reserve requirements
– E.g., higher on fx liabilities than domestic.
• Stock market: Margin requirements
• Housing market: • Maximum Loan/value ratio• Maximum Debt service/income ratio• Prohibition on foreign-currency mortgages
• A surprising possible conclusion –Emerging Market countries are successfully applying these tools in a counter-cyclical manner more than are the US and other advanced countries.
Appendix (iii) Macro-prudential policies in Asia

Federico, Végh & Vuletin find that developing countries use reserve requirements countercyclically
far more than advanced countries do.
Pablo Federico, Carlos Végh, and Guillermo Vuletin, "Reserve Requirement Policy over the Business Cycle," NBER Working Paper No. 20612, October 2014, and "Effects and Role of Macroprudential Policy: Evidence from Reserve Requirements Based on a Narrative Approach," presented at 2014 Central Bank of the Republic of Turkey-NBER Conference on Monetary Policy and Financial Stability in Emerging Economies

Asia-Pacific & other EM countries take macro-prudential actions more often than advanced countries do -- Kuttner & Shim (2013)
Kenneth Kuttner & Ilhyock Shim, “Can non-interest rate policies stabilize housing markets? Evidence from a panel of 57 economies,” NBER WP 19723, 2013.

Kuttner & Shim (2013): Ceilings on ratios of Debt Service to Income significantly affect housing credit.
Interest rate and credit policies in ChinaInterest rate and credit policies in Korea
Kenneth Kuttner & Ilhyock Shim, “Can non-interest rate policies stabilize housing markets? Evidence from a panel of 57 economies,” NBER WP 19723, 2013.