Lecture 12b Recent Warming. The Main Evidence The Global Temperature Record: 1860 - today.
20
Lecture 12b Lecture 12b Recent Warming Recent Warming
-
date post
22-Dec-2015 -
Category
Documents
-
view
214 -
download
0
Transcript of Lecture 12b Recent Warming. The Main Evidence The Global Temperature Record: 1860 - today.

Lecture 12bLecture 12b
Recent WarmingRecent Warming

The Main EvidenceThe Main Evidence
The Global Temperature Record: The Global Temperature Record: 1860 - today1860 - today

The Global Historical Climate The Global Historical Climate Network (GHCN)Network (GHCN)

Global Mean Temperature – Global Mean Temperature – Instrumental PeriodInstrumental Period
Source: http://www.cru.uea.ac.uk/cru/data/temperature/
Tem
pera
ture
Ano
mal
y (o C
) Note the strong positive anomalies 1998, 2010
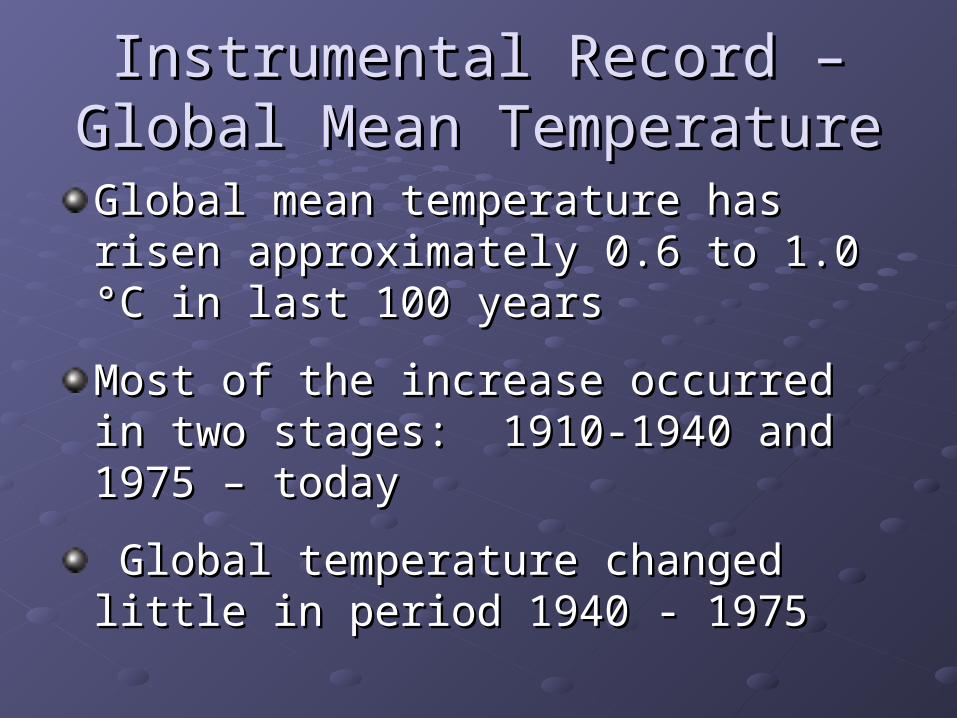
Instrumental Record – Global Instrumental Record – Global Mean TemperatureMean Temperature
Global mean temperature has risen Global mean temperature has risen approximately 0.6 to 1.0 approximately 0.6 to 1.0 °C in last 100 °C in last 100 yearsyears
Most of the increase occurred in two Most of the increase occurred in two stages: 1910-1940 and 1975 – todaystages: 1910-1940 and 1975 – today
Global temperature changed little in Global temperature changed little in period 1940 - 1975period 1940 - 1975
Causes of 20Causes of 20thth-Century -Century WarmingWarming
Recall: Large increases in greenhouse Recall: Large increases in greenhouse gas concentrations, esp. COgas concentrations, esp. CO22
Seems likely that this is Seems likely that this is mainmain cause cause

A Thorny QuestionA Thorny Question
Surface temperature record is much Surface temperature record is much “noisier” than CO“noisier” than CO22 record. Why? record. Why?
Answer: Surface temp. has more Answer: Surface temp. has more influences than atmospheric COinfluences than atmospheric CO22 . .

Some Natural Factors Influencing Some Natural Factors Influencing Surface TempSurface Temp
Natural variabilityNatural variability Example: El NiExample: El Niño/La Niña cycleño/La Niña cycle
External forcingExternal forcing Solar flux variations (more later)Solar flux variations (more later) Particles from volcanic eruptionsParticles from volcanic eruptions

““Normal” Temperatures in Normal” Temperatures in Equatorial PacificEquatorial Pacific
“Anomaly” is the deviation from the average.

El NiEl Niño Temperaturesño Temperatures

El NiEl Niñoño
In El NiIn El Niño years, surface temperature is ño years, surface temperature is slightly higher than normalslightly higher than normal

Global Mean Temperature – Global Mean Temperature – Instrumental PeriodInstrumental Period
Source: http://www.cru.uea.ac.uk/cru/data/temperature/
1998 El Niño

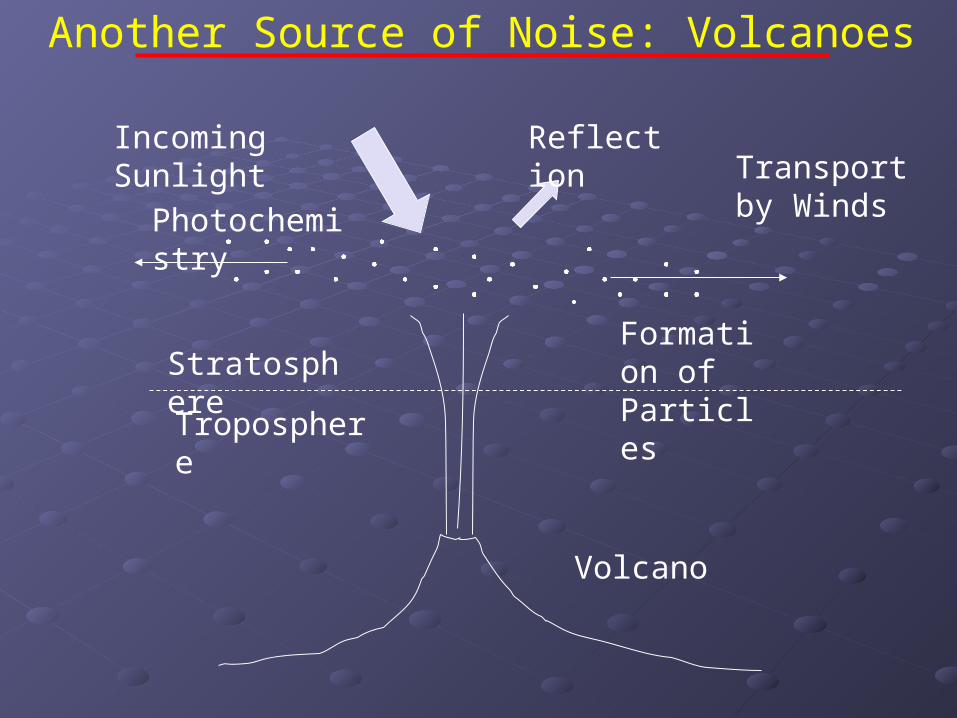
Another sources of “noise”Another sources of “noise”
Volcanic eruptions (see next slide)Volcanic eruptions (see next slide)
Troposphere
Stratosphere
Incoming Sunlight
Volcano
Formation of Particles
Transport by Winds
Reflection
Photochemistry
Another Source of Noise: Volcanoes
Volcanoes Effect on Global TemperatureVolcanoes Effect on Global Temperature
A large volcanic eruption can cool the A large volcanic eruption can cool the Earth for a few yearsEarth for a few years
Example: Mt. Pinatubo eruption in Example: Mt. Pinatubo eruption in Philippines in summer of 1991Philippines in summer of 1991

Global Mean Temperature – Global Mean Temperature – Instrumental PeriodInstrumental Period
Source: http://www.cru.uea.ac.uk/cru/data/temperature/
Mt. Pintubo eruption

Bottom LineBottom Line
FluctuationsFluctuations are to be expected due to are to be expected due to natural processes.natural processes.
However, recent rising However, recent rising trendtrend can only be can only be explained by increased greenhouse effectexplained by increased greenhouse effect

Another Interesting QuestionAnother Interesting Question
Was the Was the raterate of warming during the past of warming during the past century century unusualunusual??
To answer, need proxy data.To answer, need proxy data.
Main types: tree rings, ice coresMain types: tree rings, ice cores
http://www.ncdc.noaa.gov/paleo/globalwarhttp://www.ncdc.noaa.gov/paleo/globalwarming/proxydata.htmlming/proxydata.html

Temperatures of Past Temperatures of Past Millennium Millennium

Answer to Question Answer to Question
The warming trend of the past 100 years The warming trend of the past 100 years appears to be unusually large when appears to be unusually large when compared to previous 9 centuriescompared to previous 9 centuries