Lecture 1: Introduction. Intro/Review: 2 lectures Processor Front-end: 5 lectures Execution Core: 4...
40
Advanced Microarchitecture Lecture 1: Introduction
-
Upload
reginald-peregrine-pitts -
Category
Documents
-
view
228 -
download
4
Transcript of Lecture 1: Introduction. Intro/Review: 2 lectures Processor Front-end: 5 lectures Execution Core: 4...

Advanced MicroarchitectureLecture 1: Introduction

2
Course Floorplan• Intro/Review: 2 lectures• Processor Front-end: 5
lectures• Execution Core: 4 lectures• Other topics: 6 lectures• Processor Case Studies: 11
classes• Mini-conference: 2 classes
Lecture 1: Introduction
First 8.5 weeks
Course philosophy:
(1) First half: learn details about microarchitecture concepts(2) Second half: study real designs, applying what we covered in part 1.
Next 5.5 weeks
Last week of class
3
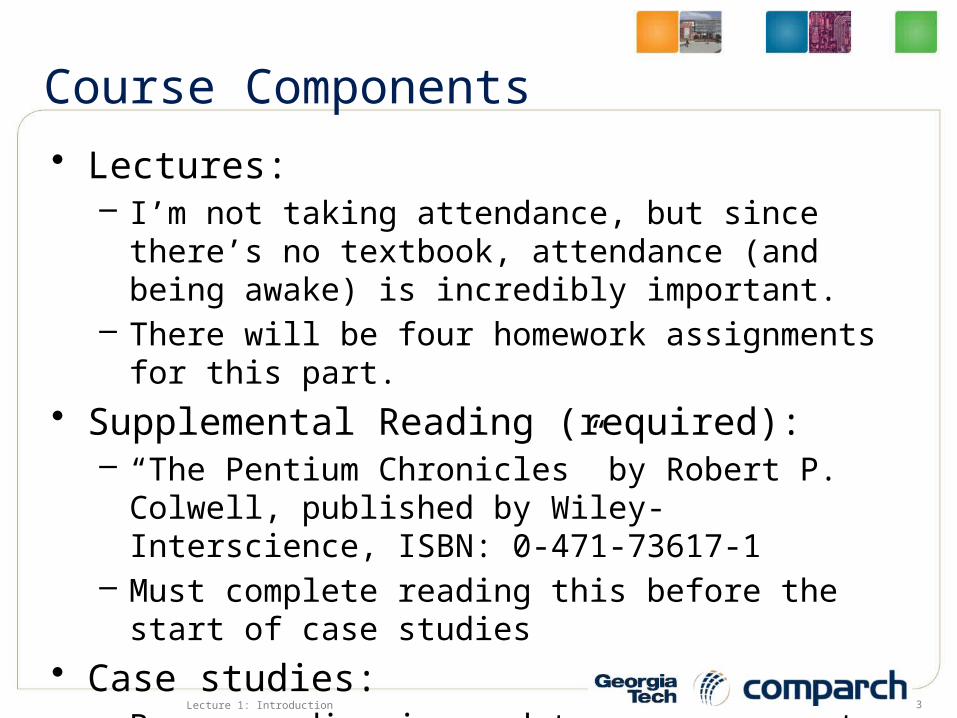
Course Components• Lectures:
– I’m not taking attendance, but since there’s no textbook, attendance (and being awake) is incredibly important.
– There will be four homework assignments for this part.
• Supplemental Reading (required):– “The Pentium Chronicles” by Robert P. Colwell,
published by Wiley-Interscience, ISBN: 0-471-73617-1
– Must complete reading this before the start of case studies
• Case studies:– Paper reading is mandatory… you cannot
participate if you haven’t read the paper(s)
Lecture 1: Introduction

4
Course Components (2)
• Term Project– Microprocessor/microarchitecture-based project– Project must be approved
• Mini-Conference– We will peer-review all projects, similar to how a
conference program committee reviews papers– Last week of class will be used to hold a mini-
conference where you present your term project– Food and drink will be provided! :-)
• No Exams, Hooray!
Lecture 1: Introduction

5
Grading Specifics• 4 Homeworks at 5 points each = 20 pts• 5 TPC reading summaries, 3 pts each = 15
pts• 11 case-study reading summaries and
participation,3 pts each = 33 pts
• Term project = 32 pts– Abstract/Proposal: 5 pts– Mid-project Status: 2 pts– Write-up: 10 pts– Reviews (of other people’s projects): 5 pts– Final Presentation: 10 pts
Lecture 1: Introduction
6
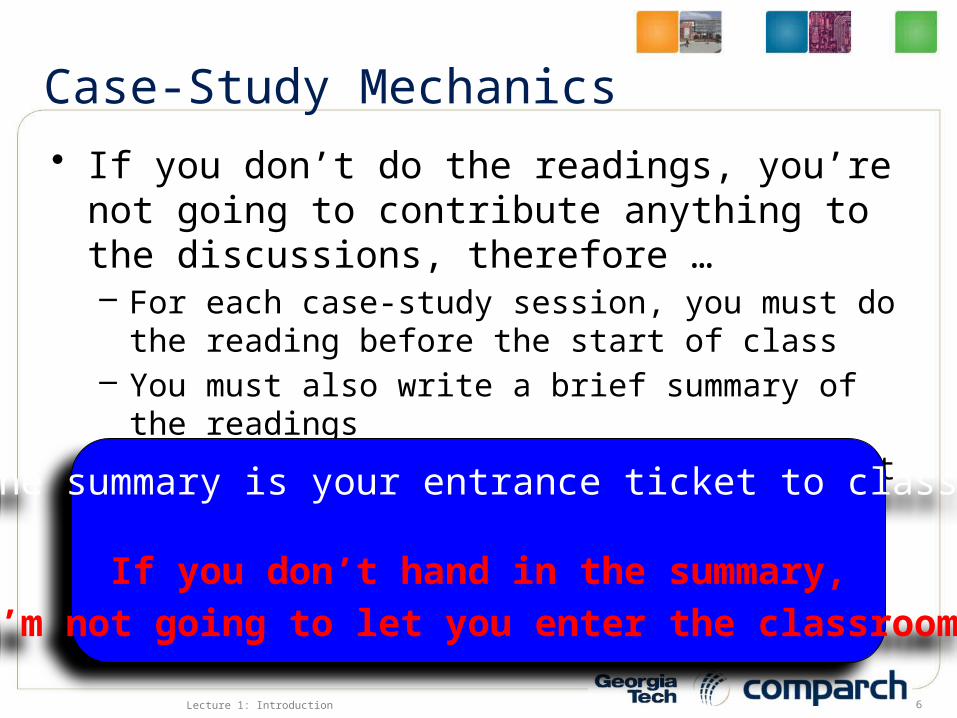
Case-Study Mechanics• If you don’t do the readings, you’re not
going to contribute anything to the discussions, therefore …– For each case-study session, you must do the
reading before the start of class– You must also write a brief summary of the
readings– You must submit the summary at the start of
class…
Lecture 1: Introduction
The summary is your entrance ticket to class:
If you don’t hand in the summary,I’m not going to let you enter the classroom!

7
Performance• What metric to use?
– CPI, IPC, MIPS, FLOPS, polygons/sec, frames/sec, …
• Absolute Runtime– “How long will it take to run my program?”– “How long will it take to run my programs?”
• Relative Performance– “Will my program run faster on an Intel or AMD
cpu?”– “Will my programs run faster on an Intel or AMD
cpu?”– “Will my typical program run faster on Intel or
AMD?”Lecture 1: Introduction

8
Iron Law of Performance
Lecture 1: Introduction
• Runtime =
Total InstsCycles
Instruction
Seconds
CycleX X
Total WorkIn Program
CPI or 1/IPC 1/f (clock freq.)
Algorithms,Compilers,
ISA ExtentionsMicroarchitecture
Microarchitecture,Process Tech
This is the only performance metric that matters (for the uniprocessor world).Everything else is just a proxy!!!

9
Multi-Core/Performance
• Correct metric depends– Single parallel (multi-threaded)
application:• Runtime
– Multiple applications (multi-programmed workload):• Typically total system throughput• Latency/Runtime of a given program not so
important
• Fairness and combined fairness/performance metrics often used.
Lecture 1: Introduction

10
Power
• Which power do you mean?– Maximum/peak power delivery
requirements• “450W Power Supply”
– Average power delivery requirements• Battery life• Electricity bills
Lecture 1: Introduction

11
Dynamic Power
• Power to charge/discharge a capacitor
• P = VI• I = C dv/dt
Lecture 1: Introduction
C
+
-V
12
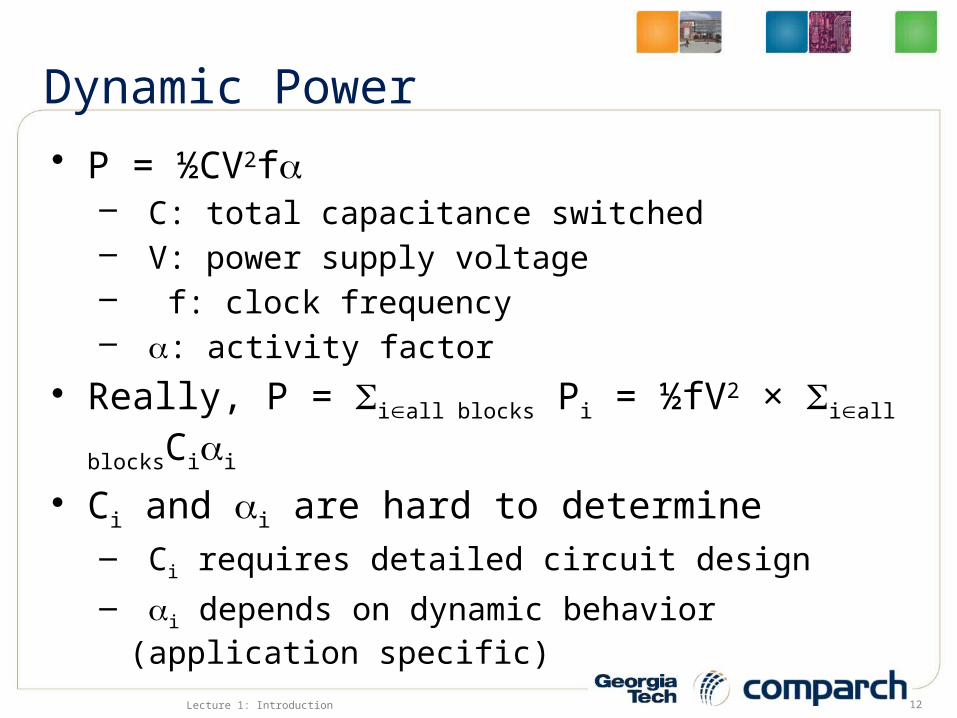
Dynamic Power• P = ½CV2fa
– C: total capacitance switched– V: power supply voltage– f: clock frequency– a: activity factor
• Really, P = Siall blocks Pi = ½fV2 × Siall blocksCiai
• Ci and ai are hard to determine– Ci requires detailed circuit design
– ai depends on dynamic behavior (application specific)
Lecture 1: Introduction

13
Example• Cache Power
– Clock frequency = 2 GHz– L1 Instruction Cache: C=1.515 mF, a = 0.88– L1 Data Cache: C=0.741 mF, a =0.6– L2 Unified Cache: C=12.7 mF, a = 0.07– Vdd = 1.5V
• PIL1 = ½ * 1.515 mF * (1.5)2 * 2GHz * 0.88= ½ * 1.515e-9F * 2.25V2 * (1/500e-12 sec) * 0.88= 3 FV2/s = 3 (columbs/volt)*(volt2)/second= 3 columb*volt/second = 3 (Amp*sec) *
(Watt/Amp) / sec= 3 Watts
Lecture 1: Introduction

14
Example• L1 Data Cache: C=0.741 mF, a =0.6• PDL1 =
= 1 Watt• L2 Unified Cache: C=12.7 mF, a = 0.07• PUL2 =
= 2 Watts• Total Power of All Caches = PIL1 + PDL1 + PUL2 =
Lecture 1: Introduction

15
Trading Power and Performance• P = ½CV2fa• f V• P ½CV2Va• P V3
• Perf f V
• Decrease V– Performance drops linearly– Power drops cubically!
Lecture 1: Introduction
Rule of thumb:3% Power reduction correspondsto about a 1% Performance drop
A.K.A. Voltage-Frequency Scaling
Voltage can be decreased onlyso far... after that, you can only
decrease clock frequency

16
Static Power• “Leakage”, “Dark Current”
– Dark current name comes from current measured in photodetectors when no light is present
• Two Kinds:– Channel leakage or subthreshold conductance– Gate leakage
Lecture 1: Introduction

17
First, a MOS transistor
Lecture 1: Introduction
Applied Voltage
Source Drain
Gate
Current
Threshold Voltage
Gate
Source Drain
+ + + + +
- - - - -
Current
18
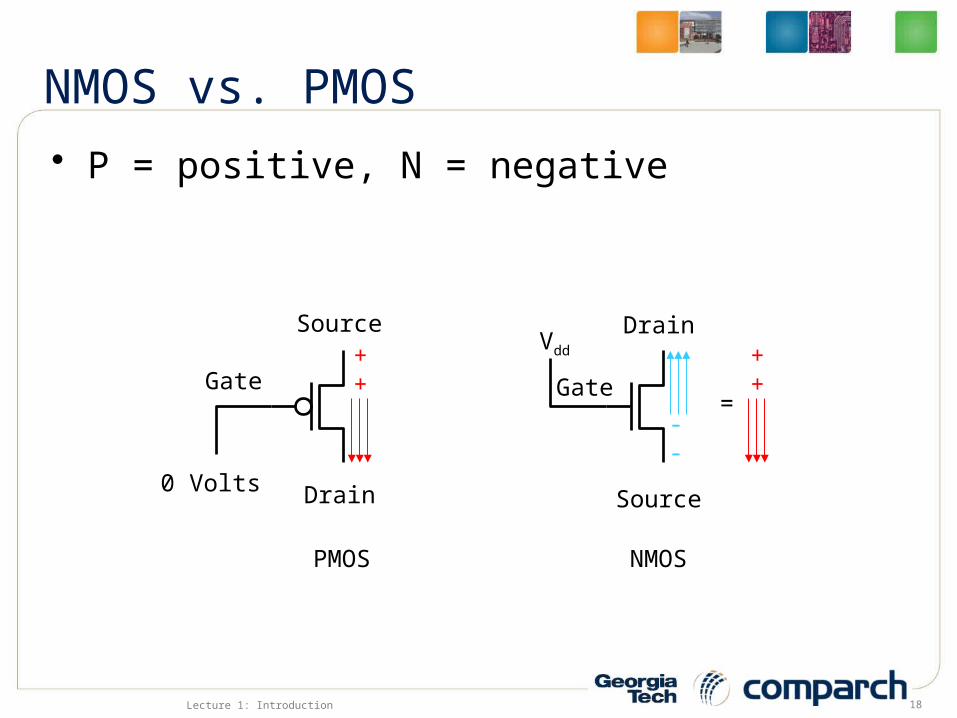
NMOS vs. PMOS• P = positive, N = negative
Lecture 1: Introduction
Gate
Source
Drain0 Volts
++ Gate
Source
DrainVdd
--
++
=
PMOS NMOS

19
Back to Leakage
Lecture 1: Introduction
Channel LeakageSubthreshold Conductance
Gate Leakage

20
Leakage in MOS transistors
Lecture 1: Introduction
Gate
Source Drain
Channel Length keepsShrinking (faster transistors)
Channel resistance decreases(Leakage increases)
Oxide Thickness keepsShrinking (faster transistors)
Probability of QuantumTunneling Increases(Leakage increases)
-Vth/nVqIsub = K1We (1-e )-V/Vq
Iox = K2W(V/Tox)2e -aTox/V

21
Quantum Tunneling• Electrons aren’t “here” or “there”• Location is a probability distribution• Non-zero probability of being anywhere
Lecture 1: Introduction
e-
Oxid
e
e-
P(Tunnel) << 1P(Tunnel)
Non-negligible

22
Power vs. Performance• ED product (energy * delay)
– Lower is better• Lower execution latency (i.e., higher performance)• Lower energy consumption
– Can lead to not-so-great configurations• Simple CPU really long execution time, but very low
power lower ED product (may not be acceptable)
• ED2 product– Performance more heavily weighted
Lecture 1: Introduction

23
Thermals• Temperature of the chip determined by
– Power/heat generation rate– Heat removal
• Given the two, T will settle at a steady state– Heat flow is function of temperature gradient– If there’s too much heat, T will increase until
gradient large enough to remove the heat fast enough
– So long as this steady state T is within allowed operating conditions, everything should work fine• May have impact on long-term reliability
Lecture 1: Introduction

24
Thermal Runaway• But, leakage is a function of temperature
• Temp leads to Leakage• Which burns more power• Which leads to Temp, which …
• Positive feedback loop can melt your chip
Lecture 1: Introduction
-Vth/nVqIsub = K1We (1-e )-V/Vq

25
Hot Spots• Average temperature != local temperature• Local spots may be hotter
– Leads to “hot spots”– Temp anywhere cannot
exceed Tjmax (transistors stop
working)– Possible to have good average
global/temp but still violateTjmax locally
Lecture 1: Introduction
(Simulated P4 Thermals)

26
When Cooling is Insufficient
Lecture 1: Introduction
27
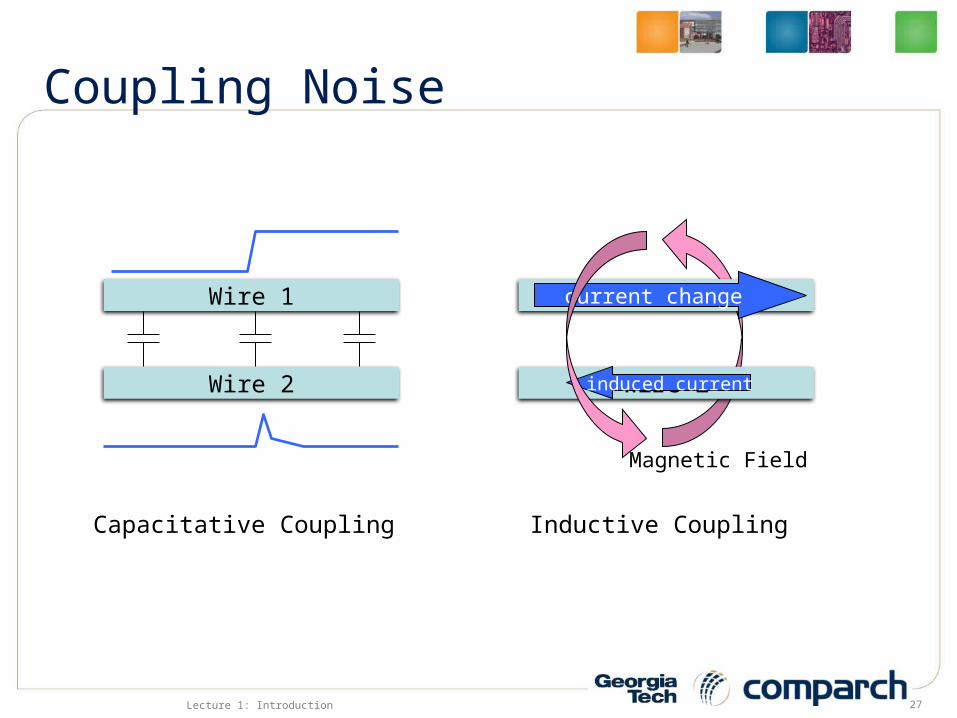
Coupling Noise
Lecture 1: Introduction
Wire 1
Wire 2
Capacitative Coupling
Wire 2
Wire 1current change
Magnetic Field
induced current
Inductive Coupling

28
Impact on Performance
Lecture 1: Introduction
Clock cycle time
Clock cycle time
Extra noise margin decrease in f

29
Power Supply Noise
Lecture 1: Introduction
Water Tank Ishower
Flush!Ijohn
Ishower - Ijohn
PressureDrop

30
Power Supply Noise
Lecture 1: Introduction
Power Supply Pin
Local spikes in power consumptioncan affect other very far away blocksdepending on the power distribution
network
1.2V
1.5V
1.5V1.5V
1.5V 1.5V

31
Same Solution as Water Supply
Lecture 1: Introduction
++++++++1.5V 1.5V
++++++++
2 mA 2 mA
up to 3 mA
1 mAX
X0.75V
0.5mA 0.5mA
Decoupling orDebouncingCapacitors(“Decaps”)
32
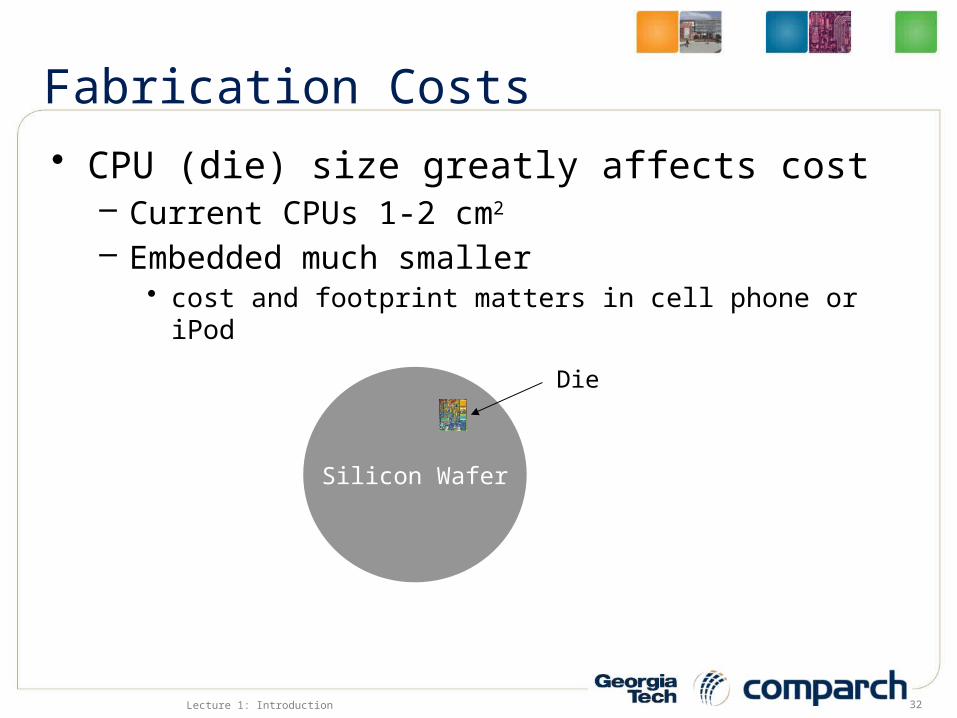
Fabrication Costs• CPU (die) size greatly affects cost
– Current CPUs 1-2 cm2
– Embedded much smaller• cost and footprint matters in cell phone or iPod
Lecture 1: Introduction
Silicon Wafer
Die
33
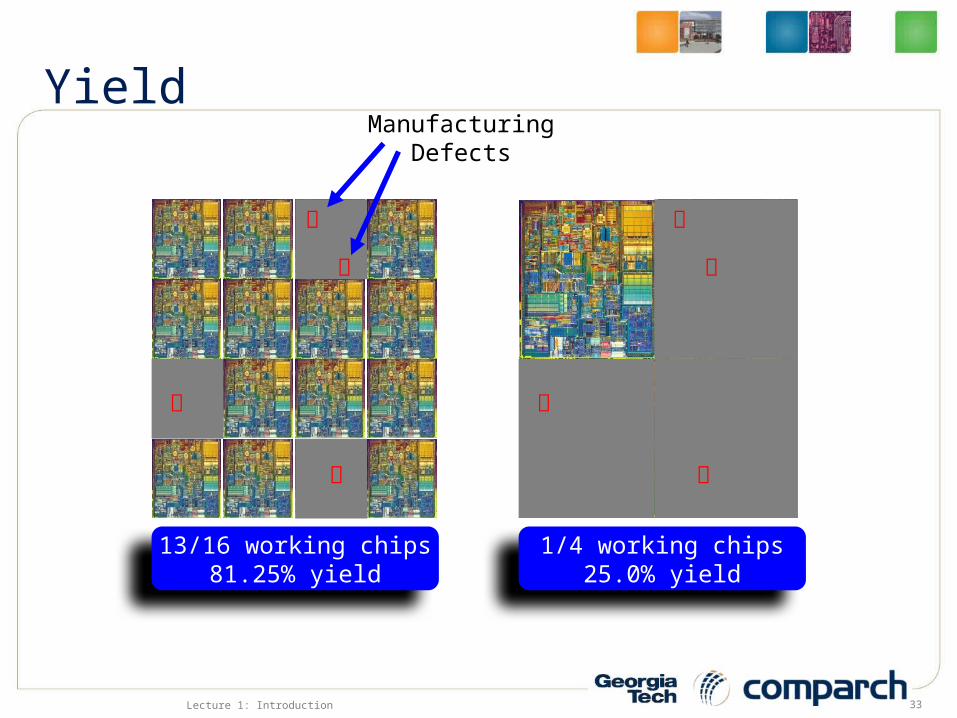
Yield
Lecture 1: Introduction
13/16 working chips81.25% yield
1/4 working chips25.0% yield
ManufacturingDefects

34
Yield
Lecture 1: Introduction
52 die, 81.25% yield 42.25 working parts / wafer
17 die, 25.0% yield 4.25 working parts / wafer
Assuming $250 per wafer:$5.92 per die$58.82 per die
35
Yield
Lecture 1: Introduction
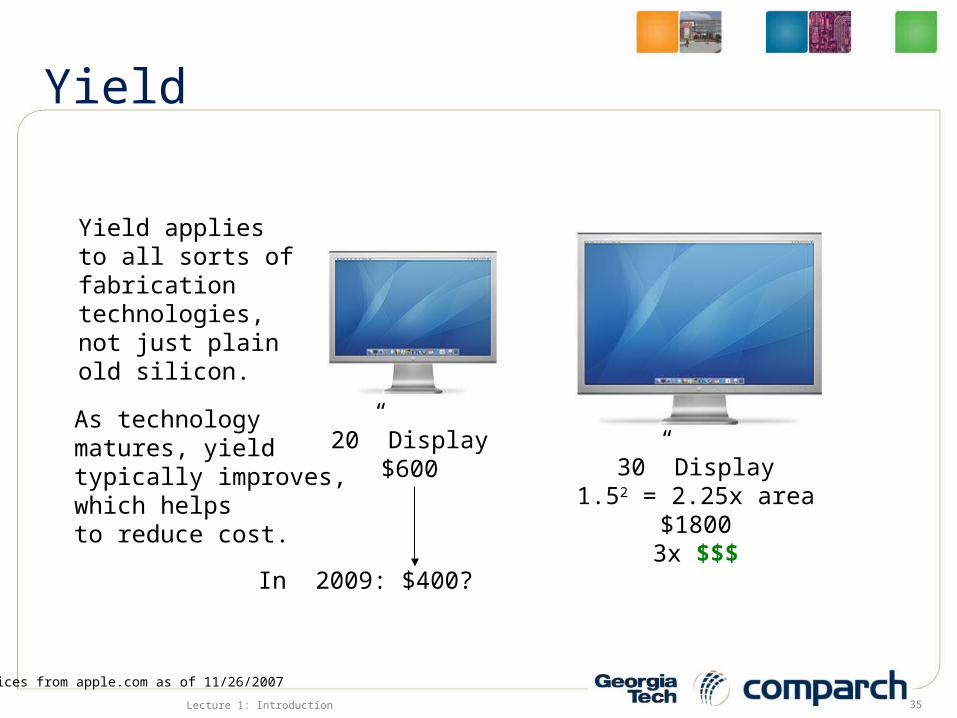
20” Display$600 30” Display
1.52 = 2.25x area$18003x $$$
Yield appliesto all sorts offabricationtechnologies,not just plainold silicon.
In 2009: $400?
As technologymatures, yieldtypically improves,which helpsto reduce cost.
Prices from apple.com as of 11/26/2007
36
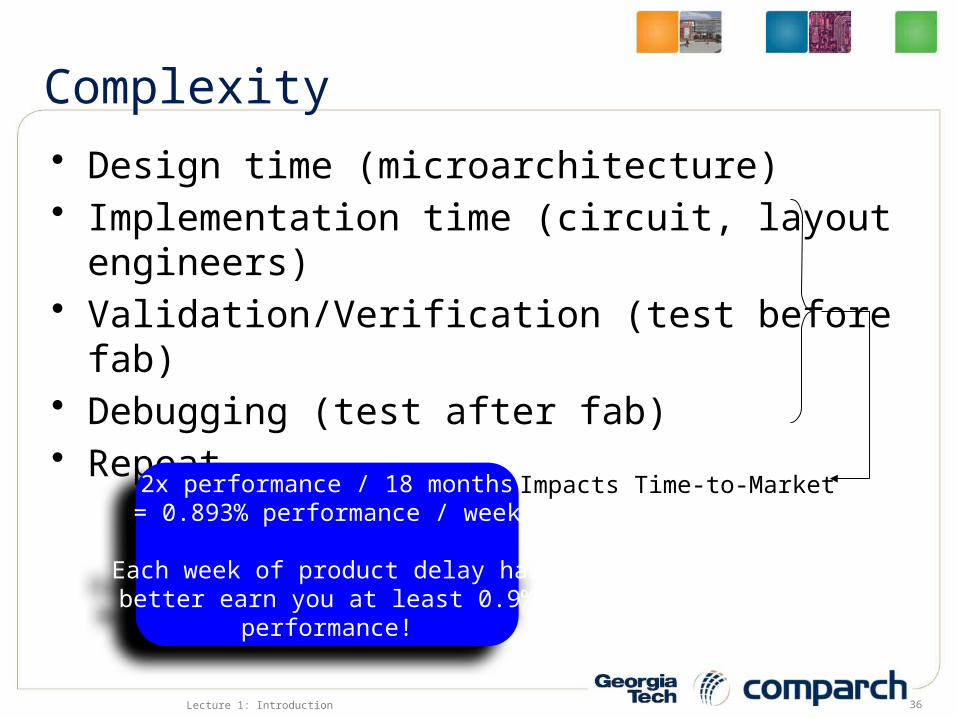
Complexity• Design time (microarchitecture)• Implementation time (circuit, layout
engineers)• Validation/Verification (test before fab)• Debugging (test after fab)• Repeat…
Lecture 1: Introduction
Impacts Time-to-Market2x performance / 18 months= 0.893% performance / week
Each week of product delay hadbetter earn you at least 0.9%
performance!

37
Verification• Intel Pentium FDIV bug
– Verification/validation should catch this– It didn’t (last minute optimization, full validation
not run)– Cost: ~ $500M
• Complexity can be costly• Over half of the design effort is spent on
verification
Lecture 1: Introduction

38
OS, Compilers, Applications, …• Some additional direct and indirect costs• Ex. MMX/SSE
– Costs extra HW, design time, verification, etc.– Useless without cooperation from application writers
• Intel has a lot of SW people in-house to work on new applications, or work with 3rd-parties to use new technologies in their applications
• Danger: benefits on new computers, but compatibility issues with older computers
• Ex. Multi-Core– Need support from OS vendors and application writers,
otherwise no one can use the extra processors– Some of the cost shared by others; worthwhile
investment for MSFT if you have to buy Vista for full multi-core support
Lecture 1: Introduction

39
Goal of Processor Design• Maximize performance... Within the constraints of
– Peak power, average power, die area, metal layers, thermals, implementation complexity, verification complexity, time-to-market, cost to manufacturer (Intel), cost to OEM (Dell), cost to end-customer (you)
• Huge, multi-variable optimization problem!– Not all variables are independent– Not all variables have the same weight– The same variable may have different weights
to different customers
Lecture 1: Introduction

40
Goal of Processor Design• Slightly different for different segments
– Laptops: maximize performance and battery life– Embedded: attain “sufficient” performance and
then maximize battery life• Your MP3 player only needs to be fast enough to run
the MP3 codec; any additional performance provides no end-user benefit and just costs more/consumes more power
– Server: throughput vs. latency
• In this course, we will be mostly focused on “high-performance” processors (desktop, server)
Lecture 1: Introduction