Lecture 06: Introduction to Project Dynamics · PDF fileIntroduction to Project Dynamics . Dr....
65
ESD.36 System Project Management Instructor(s) + - Introduction to Project Dynamics Dr. James Lyneis Lecture 6 Copyright © 2012 James M Lyneis.
Transcript of Lecture 06: Introduction to Project Dynamics · PDF fileIntroduction to Project Dynamics . Dr....

ESD.36 System Project Management
Instructor(s)
+
- Introduction to Project Dynamics
Dr. James Lyneis
Lecture 6
Copyright © 2012 James M Lyneis.

+
- System Dynamics Experience Survey
Have you taken ESD.74, or 15.871 and 15.872?
A - Yes
B – No
C – Currently taking
2

+
-
3
Today’s Agenda
Project problems viewed dynamically
Understanding dynamics: the system
dynamics methodology
Overview of system dynamics module
Vensim

+
-
4
Today’s Agenda
Project problems viewed dynamically
Understanding dynamics: the system
dynamics methodology
Overview of system dynamics module
Vensim

+
-
5
Project Dynamics
What does “dynamic” mean in the
context of a project?
Sketch “desired” (or planned) and
typical actuals for following performance
measures …

+
-
6
Sketch Plan and Actuals for ...
Time
Project Staffing

+
-
7
Sketch Plan and Actuals for ...
Productivity (Normalised)
Time
1
2

+
- Trouble-free Projects Behave as Planned:
Design Labor (Equivalent People)Simulated Data
100.
75.
50.
25.
0.
TIME91 92 93 94 95 96
Disguised resultsfrom an actualsoftware project
Year 1 Year 5Year 4Year 3Year 2 Year 6
Design Progress (Percent Complete) Simulated
100.
75.
50.
25.
0.
TIMEYear 1 Year 4Year 3Year 2 Year 5 Year 6
Disguised resultsfrom an actual
software project
But on more typical developments …

+
-
9
Overrun on a Semiconductor Design
First plan not achieved
© Source unknown. All rights reserved. This content is excluded from our CreativeCommons license. For more information, see http://ocw.mit.edu/fairuse.

+
-
10
Overrun on a Semiconductor Design
Second plan not achieved
© Source unknown. All rights reserved. This content is excluded from our Creative
Commons license. For more information, see http://ocw.mit.edu/fairuse.

+
-
11
Overrun on a Semiconductor Design
© Source unknown. All rights reserved. This content is excluded from our CreativeCommons license. For more information, see http://ocw.mit.edu/fairuse.

+
-
12
On typical development projects ...
Design Labor (Equivalent People) Simulated Actual
Year
800.
600.
400.
200.
0 0 3 6 9 12 15 18 21
Approximate Original Plan
Disguised results from actual aerospace project
… Staffing experiences an extended tail
© 2001 John Wiley & Sons, Ltd. All rights reserved. This content is excluded from ourCreative Commons license. For more information, see http://ocw.mit.edu/fairuse.

+
-
13
Program Staff, Simulated vs. Data (Equivalent Staff)
400.
300.
200.
100.
TIME
0 Year 1 Year 2 Year 3 Year 4 Year 5 Year 6
Simulated Original Plan Actual
Disguised results from actual vehicle project
… Or a second staffing peak
© 2001 John Wiley & Sons, Ltd. All rights reserved. This content is excluded from ourCreative Commons license. For more information, see http://ocw.mit.edu/fairuse.

+
-
14
Progress has been made: Many firms
have cut development times in half ...
Source: Smith, Preston G. and Donald G
Reinersten, Developing Products in Half the Time (2nd edition), Wiley 1998.
Image removed due to copyright restrictions.

+
-
15
PERT and Critical Path Method
Waterfall, Spiral, …
Emphasis on “soft,” people factors
Microsoft Project
.. and Learning is not happening
Why???
But project overruns persist in spite of
numerous advances in the last 50 years

+
-
16
Why do projects overrun their budgets
and/or schedules?

+
-
17
Why? – Notes from Prior Classes
Unrealistic schedule and/or budget Poorly defined objectives
Schedule too aggressive
Inadequate funding
Changing and/or growing system requirements
“Complexity” – design uncertainty
Politics/conflicting agendas (management, customers)
Resource shortages
Inappropriate skills mix/ high attrition
Inappropriate processes
Characteristic: externally focused – others did it to us!

+
-
18
System Dynamics Viewpoint
While external events are a fact of life on projects, project performance problems are fundamentally dynamic problems that result from attempts to manage in the face of change and uncertainty.

+
-
19
System Dynamics Viewpoint
Managers mental models and typical tools (computer models) are not helpful in understanding dynamics: Attribute problems to external factors
View a project statically (no iteration, no
feedback)
Treat projects as if they were unique

+
- Project Control
You’re managing a 12-month project, and at ~30% done you realize that changes and scope growth have put your project ~25% behind schedule …
What do you do? Schedule is the top priority; cost the second priority.
20

+
- What do you do at ~30% complete?
What is your (company’s) response? Put a 1 next to your primary response, at 2 next to your secondary response, and so on. If you would not use a response, leave it blank, otherwise try to rank the options even if you rarely use them in practice.
1. Add people?
2. Work longer hours?
3. Work more “intensely” (including cutting corners, increasing concurrency, releasing work earlier than ideal)?
4. Slip the schedule?
5. Cut scope?
6. Other?
21

+
- Project Control
You’re managing a 12-month project, and at ~65% done you realize that changes and scope growth have put your project ~25% behind schedule …
What do you do? Schedule is the top priority; cost the second priority.
22

+
- What do you do at ~65% complete?
What is your (company’s) response? Put a 1 next to your primary response, at 2 next to your secondary response, and so on. If you would not use a response, leave it blank, otherwise try to rank the options even if you rarely use them in practice.
1. Add people?
2. Work longer hours?
3. Work more “intensely” (including cutting corners, increasing concurrency, releasing work earlier than ideal)?
4. Slip the schedule?
5. Cut scope?
6. Other?
23

+
-
24
Today’s Agenda
Project problems viewed dynamically
Understanding dynamics: the system dynamics methodology
Overview of system dynamics module
Vensim

+
-
25
What is System Dynamics?
Theory of Structure of Systems Creating Behavior
Feedback loops
Stocks and flows
Scientific method applied to social and economic systems
Iterative, focus on testing and learning
Working with “clients” to solve problems
Tools & Tricks & Software to Make Modeling Easier

+
-
26
Examples of Dynamic Behavior
"P lan"
Growth
Project
Staffing
Stability

+
-
27
What Causes Dynamics?
All dynamics are driven by –
Accumulation processes
Feedback processes

+
-
28
Accumulation processes involve ...
Stocks or “levels” -- define the state of
the system
Flows or “rates” -- define the rate of
change in system states
Resources
Hiring

+
-
29
Connecting stocks and flows ...
“Clouds” represent stocks outside the model boundary
ResourcesHiring Firing
TestingBacklogCoding Rate Testing Rate
Source Sink
“Valve”
Stocks = Levels = States = Accumulations = Integration
+
-
30
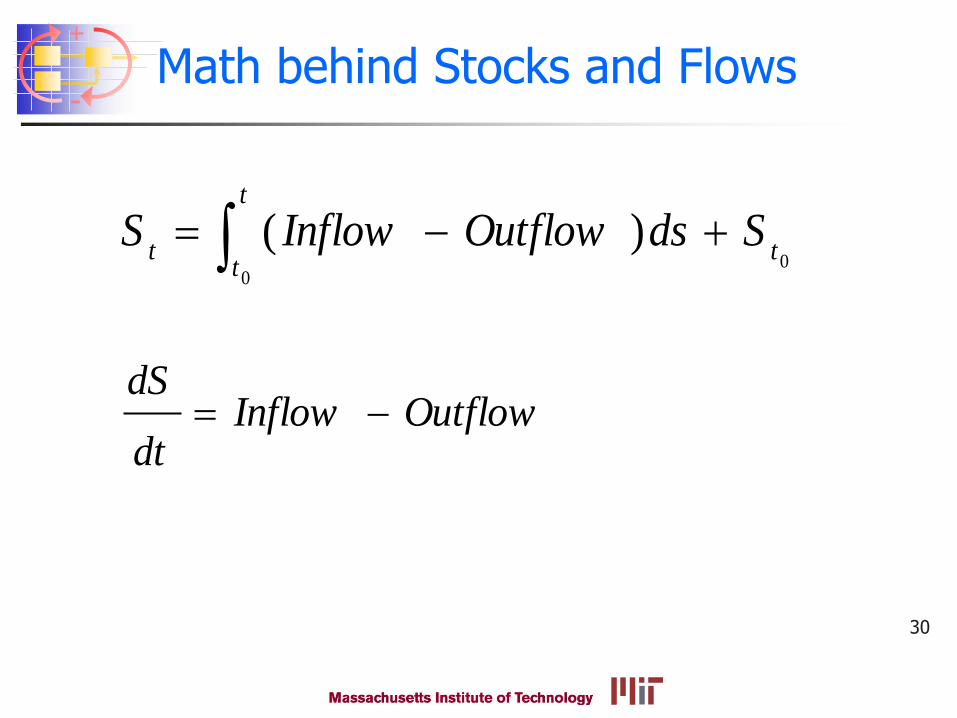
Math behind Stocks and Flows
t
ttt
SdsOutflowInflowS0
0
)(
OutflowInflowdt
dS

+
- Stocks and Flows
Inflow > Outflow: Quantity in tub is rising
Inflow < Outflow: Quantity in tub is falling
Inflow = Outflow: Quantity in tub is constant
Water in Tub
31

+
-
32
Estimating accumulation dynamics – “graphical integration”
ResourcesHiring Firing
ResourcesHire-Fire Rate
Condense to One Flow:
Two-flow Stock:

+
-
Sketch Resources if Hiring cycles between 0 and 10?
Flow
100
75
50
25
0
0 1 2 3 4 5 6 7 8 9 10Time (Month)
"Hire-Fire Rate" : Cycle Tasks/Month
33
ResourcesHire-Fire Rate

+
- Triangular Hire-Fire Rate
Stock and Flow
80
60
40
20
0
0 2 4 6 8 10 12 14 16 18 20Time (Month)
"Hire-Fire Rate" : Triangle Flow People/MonthResources : Triangle Flow People/Month
34

+
-
Resources (t+dt) = Resources (t) + dt * (Hire-Fire Rate tt+dt)
dt = “delta time” = Δt = Time Step (term used in Vensim)
In Vensim:
Resources = INTEG(Hire-Fire Rate)
Equations for Discrete Integration
ResourcesHire-Fire Rate
35
Note: In Vensim PLE 6.0 the INTEG appears to have been dropped!

+
-
Please review draft textbook Chapter SD1, section SD1.2.1 (pages 7-16), for details and examples on graphical integration, discrete integration, and the behavior of stocks.
Sep 11, 2007 36
+
-
37
What are typical stocks & flows on a project?
Stocks Flows

+
- Stocks and Project Management
A company’s resources are stocks:
Management can only affect project performance by building resource levels, and this can only be achieved by actions that affect inflows and outflows
38

+
-
39
What Causes Dynamics?
All dynamics are driven by –
Accumulation processes
Feedback processes
• Balancing
• Reinforcing

+
- System Dynamics Tools
“Soft” tools --
behaviour-over-time graphs
cause-effect diagramming
mental simulation
Tools for describing dynamics
“Hard” tools --
computer models
computer simulation (Vensim)
calibration to data
sensitivity and what-if analyses
Tools for quantifying dynamics
40

+
- Causal loop diagrams -- causal links
An arrow with a positive sign (+) means that, all else remaining equal, an increase (decrease) in the first variable increases (decreases) the second variable above (below) what it would otherwise have been.
Resources Work Rate
+
41

+
- Causal loop diagrams -- causal links
An arrow with a positive sign (+) means that, all else remaining equal, an increase (decrease) in the first variable increases (decreases) the second variable above (below) what it would otherwise have been.
An arrow with a negative sign (-) means that, all else remaining equal, an increase (decrease) in the first variable decreases (increases) the second variable below (above) what it otherwise would have been.
Resources Work Rate+
Fatigue Productivity
-
42

+
- Exercise -- link and loop polarity
Inventory Production Shipments
Work Rate Resources Productivity
Population Births Deaths
43

+
- Causal loop diagrams -- loop polarity
Reinforcing loops -- loops with all positive or an even number of negative causal links (“positive” loop to engineers)
Balancing loops -- loops with an odd number of negative causal links (“negative” loop to engineers)
44

+
-
TasksDone
Resources
Work Rate
PlannedTasks Done
-
+
+
+
Reinforcing or Balancing?
45
All negative loops have a goal
People, hours worked, …

+
-
Resources
Productivity
Work Rate
TasksDone
PlannedTasks Done
+
-
-
+
+
Reinforcing or Balancing?
46
Experience dilution, fatigue, communication problems, …

+
-
TasksDone
Resources
Work Rate
PlannedTasks Done
-
+
+
+
Productivity-
+Project Control
Side Effect
Combining …
47
Which Variables are Stocks? Missing flows?
Any delays?

+
- A Computer Model …
TasksDone
Work Rate
IndicatedResources
Total Tasks toDo
Time Remaining
-
+-
Productivity
+
NormalProductivity
+
Resources
Change InResources
+
+-
Time to AdjustResources
Project Control
48
Work Rate = Resources * Productivity
Change in Resources = (Indicated Resources – Resources) / Time to Adjust Resources
Indicated Resources = (Total Tasks to Do-Tasks Done) / Time Remaining) / Productivity
Productivity = 1
Tasks toDo
Details of this example are in Appendix SDA V3.pdf
5 people
100 Tasks

+
- Simulating
Tasks Done and Resources
100 Tasks6 People
50 Tasks5 People
0 Tasks4 People
0 2 4 6 8 10 12 14 16 18 20Time (Month)
Tasks Done : Negative Control - No Scope Growth Tasks
Resources : Negative Control - No Scope Growth People
Resources Tasks Done
49

+
-
Response to Increase in Tasks to Do (20 @ Month 5)
Sep 11, 2007 50
Total Tasks to Do
200
170
140
110
80
0 2 4 6 8 10 12 14 16 18 20Time (Month)
Ta
sks
Total Tasks to Do : Negative Control - Scope Growth
Total Tasks to Do : Negative Control - No Scope Growth
Resources
6
5.5
5
4.5
4
0 2 4 6 8 10 12 14 16 18 20Time (Month)
People
Resources : Negative Control - No Scope Growth
?

+
-
Simulating in Response to Increase in Tasks to Do (20 @ Month 5)
Tasks Done and Resources
200 Tasks8 People
100 Tasks6 People
0 Tasks4 People
0 2 4 6 8 10 12 14 16 18 20Time (Month)
Tasks Done : Negative Control - Scope Growth Tasks
Resources : Negative Control - Scope Growth People
Resources
Tasks Done
51

+
-
1 2 3
Resources/Initial Resources
Adding reinforcing side effect loop
TasksDone
Work Rate
IndicatedResources
Total Tasks toDo
Time Remaining
-
+-
Productivity
+
NormalProductivity
+
Resources
Change InResources
+
+-
Time to AdjustResources
Project Control
-
Effect of Resourceson Productivity
+
Side Effect
52
Tasks toDo

+
- Simulating …
Tasks Done and Resources
200 Tasks10 People
1 Tasks/(Month*Person)
100 Tasks7 People
0.8 Tasks/(Month*Person)
0 Tasks4 People
0.6 Tasks/(Month*Person)
0 2 4 6 8 10 12 14 16 18 20Time (Month)
Tasks Done : Side Effects - Scope Growth Tasks
Resources : Side Effects - Scope Growth People
Productivity : Side Effects - Scope Growth Tasks/(Month*Person)
Resources
Tasks Done
Productivity
53

+
-
Resources
10
8.5
7
5.5
4
0 2 4 6 8 10 12 14 16 18 20Time (Month)
Resources : Side Effects - Scope Growth People
Resources : Negative Control - Scope Growth People
Productivity
1
0.9
0.8
0.7
0.6
0 2 4 6 8 10 12 14 16 18 20Time (Month)
Productivity : Side Effects - Scope Growth Tasks/(Month*Person)
Productivity : Negative Control - Scope Growth Tasks/(Month*Person)
With Side Effects
Without
With Side Effects
Without
change in the behavior of the project as a result of our attempts to manage (achieve a schedule) in the face of the external change (increase in scope).
54

+
- Survey Question
In your organization, what do you estimate is the relative contribution of the direct costs of External Changes and the costs of Management Responses to project overruns:
1. Costs of External Changes greater than costs of Management Responses
2. Costs of Management Responses greater than costs of External Changes
3. Costs of both about same
4. Varies too much by project to say for sure
55

+
-
56
Interacting positive and negative
feedback loops of cause-effect
relationships, with stocks, flows,
delays, and non-linearities, are
capable of generating all observed
modes of behavior.

+
-
57
Today’s Agenda
Dynamic project problems
Understanding dynamics: the system
dynamics methodology
Overview of system dynamics module
Vensim

+
-
58
What is SD useful for?
Conceptualization of project dynamics and the issues/tradeoffs involved in strategic management of projects
Quantification of above …
Hueristics
Specific forecasts and decision guidance
Project-to-project learning

+
-
59
Purpose of system dynamics module
Managing the drivers of cost and
schedule overrun …
Insight into project dynamics, and impact of
management actions
Introduction to tools for describing and for
quantifying dynamics
Develop two (simple) models of project
dynamics
Managing projects “strategically”

+
-
60
Uses of System Dynamics Models in Strategic Project Management
Project estimating, planning, and risk
assessment
On-going project management
Pricing mid-project changes & dispute
resolution
Learning
How can we best balance cost, schedule, scope, and delivered
quality on a project?

+
- Next SD Classes
SD#2 – Project dynamics – the rework cycle
HW#3 – Rework Cycle model & analyses
SD#3 – Project dynamics -- feedbacks
SD#4 – Analyses of strategic project management issues
HW#5 – Use model to explore planning and project control issues
SD#5 – Cases, Multi-project
61

+
-
62
Important Administration
Send me your model file if you have
specific technical questions.

+
-
63
Today’s Agenda
Dynamic project problems
Understanding dynamics: the system
dynamics methodology
Overview of system dynamics module
Vensim

+
-
Vensim Familiarization (for HW#3 & HW#5)
Get started with Vensim Work through Vensim Tutorial Under Draft
Book Chapters (Appendix SDA V3.pdf).
Ask a colleague who took ESD.74 or 15.874 (now 15.871&2)?
Download Vensim PLE
Don’t hesitate to email me (include you model – “dot” mdl – file); do not waste time on Vensim problems.
64

MIT OpenCourseWarehttp://ocw.mit.edu
ESD.36 System Project ManagementFall 2012
For inforation about citing these materials or our Terms of Use, visit: http://ocw.mit.edu/terms.