Lec13: Clustering Based Medical Image Segmentation Methods
61
MEDICAL IMAGE COMPUTING (CAP 5937) LECTURE 13: Clustering Based Medical Image Segmentation Methods Dr. Ulas Bagci HEC 221, Center for Research in Computer Vision (CRCV), University of Central Florida (UCF), Orlando, FL 32814. [email protected] or [email protected] 1 SPRING 2017
-
Upload
ulas-bagci -
Category
Science
-
view
21 -
download
2
Transcript of Lec13: Clustering Based Medical Image Segmentation Methods

MEDICAL IMAGE COMPUTING (CAP 5937)
LECTURE 13: Clustering Based Medical Image Segmentation Methods
Dr. Ulas BagciHEC 221, Center for Research in Computer Vision (CRCV), University of Central Florida (UCF), Orlando, FL [email protected] or [email protected]
1SPRING 2017

Reminder (Project Selection)• Lung Lobe Segmentation from CT Scans (Use LOLA11 Segmentation Challenge Data Set)• Segmentation of Knee Images from MRI (Use SKI 2010 Data Set))• Multimodal Brain Tumor Segmentation (Use BraTS Data Set)• Automatic Lung Nodule (cancer) Detection (Use LUNA 2016 Data Set, http://luna16.grand-
challenge.org/home/ (Links to an external site.))• Automatically measure end-systolic and end-diastolic volumes in cardiac MRIs. (Use Kaggle
Cardiac Data Set)• Head-Neck Auto Segmentation Challenge (Use MICCAI 2015 Segmentation Challange Data
Set)• CAD of Dementia from Structural MRI (Use MICCAI 2014 Segmentation Challenge Data
Set)• DTI Tractography Challenge (Use MICCAI 2014 Segmentation Challenge Data Set)• EMPIRE 2010 - Pulmonary Image Registration Challenge
(http://empire10.isi.uu.nl/index.php, (Links to an external site.) I have the team name and password for downloading the data set).
• Digital Mammography DREAM challenge (https://www.synapse.org/#!Synapse:syn4224222/wiki/231837 (Links to an external site.))
• MACHINE LEARNING Challenge in medical imaging (https://www.nmr.mgh.harvard.edu/lab/laboratory-computational-imaging-biomarkers/miccai-2014-machine-learning-challenge (Links to an external site.)
2

Reminder (Project Selection)• MICCAI 2017 Challenges (end of march, sites will be fully functional)
3

Outline• Clustering
– K-means– FCM (fuzzy c-means)– SMC (simple membership based clustering)– AP (affinity propagation)– FLAB (fuzzy locally adaptive Bayesian)– Spectral Clustering Methods
4

What is Clustering?• Organizing data into classes such that:
– High intra-class similarity– Low inter-class similarity
• Finding the class labels and the number of classes directly from the data (as opposed to classification tasks)
5

What is a natural grouping?
6

What is a natural grouping?
9/29/15
7
Clustering is subjective
School EmployeesSimpson's Family MalesFemales

What is similarity ?
8

What is similarity ?
9
Cluster by features
• Color• Intensity• Location• Texture• ….

Distance metrics
10
0.23 3 342.7
Peter Piotr

Motivation for Clustering in Medical Image Segmentation
• Assumption: The object of interest can be identified as a cluster in an appropriate feature space. Delineate the cluster to delineate the object.
11

• Clustering algorithms essentially perform the same function as classifier methods without the use of training data.
• Thus, they are termed unsupervised methods. • In order to compensate for the lack of training data, clustering
methods iterate between segmenting the image and characterizing the properties of the each class.
12
FCM FCM with Markov PriorPham et al
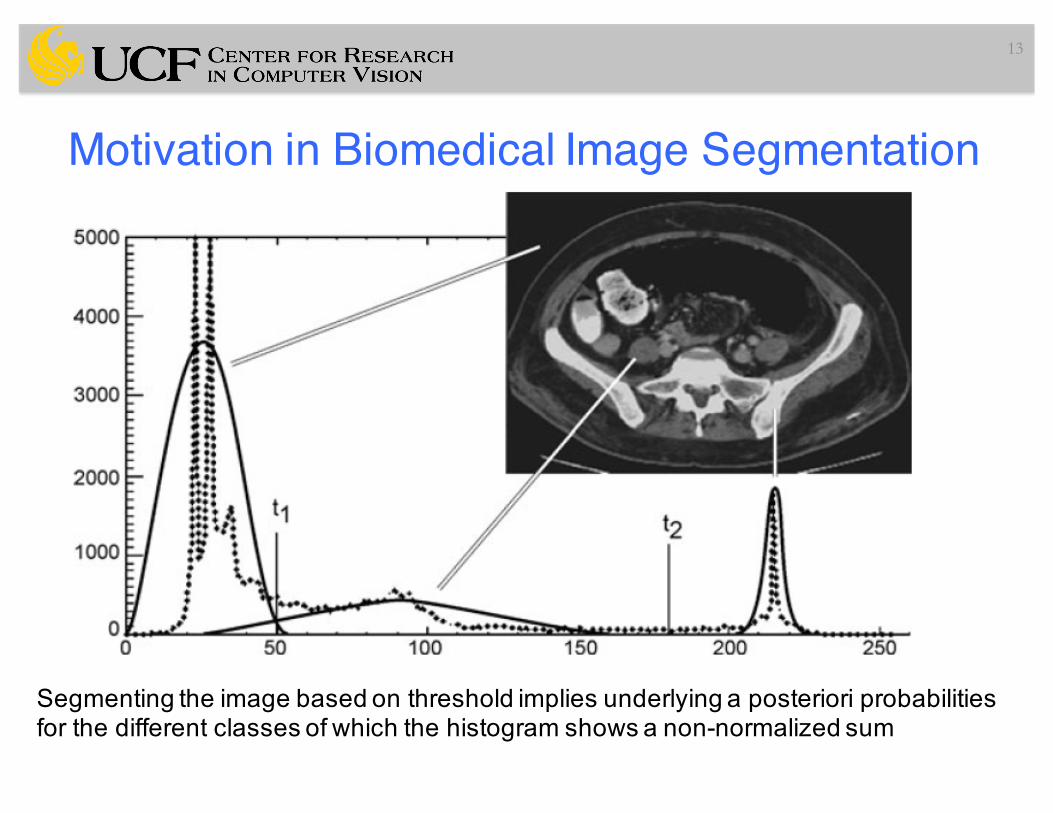
Motivation in Biomedical Image Segmentation
13
Segmenting the image based on threshold implies underlying a posteriori probabilities for the different classes of which the histogram shows a non-normalized sum

K-means Clustering
14

K-means Clustering
15

K-means Clustering
16

K-means Clustering
17

K-means Clustering
18

K-means Clustering
19

K-means Clustering
9/29/15
20

21Credit: Zitao Liu

Recap: Core of Clustering• Similarity metric• Distance metric
22
Open-boxSpectral clustering
Software forMedical images
Schultz and Kindlmann2013, IEEE TVCG

Multispectral/Multimodal Image Segmentation
• The segmentation techniques based on integration of information from several images are called multispectral or multimodal
23

Multispectral/Multimodal Image Segmentation
• The segmentation techniques based on integration of information from several images are called multispectral or multimodal
• In multispectral images, each pixel is characterized by a set of features and the segmentation can be performed in multidimensional (multichannel) feature space using clustering algorithms
24

Methods:
k-Nearest Neighbor (kNN)C-Means (CM)Fuzzy C-Means (FCM)Simple Membership-based Classification (SMC)
Methods differ based on how clusters are defined, detected, and delineated.
pI Methods – RpI : Clustering

Training:
For each of L object classes, determine a trueclassification feature set Fi, i = 1, 2,…., L.
Classification:
(1) Choose and fix a value for K (say K = 7).
(2) For a given scene S = (C, f) to be segmented, determine the feature vector xc associated with each voxel c.
RpI : Clustering - kNN

(3) To classify voxel c in C, among all feature vectorsin , determine K vectors that are closest to xc.
(4) Classify c to that amongthe L classes which isrepresented maximally in
RpI : Clustering - kNN

Applications in MR Brain Tissue Segmentation
28

MRI T2 Original
MRI PDOriginal
GM, WM, CSF Segmented
RpI : Clustering - kNN

It is an unsupervised method. No training needed.
• Requires number of object classes L to be specified.
• Outputs fuzzy membership, at each voxel, inindividual object classes.
• Also outputs class mean (centroid)
• Uses an optimization technique to determine how tooptimally partition the feature space into L classes.
RpI : Clustering - FCM

S = (C, f) : a given sceneuck : membership of voxel c in object class k.q : a weighting exponent (q = 2 often used).f(c) : vector-valued scene intensity.µk : centroid (mean) of class k.|| • || : any inner product norm (e.g., Euclidean
norm)
( ) 2
1 L
qck k
c C kJ u f c µ
∈ == ∑ ∑ −
Minimization of J yields uck andµk .
RpI : Clustering - FCM
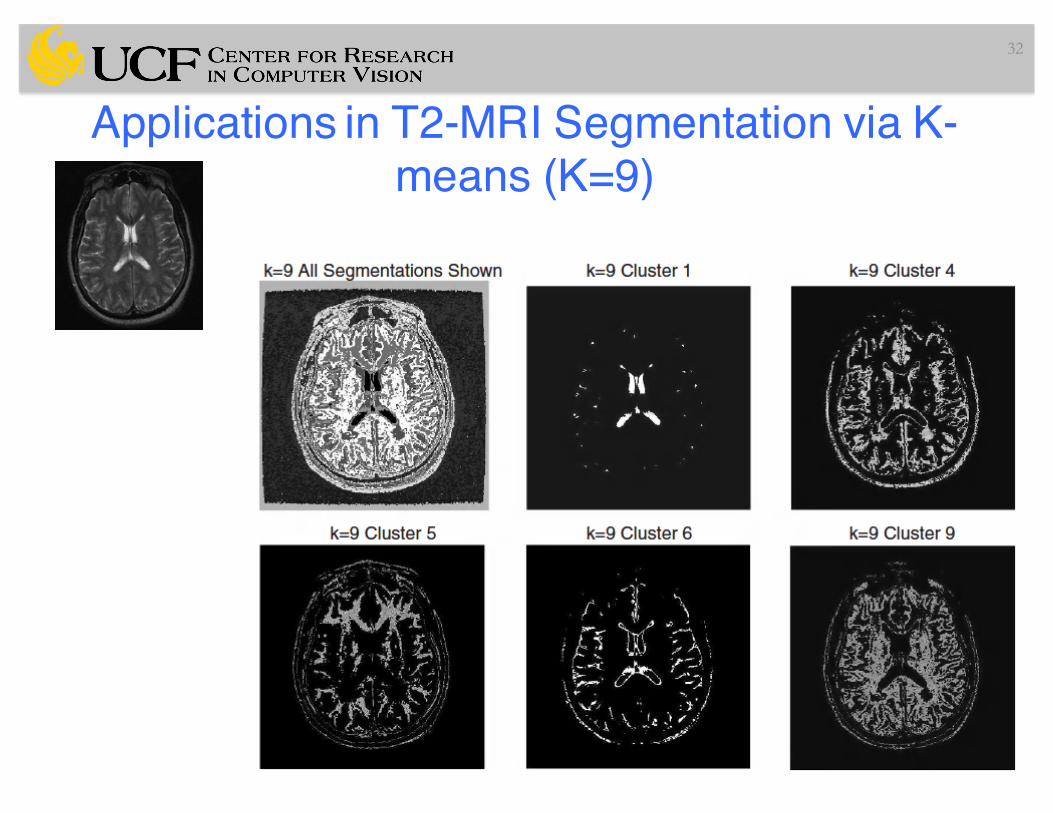
Applications in T2-MRI Segmentation via K-means (K=9)
32

Quantitative Estimation of Volumetric Breast Tomosynthesis Images (Pertuz et al, Radiology 2015)
33

Quantitative Estimation of Volumetric Breast Tomosynthesis Images (Pertuz et al, Radiology 2015)
• Breast cancer is the most commonly diagnosed cancer in the United States and the second leading cause of death from cancer in women.
34

Quantitative Estimation of Volumetric Breast Tomosynthesis Images (Pertuz et al, Radiology 2015)
• Breast cancer is the most commonly diagnosed cancer in the United States and the second leading cause of death from cancer in women.
• Breast density is an independent risk factor for breast cancer
35

Quantitative Estimation of Volumetric Breast Tomosynthesis Images (Pertuz et al, Radiology 2015)
• Breast cancer is the most commonly diagnosed cancer in the United States and the second leading cause of death from cancer in women.
• Breast density is an independent risk factor for breast cancer
• Objective and accurate methods for the estimation of density are needed to ensure reliable estimation and, ultimately, yield quantitative reproducible measures that are clinically useful.
36

Quantitative Estimation of Volumetric Breast Tomosynthesis Images (Pertuz et al, Radiology 2015)
• Breast cancer is the most commonly diagnosed cancer in the United States and the second leading cause of death from cancer in women.
• Breast density is an independent risk factor for breast cancer
• Objective and accurate methods for the estimation of density are needed to ensure reliable estimation and, ultimately, yield quantitative reproducible measures that are clinically useful.
• Volume-based quantitative density methods, the aim is to better estimate the amount of fibroglandular (i.e., dense) tissue with respect to the total volume of the breast.
37

Quantitative Estimation of Volumetric Breast Tomosynthesis Images (Pertuz et al, Radiology 2015)
38
Red: human annotator, yellow: computer algorithm

Let us dig into the theory a bit more…• Unsupervised learning
– Finding clusters– Dimensionality reduction (PCA, MDS,…)– Building topographic maps – Finding hidden causes or sources of the data– Modeling the data density
39

Let us dig into the theory a bit more…• Unsupervised learning
– Finding clusters– Dimensionality reduction (PCA, MDS,…)– Building topographic maps – Finding hidden causes or sources of the data– Modeling the data density
• Uses of Unsupervised learning– Classification– Data compression– Make other learning tasks easier– A theory of human learning and perception– ….
40

Mixtures of Gaussians
41
x: input, y: output

Mixtures of Gaussians
42
You can download GMM train and test C/C++ code from my webpage: http://www.cs.ucf.edu/~bagci/software.html

Constrained GMM for MR Brain Image Segmentation: Greenspan et al. IEEE TMI 2006• Each tissue is represented by large
number of Gaussians (to capture complex tissue spatial layout)
43

Constrained GMM for MR Brain Image Segmentation: Greenspan et al. IEEE TMI 2006• Each tissue is represented by large
number of Gaussians (to capture complex tissue spatial layout)
• Intensity is considered as a global parameter
44

Constrained GMM for MR Brain Image Segmentation: Greenspan et al. IEEE TMI 2006• Each tissue is represented by large
number of Gaussians (to capture complex tissue spatial layout)
• Intensity is considered as a global parameter
• EM is utilized to learn parameter-tied CGMM.– Each Gaussian is linked to a single tissue
and all the Gaussians related to the same tissue share the same intensity patterns.
45

Constrained GMM for MR Brain Image Segmentation: Greenspan et al. IEEE TMI 2006• Each tissue is represented by large
number of Gaussians (to capture complex tissue spatial layout)
• Intensity is considered as a global parameter
• EM is utilized to learn parameter-tied CGMM.– Each Gaussian is linked to a single tissue
and all the Gaussians related to the same tissue share the same intensity patterns.
• Completely unsupervised, no alignment/atlas registration required.But note that general properties of T1 is used to include intensity info.
46

Constrained GMM for MR Brain Image Segmentation: Greenspan et al. IEEE TMI 2006
(a) %9 noise, MRI from brain web, slice 95(b) EM based algorithm(c) CGMM algorithm results
47

Clustering methods for PET Images• FCM (fuzzy c-means)• FLAB (fuzzy locally adaptive Bayesian)• K-means• K-NN• Spectral Clustering• ….
48

Fuzzy Locally Adaptive Bayesian (FLAB) Approach for PET Segmentation (Hatt et al, TMI)
• Y: observed image (noisy)• X: (binary) segmented object• Bayesian setting: given the image Y, what is the segmentation
result X?• P (Y|X) is the likelihood of the observation Y conditionally with
respect to the hidden ground-truth X• P(X): prior• P(X|Y): posterior distribution
49

Distribution of X (Prior)• Two hard classes (Object + background) + finite number of
fuzzy levels.• Consider Y0 and Y1 distributions, with mean and variations
• Then, mean and standard deviation of each fuzzy levels are represented as
• Use EM algorithm to find unknowns.
50
Epsilon 1/3, 2/3 used.

Clustering methods for PET Images• FCM (fuzzy c-means)• FLAB (fuzzy locally adaptive Bayesian)• K-means• K-NN• Spectral Clustering• ….• AP Clustering (affinity propagation)
– State of the art for multi-focal uptake segmentation
51
Foster, Bagci, et al., 2014

AP – By Frey and Dueck (more than 3.5K citations, published in Science)
52
Example: The 15 images with highest squared error under either affinity propagation or k-centers clustering are shown in the top row. The middle and bottom rows show the exemplars assigned by the two methods, and the boxes show which of the two methods performed better for that image, in terms of squared error. Affinity propagation found higher-quality exemplars.
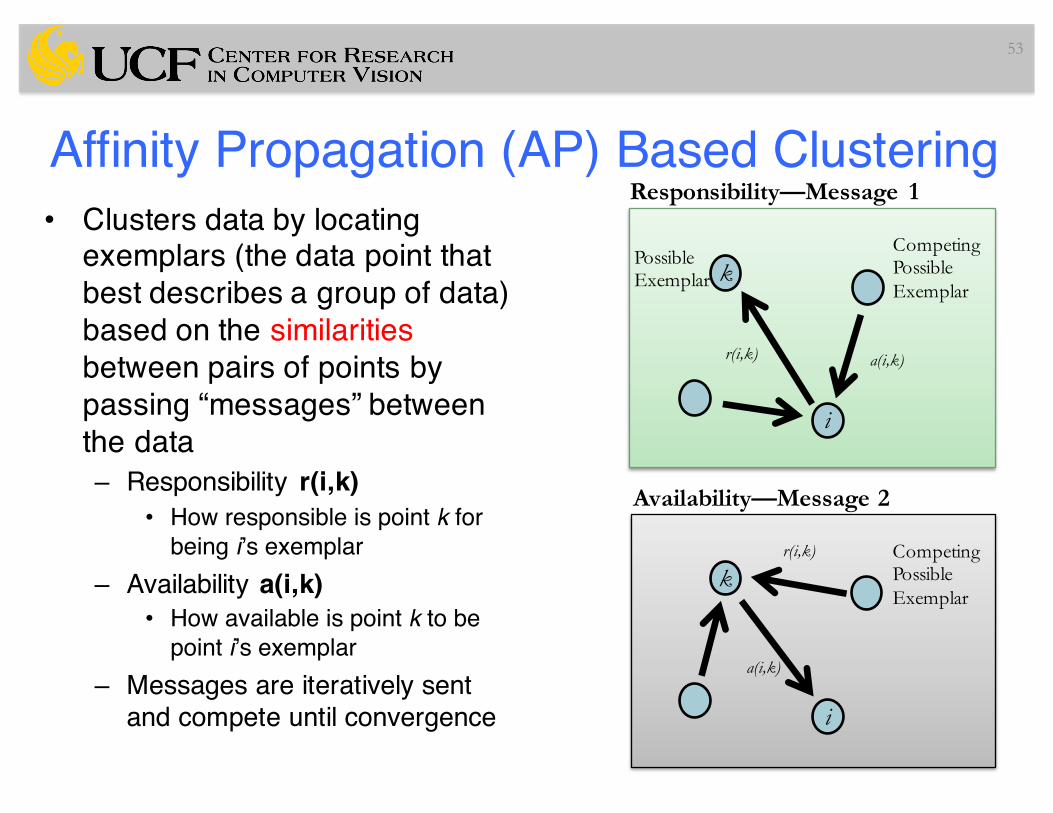
Affinity Propagation (AP) Based Clustering
53
• Clusters data by locating exemplars (the data point that best describes a group of data) based on the similarities between pairs of points by passing “messages” between the data– Responsibility r(i,k)
• How responsible is point k for being i’s exemplar
– Availability a(i,k)• How available is point k to be
point i’s exemplar– Messages are iteratively sent
and compete until convergence
Responsibility—Message 1
k
i
Possible Exemplar
Competing PossibleExemplar
r(i,k) a(i,k)
Availability—Message 2
k
i
Competing PossibleExemplar
r(i,k)
a(i,k)

Motivation for AP in PET Images (multi-focal updake)
54G
ross
pat
holo
gyHi
sto-
path
olog
y
5 weeks 15 weeks

Threshold Selection
55
Intensity
0 1
Object1
Observed histogram of a PET image is the summation of the histogram of hidden objects
Objective for segmentation: Locate the optimal thresholding value(s) for best separation between these objects
Object2
Object3

Similarity Function Definition
56
Intensity0 1
pi
pj
ji
s(i,j) = -(|dijx|n + |dij
G|m)
Probability difference - Distance includes information of the peaks and valleys between data points—needed for classification
dijx
Weight parameters learned for different image types and for small animal/human images
Gradient information Probability information
dijG

AP is an iterative process
57

Convergence of AP Segmentation
58

Comparison to Other Methods
59

Summary• K-means• FCM (fuzzy c-means)• K-NN (k-nearest neighborhood)• SMC (simple membership based clustering)• AP (affinity propagation)
– Useful for PET image segmentation (multi-focal uptake)
60

Slide Credits and References• Credits to: Jayaram K. Udupa of Univ. of Penn., MIPG• Bagci’s CV Course 2015 Fall.• K.D. Toennies, Guide to Medical Image Analysis,• Handbook of Medical Imaging, Vol. 2. SPIE Press.• Handbook of Biomedical Imaging, Paragios, Duncan, Ayache.• Seutens,P., Medical Imaging, Cambridge Press.• Z. Ghahramani, U. Cambridge, UK.
61


![Segmentation and Clustering - Princeton University … · 2011-10-25 · Segmentation and Clustering Applications “Intelligent scissors” Finding ... [Based on slide by S. Seitz]](https://static.fdocuments.us/doc/165x107/5b3385bd7f8b9a2b238b59da/segmentation-and-clustering-princeton-university-2011-10-25-segmentation.jpg)