Least Cost Strategies for Complying with New NOx … · Least Cost Strategies for Complying with...
21
January 25, 2000 1 Least Cost Strategies for Complying with New NOx Emissions Limits International Association for Energy Economics New England Chapter Presented by Assef A. Zobian Tabors Caramanis & Associates Cambridge, MA 02138 January 25, 2000
Transcript of Least Cost Strategies for Complying with New NOx … · Least Cost Strategies for Complying with...
January 25, 2000 1
Least Cost Strategies for Complying with New NOx Emissions Limits
International Association for Energy EconomicsNew England Chapter
Presented byAssef A. Zobian
Tabors Caramanis & AssociatesCambridge, MA 02138
January 25, 2000

January 25, 2000 2
Presentation Outlineu IntroductionuMarket Model-Mathematical Formulation
– Perfect Compliance– Over Compliance
u Insights from the Mathematical Model– Generators Bidding Behavior– Investment Decision Criterion– Dynamics of Tradable Permits Prices
u Practical Approach– General Market Simulation Methodology– Emissions Modeling
uApplication to the Northeastern & Midwest US Energy Markets
– Analysis of the Results
uConclusions

January 25, 2000 3
Introductionu In a Memorandum of Understanding (MOU), the 12-state
Northeast Ozone Transport Region (OTR) states volunteered to reduce emissions through institution of a cap-and-trade program.
– Phase II of the MOU allocates allowances based on the less stringent of a 75% reduction and a reduction to 0.15lb/MMBtu (effective 1999)
– Phase III scheduled to begin in 2003
u In 1997, EPA issued the State Implementation Plan Call, which require 22 states in the Eastern US to submit plans to address the transport of ozone across state boundaries.
u On May 1999, the D.C. Court of Appeals ruling suspended the implementation of the SIP Call.
u On December 17, 1999 issued the Section 126 final action that requires 392 facilities in 12 states and DC to reduce annual emissions by a total of nearly 510,000 tons from 2007 levels.
– Affected sources are expected to comply by May 1, 2003– Each affected party will participate in a federal NOx emissions cap-
and-trade program

January 25, 2000 4
Objectives
uThe recent court rulings on EPA’s NOx SIP Call indicate that there is a strong need to quantify the costs and benefits of NOx regulations in the US.
uThere has been speculation that deregulating the electricity markets will cause major harm to the Northeast region by emissions from Midwestern generation.
u Identify and evaluate compliance options – Abatement technologies – Tradable permits
uThe effectiveness of a tradable-permits markets in achieving efficient outcomes for environmental emissions has not yet been fully modeled and analyzed for deregulated electric power markets.

January 25, 2000 5
Annual carrying cost ofNOx abatementtechnology
None
• Operating cost ofabatement technology
+• Opportunity cost of
used allowances
Invest Trade
Fixed Cost
Variable Cost(in energy bid)
• Cost of purchasedallowances
+• Opportunity cost of
used allowances
+• Opportunity cost of
lower dispatch
STRATEGYSTRATEGY
Retire?
Compliance Options

January 25, 2000 6
Market Model-Mathematical Formulation
[ ] )()()())(( 1 ,
rii
T
tiriiii
iEg
EItgEVtgCTotalCostMinrii
++= ∑∑=∀
(1)
Subject to:
)( )( tDemandtgi
i =∑∀
:λ(t) Energy Balance Constraint
BudgetEmissionEEtg riAii
i
T
t
)()(1
≤−∑∑∀=
:µ Emissions Budget Constraint
0),( ≥rii Etg
The combined energy and tradable permits markets can be simulated as a single multi-period least-cost optimization problem with demand balance and emissions budget constraints.

January 25, 2000 7
Where:)(tg i : Energy generated from unit i at time t.
))(( tgC ii : The generation cost function for unit i at time t, i.e., cost of fuel and unit’s variableoperation and maintenance cost.
AiE : Actual emission rate for generation unit i before any abatement technology addition.We assume the emission rate is fixed and independent of generation.
riE : Emission rate reduction achieved by adding an abatement technology.)( rii EV : Variable cost associated with reducing emissions from unit i, by riE , we assume
this cost to be a linear function of riE , riirii EKEV =)( .)( rii EI : Fixed operating and capital cost function associated with emissions reductions,
riE , over a period T. We assume this cost to be continuos, convex andmonotonically increasing.
)(tλ : Shadow price of the energy balance constraint, or energy market-clearing price attime t.
µ : Shadow price of the emissions budget constraint, or market-clearing price oftradable allowances.
],1[ Tt ∈ : T is the set of ozone seasons, from May 1st to September 30th, over the average lifeexpectancy of control technologies.
],1[ Ni ∈ : The set of all generators including optimal (chosen) entry and retirement profile.
Market Model-Mathematical Formulation

January 25, 2000 8
The Khun-Tucker conditions for the above optimization problem are:
riiriAiii EKEEtgCt +−+= )( ))(()( ' µλ ti,∀ (2)
iggKEIT
ti
T
tiirii (t) (t))(
11
' ∀=+ ∑∑==
µ (3)
0≥µ ,
With complementary constraint:
0 ) )()(( 1
=−−∑∑∀=
BudgetEmissionEEtg riAii
i
T
t
µ (4)
Market Model-Mathematical Formulation

January 25, 2000 9
CASE I : Perfect Compliance Total Emissions at Budget
u The market-clearing price for the tradable allowances is the shadow price of the emission budget constraint, or the system cost reduction achieved by relaxing the emission constraint by one per unit.
• The increase in market-clearing price value is the cost of used tradable allowances and variable O&M costs associated with abatement technology.
• From equation (3), for each unit, the total cost of trading is equal to the incremental cost of reducing emissions via abatement technologies, generators are indifferent between investing or trading (assumption of continuos investment function).
u The tradable permit price does not vary with time, which rests on the assumption that investments are made simultaneously, at which time the market achieves equilibrium.

January 25, 2000 10
riiii EKtgCt += ))(()( 'λ (2a)
igKEIT
tiirii 0 (t))(
1
' ∀=+ ∑=
(3a)
CASE II : Over Compliance Total Emissions within Budget
u The shadow price of the budget constraint is zero, thus as shown in equation (2a), the energy market-clearing price is function of marginal cost of the energy and control technology variable cost.
u Equation (3a) shows that this is not a feasible solution since the marginal cost of investment and the variable cost are both positive. Thus over-investment is not an optimal solution for continuous investment function. However, in reality the market might reach that level because of discreteness and economies of scale in emission control technologies.

January 25, 2000 11
Insights from the Mathematical Model
u Generators should bid their marginal production cost(i.e., fuel cost plus trading opportunity cost, plus any VOM associated with emission reduction technologies).
u The energy market-clearing price will be set by the marginal unit(s)’ marginal production cost.
u Generators should invest in emission reduction technologies as long as their total cost of investment (capital and operating) is less than the tradable permits cost.
u The tradable permits market-clearing price will exceed, equal, or be below the incremental cost of emission reduction in the case of under, perfect or over compliance, respectively.
u The incremental cost of emission reduction is related to the incremental investment cost in reduction technology divided by the total energy generated plus the technology VOM.

January 25, 2000 12
General Market Simulation Methodology
uWe utilized GE-MAPS to model the electric power generation markets, in an iterative approach to solve the “real” version of the above formulated problem.
– GE-MAPS is a security-constrained least-cost chronological production cost model.
– It is used to determine the locational energy market-clearing prices, the revenues, costs and profitability of generation units.
– We used the most up to date data on load forecast, fuel price, thermal units availability (nuclear), thermal units heat rates and fixed and operating costs, transmission constraints, and market rules.
uWhy an iterative approach?– Model capabilities to solve joint optimization of energy dispatch
and investment decisions are not readily available.– The generation investment problem is solved separately in an
iterative approach (new entry and retirements).

January 25, 2000 13
Emissions Modeling Assumptions
uAssume a perfect competitive market for tradable permits with no transaction cost.
uAssume a cap-and-trade emission reduction program with budget constraints only (no unit or time specific constraints, and no bankability).
uThe cap-and-trade program is applied on a regional (22-state, including Northeast and Midwest) basis rather than on a state by state basis.
January 25, 2000 14
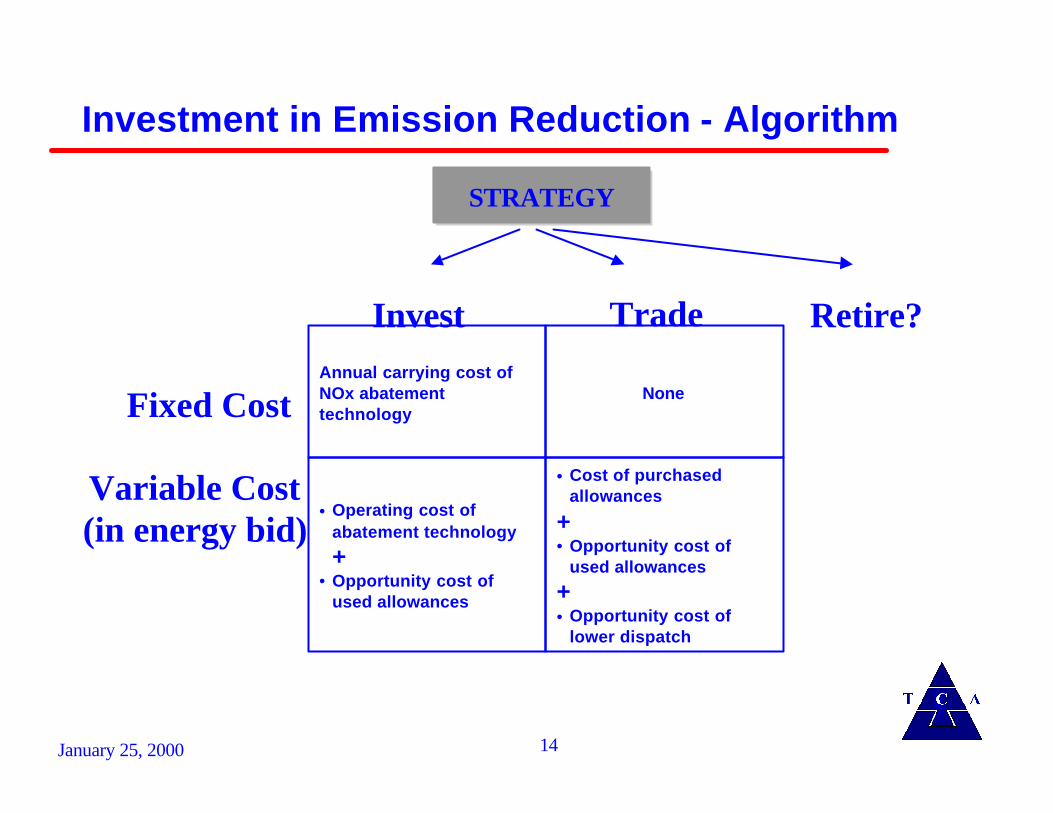
Annual carrying cost ofNOx abatementtechnology
None
• Operating cost ofabatement technology
+• Opportunity cost of
used allowances
Invest Trade
Fixed Cost
Variable Cost(in energy bid)
• Cost of purchasedallowances
+• Opportunity cost of
used allowances
+• Opportunity cost of
lower dispatch
STRATEGYSTRATEGY
Retire?
Investment in Emission Reduction - Algorithm

January 25, 2000 15
Investment in Emission Reduction - Algorithm
1. Start with least-cost dispatch ignoring environmental costs, determine units’ generation, revenues and costs.
2. Select a projected equilibrium trading allowance price, and compare the cost of trading to the cost of investing (evaluate differenttechnologies), given the performance level assumed in 1. Choose the option that results in lower costs for each evaluated unit.
3. For those units that opted to invest, add the variable O&M of the selected technology to their generation bid. For all units add the emission opportunity costs as the tradable allowance price times their emission rate (either original or post-investment).
4. Solve for least-cost dispatch with the new unit marginal costs, determine units’ generation, revenues and costs, and total NOxemissions.
5. Check to see if total emissions are within budget. If yes, stop iterations, if no, go back to 2 (increasing the projected equilibrium allowance price).

January 25, 2000 16
Application to the Northeastern and Midwest US Electricity Markets
u Under the SIP Call, states were allocated budgets based on aNOx emission rate of 0.15 lb/MMBTU and projected generation levels. The total budget for the 22 states is 544,000 tons
u We consider the SIP Call in light of the proposed and expected new entry into the generation markets in the Northeast and Midwest.
u Assumed competitive market forces improve availability of nuclear and fossil units, and reduce operation costs.
January 25, 2000 17
Impact on Northeast Markets
u Market Prices: in 2003, prices increase by up to 5% in PJM, 2-4% in NYPP and NEPOOL(relative to absence of tighter limits). However, the combined impact of environmental regulations and new entry is to reduce the prices relative to today.
u Investment cost: a very small incremental cost associated with the Nox SIP Call was estimated (around $40 Million/year), because several investments have been made as part of Phase I of MOU in the OTR.
u Capacity Profile: significant new entry helps in displacing dirtier units, and causes some retirements. The new entry significantly exceed the load growth and is more economic than many existing units.

January 25, 2000 18
Impact on Coal-Fired Generation Units
-
500
1,000
1,500
2,000
2,500
NEPOOL NYPP PJM
Hea
t In
pu
t (M
illio
ns
MM
Btu
)
1997
2003

January 25, 2000 19
Impact on Midwest Electricity Markets
u Market Prices: in 2003, prices increase by up to 15% in ECAR (relative to absence of tighter limits). However, the combined impact of environmental regulations and new entry is to reduce the prices relative to today.
u Investment cost: the cost associated with abatement technology associated with the SIP Call is significantly higher than in theNortheast, and many more units will be impacted (~$ 1 Billion/year). The reason for this higher cost is the higher portion of coal in the generation mix in the Midwest.
u Capacity Profile: significant new entry helps in displacing dirtier units, and causes some retirements. The new entry significantly exceed the load growth and is more economic than many existing units.

January 25, 2000 20
Impact of Nox Emissions Trading on ECAR Supply Curve
0
10
20
30
40
50
60
70
80
0 20000 40000 60000 80000 100000 120000
Cumulative Capacity (MW)
Pri
ce ($
/MW
h)
Steam Coal - No NOxCCs - No NOxSteam Coal - With NOxCCs - With NOx
With NOx Trading
No NOx Trading

January 25, 2000 21
Conclusions
u The above proposed formulation can be used by the industry to make informed policy decisions, and to evaluate the impact of environmental regulations on market clearing prices of electricity and the costs of emission reduction for generators.
u The impact of EPA’s NOx SIP Call on energy market-clearing prices in the Northeastern and Midwest US can be up to 5% in PJM and up to 15% in ECAR.
u The competitive entry will reduce the incremental cost associated with the NOx SIP Call.
u The analysis shows that the deregulation of the electric power markets and the environmental regulations can join hands in reducing emissions from power plants.