Leary 2001 Introduction to Behavioral Research Methods Cap 3.pdf
24
CHAPTER 3 Types of Measures Scales of Measurement The Measurement of Behavior Estimating the Validity of a Measure Fairness and Bias in Measurement Estimating the Reliability of a Measure In 1904, the French minister of public education decided that children of lower in- telligence required special education, so he hired Alfred Binet to design a proce- dure to identify children in the Paris school system who needed special attention. Binet faced a complicated task. Previous attempts to measure intelligence had been notably unsuccessful. Earlier in his career, Binet had experimented with craniome- try, which involved estimating intelligence (as well as personality characteristics) from the size and shape of people's heads. Craniometry was an accepted practice at the time, but Binet became skeptical about its usefulness as a measure of intelli- gence. Other researchers had tried using other aspects of physical appearance, such as facial features, to measure intelligence, but these also were unsuccessful. Still others had used tests of reaction time under the assumption that more intelligent people would show faster reaction times than would less intelligent people. How- ever, evidence for a link between intelligence and reaction time also was weak. Thus, Binet rejected the previous methods and set about designing a new technique for measuring intelligence. His approach involved a series of short tasks requiring basic cognitive processes such as comprehension and reasoning. For ex- ample, children would be asked to name objects, answer commonsense questions, and interpret pictures. Binet published the first version of his intelligence test in 1905 in collaboration with one of his students, Theodore Simon. When he revised the test three years later, Binet proposed a new index of intel- ligence that was based on an age level for each task on the test. The various tasks were arranged sequentially in the order in which a child of average intelligence could pass them successfully. For example, average 4-year-olds know their sex, are able to indicate which of two lines is longer, and can name familiar objects (such as a key), but cannot say how two abstract terms (such as the pair pride and pretension) 53
-
Upload
claudiu-mif -
Category
Documents
-
view
22 -
download
3
description
Psychology
Transcript of Leary 2001 Introduction to Behavioral Research Methods Cap 3.pdf
CHAPTER
3 Types of Measures
Scales of Measurement
The Measurement of Behavior
Estimating the Validity of a Measure
Fairness and Bias in Measurement
Estimating the Reliability of a Measure
In 1904, the French minister of public education decided that children of lower intelligence required special education, so he hired Alfred Binet to design a procedure to identify children in the Paris school system who needed special attention. Binet faced a complicated task. Previous attempts to measure intelligence had been notably unsuccessful. Earlier in his career, Binet had experimented with craniometry, which involved estimating intelligence (as well as personality characteristics) from the size and shape of people's heads. Craniometry was an accepted practice at the time, but Binet became skeptical about its usefulness as a measure of intelligence. Other researchers had tried using other aspects of physical appearance, such as facial features, to measure intelligence, but these also were unsuccessful. Still others had used tests of reaction time under the assumption that more intelligent people would show faster reaction times than would less intelligent people. However, evidence for a link between intelligence and reaction time also was weak.
Thus, Binet rejected the previous methods and set about designing a new technique for measuring intelligence. His approach involved a series of short tasks requiring basic cognitive processes such as comprehension and reasoning. For example, children would be asked to name objects, answer commonsense questions, and interpret pictures. Binet published the first version of his intelligence test in 1905 in collaboration with one of his students, Theodore Simon.
When he revised the test three years later, Binet proposed a new index of intelligence that was based on an age level for each task on the test. The various tasks were arranged sequentially in the order in which a child of average intelligence could pass them successfully. For example, average 4-year-olds know their sex, are able to indicate which of two lines is longer, and can name familiar objects (such as a key), but cannot say how two abstract terms (such as the pair pride and pretension)
53

54 CHAPTER 3
differ. By seeing which tasks a child could or could not complete, one could estimate the "mental age" of a child-the intellectual level at which the child is able to perform. Later, the German psychologist William Stern recommended dividing a child's mental age (as measured by Binet's test) by his or her chronological age to create the intelligence quotient, or IQ.
Binet's work provided the first useful measure of intelligence and set the stage for the widespread use of tests in psychology and education. Furthermore, it developed the measurement tools behavioral researchers needed to conduct research on intelligence, a topic that continues to attract a great deal of research attention today. Although contemporary intelligence tests continue to have their critics, the development of adequate measures was a prerequisite to the scientific study of intelligence.
All behavioral research involves the measurement of some behavioral, cognitive, emotional, or physiological response. Indeed, it would be inconceivable to conduct a study in which nothing was measured. Importantly, a particular piece of research is only as good as the measuring techniques that are used; poor measurement can doom a study. In this and the following chapters, we will look at how researchers measure behavioral and mental events by examining the types of measures that behavioral researchers commonly use, the numerical properties of such measures, and the characteristics that distinguish good measures from bad ones. In addition, we will discuss ways to develop the best possible measures for research purposes.
Types of Measures
The measures used in behavioral research fall roughly into three categories: observational measures, physiological measures, and self-reports. Observational measures involve the direct observation of behavior. Observational measures therefore can be used to measure anything an animal or person does that researchers can observe-a rat pressing a bar, eye contact between people in conversation, fidgeting by a person giving a speech, aggression in children on the playground, the time it takes a worker to complete a task. In each case, researchers observe either directly or from audio- or videotape recordings and record the participant's behavior.
Behavioral researchers who are interested in the relationship between bodily processes and behavior use physiological measures. Internal processes that are not directly observable-such as heart rate, brain activity, and hormonal changes-can be measured with sophisticated equipment. Some physiological processes, such as facial blushing and muscular reflexes, are potentially observable with the naked eye, but specialized equipment is needed to measure them accurately.
Self-report measures involve the replies people give to questionnaires and interviews. The information that self-reports provide may involve the respondent's thoughts, feelings, or behavior. Cognitive self-reports measure what people think about something. For example, a developmental psychologist may ask a child which of two chunks of clay is larger-one rolled into a ball or one formed in the

;
r·
I
I )
The Measurement of Behavior 55
shape of a hot dog. Or a survey researcher may ask people about their attitudes about a political issue. Affective self-reports involve participants' responses regarding how they feel. Many behavioral researchers are interested in emotional reactions, such as depression, anxiety, stress, grief, and happiness, and in people's evaluations of themselves and others. The most straightforward way of assessing these kinds of affective responses is to ask participants to report on them. Behavioral self-reports involve participants' reports of how they act. Participants may be asked how often they read the newspaper, go to the dentist, or have sex, for example. Similarly, many personality inventories ask participants to indicate how frequently they engage in certain behaviors.
As I noted, the success of a particular piece of research depends heavily on the quality of the measures used. Measures of behavior that are flawed in some way can distort our results and lead us to draw erroneous conclusions about the data. Because measurement is so important to the research process, an entire speciality known as psychometrics is devoted to the study of psychological measurement. Psychometricians investigate the properties of the measures used in behavioral research and work toward improving psychological measurement.
BEHAVIORAL RESEARCH CASE STUDY
Converging Operations in Measurement
Because any particular measurement procedure may provide only a rough and imperfect measure of a given construct, researchers sometimes measure a given construct in several different ways. By using several types of measures-each coming at the construct from a different angle-researchers can more accurately assess the variable of interest. When different kinds of measures provide the same results, we have more confidence in their validity. This approach to measurement is called converging operations or triangulation. (In the vernacular of navigation and land surveying, triangulation is a technique for determining the position of an object based on its relationship to three points whose positions are known.)
A case in point involves Pennebaker, Kiecolt-Glaser, and Glaser's (1988) research on the effects that writing about one's experiences has on health. On the basis of previous studies, these researchers hypothesized that people who wrote about traumatic events they had personally experienced would show an improvement in their physical health. To test this idea, they conducted an experiment in which 50 university students were instructed to write for 20 minutes a day for 4 days about either a traumatic event they had experienced (such as the death of a loved one, child abuse, rape, or intense family conflict) or superficial topics.
Rather than rely on any single measure of physical health-which is a complex and multifaceted construct-Pennebaker and his colleagues used converging operations to assess the effects of writing on participants' health. First, they obtained observational measures involving participants' visits to the university health center. Second, they used physiological measures to assess directly the functioning of participants' immune systems. Specifically, they collected samples of participants' blood three times during the study and tested the lymphocytes, or white blood cells. Third, they used self-report measures to assess how distressed participants later felt-1 hour, 6 weeks, and 3 months after the experiment.

56 CHAPTER 3
Together, these triangulating data supported the experimental hypothesis. Compared to participants who wrote about superficial topics, those who wrote about traumatic experiences visited the health center less frequently, showed better functioning of their immune systems (as indicated by the action of the lymphocytes), and reported they felt better. This and other studies by Pennebaker and his colleagues were among the first to demonstrate empirically the beneficial effects of expressing one's thoughts and feelings about troubling events (Pennebaker, 1990).
Scales of Measurement
Regardless of what kind of measure is used-observational, physiological, or selfreport-the goal of measurement is to assign numbers to participants' responses so that they can be summarized and analyzed. For example, a researcher may convert participants' marks on a questionnaire to a set of numbers (from 1 to 5, perhaps) that meaningfully represent the participants' responses. These numbers are then used to describe and analyze participants' answers.
However, in analyzing and interpreting research data, not all numbers can be treated the same way. As we'll see, some numbers used to represent participants' behaviors are, in fact, "real" numbers that can be added, subtracted, multiplied, and divided. Other numbers, however, have special characteristics and require special treatment.
Researchers distinguish between four different levels or scales of measurement. These scales of measurement differ in the degree to which the numbers being used to represent participants' behaviors correspond to the real number system. Differences between these scales of measurement are important because they have implications for what a particular number indicates about a participant and how one's data may be analyzed.
The simplest type of scale is a nominal scale. With a nominal scale, the numbers that are assigned to participants' behaviors or characteristics are essentially labels. For example, for purposes of analysis, we may assign all boys in a study the number 1 and all girls the number 2. Or we may indicate whether participants are married by designating 1 if they have never been married, 2 if they are currently married, 3 if they were previously married but are not married now, or 4 if they were married but their spouse is deceased. Numbers on a nominal scale indicate attributes of our participants, but they are labels or names rather than real numbers. Thus, it usually makes no sense to perform mathematical operations on these numbers.
An ordinal scale involves the rank ordering of a set of behaviors or characteristics, and it conveys more information than a nominal scale does. Measures that use ordinal scales tell us the relative order of our participants on a particular dimension but do not indicate the distance between participants on the dimension being measured. Imagine being at a talent contest where the winner is the contestant who receives the loudest applause. Although we might be able to rank the contestants by the applause they receive, we would find it difficult to judge precisely how much more the audience liked one contestant than another.
.r
r-/ .'
;
I i ,
r , ,

The Measurement of Behavior 57
When an interval scale of measurement is used, equal differences between the numbers reflect equal differences between participants in the characteristic being measured. On an IQ test, for example, the difference between scores of 90 and 100 (10 points) is the same as the difference between scores of 130 and 140 (10 points). However, an interval scale does not have a true zero point that indicates the absence of the quality being measured. An IQ score of 0 does not necessarily indicate that no intelligence is present, just as on the Fahrenheit thermometer (which is an interval scale), a temperature of zero degrees does not indicate the absence of temperature. Because an interval scale has no true zero point, the numbers on it cannot be multiplied or divided. It makes no sense to say that a temperature of 100 degrees is twice as hot as a temperature of 50 degrees, or that a person with an IQ of 60 is one third as intelligent as a person with an IQ of 180.
The highest level of measurement is the ratio scale. Because a ratio scale has a true zero point, ratio measurement involves real numbers that can be added, subtracted, multiplied, and divided. Many measures of physical characteristics, such as weight, are on a ratio scale. Because weight has a true zero point (indicating no weight), it makes sense to talk about 100 pounds being twice as heavy as 50 pounds.
Scales of measurement are important to researchers for two reasons. First, the measurement scale determines the amount of information provided by a particular measure. Nominal scales provide less information than ordinal, interval, or ratio scales. When asking people about their opinions, for example, simply asking whether they agree or disagree with particular statements (which is a nominal scale) does not capture as much information as an interval scale that asks how much they agree or disagree. In many cases, choice of a measurement scale is determined by the characteristic being measured; it would be difficult to measure gender on anything other than a nominal scale, for example. However, given a choice, researchers prefer to use the highest level of measurement scale possible because it will provide the most pertinent and precise information about participants' responses or characteristics.
The second important feature of scales of measurement involves the kinds of statistical analyses that can be performed on the data. Certain mathematical operations can be performed only on numbers that conform to the properties of a particular measurement scale. The more useful and powerful statistical analyses, such as t-tests and F-tests (which we'll meet in later chapters), generally require that numbers be on interval or ratio scales. As a result, researchers try to choose scales that allow them to use the most informative statistical tests.
Estimating the Reliability of a Measure
The goal of measurement is to assign numbers to behaviors, objects, or events so that they correspond in some meaningful way to the attribute we are trying to measure. Researchers want the variability in the numbers assigned to reflect, as accurately as possible, the variability in the attribute being measured. A perfect measure
58 CHAPTER 3
would be one for which the variability in the numbers provided by the measure perfectly matched the true variability in the event being assessed. But how do we know whether a particular measurement technique does, in fact, produce meaningful and useful scores that accurately reflect what we want to measure?
The first characteristic that any good measure must possess is reliability. Reliability refers to the consistency or dependability of a measuring technique. If you weigh yourself on a bathroom scale three times in a row, you expect to obtain the same weight each time. If, however, you weigh 140 pounds the first time, 108 pounds the second time, and 162 pounds the third time, then the scales are unreliable-they can't be trusted to provide consistent weights. Similarly, measures used in research must be reliable. When they aren't, we can't trust them to provide meaningful data regarding the behavior of our participants.
Measurement Error
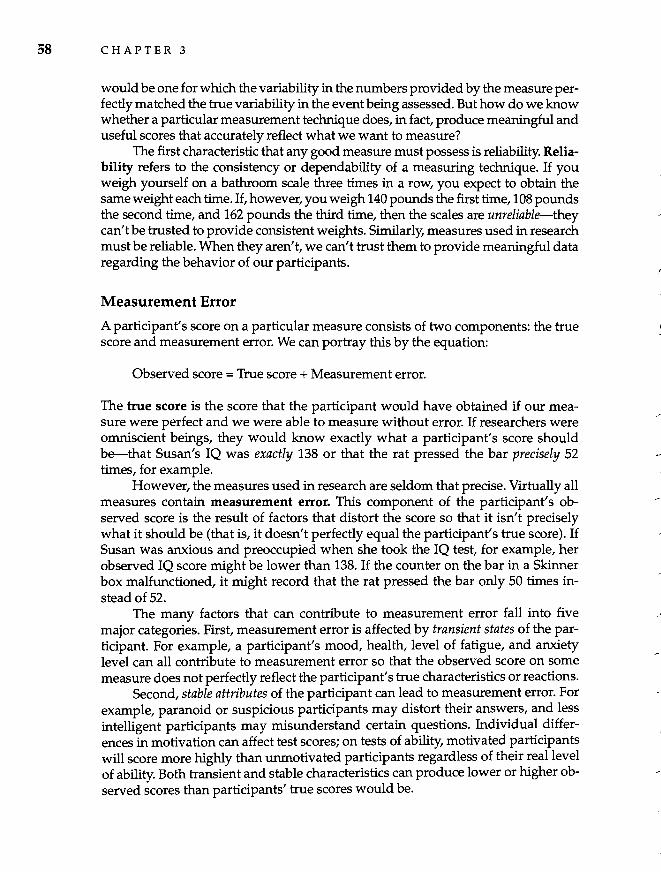
A participant's score on a particular measure consists of two components: the true score and measurement error. We can portray this by the equation:
Observed score = True score + Measurement error.
The true score is the score that the participant would have obtained if our measure were perfect and we were able to measure without error. If researchers were omniscient beings, they would know exactly what a participant's score should be-that Susan's IQ was exactly 138 or that the rat pressed the bar precisely 52 times, for example.
However, the measures used in research are seldom that precise. Virtually all measures contain measurement error. This component of the participant's observed score is the result of factors that distort the score so that it isn't precisely what it should be (that is, it doesn't perfectly equal the participant's true score). If Susan was anxious and preoccupied when she took the IQ test, for example, her observed IQ score might be lower than 138. If the counter on the bar in a Skinner box malfunctioned, it might record that the rat pressed the bar only 50 times instead of 52.
The many factors that can contribute to measurement error fall into five major categories. First, measurement error is affected by transient states of the participant. For example, a participant's mood, health, level of fatigue, and anxiety level can all contribute to measurement error so that the observed score on some measure does not perfectly reflect the participant's true characteristics or reactions.
Second, stable attributes of the participant can lead to measurement error. For example, paranoid or suspicious participants may distort their answers, and less intelligent participants may misunderstand certain questions. Individual differences in motivation can affect test scores; on tests of ability, motivated participants will score more highly than unmotivated participants regardless of their real level of ability. Both transient and stable characteristics can produce lower or higher observed scores than participants' true scores would be.
The Measurement of Behavior 59
Third, situational factors in the research setting can create measurement error. If the researcher is particularly friendly, a participant might try harder; if the researcher is stern and aloof, participants may be intimidated, angered, or unmotivated. Rough versus tender handling of experimental animals can introduce changes in their behavior. Room temperature, lighting, and crowding also can artificially affect scores.
Fourth, characteristics of the measure itself can create measurement error. For example, ambiguous questions create measurement error because they can be interpreted in more than one way. And measures that induce fatigue (such as tests that are too long) or fear (such as intrusive or painful physiological measures) also can affect scores.
Finally, actual mistakes in recording participants' responses can make the observed score different from the true score. If a researcher sneezes while counting the number of times a rat presses a bar, he may lose count; a careless researcher may write 3s that look like 5s; the person entering the data into the computer may enter a participant's score incorrectly. In each case, the observed score that is ultimately analyzed contains error.
Whatever its source, measurement error undermines the reliability of the measures researchers use. In fact, the reliability of a measure is an inverse function of measurement error: The more measurement error present in a measuring technique, the less reliable the measure is. Anything that increases measurement error decreases the consistency and dependability of the measure.
Reliability as Systematic Variance
Unfortunately, researchers never know for certain precisely how much measurement error is contained in a particular participant's score nor what the participant's true score really is. In fact, in many instances, researchers have no way of knowing for sure whether their measure is reliable and, if so, how reliable it is. However, for certain kinds of measures, researchers have ways of estimating the reliability of the measures they use. If they find that a measure is not acceptably reliable, they may take steps to increase its reliability. If the reliability cannot be increased, they may decide not to use it at all.
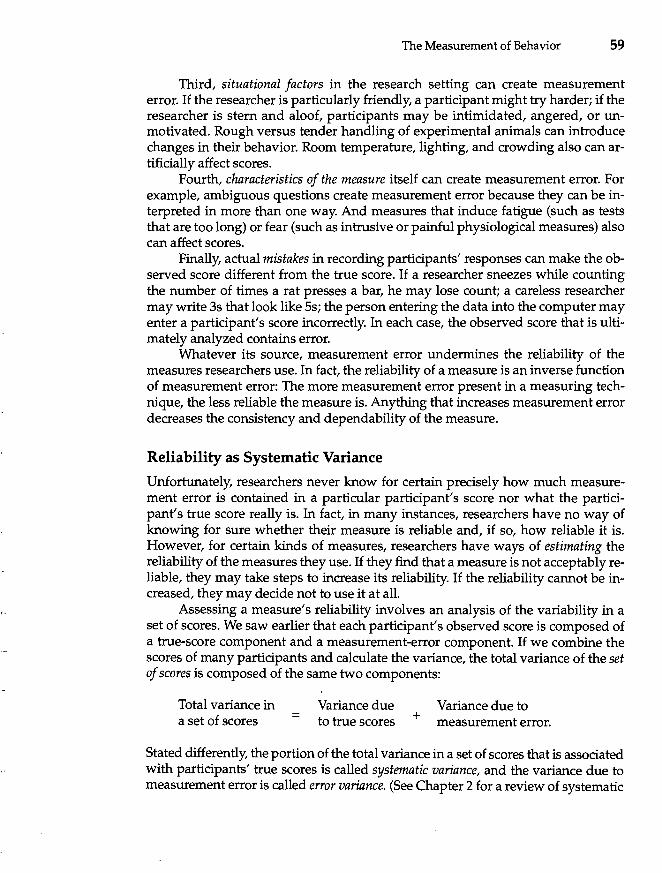
Assessing a measure's reliability involves an analysis of the variability in a set of scores. We saw earlier that each participant's observed score is composed of a true-score component and a measurement-error component. If we combine the scores of many participants and calculate the variance, the total variance of the set of scores is composed of the same two components:
Total variance in a set of scores =
Variance due to true scores +
Variance due to measurement error.
Stated differently, the portion of the total variance in a set of scores that is associated with participants' true scores is called systematic variance, and the variance due to measurement error is called error variance. (See Chapter 2 for a review of systematic

60 CHAPTER 3
and error variance.) To assess the reliability of a measure, researchers estimate the proportion of the total variance in the data that is true-score (systematic) variance versus measurement error. Specifically,
Reliability = True-score variance / Total variance.
Thus, reliability is the proportion of the total variance in a set of scores that is systematic variance associated with participants' true scores.
The reliability of a measure can range from .00 (indicating no reliability) to 1.00 (indicating perfect reliability). As the equation above shows, the reliability is .00 when none of the total variance is true-score variance. When the reliability coefficient is zero, the scores reflect nothing but measurement error, and the measure is totally worthless. At the other extreme, a reliability coefficient of 1.00 would be obtained if all of the total variance were true-score variance. A measure is perfectly reliable if there is no measurement error. As a rule of thumb, a measure is considered sufficiently reliable for research purposes if at least 50% of the total variance in scores is systematic, or true-score, variance.
Assessing Reliability
Researchers use three methods to estimate the reliability of their measures: testretest reliability, interitem reliability, and interrater reliability. All three methods are based on the same general lOgic. To the extent that two measurements of the same behavior, object, or event yield similar scores, we can assume that both measurements are tapping into the same true score. However, if two measurements of something yield very different scores, the measures must contain a high degree of measurement error. Thus, by statistically testing the degree to which the two measurements yield similar scores, we can estimate the proportion of the total variance that is systematic true-score variance versus measurement-error variance, thereby estimating the reliability of the measure.
Most estimates of reliability are obtained by examining the correlation between what are supposed to be two measures of the same behavior, attribute, or event. We'll discuss correlation in considerable detail in Chapter 6. For now, all you need to know is that a correlation coefficient is a statistic that expresses the strength of the relationship between two measures on a scale from .00 (no relationship between the two measures) to 1.00 (a perfect relationship between the two measures). Correlation coefficients can be positive, indicating a direct relationship between the measures, or negative, indicating an inverse relationship.
If we square a correlation coefficient, we obtain the proportion of the total variance in one set of scores that is systematic variance related to another set of scores. As we saw in Chapter 2, the proportion of systematic variance to total variance (that is, systematic variance/total variance) is an index of the strength of the relationship between the two variables. Thus, the higher the correlation (and its square), the more closely related are the two variables. In light of this relationship, correlation is a useful tool in estimating reliability because it reveals the degree to which two measurements yield similar scores.
/
The Measurement of Behavior 61
Test-Retest Reliability. Test-retest reliability refers to the consistency of participants' responses on a measure over time. Assuming that the characteristic being measured is relatively stable and does not change over time, participants should obtain approximately the same score each time they are measured. If a person takes an intelligence test twice, we would expect his or her two test scores to be similar. Because there is some measurement error in even well-designed tests, the scores won't be exactly the same, but they should be close.
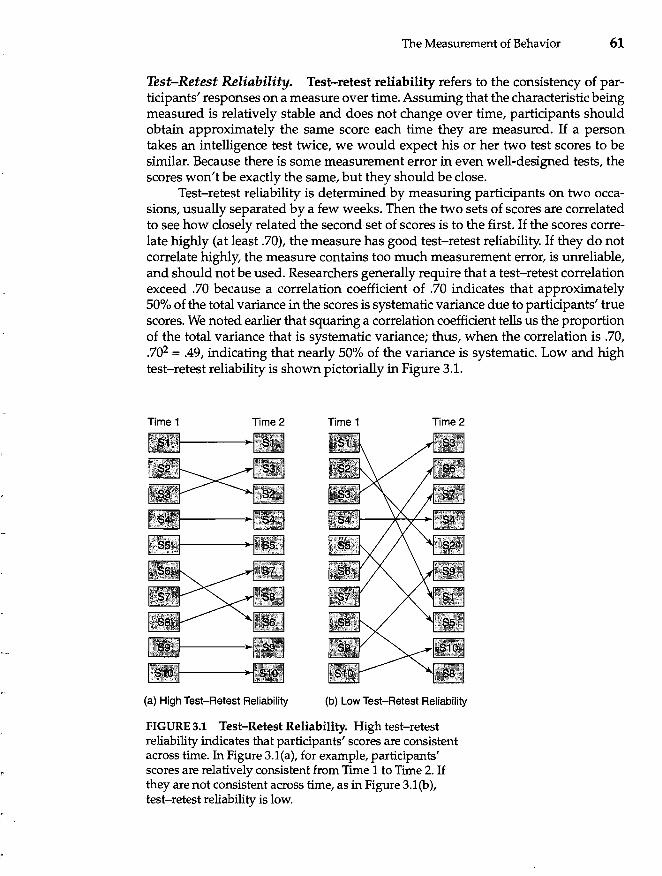
Test-retest reliability is determined by measuring participants on two occasions, usually separated by a few weeks. Then the two sets of scores are correlated to see how closely related the second set of scores is to the first. If the scores correlate highly (at least .70), the measure has good test-retest reliability. If they do not correlate highly, the measure contains too much measurement error, is unreliable, and should not be used. Researchers generally require that a test-retest correlation exceed .70 because a correlation coefficient of .70 indicates that approximately 50% of the total variance in the scores is systematic variance due to participants' true scores. We noted earlier that squaring a correlation coefficient tells us the proportion of the total variance that is systematic variance; thus, when the correlation is .70, .702 = .49, indicating that nearly 50% of the variance is systematic. Low and high test-retest reliability is shown pictorially in Figure 3.1.
Time 1 Time 2 Time 1 Time 2
(a) High Test-Retest Reliability (b) Low Test-Retest Reliability
FIGURE 3.1 Test-Retest Reliability. High test-retest reliability indicates that participants' scores are consistent across time. In Figure 3.1(a), for example, participants' scores are relatively consistent from Time 1 to Time 2. If they are not consistent across time, as in Figure 3.1(b), test-retest reliability is low.

62 CHAPTER 3
Assessing test-retest reliability makes sense only if the attribute being measured would not be expected to change between the two measurements. We would generally expect high test-retest reliability on measures of intelligence, attitudes, or personality, for example, but not on measures of hunger or fatigue.
Interitem Reliability. A second kind of reliability is relevant for measures that consist of more than one item. Interitem reliability assesses the degree of consistency among the items on a scale. Personality inventories, for example, typically consist of several questions that are summed to provide a single score that reflects the respondent's extraversion, self-esteem, shyness, or whatever. Similarly, on a scale used to measure depression, participants may be asked to rate themselves on several mood-related items (sad, unhappy, blue, helpless) that are then added together to provide a single depression score. Scores on attitude scales are also calculated by summing a respondent's responses to several questions.
When researchers sum participants' responses to several questions or items to obtain a single score, they must be sure that all of the items are tapping into the same construct (such as a particular trait, emotion, or attitude). On an inventory to measure extraversion, for example, researchers want all of the items to measure some aspect of extraversion. Including items that don't measure the construct of interest on a test increases measurement error. Researchers check to see that the items on such a scale measure the same general construct by examining interitem reliability.
Researchers examine interitem reliability by computing item-total correlations, split-half reliability, and Cronbach's alpha coefficient. First, researchers look at the item-total correlation for each question or item on the scale. Does each item correlate with the sum of all other items? If a particular item measures the same construct as the rest of the items, it should correlate with them. If not, the item only adds measurement error to the observed score and doesn't belong on the scale. Generally, the correlation between each item on a questionnaire and the sum of the other items should exceed .30.
Researchers also use split-half reliability as an index of interitem reliability. With split-half reliability, the researcher divides the items on the scale into two sets. Sometimes the first and second halves of the scale are used, sometimes the oddnumbered items form one set and even-numbered items form the other, or sometimes items are randomly put into one set or the other. Then, a total score is obtained for each set by adding the items within each set, and the correlation between these two sets of scores is then calculated. If the items on the scale hang together well and estimate the true score consistently, scores obtained on the two halves of the test should correlate highly (> .70). If the split-half correlation is small, however, it indicates that the two halves of the scale are not measuring the same thing and, thus, the total score contains a great deal of measurement error.
There is one drawback to the use of split-half reliability, however. The reliability coefficient one obtains depends on how the items are split. Using a firsthalf/ second-half split is likely to provide a slightly different estimate of reliability than an even/ odd split. What, then, is the real interitem reliability? To get around this ambiguity, researchers often use Cronbach's alpha coefficient (Cronbach,

The Measurement of Behavior 63
1970). Cronbach's alpha is equivalent to the average of all possible split-half reliabilities (although it can be calculated directly from a simple formula). As a rule of thumb, researchers consider a measure to have adequate interitem reliability if Cronbach's alpha coefficient exceeds .70. As with test-retest reliability, an alpha coefficient of greater than .70 indicates that at least 50% of the total variance in the scores on the measure is systematic, true-score variance.
!@§ 11M BEHAVIORAL RESEARCH CASE STUDY
Interitem Reliability and the Construction of Multi-Item Measures As noted, whenever researchers calculate a score by summing respondents' answers across a number of questions, they must be sure that all of the items on the scale measure the same construct. Thus, when researchers develop new multi-item measures, they use item-total correlations to help them select items for the measure. Several years ago, I decided to develop a new measure of the degree to which people tend to feel nervous in social interactions (Leary, 1983). I started this process by writing 87 self-report items (such as "I often feel nervous even in casual get-togethers," "Parties often make me feel anxious and uncomfortable," and "In general, I am a shy person"). Then, with the help of two students, these were narrowed down to what seemed to be the best 56 items. We administered those 56 items to 112 respondents, asking them to rate how characteristic or true each statement was of them on a 5-point scale (where 1 = not at all, 2 = slightly, 3 = moderately, 4 = very, and 5 = extremely). We then calculated the item-total correlation for each item-the correlation between the respondents' answers on each item and their total score on all of the other items. Because a low item-total correlation indicates that an item is not measuring what the rest of the items are measuring, we eliminated all items for which the item-total correlation was less than .40. A second sample then responded to the reduced set of items, and we looked at the item-total correlations again. Based on these correlations, we retained 15 items for the final version of our Interaction Anxiousness Scale (lAS).
To be sure that our final set of items was sufficiently reliable, we administered these 15 items to a third sample of 363 respondents. AllIS items on the scale had item-total correlations greater than .50, demonstrating that all items were measuring aspects of the same construct. Furthermore, we calculated Cronbach's alpha coefficient to examine the interitem reliability of the scale as a whole. Cronbach's alpha was .89, which exceeded the minimum criterion of .70 that most researchers use to indicate acceptable reliability. (If we square .89, we get .7921, showing that apprOximately 79% of the variance in scores on the lAS is systematic, true-score variance.)
Because social anxiety is a relatively stable characteristic, we examined the test-retest reliability of the lAS as well. Eight weeks after it had been completed the first time, the lAS was readministered to 74 of the participants from our third sample, and we correlated their scores on the two administrations. The test-retest reliability was .80, again above the desired minimum of .70. Together, these data showed us that the new measure of social anxiety was sufficiently reliable to use in research.

64 CHAPTER 3
Interrater Reliability. Interrater reliability (also called inter judge or interobserver reliability) involves the consistency among two or more researchers who observe and record participants' behavior. Obviously, when two or more observers are involved, we would like consistency to be maintained among them. If one observer records 15 bar presses and another observer records 18 bar presses, the difference between their observations represents measurement error.
For example, Gottschalk, Uliana, and Gilbert (1988) analyzed presidential debates for evidence that the candidates were cognitively impaired at the time of the debates. They coded what the candidates said during the debates using the Cognitive Impairment Scale. In their report of the study, the authors presented data to support the interrater reliability of their procedure. The reliability analysis demonstrated that the raters agreed sufficiently among themselves and that measurement error was acceptably low. (By the way, their results showed that Ronald Reagan was significantly more impaired than Jimmy Carter in 1980, or Walter Mondale in 1984, and that Reagan was more impaired during the 1984 debates than he had been 4 years earlier.)
Researchers use two general methods for assessing interrater reliability. If the raters are simply recording whether a behavior occurred, we can calculate the percentage of times they agreed. Alternatively, if the raters are rating the participants' behavior on a scale (an anxiety rating from 1 to 5, for example), we can correlate their ratings across participants. If the observers are making similar ratings, we should obtain a relatively high correlation (at least .70) between them.
Increasing the Reliability of Measures
Unfortunately, it is not always possible to assess the reliability of measures used in research. For example, if we ask a person to rate on a scale of 1 to 7 how happy he or she feels at the moment, we have no direct way of testing the reliability of the response. Test-retest reliability is inappropriate because the state we are measuring changes over time; interitem reliability is irrelevant because there is only one item; and, because others cannot observe and rate the participant's feelings of happiness, we cannot assess interrater reliability. Even though researchers assess the reliability of their measuring techniques whenever possible, the reliability of some measures cannot be determined.
In light of this, often the best a researcher can do is to make every effort to maximize the reliability of his or her measures by eliminating possible sources of measurement error. The following list offers a few ways of increasing the reliability of behavioral measures.
• Standardize administration of the measure. Ideally, every participant should be tested under precisely the same conditions. Differences in how the measure is given can contribute to measurement error. If possible, have the same researcher administer the measure to all participants in precisely the same setting.
• Clarify instructions and questions. Measurement error results when some participants do not fully understand the instructions or questions. When possible, questions to be used in interviews or questionnaires should be pilot tested to be sure they are understood properly.
The Measurement of Behavior 65
• Train observers. If participants' behavior is being observed and rated, train the observers carefully. Observers should also be given the opportunity to practice using the rating technique .
• Minimize errors in coding data. No matter how reliable a measuring technique is, error is introduced if researchers make mistakes in recording, coding, tabulating, or computing the data.
In summary, reliable measures are a prerequisite of good research. A reliable measure is one that is relatively unaffected by sources of measurement error and thus is consistent and dependable. More specifically, reliability reflects the proportion of the total variance in a set of scores that is systematic, true-score variance. The reliability of measures is estimated in three ways: test-retest reliability, interitem reliability, and interrater reliability. Even in instances in which the reliability of a technique cannot be determined, steps should be taken to minimize sources of measurement error.
Estimating the Validity of a Measure
The measures used in research not only must be reliable but also must be valid. Validity refers to the extent to which a measurement procedure actually measures what it is intended to measure rather than measuring something else (or nothing at all). Validity is the degree to which variability in participants' scores on a particular measure reflects variability in the characteristic we want to measure. Do scores on the measure relate to the behavior or attribute of interest? Are we measuring what we think we are measuring? If a researcher is interested in the effects of a new drug on obsessive-compulsive disorder, for example, the measure for obsessioncompulsion must reflect actual differences in the degree to which participants actually have the disorder. That is, to be valid, the measure must assess what it is supposed to measure.
It is important to note that a measure can be highly reliable but not valid. For example, the cranial measurements that early psychologists used to assess intelligence were very reliable. When measuring a person's skull, two researchers would arrive at similar, though not always identical, measurements-that is, interrater reliability was quite high. Skull size measurements also demonstrate high test-retest reliability; they can be recorded consistently over time with little measurement error. However, no matter how reliable skull measurements may be, they are not a valid measure of intelligence. They are not valid because they do not measure the construct of intelligence. Thus, researchers need to know whether measures are reliable as well as whether they are valid.
Assessing Validity
When researchers refer to a measure as valid, they do so in terms of a particular scientific or practical purpose. Validity is not a property of a measuring technique per se but rather an indication of the degree to which the technique measures a

66 CHAPTER 3
particular entity in a particular context. Thus, a measure may be valid for one purpose but not for another. Cranial measurements, for example, are valid measures of hat size, but they are not valid measures of intelligence. Researchers often refer to three different types of validity: face validity, construct validity, and criterion validity.
Face Validity. Face validity refers to the extent to which a measure appears to measure what it's supposed to measure. Rather than being a technical or statistical procedure, face validation involves the judgment of the researcher or of research participants. A measure has face validity if people think it does.
In general, a researcher is more likely to have faith in an instrument whose content obviously taps into the construct he or she wants to measure than in an instrument that is not face valid. Furthermore, if a measuring technique, such as a test, does not have face validity, participants, clients, job applicants, and other laypeople are likely to doubt its relevance and importance (Cronbach, 1970). In addition, they are likely to be resentful if they are affected by the results of a test whose validity they doubt. A few years ago, a national store chain paid $1.3 million dollars to job applicants who sued the company because they were required to take a test that contained bizarre personal items such as "I would like to be a florist" and "Evil spirits possess me sometimes." The items on this test were from commonly used, well-validated psychological measures, such as the Minnesota Multiphasic Personality Inventory (MMPI) and the California Personality Inventory (CPI), but they lacked face validity. Thus, all other things being equal, it is usually better to have a measure that is face valid than one that is not; it simply engenders greater confidence by the public at large.
Although face validity is often desirable, three qualifications must be kept in mind. First, just because a measure has face validity doesn't necessarily mean that it is actually valid. There are many cases of face-valid measures that do not measure what they appear to measure. For researchers of the nineteenth century, skull size measurements were a face-valid measure of intelligence.
Second, many measures that lack face validity are, in fact, valid. For example, the MMPI and CPI mentioned earlier-measures of personality that are used in practice, research, and business--<:ontain many items that are not face valid, yet scores on these measures predict various behavioral patterns and psychological problems. For example, responses indicating an interest in being a florist or believing that one is possessed by evil spirits are, when combined with responses to other items, valid indicators of certain attributes, even though these items are by no means face valid.
Third, researchers sometimes want to disguise the purpose of their tests. If they think that respondents will hesitate to answer honestly sensitive questions, they may design instruments that lack face validity and thereby conceal the purpose of the test.
Construct Validity. Much behavioral research involves the measurement of hypothetical constructs-entities that cannot be directly observed but are inferred on the basis of empirical evidence. Behavioral science abounds with hypothetical con-

The Measurement of Behavior 67
structs such as intelligence, attraction, status, schema, self-concept, moral maturity, motivation, satiation, learning, and so on. None of these entities can be observed directly, but they are hypothesized to exist on the basis of indirect evidence. In studying these kinds of constructs, researchers must use valid measures. But how does one go about validating the measure of a hypothetical (and invisible) construct?
In an important article, Cronbach and Meehl (1955) suggested that the validity of measures of hypothetical constructs can be assessed by studying the relationship between the measure of the construct and scores on other measures. We can specify what the scores on any particular measure should be related to if that measure is valid. For example, scores on a measure of self-esteem should be positively related to scores on measures of confidence and optimism, but negatively related to measures of insecurity and anxiety. Thus, we assess construct validity by seeing whether a particular measure relates as it should to other measures.
Researchers typically examine construct validity by calculating correlations between the measure they wish to validate and other measures. Because correlation coefficients describe the strength and direction of relationships between variables, they can tell us whether a particular measure is related to other measures as it should be. Sometimes we expect the correlations between one measure and measures of other constructs to be high, whereas in other instances we expect only moderate or weak relationships or none at all. Thus, unlike in the case of reliability (where we want correlations to exceed .70), no general criteria can be specified for evaluating the size of correlations when assessing construct validity. The size of each correlation coefficient must be considered relative to the correlation we would expect to find if our measure were valid and measured what it was intended to measure.
To have construct validity, a measure should both correlate with other measures that it should correlate with (convergent validity) and not correlate with measures that it should not correlate with (discriminant validity). When measures correlate highly with measures they should correlate with, we have evidence of convergent validity. When measures correlate weakly (or not at all) with conceptually unrelated measures, we have evidence of discriminant validity. Thus, we can examine the correlations between scores on a test and scores from other measures to see whether the relationships converge and diverge as predicted. In brief, evidence that the measure is related to other measures as it should be supports its construct validity.
BEHAVIORAL RESEARCH CASE STUDY
Construct Validity Earlier I described the development of a measure of social anxiety-the Interaction Anxiousness Scale-and data attesting to the scale's interitem and test-retest reliability. Before such a measure can be used, its construct validity must be assessed by seeing whether it correlates with other measures as it should. To examine the construct validity of the lAS, we determined what scores on our measure should be related to if it was a valid measure of social anxiety. Most obviously, scores on the lAS should be related to scores on existing measures

68 CHAPTER 3
of social anxiety. In addition, because feeling nervous in social encounters is related to how easily people become embarrassed (and blush), scores on the lAS ought to correlate with measures of embarrassability and blushing. Given that social anxiety arises from people's concerns with other people's perceptions and evaluations of them, lAS scores should also correlate with fear of negative evaluation. We might also expect negative correlations between lAS scores and self-esteem because people with lower self-esteem should be prone to be nervous around others. Finally, because people who often feel nervous in social situations tend to avoid them when possible, lAS scores should be negatively correlated with sociability and extraversion.
We administered the lAS and measures of these other constructs to more than 200 respondents and calculated the correlations between the lAS scores and the scores on other measures. As shown in the accompanying table, the data were consistent with all of these predictions. Scores on the lAS correlated pOSitively with measures of social distress, embarrassability, blushing propensity, and fear of negative evaluation but negatively with measures of self-esteem, SOciability, and extraversion. Together, these data supported the construct validity of the lAS as a measure of the tendency to experience social anxiety (Leary & Kowalski, 1993).
Scale Social Avoidance and Distress Embarrassability Blushing Propensity Fear of Negative Evaluation Self-Esteem Sociability Extraversion
Correlation .71 .48 .51 .44
-.36 -.39 -.47
Criterion-Related Validity. A third type of validity is criterion-related validity. Criterionarelated validity refers to the extent to which a measure allows researchers to distinguish among participants on the basis of a particular behavioral criterion. For example, do scores on the Scholastic Aptitude Test (SAT) permit us to distinguish people who will do well in college from those who will not? Do scores on the MMPI hypochondrias scale discriminate between people who do and do not show hypochondriacal patterns of behavior? Note that the issue is not one of assessing the link between the SAT or hypochondriasis and other constructs (as in construct validity) but of assessing the relationship between the measure and a relevant behavioral criterion.
Researchers distinguish between two kinds of criterion validity: concurrent and predictive validity. A measure that allows a researcher to distinguish between people at the present time is said to have concurrent validity. Sometimes we want scores on a particular measure to be related to certain behaviors right now.
Predictive validity refers to a measure's ability to distinguish between people on a relevant behavioral criterion at some time in the future. Does the mea-
(
The Measurement of Behavior 69
sure predict future behavior? For the SAT, for example, the issue is one of predictive validity. No one really cares whether high school seniors who score high on the SAT are better prepared for college than low scorers at the time they take the test (concurrent validity). Instead, college admissions officers want to know whether SAT scores predict academic performance 1 to 4 years later (predictive validity).
_ BEHAVIORAL RESEARCH CASE STUDY
Criterion-Related Validity Establishing criterion-related validity involves showing that scores on a measure are related to people's behaviors as they should be. In the case of the Interaction Anxiousness Scale described earlier, scores on the lAS should be related to people's reactions in real social situations. For example, as a measure of the general tendency to feel socially anxious, scores on the lAS should be correlated with how nervous people feel in actual interpersonal encounters. In several laboratory studies, participants completed the lAS, then interacted with another individual. Participants' reported feelings of anxiety before and during these interactions correlated with lAS scores as expected. Furthermore, lAS scores correlated with how nervous the participants were judged to be by people who observed them during these interactions.
We also asked participants who completed the lAS to keep track of all social interactions they had that lasted more than 10 minutes for about a week. For each interaction, they completed a brief questionnaire that assessed, among other things, how nervous they felt. Not only did participants' scores on the lAS correlate with how nervous they felt in everyday interactions, but participants who scored high on the lAS had fewer interactions with people whom they did not know well (presumably because they were uncomfortable in interactions with people who were unfamiliar) than did people who scored low on the lAS. These data showed that scores on the lAS related to people's real reactions and behaviors as they should, thereby supporting the criterion-validity of the scale.
Criterion-related validity is often of interest to researchers in applied research settings. In educational research, for example, researchers are often interested in the degree to which tests predict academic performance. Similarly, before using tests to select new employees, personnel psychologists must demonstrate that the tests successfully predict future on-the-job performance-that is, that they possess predictive validity.
!!W!tti'k11!1!Ell IN DEPTH
The Reliability and Validity of College Admission Exams Most colleges and universities use applicants' scores on one or more entrance examinations as one criterion for making admissions decisions. By far the most frequently used exam for this purpose is the Scholastic Aptitude Test (SAT), developed by the Educational Testing Service.

70 CHAPTER 3
Many students are skeptical of the SAT and similar exams. Many claim, for example, that they don't perform well on standardized tests and that their scores indicate little, if anything, about their ability to do well in college. No doubt, there are many people for whom the SAT does not predict performance well. Like all tests, the SAT contains measurement error and thus underestimates and overestimates some people's true aptitude scores. (Interestingly, I've never heard anyone derogate the SAT because they scored higher than they should have. From a statistical perspective, measurement error should lead as many people to obtain scores that are higher than their true ability as to obtain scores lower than their ability.) However, a large amount of data attests to the overall reliability and validity of the SAT. The psychometric data regarding the SAT are extensive, based on tens of thousands of scores over a span of many years.
The reliability of the SAT is impressive in comparison with most psychological tests. The SAT possesses high test-retest reliability as well as high interitem reliability. Reliability coefficients average around .90 (Kaplan, 1982), easily exceeding the standard criterion of .70. In fact, over 80% of the total variance in SAT scores is systematic, true-score variance.
In the case of the SAT, predictive validity is of paramount importance. Many studies have examined the relationship between SAT scores and college grades. These studies have shown that the criterion-related validity of the SAT depends, in part, on one's major in college; SAT scores predict college performance better for some majors than for others. In general, however, the predictive validity of the SAT is fairly good. On the average, about 16% of the total variance in first-year college grades is systematic variance accounted for by SAT scores (Kaplan, 1982). Sixteen percent may not sound like a great deal until one considers all of the other factors that contribute to variability in college grades, such as motivation, health, personal problems, the difficulty of one's courses, the academic ability of the student body, and so on. Given everything that affects performance in college, it is not too surprising that a single test score does not predict with greater accuracy.
Of course, most colleges and universities also use criteria other than entrance exams in the admissions decision. The Educational Testing Service advises admissions offices to consider high school grades, activities, and awards, as well as SAT scores, for example. Using these other criteria further increases the validity of the selection process.
This is not to suggest that the SAT and other college entrance exams are infallible or that certain people do not obtain inflated or deflated scores. But such tests are not as unreliable or invalid as many students suppose.
To sum up, validity refers to the degree to which a measuring technique measures what it's intended to measure. Although face-valid measures are often desirable, construct and criterion-related validity are much more important. Construct validity is assessed by seeing whether scores on a measure are related to other measures as they should be. A measure has criterion-related validity if it correctly distinguishes between people on the basis of a relevant behavioral criterion either at present (concurrent validity) or in the future (predictive validity).
I I

The Measurement of Behavior 71
Fairness and Bias in Measurement
In recent years, a great deal of public attention and scientific research has been devoted to the possibility that certain psychological and educational measures, particularly tests of intelligence and academic ability, are biased against certain groups of individuals. Test bias occurs when a particular meaSUre is not equally valid for everyone who takes the test. That is, if test scores more accurately reflect the true ability or characteristics of one group than another, the test is biased.
Identifying test bias is difficult. Simply showing that a certain gender, racial, or ethnic group performs worse on a test than other groups does not necessarily indicate that the test is unfair. The observed difference in scores may reflect a true difference between the groups in the attribute being measured. Bias exists only if groups that do not differ on the attribute or ability being measured obtain different scores on the test.
Bias can creep into psychological measures in very subtle ways. For example, test questions sometimes refer to objects or experiences that are mOre familiar to members of one group than to those of another. If those objects or experiences are not relevant to the attribute being measured (but rather are being used only as examples), some individuals may be unfairly disadvantaged. Consider, for example, this sample analogy from the SAT:
STRAWBERRY:RED (A) peach:ripe (D) orange:round
(B) leather:brown (E) lemon:yellow
(C) grass:green
The correct answer is (E) because a strawberry is a fruit that is red, and a lemon is a fruit that is yellow. However, statistical analyses showed that Hispanic test takers missed this particular item notably more often than members of other groups. Further investigation suggested that the difference occurred because some Hispanic test takers were familiar with green rather than yellow lemons. As a result, they chose grass:green as the analogy to strawberry:red, a very reasonable response for an individual who does not associate lemons with the color yellow ("What's the DIP?," 1999). Along the same lines, a geometry question on a standardized test was identified as biased when it became clear that women missed it mOre often than did men because it referred to the dimensions of a football field. In these two cases, the attributes being measured (analogical reasoning and knowledge about geometry) had nothing to do with one's experience with yellow lemons or football, yet those experiences led some test takers to perform better than others.
Test bias is hard to demonstrate because it is often difficult to determine whether the groups truly differ on the attribute in question. One way to document the presence of bias is to examine the predictive validity of a measure separately for different groups. A biased test will predict future outcomes better for one group than another. For example, imagine that we find that Group X performs worse on

72 CHAPTER 3
the SAT than Group Y. Does this difference reflect test bias or is Group X actually less well prepared for college than Group Y? By using SAT scores to predict how well Group X and Group Y subsequently perform in college, we can see whether the SAT predicts college grades equally well for the two groups (that is, whether the SAT has predictive validity for both groups). If it does, the test is probably not biased even though the groups perform differently on it. However, if SAT scores prediet college performance less accurately for Group X than Group Y-that is, if the predictive validity of the SAT is worse for Group X-then the test is likely biased.
Test developers often examine individual test items for evidence of bias. One method of doing this involves matching groups of test takers on their total test scores, then seeing whether the groups performed comparably on particular test questions. The rationale is that if test takers have the same overall knowledge or ability, then on average they should perform similarly on individual questions regardless of their sex, race, or ethnicity. So, for example, we might take all individuals who score between 500 and 600 on the verbal section of the SAT and compare
An Example of a Biased Test
Source: © 2000 by Sidney Harris.
.. ",,-
--
The Measurement of Behavior 73
how different groups performed on the strawberry:red analogy described earlier. If the item is unbiased, an approximately equal proportion of each group should get the analogy correct. However, if the item is biased, we would find that a disproportionate number of one group got it "wrong."
All researchers and test developers have difficulty setting aside their own experiences and biases. However, they must make every effort to reduce the impact of their biases on the measures they develop. By collaborating with investigators of other genders, races, ethnic groups, and cultural backgrounds, potential sources of bias can be identified as tests are constructed. And by applying their understanding of validity, they can work together to identify biases that do creep into their measures.
Summary
1. Measurement lies at the heart of all research. Behavioral researchers have a wide array of measures at their disposal, including observational, physiological, and self-report measures. Psychometrics is a specialty devoted to the study and improvement of psychological tests and other measures.
2. Because no measure is perfect, researchers sometimes use several different measures of the same variable, a practice known as converging operations (or triangulation).
3. Whatever types of measure they use, researchers must consider whether the measure is on a nominal, ordinal, interval, or ratio scale of measurement. A measure's scale of measurement has implications for the kind of information that the instrument provides, as well as for the statistical analyses that can be performed on the data.
4. Reliability refers to the consistency or dependability of a measuring technique. Three types of reliability can be assessed: test-retest reliability (consistency of the measure across time), interitem reliability (consistency among a set of items intended to assess the same construct), and interrater reliability (consistency between two or more researchers who have observed and recorded the participant's behavior).
5. All observed scores consist of two components-the true score and measurement error. The true-score component reflects the score that would have been obtained if the measure were perfect; measurement error reflects the effects of factors that make the observed score lower or higher than it should be. The more measurement error, the less reliable the measure.
6. Factors that increase measurement error include transient states (such as mood, fatigue, health), stable personality characteristics, situational factors, the measure itself, and researcher mistakes.
7. A correlation coefficient is a statistic that expresses the direction and strength of the relationship between two variables.
8. Reliability is tested by examining correlations between (a) two administrations of the same measure (test-retest), (b) items on a questionnaire (interitem), or (c) the ratings of two or more observers (interrater).

74 CHAPTER 3
9. Reliability can be enhanced by standardizing the administration of the measure, clarifying instructions and questions, training observers, and minimizing errors in coding and analyzing data.
10. Validity refers to the extent to which a measurement procedure measures what it's intended to measure.
11. Three types of validity were discussed: face validity (does the measure appear to measure the construct of interest?), construct validity (does the measure correlate with measures of other constructs as it should?), and criterion-related validity (does the measure correlate with measures of current or future behavior as it should?).
12. Test bias occurs when scores on a test reflect the true ability or characteristics of one group of test takers more accurately than the ability or characteristics of another group-that is, when validity is better for one group than another.
KEY TERMS
concurrent validity (p. 68) construct validity (p. 67) convergent validity (p. 67) converging operations (p. 55) correlation coefficient (p. 60) criterion-related validity
(p.68) Cronbach's alpha coefficient
(p.62) discriminant validity (p. 67) face validity (p. 66)
hypothetical construct (p. 66) interitem reliability (p. 62) interrater reliability (p. 64) interval scale (p. 57) item-total correlation (p. 62) measurement error (p. 58) nominal scale (p. 56) observational measure (p. 54) ordinal scale (p. 56) physiological measure (p. 54) predictive validity (p. 68)
QUESTIONS FOR REVIEW
psychometrics(p.55) ratio scale (p. 57) reliability (p. 58) scales of measurement (p. 56) self-report measure (p. 54) split-half reliability (p. 62) test bias (p. 71) test-retest reliability (p. 61) true score (p. 58) validity (p. 65)
1. Distinguish among observational, physiological, and self-report measures.
2. What do researchers interested in psychometrics study?
3. Why do researchers use converging operations?
4. Distinguish among nominal, ordinal, interval, and ratio scales of measurement. Why do researchers prefer to use measures that are on interval and ratio scales when possible?
5. Why must researchers use reliable measures?
6. Why is it virtually impossible to eliminate all measurement error from the measures we use in research?
7. What is the relationship between the reliability of a measure and the degree of measurement error it contains?

; I
)
/
, i
The Measurement of Behavior 75
8. What does the reliability coefficient of a measure indicate if it is .60? .OO? 1.00?
9. What does a correlation coefficient tell us? Why are correlation coefficients useful when assessing reliability?
10. What are the three ways in which researchers assess the reliability of their measures? Be sure that you understand the differences among these three approaches to reliability.
11. What is the minimum reliability coefficient that researchers consider acceptable? Why do researchers use this minimum criterion for reliability?
12. For what kind of measure is it appropriate to examine test-retest reliability? In-teritem reliability? Interrater reliability?
13. What value of Cronbach's alpha coefficient indicates acceptable interitem reliability?
14. Why are researchers sometimes not able to test the reliability of their measures?
15. What steps can be taken to increase the reliability of measuring techniques?
16. What is validity?
17. Distinguish between face validity, construct validity, and criterion-related validity. In general, which kind of validity is least important to researchers?
18. Can a measurement procedure be valid but not reliable? Reliable but not valid? Explain.
19. Distinguish between construct and criterion-related validity.
20. Distinguish between convergent and discriminant validity. Do these terms refer to types of construct validity or criterion-related validity?
21. Distinguish between concurrent and predictive validity. Do these terms refer to types of construct validity or criterion-related validity?
22. How can we tell whether a particular measure is biased against a particular group?
23. How do researchers identify biased test items on tests of intelligence or ability?
QUESTIONS FOR DISCUSSION
1. Many students experience a great deal of anxiety whenever they take tests. Imagine that you conduct a study of test anxiety in which participants take tests and their reactions are measured. Suggest how you would apply the idea of converging operations using observational, physiological, and self-report measures to measure test anxiety in such a study.
2. For each measure listed below, indicate whether it is measured on a nominal, ordinal, interval, or ratio scale of measurement. a. body temperature b. sexual orientation c. the number of times that a baby smiles in 5 minutes d. the order in which 150 runners finish a race

76 CHAPTER 3
e. the number of books on a professor's shelf f. ratings of happiness on a scale from 1 to 7 g. religious preference
3. If the measures used in research had no measurement error whatsoever, would researchers obtain weaker or stronger findings in their studies? (This one may require some thought.)
G Hypochondriacs are obsessed with their health, talk a great deal about their real and imagined health problems, and visit their physician frequently. Imagine that you developed an 8-item self-report measure of hypochondriacal tendencies. Tell how you would examine the (a) test-retest reliability and (b) interitem reliability of your measure.
C9 Imagine that the test-retest reliability of your hypochondriasis scale was .50, and Cronbach's alpha coefficient was .62. Comment on the reliability of your scale.
@ Now explain how you would test the validity of your hypochondriasis scale. Discuss how you would examine both construct validity and criterion-related validity.
I7.l Imagine that you calculated the item-total correlations for the eight items on your \ U scale and obtained the correlations:
Item 1 .42 ltem2 .50 ltem3 .14 ltem4.45
itemS .37 Item 6 -.21 ltem7 .30 ltem8 .00
Discuss these item-total correlations, focusing on whether any of the items on the scale are problematic.
(j) Some scientists in the physical sciences (such as physics and chemistry) argue that . hypothetical constructs are not scientific because they cannot be observed directly.
Do you agree or disagree with this position? Why?
f9\, Imagine that we found that women scored significantly lower than men on a par"-;I ticular test. Would you conclude that the test was biased against women? Why or
why not?
10. Imagine that you want to know whether the SAT is biased against Group X and in favor of Group Y. You administer the SAT to members of the two groups; then, 4 years later, you examine the correlations between SAT scores and college grade point average (GPA) for the two groups. You find that SAT scores correlate .45 with GPAfor both Group X and Group Y. Would you conclude that the test was biased? Explain.
r' I
/


![Timothy leary neurocomic [german deutsch]](https://static.fdocuments.us/doc/165x107/568bd57a1a28ab2034989a55/timothy-leary-neurocomic-german-deutsch.jpg)